Refine search
Actions for selected content:
47842 results in Zoology
Twenty four-hour passive heat and cold exposures did not modify energy intake and appetite but strongly modify food reward
-
- Journal:
- British Journal of Nutrition / Volume 132 / Issue 2 / 28 July 2024
- Published online by Cambridge University Press:
- 18 April 2024, pp. 209-226
- Print publication:
- 28 July 2024
-
- Article
-
- You have access
- Open access
- HTML
- Export citation
Curcumin effects on age-related changes in oral immunity: an in vivo study
-
- Journal:
- British Journal of Nutrition / Volume 132 / Issue 1 / 14 July 2024
- Published online by Cambridge University Press:
- 18 April 2024, pp. 31-39
- Print publication:
- 14 July 2024
-
- Article
-
- You have access
- HTML
- Export citation
Effectiveness of Global Leadership Initiative on Malnutrition and Subjective Global Assessment for diagnosing malnutrition and predicting wound healing in patients with diabetic foot ulcers
-
- Journal:
- British Journal of Nutrition / Volume 132 / Issue 1 / 14 July 2024
- Published online by Cambridge University Press:
- 18 April 2024, pp. 21-30
- Print publication:
- 14 July 2024
-
- Article
-
- You have access
- HTML
- Export citation
Building nutritionally meaningful classification for grocery product groups: the LoCard Food Classification process
-
- Journal:
- British Journal of Nutrition / Volume 132 / Issue 6 / 28 September 2024
- Published online by Cambridge University Press:
- 18 April 2024, pp. 770-781
- Print publication:
- 28 September 2024
-
- Article
-
- You have access
- Open access
- HTML
- Export citation
Preconception diet in adolescence and its association with hypertensive disorders of pregnancy and preterm birth. Results from the HUNT study
-
- Journal:
- British Journal of Nutrition / Volume 132 / Issue 1 / 14 July 2024
- Published online by Cambridge University Press:
- 18 April 2024, pp. 91-98
- Print publication:
- 14 July 2024
-
- Article
-
- You have access
- Open access
- HTML
- Export citation
Vitamin D status of pregnant women with obesity in the UK and its association with pregnancy outcomes: a secondary analysis of the UK Pregnancies Better Eating and Activity Trial (UPBEAT) study
-
- Journal:
- British Journal of Nutrition / Volume 132 / Issue 1 / 14 July 2024
- Published online by Cambridge University Press:
- 18 April 2024, pp. 40-49
- Print publication:
- 14 July 2024
-
- Article
-
- You have access
- HTML
- Export citation
The equitable impact of sugary drink taxation structures on sugary drink consumption among Canadians: a modelling study using the 2015 Canadian Community Health Survey-Nutrition
-
- Journal:
- Public Health Nutrition / Volume 27 / Issue 1 / 2024
- Published online by Cambridge University Press:
- 15 April 2024, e121
-
- Article
-
- You have access
- Open access
- HTML
- Export citation
Comparisons between dual-energy X-ray absorptiometry and bioimpedance devices for appendicular lean mass and muscle quality in Hispanic adults
-
- Journal:
- British Journal of Nutrition / Volume 131 / Issue 12 / 28 June 2024
- Published online by Cambridge University Press:
- 15 April 2024, pp. 2031-2038
- Print publication:
- 28 June 2024
-
- Article
-
- You have access
- Open access
- HTML
- Export citation
Validating nutrient selection for product-group-specific nutrient indices for use as functional units in life cycle assessment of foods
-
- Journal:
- British Journal of Nutrition / Volume 131 / Issue 12 / 28 June 2024
- Published online by Cambridge University Press:
- 12 April 2024, pp. 2049-2057
- Print publication:
- 28 June 2024
-
- Article
-
- You have access
- Open access
- HTML
- Export citation
Food insecurity and perinatal depression among pregnant women in BUNMAP cohort in Ethiopia: a structural equation modelling
-
- Journal:
- Public Health Nutrition / Volume 27 / Issue 1 / 2024
- Published online by Cambridge University Press:
- 12 April 2024, e120
-
- Article
-
- You have access
- Open access
- HTML
- Export citation
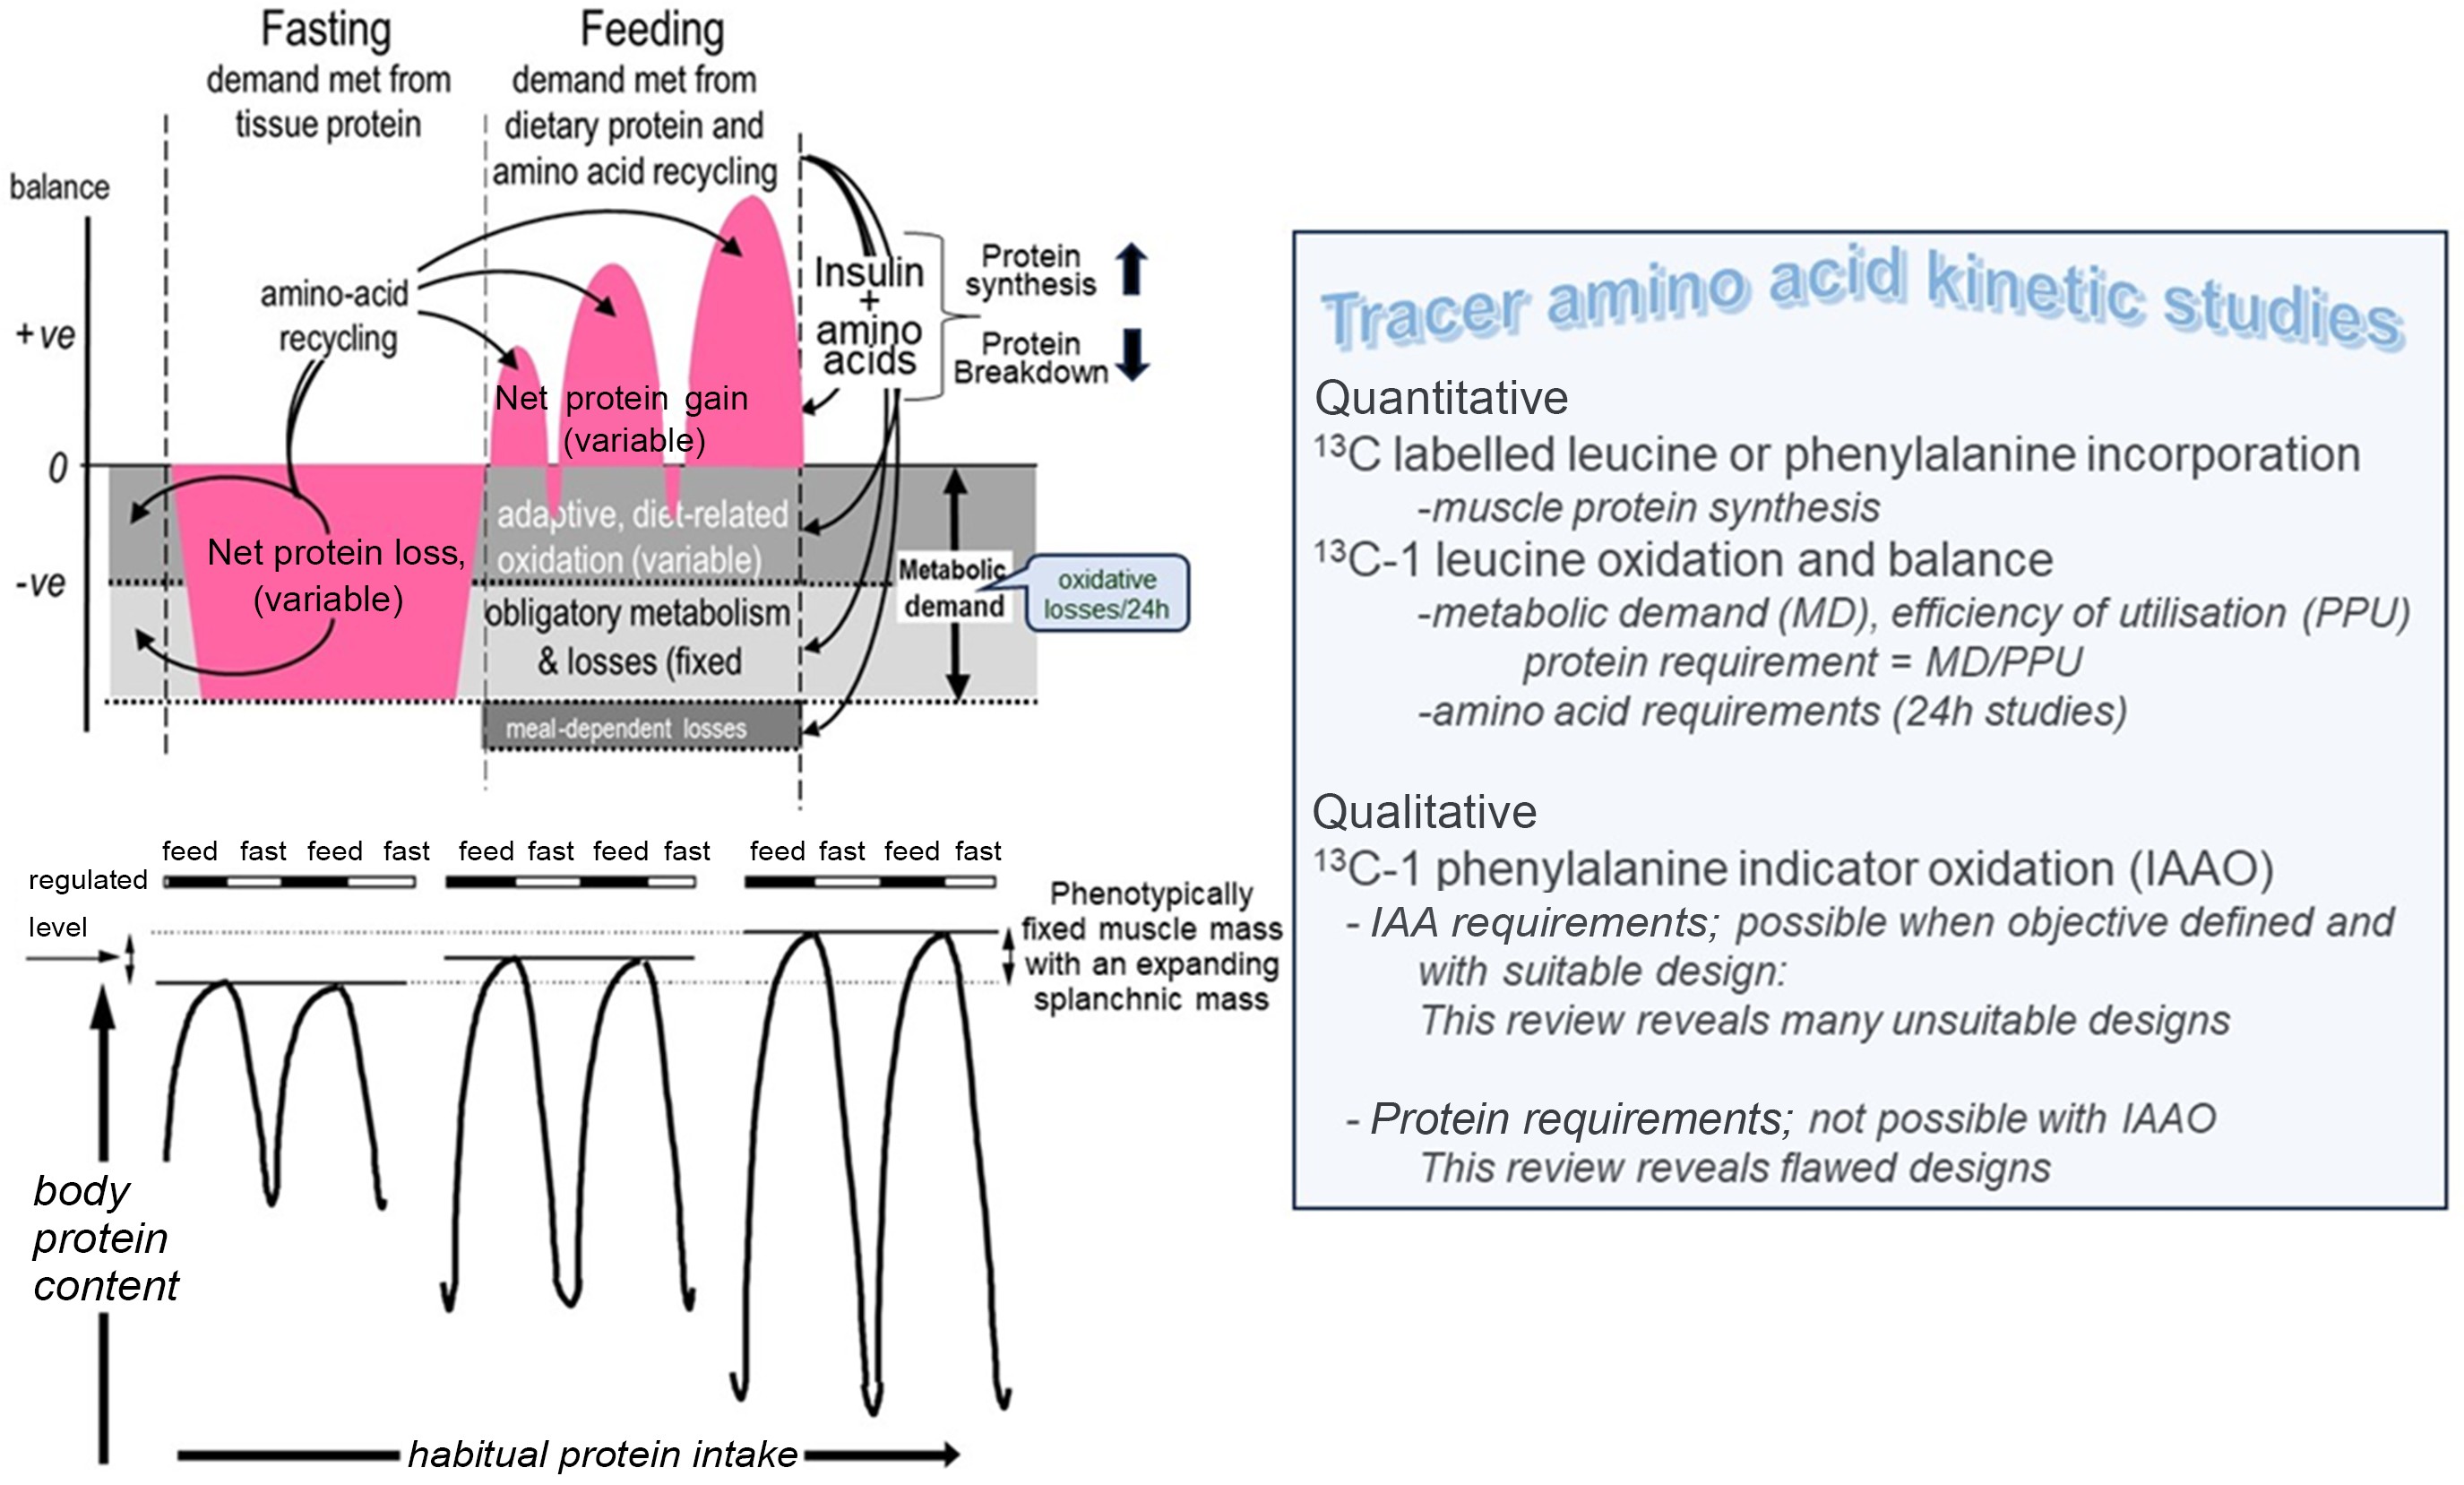
Post-prandial tracer studies of protein and amino acid utilisation: what can they tell us about human amino acid and protein requirements?
-
- Journal:
- British Journal of Nutrition / Volume 131 / Issue 12 / 28 June 2024
- Published online by Cambridge University Press:
- 12 April 2024, pp. 2005-2030
- Print publication:
- 28 June 2024
-
- Article
-
- You have access
- Open access
- HTML
- Export citation
Enhancing selection of alcohol consumption-associated genes by random forest
-
- Journal:
- British Journal of Nutrition / Volume 131 / Issue 12 / 28 June 2024
- Published online by Cambridge University Press:
- 12 April 2024, pp. 2058-2067
- Print publication:
- 28 June 2024
-
- Article
-
- You have access
- HTML
- Export citation
Effect of different doses of camelina cake inclusion as a substitute of dietary soyabean meal on growth performance and gut health of weaned pigs
-
- Journal:
- British Journal of Nutrition / Volume 131 / Issue 12 / 28 June 2024
- Published online by Cambridge University Press:
- 12 April 2024, pp. 1962-1974
- Print publication:
- 28 June 2024
-
- Article
-
- You have access
- Open access
- HTML
- Export citation
Association between abdominal obesity and depressive symptoms in Peruvian women aged 18–49 years: a sub-analysis of the Demographic and Family Health Survey 2018–2019
-
- Journal:
- Public Health Nutrition / Volume 27 / Issue 1 / 2024
- Published online by Cambridge University Press:
- 12 April 2024, e114
-
- Article
-
- You have access
- Open access
- HTML
- Export citation
An overview about nutritional status of childbearing age women, children and adolescents, living in rural areas of Madagascar: preliminary results of the Tany Vao project – CORRIGENDUM
-
- Journal:
- Public Health Nutrition / Volume 27 / Issue 1 / 2024
- Published online by Cambridge University Press:
- 11 April 2024, e102
-
- Article
-
- You have access
- Open access
- HTML
- Export citation
Trends (2014–2018) in the healthiness of packaged food purchases of Australian consumers before and after the introduction of voluntary Health Star Rating nutrition labels
-
- Journal:
- Public Health Nutrition / Volume 27 / Issue 1 / 2024
- Published online by Cambridge University Press:
- 11 April 2024, e144
-
- Article
-
- You have access
- Open access
- HTML
- Export citation
The assessment of dietary carotenoid intake of the Cardio-Med FFQ using food records and biomarkers in an Australian cardiology cohort: a pilot validation
-
- Journal:
- Journal of Nutritional Science / Volume 13 / 2024
- Published online by Cambridge University Press:
- 11 April 2024, e20
-
- Article
-
- You have access
- Open access
- HTML
- Export citation
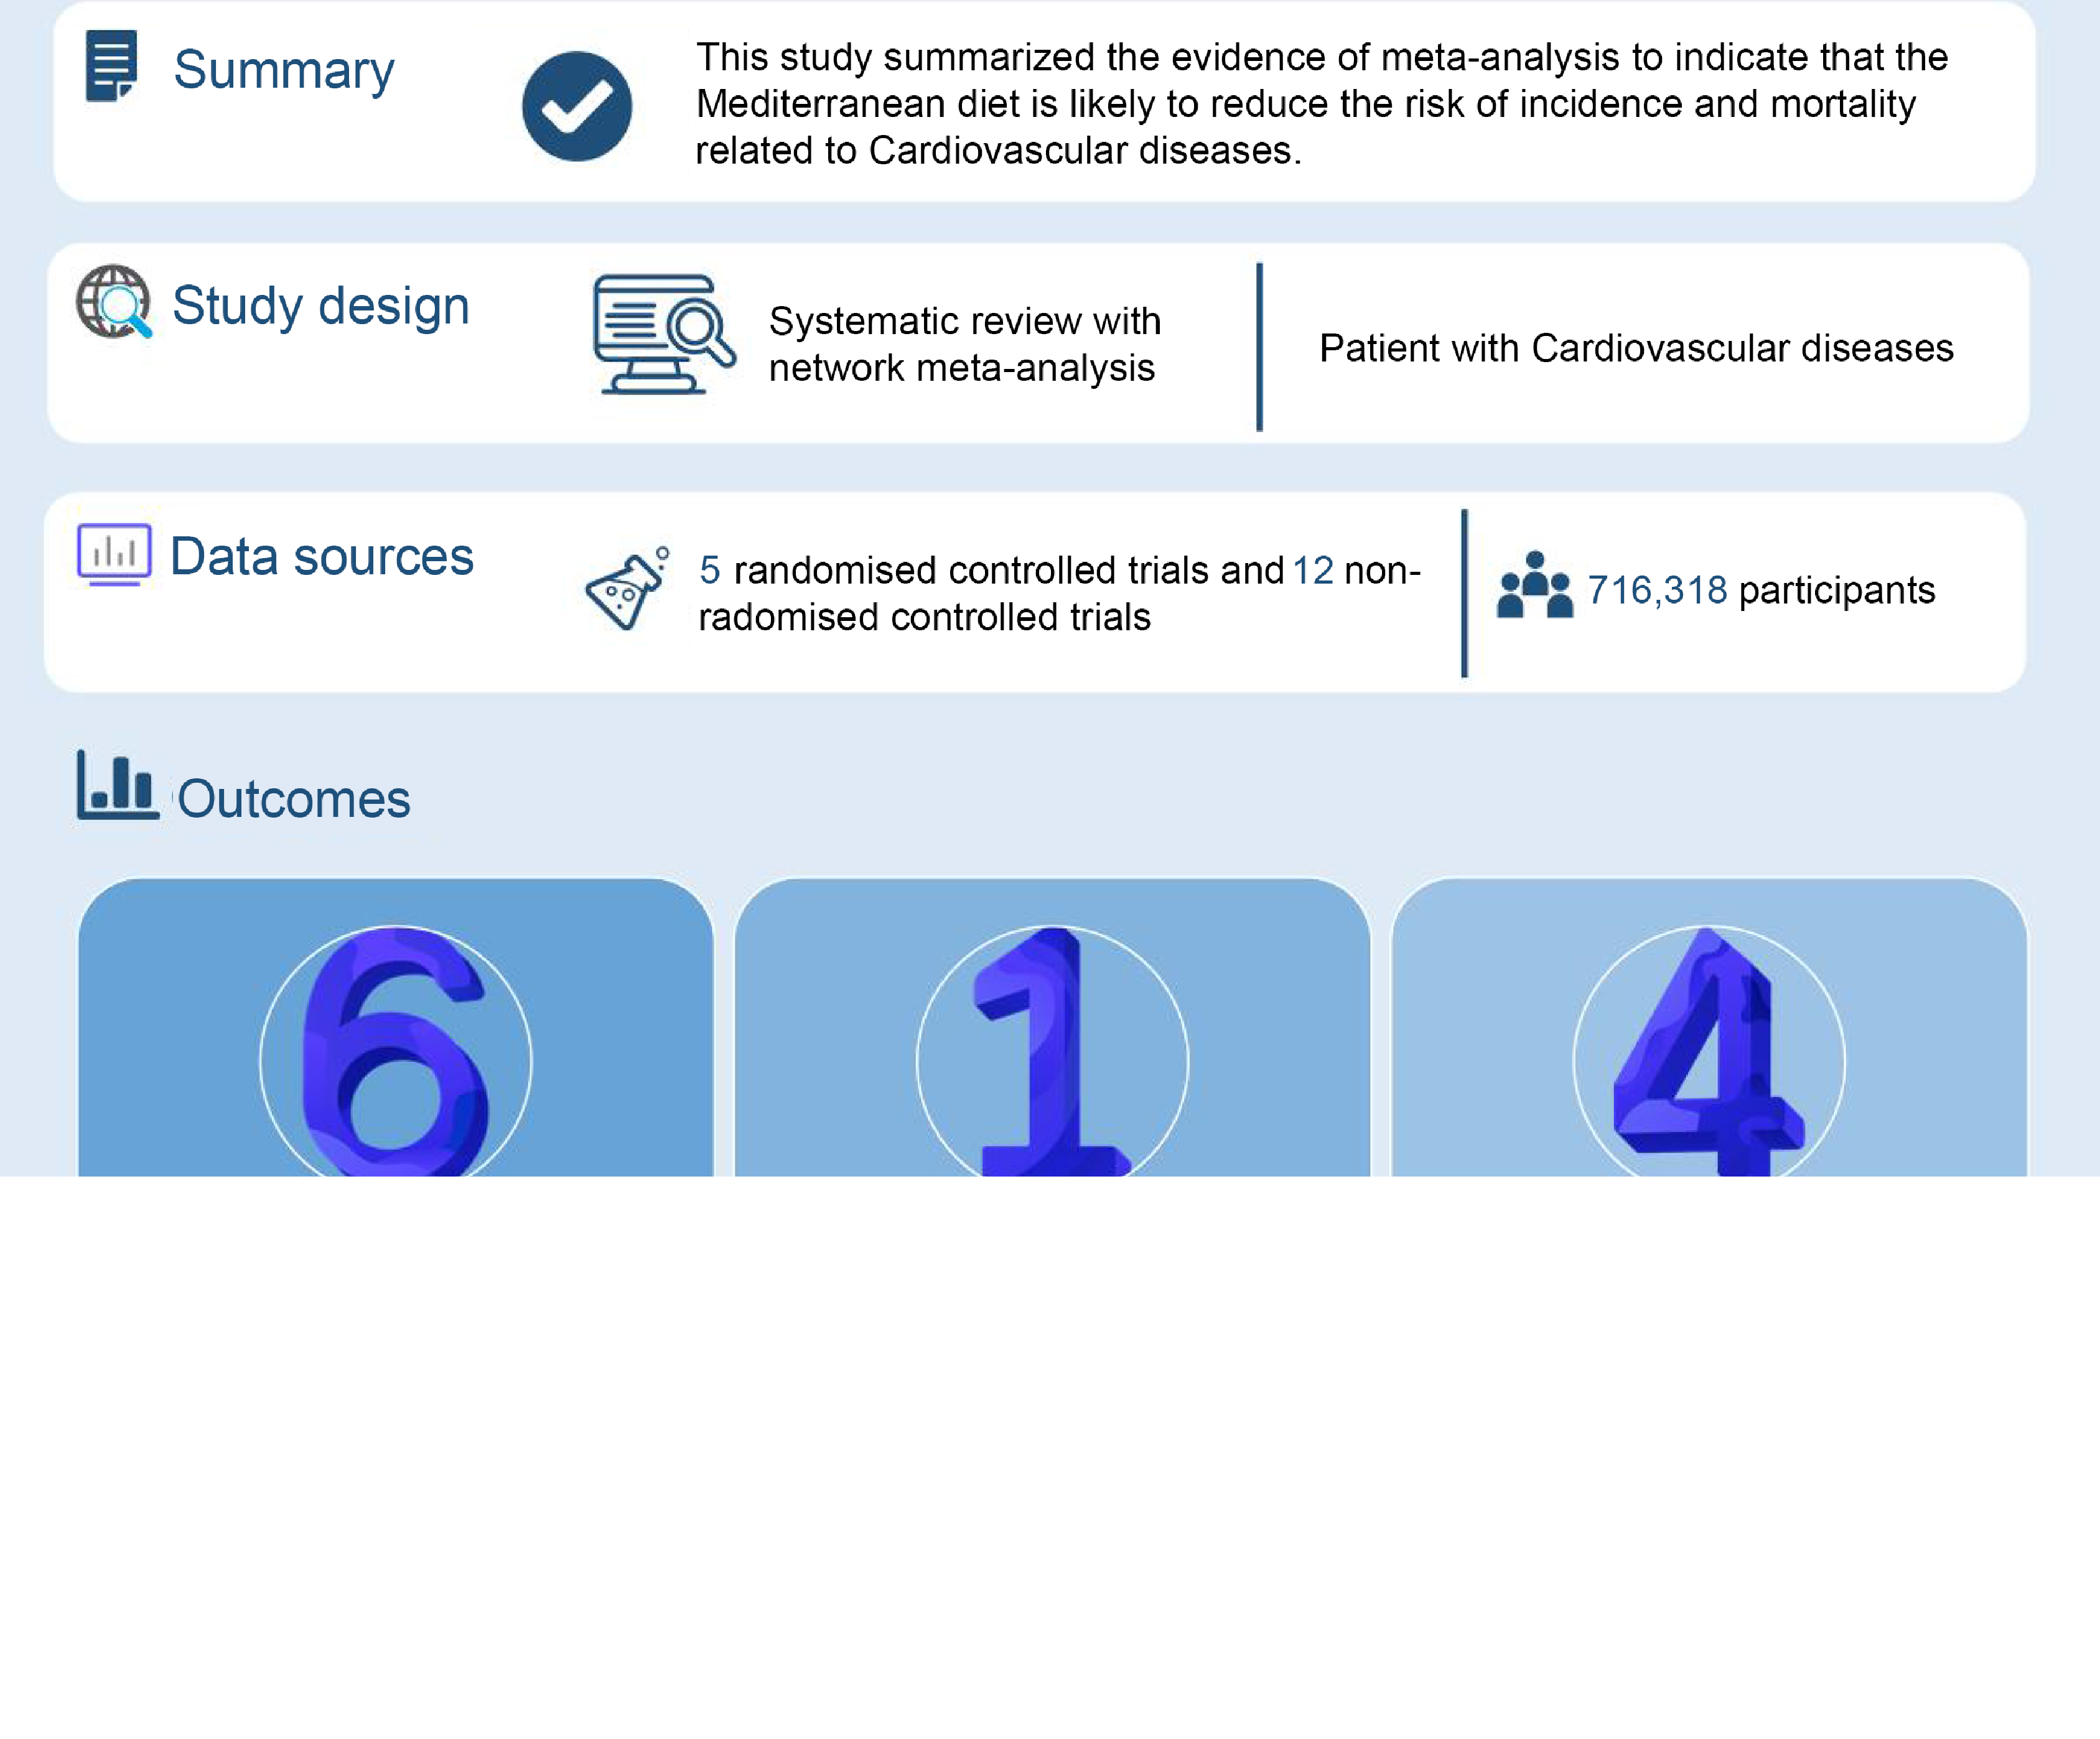
Mediterranean diet for cardiovascular disease: an evidence mapping study
-
- Journal:
- Public Health Nutrition / Volume 27 / Issue 1 / 2024
- Published online by Cambridge University Press:
- 11 April 2024, e118
-
- Article
-
- You have access
- Open access
- HTML
- Export citation
Longitudinal association between soft drink consumption and handgrip strength in adults: a prospective analysis from the Tianjin Chronic Low-Grade Systemic Inflammation and Health (TCLSIH) cohort study
-
- Journal:
- British Journal of Nutrition / Volume 131 / Issue 12 / 28 June 2024
- Published online by Cambridge University Press:
- 11 April 2024, pp. 1997-2004
- Print publication:
- 28 June 2024
-
- Article
-
- You have access
- HTML
- Export citation
No change in 24-h sodium intake estimated from spot urine in Norwegian adults from 2006 to 2019: the population-based Trøndelag Health Study (HUNT)
-
- Journal:
- Public Health Nutrition / Volume 27 / Issue 1 / 2024
- Published online by Cambridge University Press:
- 11 April 2024, e117
-
- Article
-
- You have access
- Open access
- HTML
- Export citation
