


12.1 Introduction
This chapter concentrates on two country case studies in the Latin American region: Brazil and Mexico. Together, these two emerging economies (EEs) represent over half of the total regional trade (exports + imports) (World Bank 2020b). As Mukherjee (Reference Mukherjee2016, 23) states, ‘a contextual comparison of individual cases … ensures that the generalisations made from the large-N analysis are not too sweeping’. Our insights on these two case studies also derive from large-N quantitative work undertaken by Albertoni (Reference Albertoni2023), but full coverage of this quantitative data lies beyond the scope of this chapter. Hence, although our analysis is qualitative in nature, our arguments are rooted in a mixed-methods approach. As different studies on policymaking have shown, case analysis helps us ascertain causal mechanisms in more detail than can be gleaned from large-N projects (King et al. Reference King, Keohane and Verba2021).
Our analytical baseline begins with the 2008–2009 global financial crisis (GFC), which hit EEs on the trade account, rather than the huge financial shocks felt in the developed countries. Some prominent economists were quick to congratulate EE policymakers for resisting protectionist temptations (Rodrik Reference Rodrik2009; Boffa and Olarreaga Reference Boffa and Olarreaga2012). Our data suggests that such accolades were premature. It is true that Latin America showed remarkable resilience when faced with the GFC and Brazil, one of the two countries at hand, had rebounded by 2010–2011 (Wise et al. Reference Wise, Armijo and Katada2015). However, drawing on data from the Global Trade Alert (GTA 2020), we found an explosion of protectionism throughout the world economy during the GFC, most of it in the form of non-tariff measures (NTMs). As the World Trade Organization (WTO) (2016: para 11) reported, ‘of the 2,835 trade-restrictive measures, including trade remedies, recorded for WTO members since 2008 … only 708, or 25%, had been removed by mid-May 2016’.
From a theoretical standpoint, the latest studies and political debates on recent trade dynamics have focused on the US, China, the European Union (EU), and Japan. Otherwise, the political economy literature has paid little attention to how these protectionist global dynamics have interacted with emerging regions since the GFC. In line with the research questions laid out by the editors of this volume, our focus is on the preferential trade agreements (PTAs) that govern Mexico’s trade under the US-Mexico-Canada Free Trade Agreement (USMCA, previously the North American Free Trade Agreement, or NAFTA), and Brazil’s trade in the context of the Southern Cone Common Market (MERCOSUR). For purposes of clarity, and following Hofmann et al. (Reference Hofmann, Osnago and Ruta2019), the term ‘PTA’ includes free trade agreements, customs unions, and partial free trade agreements, which can take bilateral (e.g. two countries), plurilateral (e.g. many countries), plurilateral with a third country (e.g. EU-Australia Trade Agreement), or region-region (e.g. EU-MERCOSUR Trade Agreement) forms.
Both PTAs came into being in the early 1990s, as both states sought to institutionalise recently implemented trade and investment liberalisation programmes. The political economy literature at the time heralded these schemes as pathways to promote growth, forge healthy interdependence, and lock-in market reforms (Hufbauer et al. Reference Hufbauer, Schott and Clark1994; Lawrence Reference Lawrence1996). Stepping back from the veracity of these claims, our research on these two PTAs in the decade following the GFC shows a rise in NTMs within these schemes despite conditions of high economic interdependence.
Our punchline here is that PTAs, long considered as key trade and investment-creating conduits, are also emerging as venues within which NTMs are simultaneously increasing. That is, members within the same scheme are deploying NTMs against each other. This is what Baldwin and Evenett (Reference Baldwin and Evenett2009) refer to as ‘murky protectionism:’ the increased resort to non-transparent interventions, including everything from import bans and licensing requirements to controls on safety standards on manufactured goods, within these two Western Hemispheric PTAs. The good news is that membership in these PTAs has mitigated some intra-bloc protectionism, albeit against a backdrop of rising NTMs within these PTAs, nonetheless.
Another wild card that emerges from our analysis is the effects of the rapid entry of China into the Latin American region since joining the WTO in 2001. Once unthinkable, China has displaced the US as South America’s top trade partner; in North America, China bumped Mexico down a notch in the rankings of US trade partners in 2003 (Wise Reference Wise2020, 209). Whereas Brazil maintained a trade surplus with China from 2008 to 2018, Mexico has traded at a deficit with China over this same decade (Statista 2022). In 2018, Mexico’s US$76.13 billion trade deficit with China accounted for the bulk of the region’s overall commercial deficit with the People’s Republic of China (PRC) (Wise Reference Wise2020, 85). The declaration of a trade war on China by the first Trump administration in 2018 enabled Mexico to recapture its ranking as the top US partner for trade in goods (USTR 2024). However, as China has increased its export of manufactured intermediate goods to Mexico to circumvent high US tariffs, Mexico’s trade deficit with China has expanded from the equivalent of US$65 billion in 2015 to over $110 billion at the start of 2024 (Ezrati Reference Ezrati2024).
While China is obviously not a member of either PTA under study here, we find that the rise of trade competition from China beginning in the early twenty-first century has strongly influenced the choice of domestic trade policies in Brazil and Mexico. In Brazil, policymakers, political leaders, and producers have complained that the export of raw materials to China and the import of intermediate manufactures and finished consumer goods back from China have triggered a process of ‘premature de-industrialization’ (Rodrik Reference Rodrik2015). Castillo and Martins Neto (Reference Castillo and Martins Neto2016, 12) define deindustrialisation as ‘a falling share of manufacturing employment and value-added in total employment and GDP … and a rising specialization in primary goods’. This phenomenon has been coined ‘premature’ in Brazil because, in contrast to other EEs, it is occurring at low levels of per capita income and shifting employment into low value-added services. Moreover, although it has become routine to blame China for this downward mobility, this transition has been underway in Brazil since the early 1990s.
In the case of Mexico, where Chinese-manufactured exports compete head-to-head in Mexico’s home market and with Mexican-manufactured exports to the US market (Dussel and Gallagher Reference Dussel and Gallagher2013), domestic producers have pushed unsuccessfully for policies that would bolster those manufacturing sub-sectors experiencing deep losses both at home and abroad (Moreno-Brid Reference Moreno-Brid2013). Prior to joining Canada and the US as an official member of NAFTA in 1994, Mexican policymakers halted all state support in the realm of industrial policy; instead, these tasks were relegated to the market, that is, to (mainly private US) companies and other foreign direct investors flooding into the Mexican economy. With the rise of China in Mexican markets, rather than reinstate public policies to foster the restructuring and strengthening of industrial firms in the face of stiff Chinese competition, Mexican policymakers extracted hefty protectionist side payments from Beijing in exchange for Mexico’s vote for the PRC’s accession to the WTO. Although exceptionally high tariffs against hundreds of Chinese goods prevailed until 2011 (Hernández Reference Hernández2012, 83–84), their removal showed how little progress Mexican companies had made in the way of restructuring.
In both countries, ineffective policy responses towards external trade competition were super-imposed on domestic macro- and micro-economic policy frameworks that were insufficient to meet the competitive pressures at hand. This reform backlog became readily apparent when the decade-long commodity price boom, driven by heavy Chinese demand, petered out in 2014 (Gallagher Reference Gallagher2016). Brazil fell into a deep recession, which has lasted nearly a decade with no end in sight. Although the commodity price boom had bypassed Mexico, government coffers benefitted indirectly from historically high oil prices. Nevertheless, the doldrums that hit both countries after the end of the ‘China boom’ confirm the extent to which China’s rapid recovery and hence the quick rebound of commodity prices in 2010 saved them from the worst of the GFC. In Mexico’s case, further economic pain was self-inflicted, as policymakers chose to raise interest rates in response to the GFC and to withhold any counter-cyclical fiscal stimulus for a year.
Subsequently, the advent of the US-China trade war in mid-2018, as well as the outbreak of the Covid-19 global pandemic in early 2020, has deepened the recession in both countries and further hampered growth. From a trade angle, the overriding themes of this chapter are economic underperformance, opportunities lost, and paths not taken. The chapter proceeds in four parts. In Section 12.2, we review prominent trends in the rise of murky protection from the angle of the global setting since the GFC. In Section 12.2, we offer a brief analysis of the political economy of trade in the Latin American region with a focus on our two country case studies. In this section, we define these respective PTAs, chart the rise of extra- and intra-bloc protectionism, and speak to their efficacy over time. In Section 12.4, we offer some final reflections and insights on the path forward for trade policy in Brazil and Mexico.
In 2018, the Trump Administration insisted on the renegotiation of NAFTA along more mercantilist lines and renamed it the ‘US-Mexico-Canada Free Trade Agreement’, or USMCA-FTA. Because this relaunching of NAFTA in June 2020 coincides with the advent of the US-China trade war and the pandemic-induced global recession, we limit our analysis to the 2008–2018 period. This decade alone offers sufficient evidence to support our argument.
12.2 The Global Context
In the seventy-eight years since the end of World War II, we have seen a profound restructuring of the international political economy. We refer, first, to the repositioning of states in the international system and, second, to the ability of Bretton Woods institutions like the General Agreement on Tariffs and Trade (GATT) to accommodate the rise of EEs and other developing countries as part of this process. Within this context of upward mobility, the path to growth and economic prominence had been distinct for each country. Through the 1980s and 1990s, a second phase of globalisation took off, the first having occurred roughly from the 1890s up to the onset of World War I in 1914 (Bordo et al. Reference Bordo, Eichengreen and Irwin1999, 56–58). By the turn of the new millennium, barriers to trade, investment, and people flows had been significantly lowered. With new internet technologies driving data transmission and cross-border information, countries in East Asia, Latin America, and the former Soviet bloc took advantage of increased opportunities for international trade and investment.
The 1990s were a turning point of sorts, in terms of both trade liberalisation and growing signs of protectionist backlash. On the former was the signing of the Maastricht Treaty and formalisation of the EU in 1992, the launching of NAFTA and the completion of the Uruguay Round in 1994, and the 1995 incorporation of the GATT into a newly created WTO. Together, the WTO’s members account for about 98 per cent of world trade; of its 166 members, two-thirds of which are developing countries (WTO 2024). Yet, on our latter point, the disastrous 1999 WTO Ministerial Meeting in Seattle, Washington, where environmental and labour activists successfully rallied a global coalition to protest the deleterious impacts of free trade, set an ominous tone for the GATT/WTO’s next round of multilateral trade negotiations.
Nevertheless, at the insistence of the George W. Bush administration, the WTO launched the Doha Development Round in the immediate wake of the 9/11/01 terrorist attacks on the US. Not surprisingly, Doha turned out to be a losing proposition. This trade round signalled how multilateral negotiations had become more heterogeneous, conflictual, and removed from the kinds of consensual decision-making that characterised earlier multilateral negotiations under the GATT. Although the negotiations were already limping in the wake of the 2008–2009 GFC, it was not until the 2015 WTO Ministerial Meeting in Nairobi that trade ministers from 160 member countries failed to agree to keep the negotiations going. The common narrative held that it was ‘new’ issues on the trade agenda championed by the Organisation for Economic Cooperation and Development (OECD) bloc – the liberalisation of trade-related services and investment and the protection of intellectual property rights (IPRs), which clashed repeatedly with those of powerful EEs like Brazil and India (Vickers Reference Vickers, Daunton, Narlikar and Stern2012). The latter, in contrast, were most adamant about increased market access and the liberalisation of ‘old’ sectors like agriculture and manufacturing in developed country markets. This is true, up to a point.
The newly formed Group of Twenty (G-20) developing countries at the WTO (Maswood Reference Maswood2007),Footnote 1 led by Brazil and India, insisted that their increasing international trade integration and importance to global growth warranted fresh thinking given a transforming multilateral order in which developing countries now comprised the majority. After all, since the late 1990s, developing countries as a group – led by China and secondarily India – had become the drivers of world growth, surpassing average US growth rates by about 3.5 per cent annually between 2000 and 2007 (Subramanian and Kessler Reference Subramanian and Kessler2013, 3). Tellingly, much of the post-mortem analysis on Doha sided with the G-20. For instance, as Stiglitz and Charlton (Reference Stiglitz and Charlton2005, 2) noted, ‘the expectations of the developing country members had been tempered by negative experiences from previous rounds of trade negotiations … they had not been fully aware of the cost of the obligations they had agreed to’ in the Uruguay Round. Two World Bank economists, Finger and Nogues (Reference Finger and Nogues2001, 15), went further, characterising the Uruguay Round as the ‘politics of imperialism … the concessions the North gained (the South gave) in new areas were entirely unrequited’.
After touting the Doha Round as an opportunity for developing countries to realise considerable gains at the negotiating table, the OECD bloc – led largely by the US, the EU, and Canada – did little to help bring these gains about. Perhaps most notable was the more mercantilist stance of the US at the Doha Round (Finger and Nogues Reference Finger and Nogues2001). Susan Schwab, former US Trade Representative from 2006 to 2009, observed that concerned parties had spent too much time negotiating over the rules that would guide the Doha negotiations and not enough on the substance of the proposals that had been tabled. Schwab (Reference Schwab2011, 10) reported that a ‘framework of rigid formulas and ill-defined, largely nonnegotiable flexibilities put all the negotiators in a defensive posture from the outset’. This, plus Doha’s mandate for a single undertaking – no final deal until all parties agreed – meant that the slowest reformers and weakest performers (e.g. Bolivia, Egypt, and the Philippines) could hold out unrealistically for greater gains from the developed country bloc (Vickers Reference Vickers, Daunton, Narlikar and Stern2012).
Simultaneous with the conclusion of the Uruguay round was an explosion of PTAs that encompassed both North and South (Tussie Reference Tussie2009). The WTO database on regional trade agreements reports that there were around fifty in effect in the 1990s, but by 2018, there were close to 500 (WTO 2023a). In contrast with earlier trade schemes, this new wave of PTAs was as much about trade creation as it was about investment (Lawrence Reference Lawrence1996). Under Article 24 of the GATT, PTAs were allowed if the parties at hand notified the GATT/WTO of their intentions to negotiate such an agreement. Three other contingencies must also be met (WTO 2023b): the agreement must seek to cover substantially all trade, tariffs could not be higher than they were prior to forming the agreement, and the agreement must be open to new members. It was against this backdrop that non-transparent protectionist measures began to proliferate, with a marked escalation in the period following the GFC.
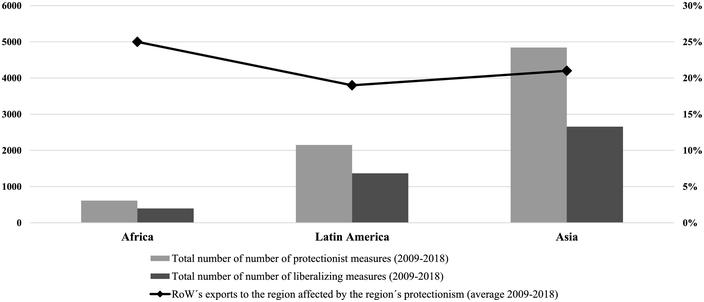
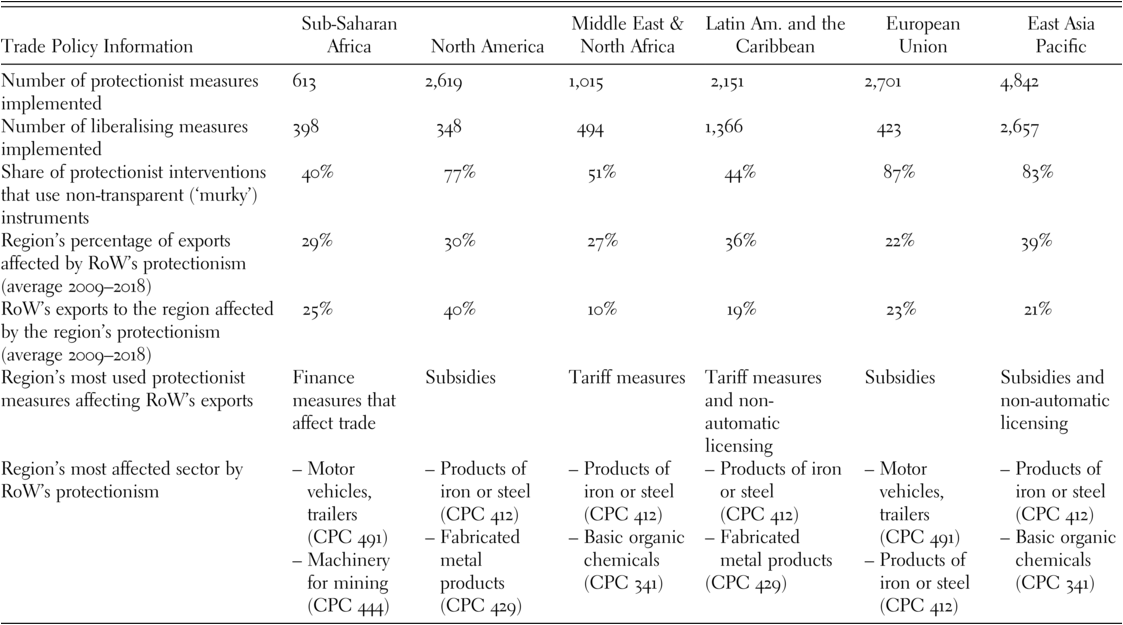
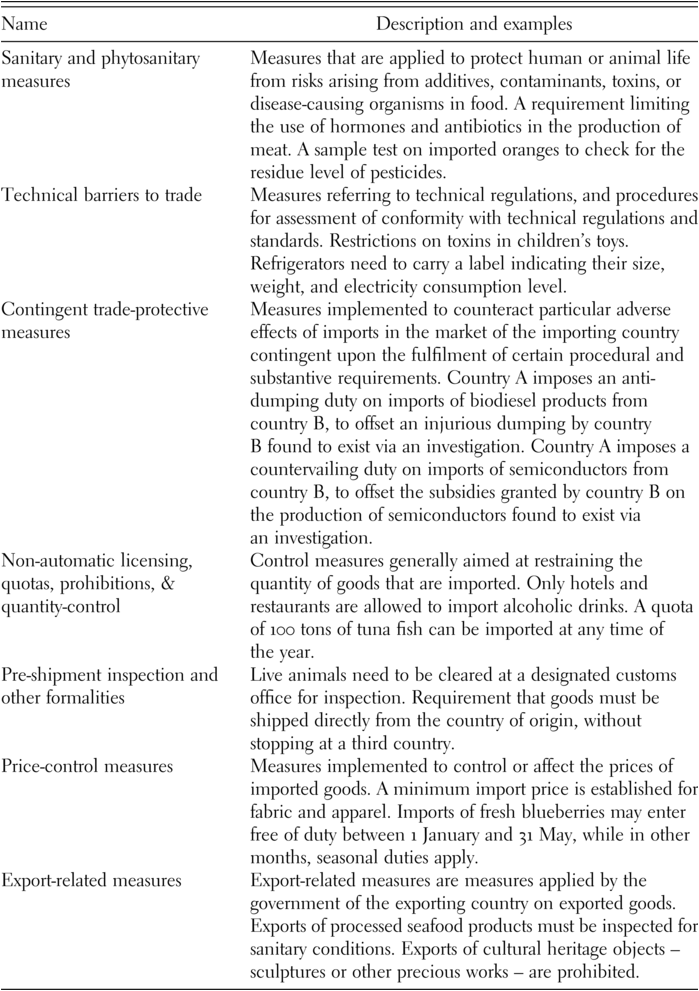
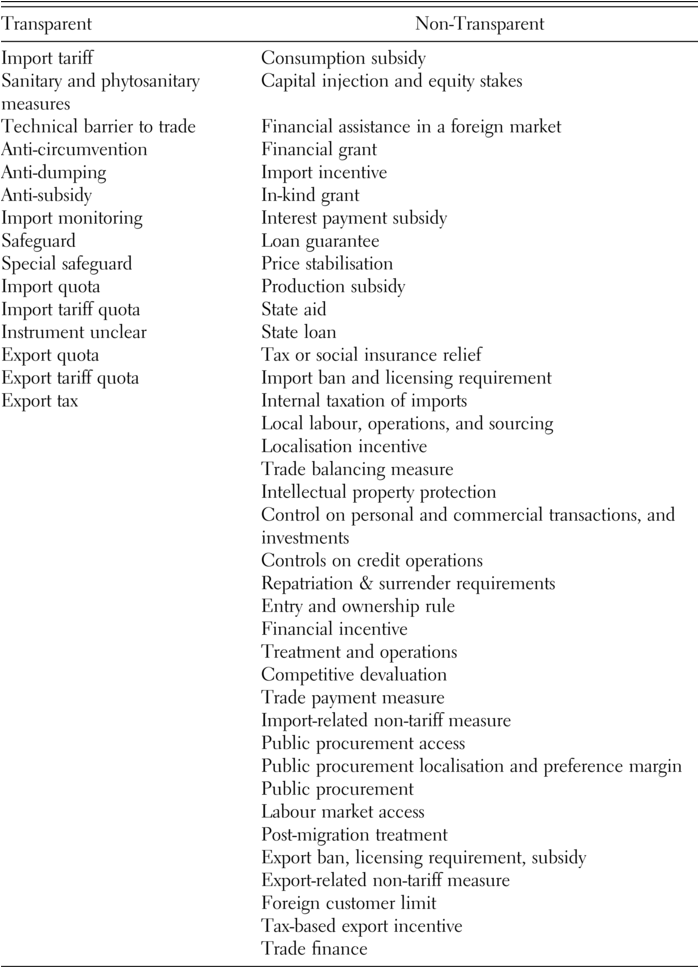
As can be seen in Table 12.1, the number of protectionist measures has outpaced the number of liberalising trade measures in all six regions depicted in the table. Table 12.2 identifies and defines the main protectionist measures that have been deployed, while Table 12.3 distinguishes between the levels of transparency that surround those protectionist NTMs currently at play. Of special interest in Table 12.1 is that Pacific East Asia, the EU, and North America – in this order – registered the highest use of non-transparent protectionist tariffs during the period under study. We note that these rising non-transparent NTMs coincided with the final phases of the Doha Round negotiations, adding an additional deterrent to its completion.
Notes: RoW (Rest of the World), Sub-Saharan Africa consists of forty-seven countries, North America of three countries, the Middle East and North Africa of twenty countries, Latin Am. and the Caribbean thirty-nine countries (Mexico included), THE European Union twenty-eight countries, and East Asia Pacific thirty-seven countries (China included).
12.3 The Political Economy of Latin American Trade, 2009–2018
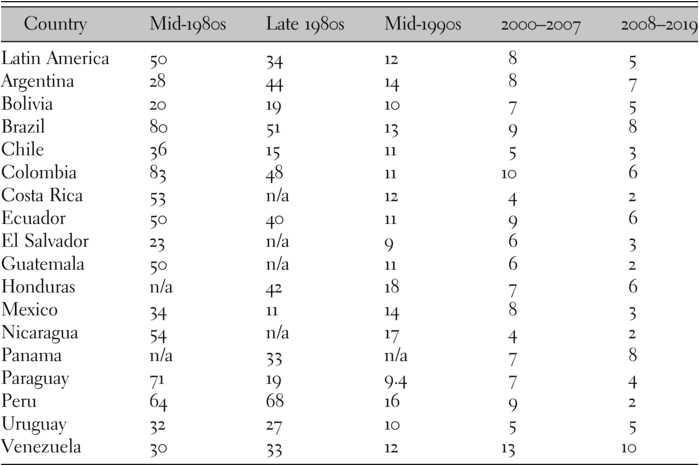
From a regional perspective, Latin America is an interesting ‘median’ case with regard to protectionist and liberalising trade policy measures. As Figure 12.1 shows, Latin America stands between Asia and Africa in terms of both the total number of protectionist and liberalising measures implemented between 2008 and 2018 (left axis) and the share of exports from the rest of the world (RoW) to the region affected by protectionist measures (right axis). It was once one of the most protectionist developing regions; Table 12.4 reflects the heroic efforts and success of Latin American trade reform since the 1980s. Even ‘resource curse’ states like Ecuador and Venezuela, where policymakers have resisted undertaking other structural reforms, have performed respectably on their respective levels of tariff reductions and trade openness.
| Country | Mid-1980s | Late 1980s | Mid-1990s | 2000–2007 | 2008–2019 |
|---|---|---|---|---|---|
| Latin America | 50 | 34 | 12 | 8 | 5 |
| Argentina | 28 | 44 | 14 | 8 | 7 |
| Bolivia | 20 | 19 | 10 | 7 | 5 |
| Brazil | 80 | 51 | 13 | 9 | 8 |
| Chile | 36 | 15 | 11 | 5 | 3 |
| Colombia | 83 | 48 | 11 | 10 | 6 |
| Costa Rica | 53 | n/a | 12 | 4 | 2 |
| Ecuador | 50 | 40 | 11 | 9 | 6 |
| El Salvador | 23 | n/a | 9 | 6 | 3 |
| Guatemala | 50 | n/a | 11 | 6 | 2 |
| Honduras | n/a | 42 | 18 | 7 | 6 |
| Mexico | 34 | 11 | 14 | 8 | 3 |
| Nicaragua | 54 | n/a | 17 | 4 | 2 |
| Panama | n/a | 33 | n/a | 7 | 8 |
| Paraguay | 71 | 19 | 9.4 | 7 | 4 |
| Peru | 64 | 68 | 16 | 9 | 2 |
| Uruguay | 32 | 27 | 10 | 5 | 5 |
| Venezuela | 30 | 33 | 12 | 13 | 10 |
Historically, the widespread and prolonged reliance on an import-substitution-industrialisation (ISI) development model, which originated in Latin America in the late 1950s, was a main drag on these economies. ISI ‘represents a shift away from the outward orientation to export promotion, to an inward-looking orientation. ISI was designated to replace imports with domestic production under the guiding hand of the state. Governments used activist industrial, fiscal, and monetary policy to achieve growth’ (Franko Reference Franko2018, 615). ISI measures wreaked havoc on regional fiscal accounts and induced periodic balance-of-payments crises, especially given the general lack of macroeconomic acumen in the 1960s and 1970s. Former Panamanian President Nicolás Ardito Barletta (Ardito Barletta, Reference Barletta and Kenen1994, 183–184) summarises the resulting inflation, and losses in terms of savings, investment, and productivity:
Exchange rates were fixed relative to several of the main hard currencies. Import controls were part of the import substitution policies. Reserves were normally kept low and were not built up with favourable movements in the terms of trade. Fiscal policy consisted in deciding how much of the government deficit would be financed domestically because this would determine the increase in the quantity of money and inflation. Monetary policy was used mainly to keep interest rates low, producing excess demand for credit to priority sectors, which they [policy makers] defined.
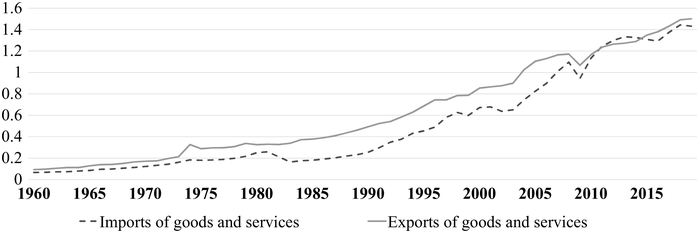
Through the debt-riddled lost decade of the 1980s, to the Washington Consensus reforms of the 1990s, Latin America as a whole has become increasingly trade-oriented (see Figure 12.2). Even today, trade policy is subject to fierce lobbying on the part of those groups and sectors that stand to suffer the biggest losses from trade liberalisation. Moreira et al. (Reference Moreira, Stein, Li, Merchán, Martincus, Blyde, Trachtenberg, Cornick, Frieden and Chatruc2019, 118) remind us that when ‘trade is liberalized, there is no guarantee that it will remain liberalized.’ These authors distinguish between two types of policy trajectories since the liberalisation of trade in the 1990s: ‘Chile, Colombia, Costa Rica, and Mexico, have continued to reduce trade barriers, signed preferential trade agreements with an increasing number of regional and extra-regional partners, and persisted in maintaining and deepening open trade … Argentina, Brazil, and Venezuela, have resurrected some trade barriers or come up with new ones’.
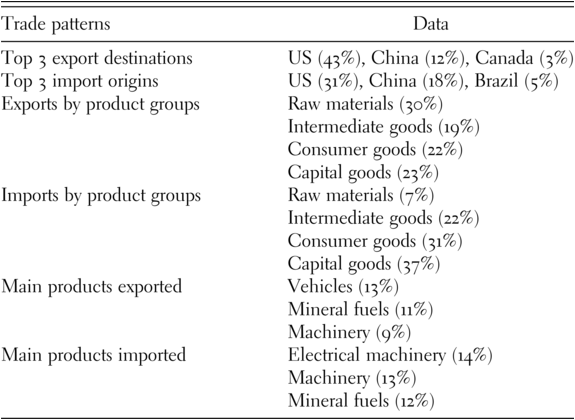
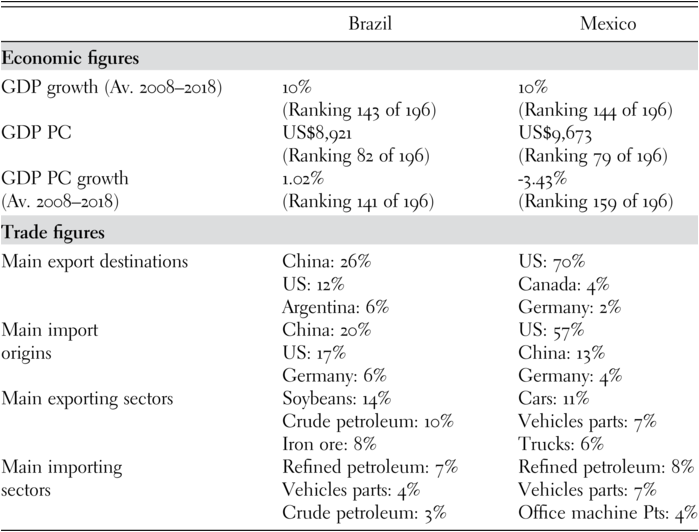
In Table 12.5 we see that the US and China are Latin America’s top trade partners. Moreover, raw materials account for 30 per cent of the region’s exports, whereas intermediate, capital, and consumer goods make up the remainder. In Table 12.6, we can see that Brazil and Mexico sit on opposite ends of the export continuum: Brazil’s main exports are raw materials (soybeans, crude petroleum, and iron ore), and Mexico’s are manufactured goods (cars, vehicle parts, and trucks). In terms of both aggregate and per capita growth, the following case studies show that neither side of this continuum has resulted in the kinds of dynamic returns that each country is capable of delivering. Nor has the respective PTA to which each country belongs proved to be a springboard for upward convergence and prosperity.
| Trade patterns | Data |
|---|---|
| Top 3 export destinations | US (43%), China (12%), Canada (3%) |
| Top 3 import origins | US (31%), China (18%), Brazil (5%) |
| Exports by product groups | Intermediate goods (19%) Capital goods (23%) |
| Imports by product groups | Raw materials (7%) Intermediate goods (22%) Consumer goods (31%) Capital goods (37%) |
| Main products exported | Vehicles (13%) Mineral fuels (11%) Machinery (9%) |
| Main products imported | Electrical machinery (14%) Machinery (13%) Mineral fuels (12%) |
12.3.1 Mexico, Brazil, and Their Respective PTAs
The two countries at hand represent an interesting mix in terms of their main economic and trade indicators. On the eve of the GFC in 2008, Mexico’s economic openness was second only to that of Chile and Peru within the Latin American region. Conversely, after Venezuela, Brazil had the region’s least open economy at the outset of the GFC (WTO 2017b). When the average growth of GDP between 2008 and 2018 is considered (see Table 12.6), both Mexico and Brazil’s average annual GDP growth rates were 10 per cent over the decade, ranking them 143 and 144, respectively, out of 196 countries in the development indicators (World Bank 2020a). In terms of average annual growth of GDP per capita. Brazil’s per capita GDP growth was 1 per cent over this same period, ranked it at 144; Mexico, with an average annual per capita GDP growth rate of -3.43 per cent, ranked at 159 in the 196-country sample.
For separate reasons and in distinct ways, each has underperformed over the past two decades. In the case of Brazil, its anaemic growth rates in terms of aggregate and per capita GDP reflect the severe economic depression that ensued in 2014 when global commodity prices crashed; Mexico’s disastrous record of GDP per capita growth reflects the self-inflicted fallout from the government’s failure to respond effectively to the GFC. Unlike all of the other Latin America and the Caribbean (LAC) EEs (Argentina, Brazil, Chile, Colombia, Peru), Mexico’s Central Bank raised interest rates, and the government rejected proposals for a fiscal stimulus until 2010. This downward compression on per capita income further exacerbated a long-time trend in Mexico whereby policymakers have consistently shifted the adjustment burden onto those who can least afford it (Pastor and Wise Reference Pastor and Wise1997).
These mediocre results have coincided in Brazil and Mexico within the context of two different institutional settings. In the case of Mexico, trade liberalisation was a unilateral endeavour in the late 1980s, and the nature of its participation in NAFTA is heavily weighted towards the bilateral relationship between Mexico and the US. NAFTA is a free trade agreement, meaning that its three members are free to maintain separate trade policies toward RoW. The roots of NAFTA are primarily economic, as powerful private intra- and inter-industry producers operating on both sides of the US-Mexico border lobbied hard for the reduction of barriers to cross-border production, and eventually won (Pastor and Wise Reference Pastor and Wise1994). Notably, between 1990 and 2019, Mexico negotiated fourteen PTAs with over fifty countries representing 60 per cent of world product. As of 2023, NAFTA/USMCA included a population of 442.4 million and a combined GDP of more than US$20 trillion, rendering it the second-largest PTA in the world. Along with side agreements on labour and the environment, the NAFTA accord promoted the free flow of goods, investment, and services within the North American bloc over a fifteen-year timeline.
In line with WTO rules, most barriers came down in the first ten years of the agreement. Tariffs and non-tariff barriers were eliminated on 65 per cent of North American goods by the five-year point; tariff reductions on automobiles occurred over a ten-year period, with the rules-of-origin stipulation that such vehicles must meet a 62.5 per cent local content requirement to qualify for free movement within the bloc. In the agricultural sector, sensitive products were allotted a fifteen-year liberalisation schedule that ended in 2009. By 2009, NAFTA had been fully implemented. If judged according to its own narrowly defined goals of spurring growth based on higher levels of trade and investment, NAFTA has been a measured success (Wise Reference Wise2009).
In the case of Brazil, MERCOSUR, established in 1991 by Argentina, Brazil, Paraguay, and Uruguay, has been the institutional setting for trade policy and regional integration. In contrast with NAFTA’s bilateralism based on Mexico’s strong dependence on the US market, MERCOSUR is a plurilateral arrangement. MERCOSUR comprises more than 285 million people, has a combined GDP of around US$3 trillion, and ranks as the world’s sixth-largest economic bloc. Created in the wake of democratic transitions in both Argentina and Brazil, these long-time rivals sought to improve relations via the launching of a common market. MERCOSUR’s main goal was to establish this common market by 31 December 1994 involving ‘the free movement of goods, services and factors of production between countries through … the elimination of customs duties and non-tariff restrictions on the movement of goods, and any other equivalent measures’ (OAS-SICE 2023). Yet, more than thirty years since its founding, the formation of a common market has eluded bloc members.
This is why MERCOSUR is referred to as an ‘imperfect customs union’ (Vaillant Reference Vaillant2005, Albertoni Reference Albertoni2023). In comparison with the economically oriented debates and strategies that led to the negotiation of NAFTA, MERCOSUR’s origins are decidedly more political. To date, the members have agreed to eliminate some customs duties, to implement a common external tariff (CET) on certain products originating outside of MERCOSUR, and to adopt a common trade policy toward outside countries and blocs (Felter et al. Reference Felter, Renwick and Chatzky2019). Despite the failure to form a common market, MERCOSUR’s four core members are not permitted to negotiate external PTAs or maintain an individual trade policy towards RoW. Unlike NAFTA, which violates the spirit of inclusiveness that underpins Article XXIV of the GATT 1994 (WTO 2023b) with regard to welcoming new members, MERCOSUR has been quite open to expansion. Venezuela, for instance, became a full member in July 2012 (but was suspended in late 2016 when an authoritarian regime took control); Chile, Colombia, Ecuador, and Peru have become associate members, and Bolivia has been in the process of becoming a full member since 2012.
After sluggish progress in the 1990s, MERCOSUR’s Common Market Council (CMC) passed Decision 32/00 in 2000 – a renewed effort to deepen economic integration and bolster compliance between MERCOSUR members. Known as the ‘Re-launching Agenda of MERCOSUR’ (CMC decisions 22/00 to 32/00), the strategy sought to identify MERCOSUR’s bottlenecks and generate proposals to resolve them. But more than two decades later, MERCOSUR remains trapped by its own structural barriers (Rodríguez Reference Rodríguez2021). We quote from a US Department of Commerce industry report on MERCOSUR’s complicated tariffs and numerous exceptions (Exports.gov 2023):
A MERCOSUR Common External Tariff (CET) on imports from non-member countries entered effect in 1995. MERCOSUR´s general rule is to apply a higher CET on higher-value-added imports. There are numerous sectoral and national exceptions to MERCOSUR’s CET. Sectoral exceptions apply to capital, information technology, and telecommunication goods. At a national level, each MERCOSUR member is also allowed to exempt a certain number of goods from the CET. These exceptions, and the number of special import regimes in member countries, have greatly eroded the bloc’s CET. MERCOSUR also lacks other mechanisms to become an effective customs union, such as a mechanism to distribute tariff revenues.
Furthermore, there are steep asymmetries between Brazil and Argentina, on the one hand, and Paraguay and Uruguay, on the other hand. The general notion that Brazil and Argentina are ‘carrying the team’ is troublesome, given the readiness of both countries to flaunt MERCOSUR rules at the drop of a hat. Such was the case in 2011, for example, when Brazil applied NTMs to car imports, no matter that 50 per cent of such imports come from Argentina (Bachega Reference Bachega2011).
Despite the many challenges MERCOSUR still faces, as a bloc, it has negotiated trade agreements with twelve individual countries, the South African Customs Union, and the EU (UN Comtrade 2019). About 60 per cent of MERCOSUR’s total exports go to countries that have negotiated PTAs with the bloc. Although EU-MERCOSUR negotiations were concluded in 2019, social and environmental concerns stalled the final approval of this accord on the EU side. The 2022 energy crisis triggered by Russia’s invasion of Ukraine has revived interest in MERCOSUR within the EU, as Argentina and Brazil are abundant in oil and natural gas; Bolivia has natural gas and lithium; and Argentina and Chile are also rich in lithium. Chile alone currently supplies the EU with 78 per cent of its lithium imports (Nolte Reference Nolte2023).
This jump-started another round of EU-MERCOSUR negotiations, with both sides inking a revised PTA in December 2024. This new version awaits approval by national legislatures in the four core MERCOSUR nations, Argentina, Brazil, Paraguay and Uruguay. On the EU side, passage of the EU-MERCOSUR agreement must reach a “qualified majority” based on two conditions: 55 percent of EU nation states (or 15 of the 27 EU members) must vote in favour and these member states must represent 65 percent of the EU population (European Commission 2024). Both sides claim to have overcome differences on a range of measures that held up the passage of the 2019 agreement, including climate change (deforestation) and protection of labour rights. Should this 2024 text come to pass, it would mean sizable tariff reductions on both sides for autos, machinery, chemicals, pharmaceuticals, dairy, spirits, and wine. Government procurement, a sustainability commitment in the extraction of critical raw materials, and some minor access to EU agriculture are other highlights of the draft PTA. After 24 years of start and stop negotiations for an EU-MERCOSUR PTA, this is the closest both sides have come to bringing one to fruition.
12.3.2 Mexico: Bilateralism and Protectionism
After following the general Latin American pattern of import substitution industrialisation (ISI) up through the 1970s, Mexico launched an East-Asian-style manufacturing export-led development model. The differences with this East Asian strategy were Mexico’s dependence on volatile oil revenues to finance the state budget, its cancellation of all industrial policy in 1992, and the country’s heavy reliance on US foreign direct investment (FDI) to advance its industrialisation drive. As a prelude to NAFTA entry, Mexican policymakers signed on to Washington Consensus policies based on liberalisation, privatisation, and deregulation (Williamson Reference Williamson and Williamson1990). Mexico’s entry into NAFTA in 1994 has propelled manufactured exports and integrated Mexico into some powerful global value chains (GVCs). However, the current development model is that of a neoliberal export manufacturer, where policymakers remain committed to a hands-off trade strategy and a tight macro-prudent monetary policy that has hampered long-term growth.
Hindsight shows that Mexican policymakers mistook NAFTA as a development strategy in and of itself. Cast by its designers in the jargon of economic integration theory, NAFTA was projected to trigger a growth boom that would benefit all three member countries, but especially Mexico, as the least developed of the three. The ongoing narrative was that the elimination of barriers at the border would promote scale economies related to greater specialisation, increased technological capabilities, and more efficient deployment of those factors for which Mexico has a comparative advantage (Hufbauer et al. Reference Hufbauer, Schott and Clark1994). It was also argued that the blending of Mexico’s abundant factors with the capital, technology, and know-how that the US brought to the table would trigger a dynamic pattern of economic convergence among the three members. According to this narrative, Mexico would readily advance up the industrial and technological learning curve and substantially increase its per capita income. On this last claim, the data confirm that nothing could be further from the truth.
Keep in mind that at the time of NAFTA’s launching in 1994, China was a mere speck on the economic horizon. It was unimaginable that China could bump Mexico down a notch in its ranking as a US trade partner, and virtually no one envisioned that China would go on to become a de facto player in NAFTA – now one of the overriding characteristics of the North American market. NAFTA’s golden age was the period between 1994 and 2000, when the average annual growth rate of total US trade with North America was around 17.7 per cent, and the average annual growth rate of North American FDI in this sub-region was about 24.2 per cent. However, by 2003, Chinese exports were burrowing through the more sophisticated sub-sectors of the US electronics market (computer peripherals, sound and television equipment, telecoms), which Mexico had once claimed as its own.
Between 2000 and 2005, Mexico increased its share of US imports by 25 per cent, while China’s share of US imports grew by 143 per cent. By 2011, 31 per cent of all US imports from Mexico were deemed to be under direct threat from Chinese competition in the US market, and some 46 per cent of Mexico’s manufacturing exports to the US were classified in this same category (Dussel and Gallagher Reference Dussel and Gallagher2013). A key difference between China and Mexico is that the technological strengths within Mexico’s manufacturing sector stem from intermediate inputs that are developed in the advanced economies, processed in Mexico, and shipped back out. China’s technological capabilities are the result of assertive public policies and generous state funding in the development of intermediate goods for export (Kroeber Reference Kroeber2016). At first glance, the data depict Mexico as flourishing within GVCs (see Figure 12.2). Yet, Figure 12.3 tells a different story, which is highlighted in a recent study by The Economist (2020, 1). The study cautions that Mexico will remain at the end of the ‘factory line’ (see Figure 12.4) without a more targeted and proactive industrial policy: ‘Mexico seems best placed to increase its position in the U.S. supply chain, but there are issues here too. … More fundamentally, Mexico will struggle without government policy to actively promote supply chain shifts, and without policy that attracts investment more broadly’.
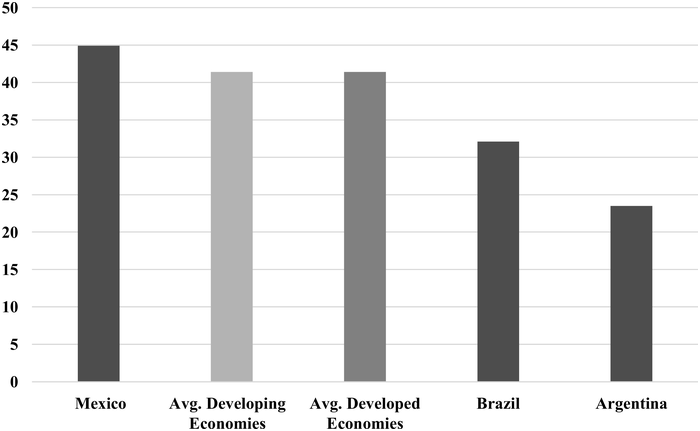
Figure 12.3 The GVC participation index (% share in total gross exports, in 2015).
Note: The last publicly available data by country is for 2015.
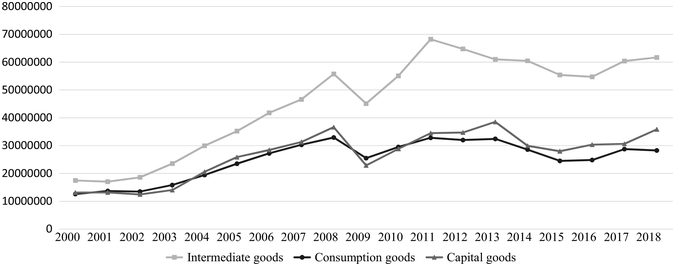
Figure 12.4 Mexico’s export of intermediate, consumer capital goods between 2000 and 2018 (in thousands of dollars).
Foot-dragging on essential domestic reforms (e.g. competition policy, tax policy, energy, and financial services) has rendered Mexico a sophisticated contract assembler, at best. Especially fatal has been the lack of technical support and credit access for those small and medium-sized firms that provide the bulk of Mexican employment. In the bigger picture, China’s lower costs on utility inputs for industrial production, more favourable corporate tax rates and its blitzkrieg educational investment in the higher-skilled professions confirm that Mexico’s laissez-faire manufactured export strategy is simply missing the mark. The rapid rise of China in the NAFTA economic bloc has made urgent the deployment of public policy in the expansion, upgrading, and infusion of technology into Mexico’s manufacturing sector (WTO 2017a).
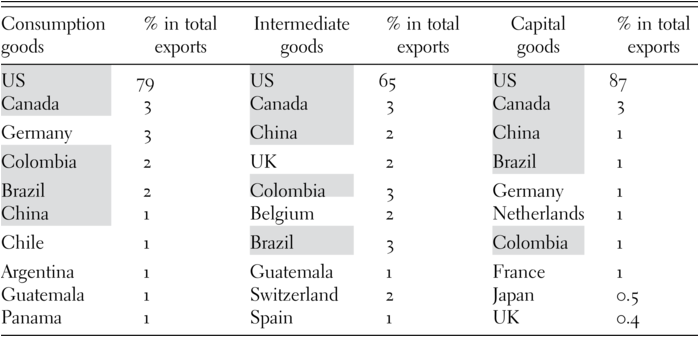
Turning to the rise of protectionism in Mexico post-GFC, just as a wave of liberalisation in the early 1990s occurred as a result of Mexico’s strong political and economic ties with the US and its eagerness to join NAFTA, current protectionist responses are partially a reaction to rising US protectionism (Campbell and Webber Reference Campbell and Webber2017, 13). As Table 12.7 shows, NAFTA has seemingly cemented Mexico’s intense dependence on the US market, despite policymakers’ periodic declarations about their intentions to diversify Mexican trade towards Asia. The Trump administration’s insistence on renegotiating NAFTA and the resulting USMCA marked the first time the US has raised trade barriers in the context of a PTA (Albertoni and Wise Reference Albertoni and Wise2021). In Mexico, an explicit ‘anti-trade’ narrative that had been directed mainly towards China, broadened after the GFC; with the advent of Trump-style protectionism and the travesty of USMCA’s higher content requirements that favour the US market, the data show that Mexico has been quite responsive to protectionist measures.
Table 12.7 Top destinations of intermediate, consumption, and capital goods (average share in Mexico’s total exports between 2008 and 2018)
| Consumption goods | % in total exports | Intermediate goods | % in total exports | Capital goods | % in total exports |
|---|---|---|---|---|---|
| US | 79 | US | 65 | US | 87 |
| Canada | 3 | Canada | 3 | Canada | 3 |
| Germany | 3 | China | 2 | China | 1 |
| Colombia | 2 | UK | 2 | Brazil | 1 |
| Brazil | 2 | Colombia | 3 | Germany | 1 |
| China | 1 | Belgium | 2 | Netherlands | 1 |
| Chile | 1 | Brazil | 3 | Colombia | 1 |
| Argentina | 1 | Guatemala | 1 | France | 1 |
| Guatemala | 1 | Switzerland | 2 | Japan | 0.5 |
| Panama | 1 | Spain | 1 | UK | 0.4 |
In the decade following the GFC, Mexico’s share of exports has been consistently more impacted by those countries with whom Mexico has no PTA. On average, between 2009 and 2019, 14 per cent of Mexico’s exports were affected by close trading partners and 21 per cent by those countries with no trade agreement with Mexico. In Figure 12.6, we probe deeper and count the number of protectionist measures leveraged towards Mexico on the part of its close vs not close trading partners; in Figure 12.7, we count the number of protectionist measures that Mexico has initiated towards the exports of close vs not close trading partners. Since 2014, countries with no trade agreements with Mexico have been consistently more impacted by Mexico’s protectionism than those participating in a PTA with Mexico.
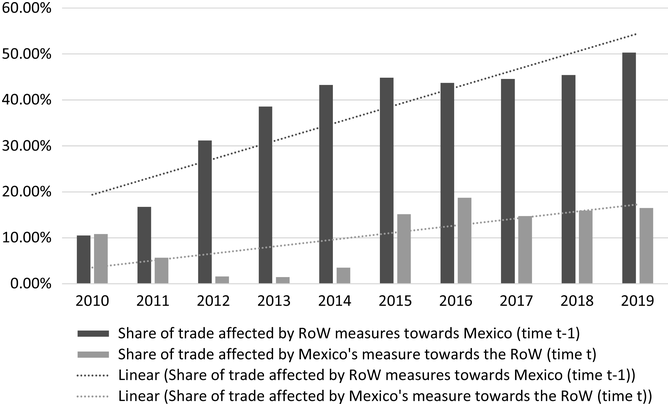
Figure 12.5 Share of Mexico’s total exports affected by protectionism measures vs RoW exports to Mexico affected by protectionism measures (average 2009–2019).
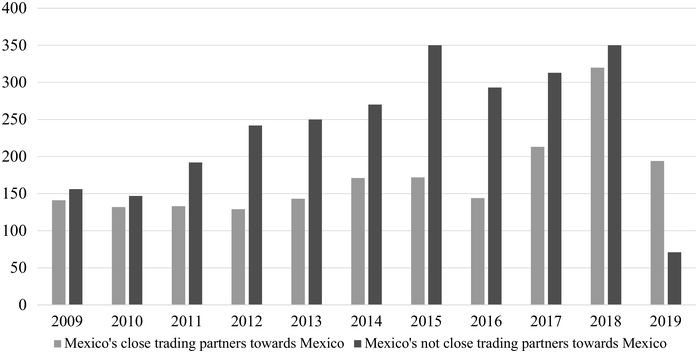
Figure 12.6 Number of protectionist measures towards Mexico by close and not close trading partners.
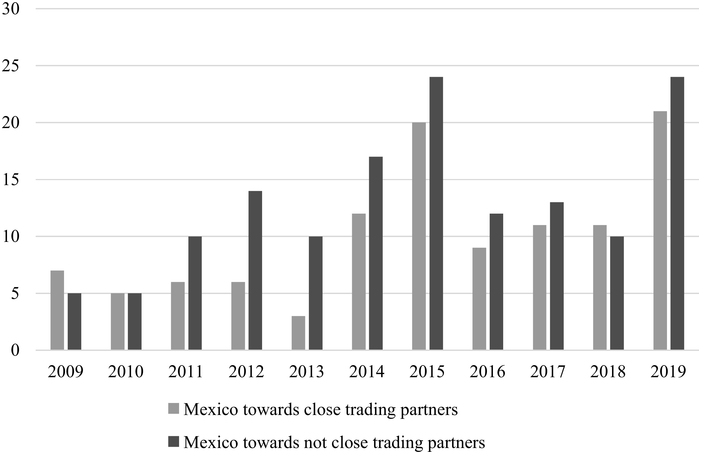
Figure 12.7 Number of protectionist measures implemented by Mexico towards close and not close trading partners.
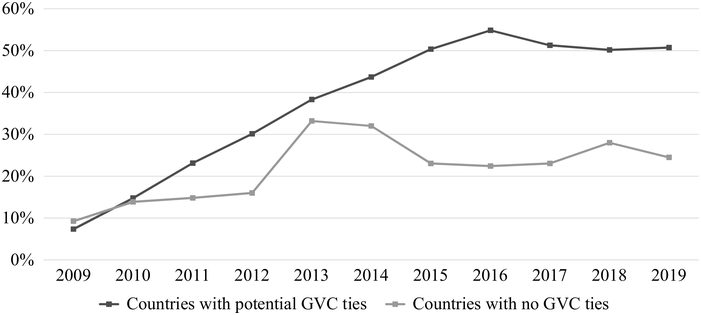
It is worth noting that GVCs do not seem to restrain protectionism along the same lines as PTAs. Here, we follow Gaulier et al. (Reference Gaulier, Sztulman and Ünal2019, 1), who measure intermediate goods traded between two countries as a proxy for the GVC link between them. More concisely, a World Bank report (2020c, 5) defines GVCs as follows: ‘a global value chain breaks up the production process across countries. Firms specialise in a specific task and do not produce the whole product’. In Figure 12.8, we probe the level of protectionism Mexico has faced from close trading partners through potential GVC ties (e.g. the US, Canada, China, Colombia, and Brazil). Interestingly, between 2009 and 2019, 36 per cent of Mexico’s exports have been affected by close trading partners linked to Mexico through GVCs and 21 per cent by those countries that have no PTA with Mexico.
There is one additional twist to this story. Although we have found that protectionism is higher on the part of RoW towards Mexico, and that Mexico’s protectionism toward its non-close trading partners is somewhat higher than with its PTA trade partners, Figure 12.9 shows that the level of non-transparent protectionist interventions used by Mexico towards close trading partners is much higher. On average, from 2009 to 2019, 47 per cent of Mexico’s protectionist measures towards close partners were non-transparent, whereas 32 per cent of its protectionist measures towards countries that have no PTA with Mexico were non-transparent. Furthermore, the share of non-transparent protectionist interventions towards Mexico by close trading partners (82 per cent) is slightly higher than by countries with which it has no trade agreements (80 per cent).
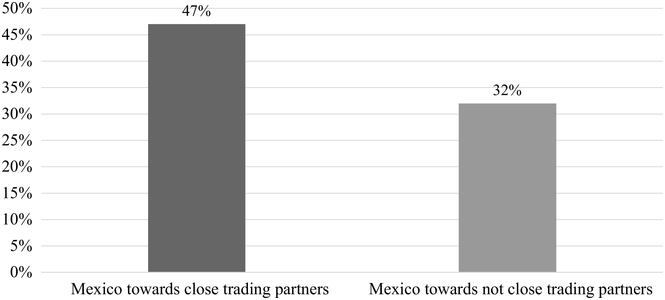
Figure 12.9 Share of non-transparent protectionist interventions by Mexico towards close and not close trading partners (average 2009–2019).
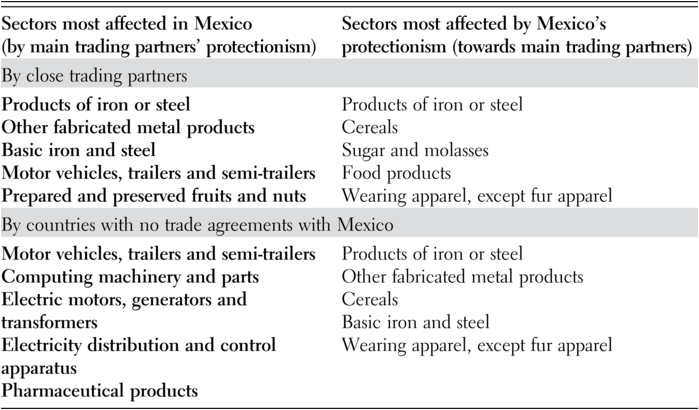
Given Mexico’s inordinately high level of dependence on the US market for trade and FDI, and the fact that much of this trade-related cross-border investment is carried out within North American GVCs, it seems safe to conclude that Mexico is bearing a heavy brunt of US protectionism (Pérez Arguello and Albertoni Reference Pérez Arguello and Albertoni2019). As can be seen in Table 12.8, those sectors that are most affected by protectionism against Mexico are the very products that form the backbone of the NAFTA market.
12.3.3 Brazilian Protectionism (in Comparison with Mexico)
From the 1930s to the late 1960s, the Brazilian economy adhered to an ISI model. Under ISI, Brazilian policymakers deployed sweeping industrial policies (import barriers, subsidies, and generous state sponsorship) and successfully established the domestic production of automobiles, steel, and a capital goods sector. However, after fifty years of these protectionist policies, Brazil’s role in global trade was disproportionately low compared with the top ten EEs (Wise et al. Reference Wise, Armijo and Katada2015). The country’s historic lack of exposure to global trade has been costly in terms of growth, inflation, and overall competitiveness. Despite succumbing to the 1982 debt shocks and embracing Washington Consensus policies of trade liberalisation and privatisation, those sectors built up under ISI have retained preferential treatment, regardless of Brazil’s membership in MERCOSUR. Given this continued preferential treatment, Brazil’s industrial sectors have been a magnet for incoming FDI, although little of this FDI has resulted in the incorporation of Brazil into GVCs outside of MERCOSUR.
Apart from the previously mentioned differences between NAFTA and MERCOSUR, a broader comparison of the institutional context for trade policy in Mexico and Brazil reveals two contrasting patterns. Given that Mexico was controlled by a single-ruling party from 1929 to 2000, the country’s entry into NAFTA in 1994 was a highly autocratic affair. Domestic debates over NAFTA were tightly circumscribed, and any quantitative estimates on the future effects of NAFTA on the Mexican economy were withheld from the Mexican people (Pastor and Wise Reference Pastor and Wise1994). To this day, the neoliberal policy preferences of domestic elites have held sway over Mexico and the nature of its participation in NAFTA. In Brazil, the launching of MERCOSUR was preceded by an authoritarian military regime that ruled from 1964 to 1985. As Argentina had sent its own military regime back to the barracks in 1983, a commitment to democracy and civilian rule prompted the cross-border olive branch that led to the 1991 establishment of MERCOSUR. For both countries, the long delay in the formation of a customs union and CET suggests that these goals were secondary.
Mexican and US business elites had been engaged in cross-border production since the 1960s, and the acute recession of the 1980s weakened those producers that relied on selling to the domestic market. Having successfully secured protectionist policies throughout the post-war period, this latter contingent was marginalised. Suddenly, within the confines of an autocratic government structure, NAFTA entry was framed as the next logistical step for Mexican development. Conversely, the Brazilian state had long coddled domestic producers across sectors, and the 1980s crisis did little to diminish their fervour for a protectionist trade model. Under the tutelage of the World Bank and other multilateral institutions, both Mexico and Brazil proceeded with the unilateral reduction of tariffs and non-tariff barriers in the late 1980s. But unlike Mexico, trade liberalisation in Brazil was swept up in the transition to democracy and the heightened mobilisation of civil society, including powerful leaders in the business sector.
In Mexico, there was far too little domestic input on trade liberalisation and NAFTA entry; in Brazil, a significant institutional restructuring post-1985 gave greater influence to the industrial sector and civil society in Brazilian trade policymaking (Albertoni Reference Albertoni2023). In Brazil, the general clamour for greater social input on trade policy led to new consultation and coordination mechanisms, even though some of the proposed measures ran counter to what was agreed on within MERCOSUR. Whereas NAFTA was rubber-stamped by the Mexican Congress, in Brazil, the Congress was able to closely scrutinise the MERCOSUR treaty, and its ultimate ratification resulted in loopholes that favoured powerful domestic actors. In short, Mexico has offered too little support for producers struggling to survive within the country’s neoliberal manufacturing export-led development model, while Brazil’s protectionist policies have spared producers from having to fully compete within the global economy (Oliveira et al. Reference Oliveira, da Motta Veiga, Polónia Rios and Ribeiro2018).
12.3.4 What’s China Got to Do with It?
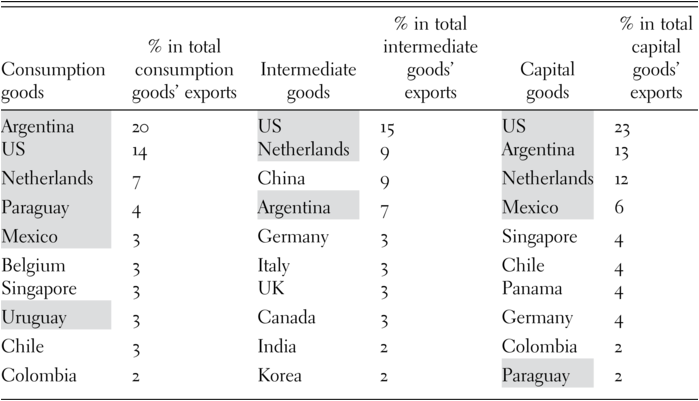
In Figure 12.3, we saw that in 2015 Mexico’s participation in GVCs (as a per cent of exports) was around 10 per cent higher than Brazil’s. And yet, Mexico’s GVC participation is linked overwhelmingly to the US market, and capital goods (the end of the assembly line) are its dominant exports (Figure 12.3). In comparison, Brazil has succeeded in diversifying its trade partners, including the US, Argentina, and the Netherlands (see Table 12.9), and intermediate exports are double the amount of consumer and capital goods exports (see Figure 12.10). Although China has been Brazil’s top trade partner since 2009, it accounted for just 9 per cent of Brazil’s intermediate exports in our designated time period. From 2001 to 2017, 66 per cent of Brazil’s exports to China were primary products (soybeans and ores), while 50 per cent of its imports from China were electrical machinery and equipment, nuclear reactors, boilers, and other machinery (Wise Reference Wise2020, 82).
Table 12.9 Top destinations of intermediate, consumption, and capital goods (average share in Brazil’s total exports between 2008 and 2018)
| Consumption goods | % in total consumption goods’ exports | Intermediate goods | % in total intermediate goods’ exports | Capital goods | % in total capital goods’ exports |
|---|---|---|---|---|---|
| Argentina | 20 | US | 15 | US | 23 |
| US | 14 | Netherlands | 9 | Argentina | 13 |
| Netherlands | 7 | China | 9 | Netherlands | 12 |
| Paraguay | 4 | Argentina | 7 | Mexico | 6 |
| Mexico | 3 | Germany | 3 | Singapore | 4 |
| Belgium | 3 | Italy | 3 | Chile | 4 |
| Singapore | 3 | UK | 3 | Panama | 4 |
| Uruguay | 3 | Canada | 3 | Germany | 4 |
| Chile | 3 | India | 2 | Colombia | 2 |
| Colombia | 2 | Korea | 2 | Paraguay | 2 |
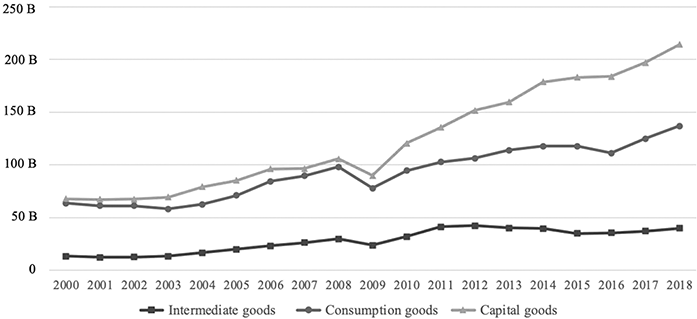
Figure 12.10 Brazil’s export of intermediate, consumer, and capital goods between 2000 and 2018 (in thousand US$).
Between 2008 and 2018, Brazil ran a hefty trade surplus with China, while Mexico traded with China at a steep deficit. From 2001 to 2017, 34 per cent of Mexico’s imports from China were identical to Brazil’s imports from China (Wise Reference Wise2020, 85). Intermediate and capital goods accounted for just 3 per cent of exports from Mexico to China, while intermediate goods accounted for 9 per cent of exports from Brazil to China (see Tables 12.7 and 12.9). In this period, 19 per cent of Mexico’s exports to China consisted of vehicles (other than rail or tramway). Interestingly, in 2017, total trade between Mexico and China was US$80.9 billion, whereas Brazil’s total trade with China was US$74.8. When seen together, these figures raise two related questions: why, given that Brazil has built up significant exports of intermediate and capital goods, do so few of these goods go to its top trade partner, China? Why, given Mexico’s success in diversifying away from a trade model led by primary exports, does it export so few intermediate and capital goods to RoW? The answers lie, first, in the shortcomings of domestic trade policy and, second, in each country’s PTA membership.
Regarding domestic trade policy, protectionism has been the overriding response to the rapid entry of China in both countries since 2002. Earlier in the chapter, we noted the eleven-year protectionist side payment that Mexico extracted from China as a quid pro quo for Mexico’s vote in favour of China’s 2001 accession to the WTO. Otherwise, Argentina and Brazil have led the region in the filing of anti-dumping complaints against China at the WTO, although Mexico has periodically followed suit. As noted by the International Bar Association (IBA 2010, 5): ‘Manufactured goods generally feature prominently on the list of Chinese products usually targeted by Latin American AD action, with metallurgical products often occupying second place. In Brazil, Argentina and Mexico, petrochemicals and minerals amount for an important share as well’.
Furthermore, between 2008 and 2018, both countries adhered to a strict macro-prudential policy framework, based on high-interest rates, primary budget surpluses, and capital account liberalisation. As we mentioned earlier, Mexico was so wed to this approach that it raised interest rates as an anti-inflation precaution when the GFC struck. Brazilian policymakers launched a successful counter-cyclical response to the GFC, all the while maintaining some of the world’s highest interest rates and an overvalued exchange rate. Flush with cash during the commodity price boom from 2003 to 2013 (Gallagher Reference Gallagher2016), these prices did not correct until the post-boom crash in 2014.
In both cases, a shift away from tight macro-prudence and a well-designed industrial policy could have helped to boost manufactured exports to RoW and perhaps to China. Between 2003 and 2011, the Brazilian government announced a mandate to export, innovate, and internationalise, and channelled generous support to companies through Brazil’s National Development Bank (BNDES). This helped to attract about US$60 billion in Chinese FDI from 2000 to 2021 (Dussel Reference Dussel2022, 7); nevertheless, the pull of commodity prices was so strong that the bulk of the designated funds (and Chinese FDI) went to energy and oil sector development (Hochstetler and Montero Reference Hochstetler and Montero2013, 1490–1491). Remarkably, in Mexico, policymakers implemented an industrial policy in 2012 that favoured selected industries with high FDI inflows that were already thriving on competitive advantage (Wise Reference Wise2020, 211). In other words, foreign companies and well-established North American high-tech sectors in Mexico are being rewarded, while most domestic companies are not included in this programme. Mexico has attracted about 10 per cent of the Chinese FDI that has poured into Brazil and made little effort to attract more.
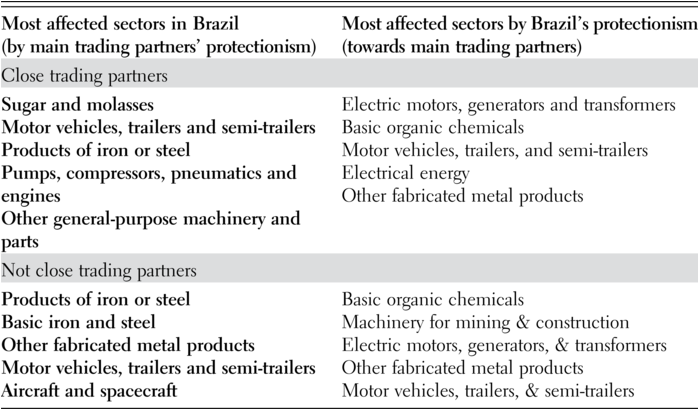
What do these respective PTAs have to do with the deficiencies and asymmetries that mark each country’s trade and investment relationship with China? In the case of MERCOSUR, Figure 12.3 shows that the difference in GVC participation between Brazil and Argentina is about 10 per cent; moreover, Brazil exports about 40 per cent of its consumer, intermediate and capital goods to Argentina. Although Brazil exports another 52 per cent of goods in these three categories to the US market, this trade is conducted outside of North American GVCs (Albertoni and Rebolledo Reference Albertoni, Rebolledo and Sauvé2018). Brazil’s GVC participation consists mainly of intra-industry trade with Argentina in the auto sector. Table 12.10, however, suggests that even this may be an exaggeration, as motor vehicles, trailers and non-trailers are the targets of two-way protectionism (Bachega Reference Bachega2011, Oliveira et al. Reference Oliveira, da Motta Veiga, Polónia Rios and Ribeiro2018) – by Brazil and against Brazil on the part of close and not close trading partners alike.
Table 12.10 Most affected sectors in and by Brazil (2009–2019)
The embedding of Brazilian protectionism within MERCOSUR has been costly to the country’s industrial sector. At about 9 per cent, MERCOSUR’s CET is second only to Venezuela’s 10 per cent weighted mean tariff rate (see Table 12.4); moreover, MERCOSUR’s higher tariffs – applied to information technology, telecom, and capital goods – are simply counter-productive (Exports.gov 2023). At its peak in 2005, Brazil carried a trade surplus of US$8 billion in manufactured goods, but by 2012 this had turned into a US$90 billion deficit (Jenkins Reference Jenkins2015, 50–52). Some of this deficit can be blamed on the overvaluation of the Brazilian currency during most of the 2003–2013 commodity price boom, but about 29 per cent can be attributed to displacement by Chinese manufactured imports.
Whereas path dependence governs Brazil’s trade relationship with China, which has always followed a pattern of old-fashioned comparative advantage, Mexico sank into a similar pattern after once accounting for about 11 per cent of China’s manufactured imports (Wise Reference Wise2020, 85). However, as China’s own manufactured exports began to flood the North American market, and Mexico found itself trading at a deficit with China by 1993, it shifted towards the same traditional trade profile that characterises Brazil-China trade. By the 2010s, ores, slag, and agriculture accounted for 24 per cent of Mexican exports to China (Wise Reference Wise2020, 85). One telling lesson from the US-China trade war is the agility with which China has been able to diversify its supplier base of intermediate imports and re-engineer its GVCs (Baldwin and Evenett Reference Baldwin and Evenett2020; Albertoni and Wise Reference Albertoni and Wise2021, 20–22).
Mexico is a potential winner on this front, as a flood of private Chinese companies producing electronic components, construction equipment, and installing warehouse and factory grids are now setting up operations in Mexico to supply US producers and consumers with goods hit by high US tariffs (Goodman Reference Goodman2023). There are two contradictions here: first, it took a drastic US-China trade war to bring Mexico’s potential strengths to life; and second, since the PRC’s 2001 accession to the WTO, the spectre of Chinese inputs entering the US market stamped ‘made in Mexico’ has haunted US producers and policymakers. The US has the first Trump administration to thank for bringing this scenario to life (Puyana Reference Puyana2018; Noland Reference Noland2020).
12.3.5 Brazil and MERCOSUR: An ‘Imperfect Customs Union’
Turning more specifically to Brazil’s trade policies, we saw in Table 12.9 that, apart from Brazil’s trade with Argentina, its exports to the remaining MERCOSUR partners (Paraguay and Uruguay) consist of a small share of consumer durables. Figure 12.11 shows that a rise in Brazil’s protectionist responses towards RoW coincided with the end of the commodity price boom in 2014. Figure 12.12 shows that Brazil has consistently implemented more protectionist measures against countries with which it has no trade agreements than towards close trading partners, while Figure 12.13 reflects that those protectionist measures that have most affected Brazil are from countries with which it has no trade agreements. This last figure captures the protectionism of key non-PTA trade partners (China and the US) towards Brazil. It appears that Brazil has been caught in some of the crossfire related to the US-China trade war (Evenett and Fritz Reference Evenett and Fritz2018).
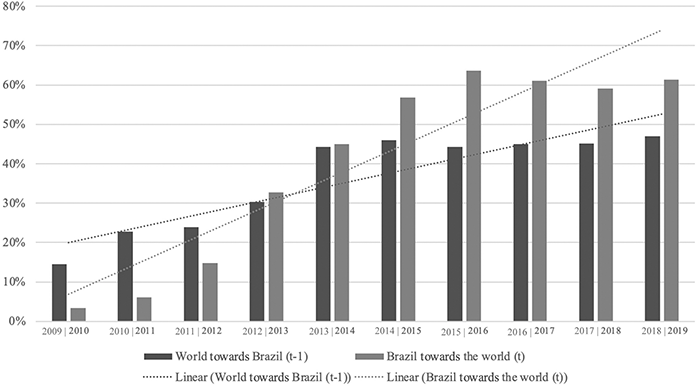
Figure 12.11 Share of Brazil’s total exports affected vs world exports to Brazil affected by protectionist measures (average 2009–2019).
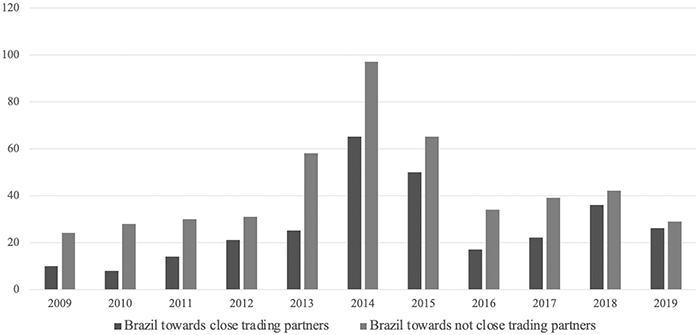
Figure 12.12 Brazil’s number of protectionist measures implemented towards close and not close trading partners.
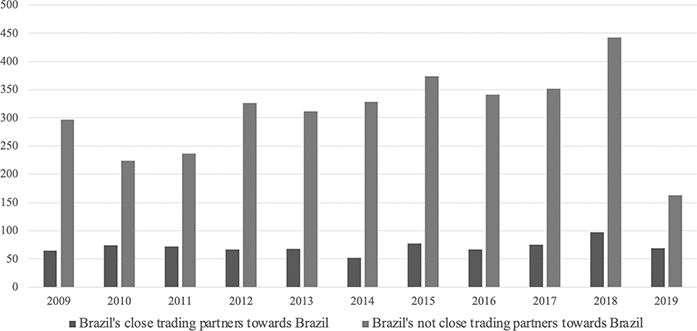
Figure 12.13 Number of protectionist measures towards Brazil by close and not close trading partners.
Regarding the level of transparency in trade measures, Figure 12.14 shows that the share of protectionist non-transparent instruments used by Brazil towards close trading partners is much higher (an average of 74 per cent between 2009 and 2019) than with countries with which it has no trade agreements (56 per cent). This mimics Mexico’s pattern. In the case of Brazil, we quote from Nicolas Albertoni’s interview with Tatiana Palermo, former Brazilian Vice-Minister of Agriculture and chief agricultural trade negotiator:
MERCOSUR is a good example for your argument. Although the countries do not apply tariffs among them (with some exceptions), there are numerous non-tariff and other barriers (like, for example, extremely complex rules of origin, and different sanitary and phytosanitary requirements that make agricultural trade within the bloc very difficult). Non-tariff barriers in Brazil are usually not directed towards specific countries. At the same time, it is usually more difficult for the Brazilian government to justify such barriers within MERCOSUR.
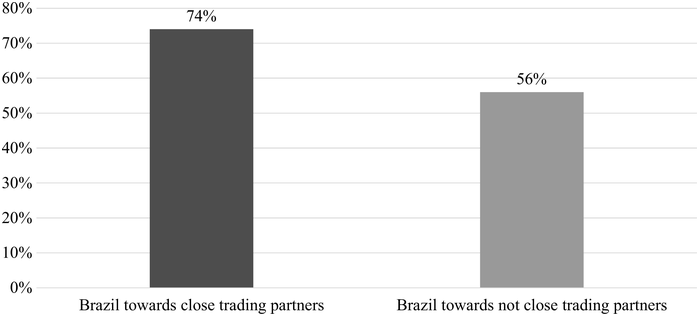
Figure 12.14 Share of protectionist interventions that use non-transparent measures by Brazil (MERCOSUR) towards close and not close trading partners (average 2009–2019).
When interpreting the comments of Brazil’s former chief agricultural trade negotiator, keep in mind that the country’s top trade partners are China, the US, and Argentina. In Figure 12.15, we see that Brazil’s close trading partners are less likely to deploy non-transparent measures towards Brazil, but that 85 per cent of such measures stem from its non-close trading partners. Although this former trade negotiator cautions that ‘it is usually more difficult for the Brazilian government to justify such barriers within MERCOSUR’, this does not mean that Brazil has refrained from leveraging non-transparent protectionist measures against its fellow PTA members. Together, the data in Figures 12.11–12.15 confirm the extent to which Brazil has painted itself into a messy protectionist corner.
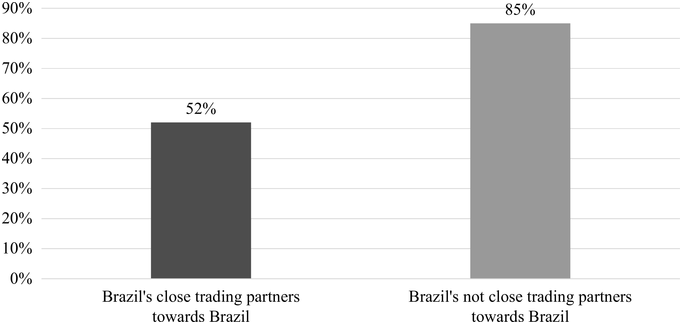
Figure 12.15 Share of protectionist interventions that use non-transparent measures towards Brazil (MERCOSUR) by close and not close trading partners (average 2009–2019).
12.4 Final Reflections
The Nobel Laureate Douglass North has consistently reminded us that development need not be ‘a story of inevitability in which the past neatly predicts the future’ (North Reference North1990, 98–99). And yet, for over thirty years, Brazil and Mexico have slogged away at trade policies that guarantee the tedious repetition of sub-par outcomes. In the best of all worlds, Brazil would open its market to RoW, continue to diversify its trade and investment partners, and test the waters outside of MERCOSUR. Uruguayan policymakers have done just this, stating that the pursuit of a PTA with China has become their main goal (Elliott Reference Elliott2022). With its rich factor endowments and solid industrial base, Brazil has the potential to realise much higher gains from trade. Mexico is another story. There, political and economic elites have kicked away Ha-Joon Chang’s (Reference Chang2003) ladder of state support and settled for a hands-off manufactured export-led development strategy that has delivered anaemic growth and negative per capita income returns.
Both Brazil and Mexico continue to struggle with low growth related cumulatively to the 2014 crash in commodity and oil prices, the pandemic, and erratic policy interventions. Mexico, in particular, is still reeling from some of the trade war tariffs imposed by the US regardless of NAFTA/USMCA. Amid tensions over the Russo-Ukrainian war, Brazil is straddling the need to maintain its strong bond with China. Since the early 2000s, Brazil is the Latin American country that has benefitted most from its trade and investment relationship with China. During the 2000s, Chinese FDI in Brazil started in the extractive sector, shifted to infrastructure, and is now moving into manufacturing. In 2022, for example, China’s Great Wall Motor Company purchased a Daimler auto manufacturing plant in Brazil, with plans to develop electric vehicles (EV) and batteries; Chinese electric automaker BYD also announced its intention to invest in factories in Brazil that process lithium and iron phosphate for EV batteries (Albright et al. Reference Albright, Ray and Liu2023, 15–16). Brazil will have the opportunity to engage in emergent GVCs around EVs and green energy. That is, if policymakers get this right and streamline MERCOSUR’s excessive tariffs and NTMs.
In the case of Mexico, despite the numerous PTAs it has signed with RoW, policymakers have done little to diversify away from the country’s dependence on the US market. Remarkably, the Biden administration maintained some of the first Trump administration’s trade war tariffs to the detriment of China, Mexico and RoW. With the November 2024 election of Trump to a second term, even higher tariffs are being threatened (Colvin and Gillies Reference Colvin and Gillies2024). Paradoxically, however, misguided US trade policies have opened trade and investment opportunities that Mexican policymakers should seize on. The relocation of Chinese manufacturers to Mexico and the PRC’s sourcing of Mexican intermediate inputs in lieu of US ones (Albertoni and Wise Reference Albertoni and Wise2021) has shed light on the potential relationship that Mexico could enjoy with China. Although unpredictable market forces have brought about this favourable turn of events, they will not sustain them. Rather, it is incumbent upon Mexican policymakers to deploy proactive public policies to nourish, deepen, and extend these promising ties with China. In the absence of a concerted strategy towards China and RoW, Mexico has little chance of becoming more than an upscale contract assembler, reaping lower value-added gains at the end of the ‘factory line’ (The Economist 2020, 1).


 Open access