To save content items to your account,
please confirm that you agree to abide by our usage policies.
If this is the first time you use this feature, you will be asked to authorise Cambridge Core to connect with your account.
Find out more about saving content to .
To save content items to your Kindle, first ensure no-reply@cambridge.org
is added to your Approved Personal Document E-mail List under your Personal Document Settings
on the Manage Your Content and Devices page of your Amazon account. Then enter the ‘name’ part
of your Kindle email address below.
Find out more about saving to your Kindle.
Note you can select to save to either the @free.kindle.com or @kindle.com variations.
‘@free.kindle.com’ emails are free but can only be saved to your device when it is connected to wi-fi.
‘@kindle.com’ emails can be delivered even when you are not connected to wi-fi, but note that service fees apply.
Climate change, urban expansion, and agricultural intensification are increasingly threatening the Netherlands’ in situ archaeological heritage, necessitating the use of advanced methodologies for effective detection, mapping, characterizing, and monitoring of archaeological sites. Over the past decade, significant advancements in sensor technologies for remote sensing and geophysics have emerged that offer more effective, noninvasive solutions in both terrestrial and maritime contexts. Despite their potential, the application and integration of these techniques in Dutch archaeological heritage management remain limited. The ARCfieldLAB project, launched in September 2022 as part of the European Research Infrastructure for Heritage Science, aims to bridge this gap. Its aims are to create a digital platform to disseminate knowledge on innovative sensor technologies, establish a network of archaeological practitioners and sensor specialists, and support multisensor case studies. It has generated strong enthusiasm for this initiative and for cross-disciplinary collaborations on national and international scales. Key challenges include the need for integration into the official Dutch archaeology quality standard protocols and the requirement of metadata standards and data archiving guidelines. Addressing these issues will require continuous investment and a long-term commitment but will have a significant positive impact on the effectiveness and quality of Dutch archaeological fieldwork.
Archaeological evidence suggests that the transition to food-producing economies in the Western Valleys of northern Chile led to a decline in foraging in highland areas around AD 650, yet colonial records from the sixteenth and eighteenth centuries attest to the continued existence of foraging groups. Taking the Camarones River Basin as a test case, this study identifies small-scale settlements and hunting installations in upland areas using remote-sensing data. In considering these new data alongside ethnohistorical accounts, the author proposes that foraging endured into the late colonial era, possibly coexisting with herder and agropastoral communities and precipitating tethered settlement patterns.
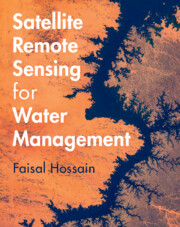
This textbook reflects the changing landscape of water management by combining the fields of satellite remote sensing and water management. Divided into three major sections, it begins by discussing the information that satellite remote sensing can provide about water, and then moves on to examine how it can address real-world management challenges, focusing on precipitation, surface water, irrigation management, reservoir monitoring, and water temperature tracking. The final part analyses governance and social issues that have recently been given more attention as the world reckons with social justice and equity aspects of engineering solutions. This book uses case studies from around the globe to demonstrate how satellite remote sensing can improve traditional water practices and includes end-of-chapter exercises to facilitate student learning. It is intended for advanced undergraduate and graduate students in water resource management, and as reference textbook for researchers and professionals.
The mixture of icebergs and sea ice in tidewater glacier fjords, known as ice mélange, is postulated to impact iceberg calving directly through physical buttressing and indirectly through freshwater fluxes altering fjord circulation. In this contribution, we assess the textural characteristics of ice mélange in summer and winter at the terminus of Helheim Glacier, Greenland, using high resolution (1-3 m) X-band Synthetic Aperture Radar (SAR) imagery from the ICEYE small satellite constellation. The Grey Level Co-occurrence Matrix (GLCM) and statistical variations in pixel intensity downfjord reveal structural zoning within the mélange matrix in both summer and winter. The boundary between these zones represents the transition between ice concentrations, demonstrating structural weaknesses in the mélange that may persist throughout the year. Furthermore, we compare two iceberg segmentation methods, texture-based vs the Segment Anything Model (SAM). Both techniques detect large (> 0. 1 km2) icebergs in summer when pixel variations are larger, but SAM has high iceberg detection accuracy in both seasons. The detected icebergs stabilise near concentration boundaries in the mélange, suggesting they act as the nucleus of mélange zones and control matrix stability. Our study demonstrates the potential for using high-resolution ICEYE SAR imagery for studying dynamic processes in glaciology and beyond.
Using ICESat-2 and ArcticDEM strips we track height change in a glacial basin in northern Ellesmere Island Canada. The surface topography dips towards the middle of the basin and ArcticDEM differences show a 1–3 m increase in 2020 summer surface height over an area of 8–10 km2. ICESat-2 heights confirm that each melt season (2019–2024), the height change of melt water at the basin edge matches that over ice in the basin middle. The summer height increase happens at the same time as an upstream drop in surface elevation suggesting yearly episodic subglacial water movement from upstream to a downstream subglacial lake. Melt water drainage occurs in the fall to a particular elevation and apparently follows a path at the northern edge of the basin. These data illustrate subglacial melt water movement both spatially and temporally in rarely obtained detail and are consistent with data from two NASA IceBridge passes.
In the previous chapter, we introduced ourselves to the importance of satellite remote sensing for water management and why the technique is going to take greater importance in years to come as challenges mount from climate change, competing needs and lack of ground data. In this chapter, we will overview the basics of remote sensing, define key concepts and terms. Using these concepts and terms, we will develop an understanding of the fundamental principle required for the success of remote sensing.
David T. Sandwell, Scripps Institution of Oceanography, University of California, San Diego,Xiaohua Xu, University of Science and Technology of China,Jingyi Chen, University of Texas at Austin,Robert J. Mellors, Scripps Institution of Oceanography, University of California, San Diego,Meng Wei, University of Rhode Island,Xiaopeng Tong, Institute of Geophysics, China Earthquake Administration,John B. DeSanto, University of Washington,Qi Ou, University of Edinburgh
Chapter 1 discusses six types of remote sensing methods possible from Earth’s orbit and introduces radar interferometry as the optimal approach for measuring small surface deformation.
This is the first chapter of the book. The goal of this chapter is to introduce ourselves to the growing importance of using satellite remote sensing to manage our water. We will try to understand this in the context of the underlying challenges and new global forces shaping up this century that are expected to make traditional ways of managing water using in-situ data more challenging.
This study introduces a custom implementation of the Ensemble Kalman Filter (EnKF) for calibrating a three-dimensional glacier evolution model. The EnKF can assimilate observations as they become available and provides uncertainty measures for the initial state after calibration. We calibrate an elevation-dependent surface mass balance (SMB) model using elevation change observations and test the EnKF’s performance in a Twin Experiment by varying internal and external hyperparameters. The best-performing configuration is applied to the Rhône Glacier in a Real-World Experiment. Using satellite-based elevation change fields for calibration, the EnKF estimates an average equilibrium line altitude of $2920 \pm 37$ m for the period 2000–19. A comparison of the results with glaciological measurements demonstrates the capabilities of the EnKF to simultaneously calibrate multiple SMB parameters. With this proof of concept, we expect that our methodology is readily extendable to other map or point observations and their combination, as well as to other calibration parameters.
Continuous monitoring of the mass balance of the Greenland ice sheet is crucial to assess its contribution to the rise of sea levels. The GRACE and GRACE-FO missions have provided monthly estimates of the Earth’s gravity field since 2002, which have been widely used to estimate monthly mass changes of ice sheets. However, there is an 11 month gap between the two missions. Here, we propose a data-driven approach that combines atmospheric variables from the ERA5 reanalysis with GRACE-derived mass anomalies from previous months to predict mass changes. Using an auto-regressive structure, the model is naturally predictive for shorter times without GRACE/-FO observations. The results show a high r2-score (> 0.73) between model predictions and GRACE/-FO observations. Validating the model’s ability to reproduce mass anomalies when observations are available builds confidence in estimates used to bridge the GRACE and GRACE/-FO gap. Although GRACE and GRACE-FO are treated equally by the model, we see a decrease in model performance for the period covered by GRACE-FO, indicating that they may not be as well-calibrated as previously assumed. Gap predictions align well with mass change estimates derived from other geodetic methods and remain within the uncertainty envelope of the GRACE-FO observations.
Macrophytes serve as indicators of aquatic ecosystem health and are often employed in monitoring the condition of water bodies. Traditionally, such observations are conducted in situ, but remote sensing offers a cost-effective and scalable alternative. Here, an algorithm for macrophyte detection using satellite data was created; we utilized clustering, with its results serving as target labels for building a machine-learning model. We developed a model for macrophyte identification using reflectance data in the near-infrared band during spring and summer. The derived algorithm, employing Sentinel-2 satellite reflectance data, enables the identification of open water, submerged and floating macrophytes and emergent macrophytes. This approach enhances the efficiency and applicability of macrophyte assessment, bridging the gap between field observations and remote sensing for comprehensive aquatic ecosystem monitoring.
Earth’s forests play an important role in the fight against climate change and are in turn negatively affected by it. Effective monitoring of different tree species is essential to understanding and improving the health and biodiversity of forests. In this work, we address the challenge of tree species identification by performing tree crown semantic segmentation using an aerial image dataset spanning over a year. We compare models trained on single images versus those trained on time series to assess the impact of tree phenology on segmentation performance. We also introduce a simple convolutional block for extracting spatio-temporal features from image time series, enabling the use of popular pretrained backbones and methods. We leverage the hierarchical structure of tree species taxonomy by incorporating a custom loss function that refines predictions at three levels: species, genus, and higher-level taxa. Our best model achieves a mean Intersection over Union (mIoU) of 55.97%, outperforming single-image approaches particularly for deciduous trees where phenological changes are most noticeable. Our findings highlight the benefit of exploiting the time series modality via our Processor module. Furthermore, leveraging taxonomic information through our hierarchical loss function often, and in key cases significantly, improves semantic segmentation performance.
This study explores the potential of applying machine learning (ML) methods to identify and predict areas at risk of food insufficiency using a parsimonious set of publicly available data sources. We combine household survey data that captures monthly reported food insufficiency with remotely sensed measures of factors influencing crop production and maize price observations at the census enumeration area (EA) in Malawi. We consider three machine-learning models of different levels of complexity suitable for tabular data (TabNet, random forests, and LASSO) and classical logistic regression and examine their performance against the historical occurrence of food insufficiency. We find that the models achieve similar accuracy levels with differential performance in terms of precision and recall. The Shapley additive explanation decomposition applied to the models reveals that price information is the leading contributor to model fits. A possible explanation for the accuracy of simple predictors is the high spatiotemporal path dependency in our dataset, as the same areas of the country are repeatedly affected by food crises. Recurrent events suggest that immediate and longer-term responses to food crises, rather than predicting them, may be the bigger challenge, particularly in low-resource settings. Nonetheless, ML methods could be useful in filling important data gaps in food crises prediction, if followed by measures to strengthen food systems affected by climate change. Hence, we discuss the tradeoffs in training these models and their use by policymakers and practitioners.
A key challenge in advancing slushflow management is the limited record of past incidents. Identifying their starting points and enhancing the quality of slushflow documentation are important in order to improve the regional early warning and develop slushflow numerical runout models and susceptibility maps. Here we investigate three major slushflow events at Kistrandfjellet, northern Norway and quantify the differences between registered slushflows in the national rapid mass movement database and the actual events. We use unique image datasets from the events in February 2021, January 2023 and January 2024, and identify slushflow starting points and flow paths. The curvature of the starting point locations is examined to assess how local topography influences slushflow release at the field site. Our mapping reveals 25 slushflows across the three events, whereas only five were registered in the database. For the 2021 event, we found six times as many slushflows as were officially registered. Comparison of our mapped slushflows to modeled drainage pathways and FKB-Vann (the official surface water dataset of Norway), yielded an average overlap of 35%. To improve slushflow management, we recommend establishing a standardized protocol for future data collection.
The addition and refreezing of liquid water to Greenland’s accumulation area are increasingly important processes for assessing the ice sheet’s present and future mass balance, but uncertain initial conditions, complex infiltration physics and limited field data pose challenges. Satellite-based L-band radiometry offers a promising new tool for observing liquid water in the firn layer, although further validation is needed. This paper compares time series of liquid water amount (LWA) from three percolation zone sites generated by a localized point-model, a regional climate model, in situ measurement, and L-band radiometric retrievals. LWA integrates the interplay of liquid water generation and refreezing, which often occur simultaneously and repeatedly within firn layers on diurnal, episodic, and seasonal scales offering insights into methods for measuring and modeling meltwater processes. The four LWA records showed average discrepancies of up to 62% nRMSE, reflecting shortcomings inherent to each method. Better agreement between series occurred after excluding the regional climate model record, lowering nRMSE to 8–13%. The agreement between L-band radiometry and other LWA records inspires confidence in this observational tool for understanding firn meltwater processes and serving as a validation target for simulations of water processes in Greenland’s melting firn layer.
In this paper, frontal variations and surface area changes for each of the years 2017–2023 are assessed for 277 Swedish glaciers, of which the majority is contained within the Randolph Glacier Inventory 7.0. Mapping of all Swedish glaciers became possible by combining Sentinel-2 imagery, semi-automated mapping procedures and the open-source Margin Change Quantification Tool (MaQiT). In addition, manual mapping was performed at a subset of 22 glaciers historically associated with the Swedish Front Variation Program. At four of those, mapping accuracy was assessed by contrasting Sentinel-2 mapped fronts to fronts mapped in situ using Global Navigation Satellite System (GNSS), a total station and an uncrewed aerial vehicle. Results show widespread retreat of all Swedish glaciers, with cumulative frontal variation amounting on average to −55.6 m during 2017–2023 or −9.3 m a−1. Swedish glaciers had a total area of ∼237 km2 in 2017 and of 210 km2 in 2023. The reduction by ∼27 km2 corresponds to a loss of 11% with respect to the areal extent in the year 2017 but varies across regions. It is also almost as large as the combined area loss of Swedish glaciers in the preceding 15 years (∼31 km2, 2002–2017).
The systematic investigation of individual glacier surges across a large statistical sample is key to a better understanding of surge mechanisms. This study introduces a consistent framework for identifying glacier surges from diverse remotely sensed datasets: NASA ITS_LIVE velocity fields, glacier thickness changes digital elevation models and surface roughness from SAR backscatter. We combined these diverse datasets using Gaussian process modelling and signal processing approaches to generate the first worldwide inventory of glaciers with active surges between 2000 and 2024, identifying 261 surge events on 246 glaciers. We performed validation against reference data and conducted a quantitative analysis of key surge metrics - surge duration and peak surface velocity. Our results confirm 12 surge-type glaciers in the Randolph Glacier Inventory (v7). We further evaluated climatological influences on the distribution of surge-type glaciers and assessed the predictive capabilities of existing theories for surges, including hydrological and thermal controls as well as the enthalpy balance theory. In addition, we present the first global analysis of velocity time series from individual surge events and discuss terminus-type dependent dynamics. Our findings strongly support the unified enthalpy balance theory in explaining the breadth of observed surge behaviours. Finally, we report new surge onsets in glaciers quiescent since the 19th century.
Sea surface salinity and temperature are essential climate variables in monitoring and modeling ocean health. Multispectral ocean color satellites allow the estimation of these properties at a resolution of 10 to 300 m, which is required to correctly represent their spatial variability in coastal waters. This paper investigates the effect of pre-applying an unsupervised classification in the performance of both temperature and salinity inversion. Two methodologies were explored: clustering based solely on spectral radiances, and clustering applied directly to satellite images. The former improved model generalization by identifying similar water clusters across different locations, reducing location dependency. It also demonstrated results correlating cluster type with salinity and temperature distributions thereby enhancing regression model performance and improving a global ocean color sea surface temperature regression model RMSE error by 10%. The latter approach, applying clustering directly to satellite images, incorporated spatial information into the models and enabled the identification of front boundaries and gradient information, improving global sea surface temperature models RMSE by 20% and sea surface salinity models by 30%, compared to the initial ocean color model. Beyond improving algorithm performance, optical water classification can be used to monitor and interpret changes to water optics, including algal blooms, sediment disturbance or other climate change or antropogenic disturbances. For example, the clusters have been used to show the impact of a category 4 hurricane landfall on the Mississippi estuarine region.
Globally, glaciers are changing in response to climate warming, with those that terminate in water often undergoing the most rapid change. In Alaska and northwest Canada, proglacial lakes have grown in number and size but their influence on glacier mass loss is unclear. We characterized the rates of retreat and mass loss through frontal ablation of 55 lake-terminating glaciers (>14 000 km2) in the region using annual Landsat imagery from 1984 to 2021. We find a median retreat rate of 60 m a−1 (interquartile range = 35–89 m a−1) over 1984–2018 and a median loss of 0.04 Gt a−1 (0.01–0.15 Gt a−1) mass through frontal ablation over 2009–18. Summed over 2009–18, our study glaciers lost 6.1 Gt a−1 to frontal ablation. Analysis of bed profiles suggest that glaciers terminating in larger lakes and deeper water lose more mass to frontal ablation, and that the glaciers will remain lake-terminating for an average of 74 years (38–177 a). This work suggests that as more proglacial lakes form and as lakes become larger, enhanced frontal ablation could cause higher mass losses, which should be considered when projecting the future of lake-terminating glaciers.