

Members of minority and Indigenous groups remain under represented in Western democracies (Carrière and Koop Reference Carrière and Koop2023; Denetclaw Reference Denetclaw2022; Evans and McDonnell Reference Evans and McDonnell2022; Josefsen Reference Josefsen2010).Footnote 1 The reasons for the underrepresentation of ethnic and religious minorities like African Americans and Muslims are well documented (Dancygier Reference Dancygier2018; Doherty et al. Reference Doherty, Dowling and Miller2019; Fraga et al. Reference Fraga, Juenke and Shah2020; Reny and Shah Reference Reny and Shah2018), but we know much less about Indigenous representation. Moreover, although the supply side, at least as regards parties and Indigenous candidates, has been investigated in several national settings (Evans and McDonnell Reference Evans and McDonnell2022; Maddison Reference Maddison2010; McMahon and Alcantra Reference McMahon and Alcantara2021; Xanthaki and O’Sullivan Reference Xanthaki and O’Sullivan2009), the demand side—public views about Indigenous people seeking election—remains almost entirely unexplored (Aguilar et al. Reference Aguilar, Hughes and Gell-Redman2019; Contreras and Morales Reference Contreras and Morales2018). Using two experimental surveys with nationally representative samples of 1,200 and 4,000 Australian adults, we examine how the racial and ethnic characteristics of potential candidates affect public perceptions.Footnote 2 Specifically, we ask: How do public evaluations of prospective Australian Indigenous candidates compare to those of other racial backgrounds?
We focus our analysis on Australia, a colonial-settler democracy with an Indigenous population that has endured a long history of political and social marginalization since colonization by the British beginning in 1788. A series of “frontier wars” were followed by an era of “protection,” aimed at segregating “full-blood” darker-skinned Indigenous people, and “assimilating” “half-caste” fairer-skinned Indigenous people, particularly children. It took until 1962 for all Indigenous people to be granted the option to enroll to vote in national elections and until 1983 for that enrollment to became compulsory (as it had been for other Australians since 1912). Indeed, it was only in 1967 that Indigenous people were first counted among the population of Australia. Today, Indigenous people make up 3.3% of the population and continue to suffer from lower-than-average socioeconomic status and education levels, discrimination by police and legal authorities, and significantly reduced life expectancy (Closing the Gap Reference Gap2020). Just 2 of 151 seats in the current House of Representatives of Australia’s federal parliament are held by Indigenous members. Overall, and while not dismissing the specificities of each experience, the traumatic social and political history of Aboriginal and Torres Strait Islander peoplesFootnote 3 in Australia thus resembles that of Indigenous populations in other settler democracies, such as Canada and the United States (Findling et al. Reference Findling2019; Sanchez and Foxworth Reference Sanchez and Foxworth2022). 4
Because the question of how Indigenous candidates are viewed by the public has not been examined at a national level in any country, we based our theoretical expectations on the large body of literature that points to a hierarchy of racial bias, with some groups more prejudiced against than others because of persistent stereotypes in society (Bleich Reference Bleich2009; Bonilla-Silva Reference Bonilla-Silva2004; Parmar Reference Parmar2020). 5 In Australia, where studies have shown that Indigenous people are more discriminated against than Whites and Asian Australians, we expected our study to reveal a hierarchy reflecting this experience (Forrest et al. Reference Forrest, Blair and Dunn2020). To our surprise, however, the experimental survey results indicate the opposite. In fact, when faced with people from different racial backgrounds, and/or of different skin tones, who are said to be doctors, active in the community, and seeking the nomination of the respondent’s preferred party, Australians rate the dark-skinned Indigenous versions of our potential candidate better than others. These findings, however, are moderated by ideology: dark-skinned Indigenous candidates fared poorer when evaluated by more right-wing respondents. Although our results may reflect a positive “violation of expectations” (Burgoon Reference Burgoon and Berger2015), with respondents “rewarding” people from a highly marginalized community for having achieved a position of high status, they nonetheless call into question scholars’ and party elites’ assumptions regarding public bias.
In the next section, we set out the theoretical background to our study and present our hypotheses. We then introduce the experimental surveys used to test these hypotheses. In the results section, we present the findings of our analysis. Finally, in the conclusion, we discuss the implications of our study and indicate paths for future research.
Aspirant Candidate Evaluations, Personality Traits, and the Hierarchy of Racial Bias
When evaluating an unknown person who is aspiring to stand for election, one of the key factors influencing citizens—other than party affiliations—is the perception of the prospective candidate’s personality traits. In theory, of course, one could infer personality traits by conducting close studies of potential candidates. However, the time this would require—not to mention the relative unimportance of politics to many people—means that they usually use heuristics (Costa and Ferreira da Silva Reference Costa and da Silva2015; McGraw Reference McGraw, Druckman, Greene, Kuklinski and Lupia2011). Chief among these are background and identity markers—physical appearance (including perceived attractiveness), race, gender, age, and occupation. Such attributes shape how people perceive candidates and their personalities, with judgments also based on stereotypes about different racial groups (Campbell and Cowley Reference Campbell and Cowley2014; Carnes and Lupu Reference Carnes and Lupu2016; Sanbonmatsu and Dolan Reference Sanbonmatsu and Dolan2009).
According to the stereotype content model (SCM), the composition of those stereotypes is relatively static and consists of two main dimensions: competence and warmth (Fiske et al. Reference Fiske, Amy, Glick and Xu2002). 6 The SCM posits that groups (and the individuals who comprise them) can be considered as “high” or “low” on the two stereotype dimensions, thereby creating a four-quadrant matrix: high competence–high warmth (HC–HW), high competence–low warmth (HC–LW), low competence–high warmth (LC–HW), and low competence–low warmth (LC–LW; Fiske et al. Reference Fiske, Amy, Glick and Xu2002; Lee and Fiske Reference Lee and Fiske2006). How we rate people in terms of these traits tends to reflect racial hierarchies. In Western countries, majority-White populations consider White people to be highly competent and warm. Conversely, they perceive racial minorities in less uniformly positive terms either with ambivalence or consistent negativity across the two dimensions. For example, in the United States, Asians are seen as competent but cold (HC–LW), and Latinos as incompetent but warm (LC—HW), whereas Arabs are stereotyped as both incompetent and cold (LC–LW; Cuddy et al. Reference Cuddy, Fiske, Glick and Zanna2008; Schofield et al. Reference Schofield, Suomi and Butterworth2022).
The constituent traits of the SCM’s two dimensions of competence and warmth influence public support for candidates and politicians (Bean and Mughan Reference Bean and Mughan1989; Funk Reference Funk1999; Hayes Reference Hayes2010; Ohr and Oscarsson Reference Ohr, Oscarsson, Aaarts, Blais and Schmitt2011). Parties therefore tend to select and position their candidates based on perceptions of being, among other things, intelligent (competence), hardworking (competence), compassionate (warmth), and trustworthy (warmth) while highlighting the absence of such traits in opponents (Druckman et al. Reference Druckman, Jacobs and Ostermeier2004; Kahn and Kenney Reference Kahn and Kenney1999). Whether party selectors believe prospective candidates exhibit these characteristics, as well as the extent to which the public will ultimately accept such campaign portraits, depends in part on racial and ethnic stereotypes (Doherty et al. Reference Doherty, Dowling and Miller2019; Lerman and Sadin Reference Lerman and Sadin2016; Van Trappen et al. Reference Van Trappen, Devroe and Wauters2020). Furthermore, the translation of these stereotypes into the political arena varies across racial and ethnic groups, creating a “racial hierarchy” in perceived candidate quality (Visalvanich Reference Visalvanich2017b).
Majority populations generally rate Indigenous people poorly across key personality traits. Indeed, unlike the examples of Asian Americans and Latinos discussed earlier, ambivalent or compensatory stereotyping, in which low ratings on one trait dimension may be offset by higher scores on another, rarely occurs. For example, Durante et al. (Reference Durante2013, 735) found that Australians of European descent associated Indigenous Australians with uniformly negative traits, translating into an LC–LW placement. 7 Likewise, Haslam and Wilson (Reference Haslam and Wilson2000) observed that Australian schoolchildren identified a cultural stereotype of Indigenous people dominated by negative characteristics. Such findings are not unique to Australia; First Nations, Métis, and Inuit Canadians are also routinely negatively stereotyped and perceived as lacking in competence and warmth traits (Kil et al. Reference Kil, Noels, Lascano and Schweickart2019; Werhun and Penner Reference Werhun and Penner2010, 899–900). However, we do not know how Indigenous people seeking to stand for election fit into this racial hierarchy of bias.
Our expectations are thus based first on the SCM and the racial hierarchy of public biases in Western democracies and then on what we know about attitudes toward people from Indigenous and other backgrounds in Australia (Balvin and Kashima Reference Balvin, Kashima, Bretherton and Balvin2012). Drawing on these data, we propose that, when asked to evaluate prospective candidates, Australians will rate White candidates as the most competent and warm, followed, in order, by those from Chinese backgrounds, light-skinned Indigenous candidates, and dark-skinned Indigenous candidates. Although we are open to the possibility that there may be variation in scores of competence and warmth among groups, we expect to find that, overall, White candidates are at the top and Indigenous candidates are ranked lowest (with dark-skinned Indigenous candidates at the bottom). These four steps of the racial hierarchy bias ladder give rise to our first three hypotheses. Let us examine these in turn.
Multiple studies have shown that, particularly when compared to White men, racial-minority candidates and immigrants are more likely to be given negative evaluations of personality traits by members of the predominant group in majority-White societies (Bobo Reference Bobo, Smelser, Wilson and Mitchell2001; Sigelman et al. Reference Sigelman, Sigelman, Walkosz and Nitz1995; Visalvanich Reference Visalvanich2017b; Williams Reference Williams and Barker1990). Although studies of bias in the United States dominate the literature, discriminatory stereotypes have also been found to shape public appraisals of ethnic minority and immigrant candidates in other Western democracies, such as the United Kingdom (Fisher et al. Reference Fisher, Heath, Sanders and Sobolewska2015; Martin and Blinder Reference Martin and Blinder2021) and Belgium (Van Trappen et al. Reference Van Trappen, Devroe and Wauters2020). Even though there has been no research done on whether Indigenous candidates are similarly discriminated against compared to White candidates, we do know that, beyond politics, Indigenous people are subject to discrimination from the broader Australian population (Balvin and Kashima Reference Balvin, Kashima, Bretherton and Balvin2012; Mellor Reference Mellor2003; Pedersen et al. Reference Pedersen, Clarke, Dudgeon and Griffiths2005). For example, Kamp et al. (Reference Kamp, Alam, Blair and Dunn2017, 72) reported that more than 10% of Australians expressed negative feelings about Indigenous people, whereas just under 3% did so about Anglo-Australians. More recently, the Australian Reconciliation Barometer reported in 2022 that 60 percent of Australian Indigenous people had experienced racial prejudice in the past six months. We therefore expect to find the following bias toward potential candidates of White and Indigenous backgrounds 8:
H1a. Indigenous prospective candidates will be evaluated as less competent than White prospective candidates.
H1b. Indigenous prospective candidates will be evaluated as less warm than White prospective candidates.
Of course, Aboriginal and Torres Strait Islanders are not the only non-White group in Australia to suffer from discrimination. Most notably, decades of state-based measures to reduce Chinese immigration in the late nineteenth century culminated in the 1901 Immigration Restriction Act and resultant “White Australia” Policy. 9 Although this policy ended in the 1970s, the enduring myth of an Asian migration “threat” (Fozdar Reference Fozdar2016) has combined in recent years with tensions between Australia and China and the emergence of COVID-19 in Wuhan to intensify discriminatory behavior toward the 1.4 million Australians with Chinese heritage (Hsu Reference Hsu2023, 5; Kassam and Hsu Reference Kassam and Hsu2021). 10 To investigate the extent to which a hierarchy of racial bias exists toward Indigenous prospective candidates that goes beyond the relationship between Indigenous and White candidates, we include Chinese Australian prospective candidates in our study. 11
Whereas White Americans often consider Asian Americans a “model minority” high in competence but low in warmth, White Australians instead stereotype Asian Australians as lacking warmth while also being of middling competence (Durante et al. Reference Durante2013, 735; Lin et al. Reference Lin, Virginia, Cheung and Fiske2005). Asian Australians are thus located between White and Indigenous Australians in a racial hierarchy of stereotyped traits. In line with this, Kamp et al. (Reference Kamp, Alam, Blair and Dunn2017, 72) found that just under 7% of Australians expressed negative feelings about Asian Australians compared to more than 10% who expressed prejudice against Indigenous Australians. Similarly, in a study of attitudes toward out-groups in Sydney, Forrest et al. (Reference Forrest, Blair and Dunn2020) observed that Asian Australians were more accepted than Indigenous people. 12 We therefore envisage the following:
H2a. Indigenous prospective candidates will be evaluated as less competent than Chinese Australian prospective candidates.
H2b. Indigenous prospective candidates will be evaluated as less warm than Chinese Australian prospective candidates.
Our third hypothesis investigates the effects of skin tones and associated colorism in the evaluations of Indigenous candidate traits. 13 There is remarkable consistency in the literature on colorism. Weaver (Reference Weaver2012, 160) explains, “Study after study has documented a strong association between phenotype and negative perceptions.… Darker-skinned, less Eurocentric-appearing blacks and Latinos are perceived as being less intelligent and attractive and more lazy, poor, and prone to violence.” Although most studies focus on interpersonal evaluations more broadly, similar results emerge from research on political candidates, including Weaver’s (Reference Weaver2012, 188) finding that darker skin “magnifies” the effects of race and intensifies stereotypes. Lighter-skinned minority candidates, meanwhile, can avoid some of the evaluative and electoral effects of racist stereotypes. These results align with studies of colorism and candidate evaluations in the United States (Chirco and Buchanan Reference Chirco and Buchanan2022; Terkildsen Reference Terkildsen1993), India (Ahuja et al. Reference Ahuja, Ostermann and Mehta2016), and Brazil (Aguilar et al. Reference Aguilar, Cunow, Desposato and Barone2015). We expect most respondents in Australia to follow these international trends in the effect of skin tone on group and interpersonal stereotyping. Furthermore, although skin color “can shift in importance over time, across context, and among groups” (Ostfeld and Yadon Reference Ostfeld and Yadon2022, 35), Australia has a long history of differentiated prejudicial treatment of Indigenous people, according to skin color. 14 We therefore hypothesize that
H3a. Lighter-skinned Indigenous prospective candidates will be evaluated as more competent than darker-skinned Indigenous prospective candidates.
H3b. Lighter-skinned Indigenous prospective candidates will be evaluated as warmer than darker-skinned Indigenous prospective candidates.
Our final hypothesis looks at what we envisage will be a key influence on respondents’ evaluations: their ideological self-positions. We know that certain personality traits that influence attitudes toward marginalized groups and minorities are associated with specific ideological positions. For example, left-wing people tend to display Openness to Experience, linked with support for social change and tolerance of diversity, whereas right-wing individuals are more associated with Conscientiousness, implying a reluctance to change and a greater acceptance of social inequality as natural (Chirumbolo and Leone Reference Chirumbolo and Leone2010; Cooper, Golden, and Socha Reference Cooper, Golden and Socha2013; Fatke Reference Fatke2017; Jost et al. Reference Jost, Glaser, Kruglanski and Sulloway2003). Relatedly, the ideological positions held by people have been shown to affect attitudes toward members of minority groups. For example, Radkiewicz (Reference Radkiewicz2016, 234) finds that “right-wing ideology predicts a considerable increase of out-group hostility in the case of ethnic prejudices.” Similarly, right-wing people are more likely to discriminate against racial- and ethnic-minority candidates (Besco Reference Besco2020; Martin and Blinder Reference Martin and Blinder2021; Portmann and Stojanović Reference Portmann and Stojanović2019), and left-wing parties usually put forward more minority candidates than do right-wing parties (Sobolewska Reference Sobolewska2013; Van der Zwan, Lubbers, and Eisinga Reference Van der Zwan, Lubbers and Eisinga2019). Notably, in Australia, the main left-wing party, Labor, has not only fielded more Indigenous candidates than the Liberal Party (the main party of the right) but it has also done so far more in winnable seats (Evans and McDonnell Reference Evans and McDonnell2022). Assuming this mixture of personality traits, ideological preferences, and party behaviors, we predict that respondents’ left–right placement will moderate the influence of prospective candidate shown on trait evaluations, so that
H4a. The more right-wing a respondent is, the poorer their evaluation of prospective Indigenous candidates’ competence.
H4b. The more right-wing a respondent is, the poorer their evaluation of prospective Indigenous candidates’ warmth.
Data and Methods
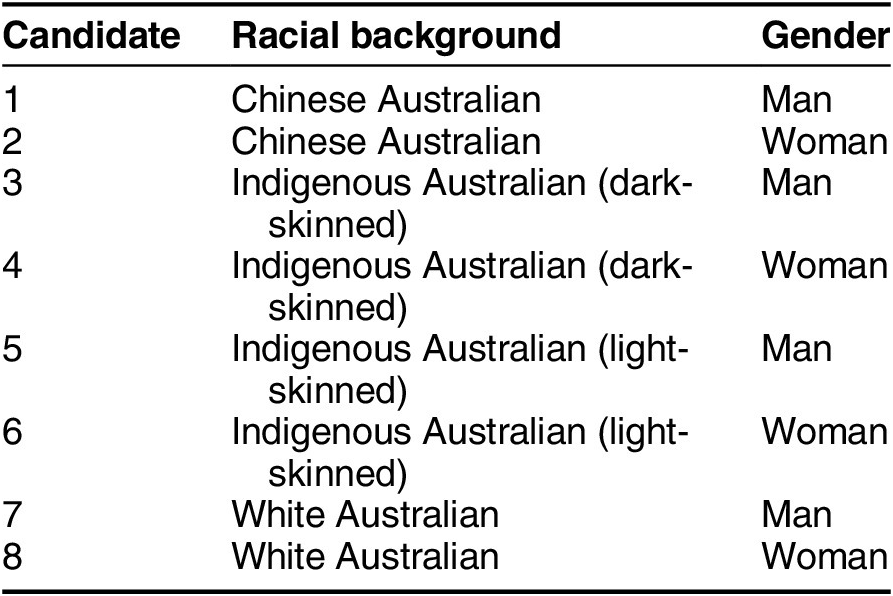
To investigate how the Indigeneity of prospective candidates affects their comparative evaluation, we adopted a multistage approach to conducting our main study, an experimental survey in which people would assess male and female potential candidates from Indigenous, Chinese, and White backgrounds. First, in late 2021 and early 2022, we worked with an Indigenous-owned and managed creative agency to find 24 models matching our candidate specifications in terms of race, skin tone, and broad age bracket. 15 Second, between May 30 and June 2, 2022, we conducted a nationally representative survey of 1,200 Australian adults to assess photos of those 24 models and help us choose 8 as potential candidates for the subsequent experimental survey (see table 1). In the latter, which was fielded from August 2–9, 2022, four thousand respondents were randomly presented with one of the eight candidates and asked to evaluate them. 16 Specifically, they saw a professional headshot photograph of someone hoping to stand for whichever party the respondent said they felt closest to, alongside a 135- to 140-word biography that was identical for each aspirant candidate, beyond references to racial background. 17
Table 1 Fictitious Prospective Candidates (Survey 2)

Our first challenge in the project therefore was to find eight fictitious prospective candidates. In doing so, we aimed to ensure that each candidate would credibly fit the same biography. Given that candidates can benefit from being considered good-looking (Praino, Stockemer, and Ratis Reference Praino, Stockemer and Ratis2014), we also needed ours to be of broadly similar levels of attractiveness. As mentioned, we recruited 24 models: three for each of the eight backgrounds described in table 1 from a list of suitable participants sourced through talent agencies in the state of Victoria and the Northern Territory. We recruited models, rather than using photos from existing face databases, for two reasons. First, databases such as the Chicago Face Database routinely exclude First Nations faces—and Indigenous Australians do not feature at all. Second, because these databases are designed for other research purposes, the photographs tend to be of people in casual attire, which would not be suitable for the prospective candidates in our study. After selecting our models, we conducted photo shoots, replicating the style of candidate headshots usually used for party political advertising (Hoegg and Lewis Reference Hoegg and Lewis2011). To reduce the influence of extraneous factors on later experimental findings, we kept the lighting, background, distance, photographic equipment, attire type, and model positioning as consistent as possible.
We then conducted our first survey: a nationally representative, split-sample survey. 18 Respondents were randomly assigned to evaluate three people, based on the headshots, ranking them against a series of criteria derived from our candidate biography. Random assignment was organized by candidate racial background. In other words, Respondent X was presented with photographs of three White Australian women, Respondent Y of three Chinese Australian men, and so on. Respondents were asked to rank the three potential candidates they were assigned in terms of their fit with key components of our candidate profile. They were also asked to estimate the age and level of attractiveness of each candidate and indicate which political party they thought would be most likely to select them.
The resulting data enabled us to narrow the 24 photographs down to the final 8 by using several predetermined exclusion and ranking criteria. First, we ruled out any participant with an average perceived age lower or higher than 35 to 55 years. 19 Second, we excluded any participant seen as disproportionately attractive or unattractive. Third, we compared an aggregate ranking comprised of the main candidate biographical characteristics, identifying any model with a statistically significant higher ranking in pairwise comparisons using Kendall’s W, with significance values adjusted by the Bonferroni correction. 20 Fourth, where the prior stages failed to identify a “winning” model, we compared mean rankings of the biographical characteristics individually, with our chosen candidate being the individual with the greatest tally of higher (i.e., more likely to fit our biography) mean rankings.
At the end of this process, we were ready to proceed with our second survey. 21 Our experimental stimuli presented respondents with one of the eight photos we had chosen, alongside a brief biography. Three main criteria guided the content and format of the biography:
-
1. It should be no more than 140 words so it could present neatly on a single device screen for survey respondents to read without scrolling (Mutz Reference Mutz2011, 87).
-
2. It should imitate real-world candidate information found on Australian political party websites and provide an experimental treatment, detailing a set of background characteristics held constant across each candidate (Burge et al. Reference Burge, Wamble and Cuomo2020).
-
3. It should be as politically “neutral” as possible, with no obvious indications of party affiliation, such as trade union membership or positions on matters other than valence issues, given our means of controlling for respondent partisanship that are explained later (McGraw Reference McGraw, Druckman, Greene, Kuklinski and Lupia2011, 189–90).
All prospective candidates were given names that could realistically be those of White Australian, Chinese Australian, or Indigenous candidates: the men were “David Lee,” and the women were “Melissa Lee.” 22 To reinforce the visual stimulus, we included short signifiers of racial background for candidates other than the White candidate controls; for example, referring to candidates as “Aboriginal man/Aboriginal woman” and “daughter” or “son of Chinese migrants.” However, all had identical descriptions of their employment, civil society activity, location, personal interests, family life, and motivations for entering politics. 23 This coupling of visual and text-based stimuli offers a stronger and more engaging treatment than text or images alone (Mutz Reference Mutz2011, 61, 86). The biography, with dynamic fields noted but excepting the racial cues mentioned earlier, read as follows:
[David/Melissa] Lee hopes to run as a [respondent party identification] candidate in your electorate at the next federal election. [David/Melissa] is a doctor but now wants to enter politics to ensure families and communities have greater say in the decisions affecting them. [David/Melissa] was the first in [his/her] family to attend university, and attributes [his/her] strong work ethic to [his/her] parents’ influence. [David’s/Melissa’s] father worked for decades as a tiler, and [his/her] mother was employed part-time in aged care. After completing [his/her] degree, [David/Melissa] worked for several years in emergency wards before establishing a GP practice in the area. [David/Melissa] has lived in the electorate for over ten years and is married with two children. [He/She] swims regularly for exercise and is an active member of local charity organizations.
As explained, we are interested in assessing public reactions to people who are thinking of running for election as opposed to actual candidates—those who decided to run and were selected by a political party to do so. This is because members of minority and Indigenous communities can face obstacles at that initial stage impede them from becoming a candidate. They may encounter what Bateson (Reference Bateson2020, 1069) terms “strategic discrimination” from party elites: “the belief that a candidate’s identity will cause other people not to donate, volunteer, or vote for him or her.” Indeed, according to the meta-analysis by van Oosten, Mügge, and van der Pras (Reference Van Oosten, Mügge and van der Pras2024, 25), underrepresentation of minorities (especially in the United States) is not so much due to voter prejudice as to “party selectors’ ideas about how white voters might react to racial/ethnic minority candidates.” By the same token, fears about public reactions may also be present in the minds of the aspirant candidates themselves during this phase. As Reny and Shah (Reference Reny and Shah2018, 1039) observe in the case of immigrants with nascent political ambition in the United States, “their perceptions of how their racial and immigrant identity will influence their electoral run often depress their ambition.”
Our fictitious political aspirants were therefore positioned as being at the preliminary stage of candidate emergence or, as we put it in the biography, they were “hoping to run” in the respondent’s constituency at the next Australian federal election. In casting a physician as our candidate, we align with the professionalized class makeup of the Australian Parliament (Yim and Carter Reference Yim and Carter2021). 24 Moreover, this enabled us to create a “most difficult” scenario for testing our hypotheses: namely, such is the extent of Indigenous discrimination in Australia, we might expect that even occupying a respected profession would not shield an Indigenous candidate from negative stereotypes. As figure 1 shows, candidates varied on racial background, gender and, in the case of Indigenous candidates, skin tone. Our between-subjects design in which survey respondents see just one candidate is a commonly used approach (e.g., Amira Reference Amira2018; Lerman and Sadin Reference Lerman and Sadin2016; Pedersen et al. Reference Pedersen, Dahlgaard and Citi2019). It has the advantage of reducing complexity and participant reading time, and—crucially for our purposes—lessens the likelihood of respondents realizing that the purpose of the research is to detect racial prejudice. It thus also diminishes the likelihood of results being shaped by social desirability bias (Mutz Reference Mutz2011, 56). We further mitigate the influence of social desirability bias by using a self-administered, anonymous, online survey mode with strict confidentiality assurances, precluding interviewer and bystander effects (Krumpal Reference Krumpal and Maggino2023).

Figure 1 Candidate Photographs
Note: From left to right, top to bottom: Chinese Australian man, Chinese Australian woman, dark-skinned Australian Indigenous man, dark-skinned Australian Indigenous woman, light-skinned Australian Indigenous man, light-skinned Australian Indigenous woman, White Australian man, and White Australian woman.
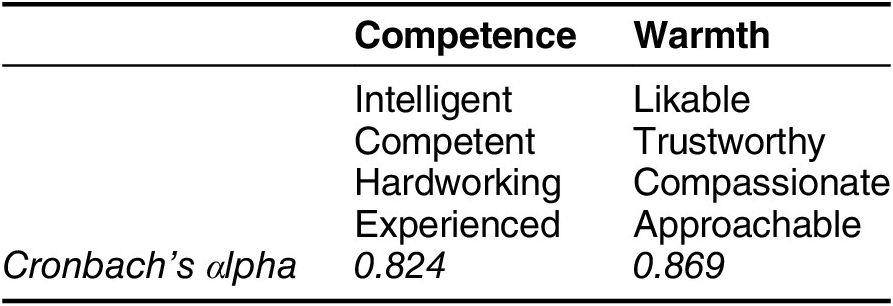
We tested our hypotheses using the two dimensions of the SCM: competence and warmth. The precise traits encompassed by these two dimensions vary across studies. Taking warmth as an example, Fiske, Cuddy and Glick (Reference Fiske, Amy and Glick2007, 77) subsume friendliness, trustworthiness, morality, helpfulness, and sincerity under this dimension, whereas Cuddy et al. (Reference Cuddy, Fiske, Glick and Zanna2008, 65) include good nature, tolerance, trustworthiness, and sincerity. Our operationalization, outlined in table 2, is guided by two main influences: (1) Bittner’s (Reference Bittner2011, chap. 3) review of election surveys and related political science literature and (2) practicality. We included those traits that could feasibly be assessed by survey participants based on facial features and a vignette, while limiting the number of traits to reduce survey complexity. Both dimensions show high internal consistency. In measuring candidate traits, survey respondents were asked this question—“Based on what you’ve seen about him/her, to what extent do you agree or disagree that the following words describe David/Melissa?”—and provided responses on a five-item Likert scale from strongly agree to strongly disagree.
Table 2 Traits and Operationalization of Competence and Warmth

Given the influence of party identification on how people view candidates (McGraw Reference McGraw, Druckman, Greene, Kuklinski and Lupia2011, 189), we accounted for partisanship when presenting our fictitious aspirant politicians. There are numerous ways this is done in the candidate evaluation literature, ranging from presenting each potential candidate multiple times with varied party affiliations to distinct subsamples to holding party affiliation constant or not stating the candidate’s party at all. Because we are concerned with public bias at the stage of potential candidate emergence, we use a variation of the first strategy. Namely, following Portmann (Reference Portmann2022), we present candidates as hoping to stand for the party with which the survey respondent most closely identifies. For instance, a respondent who had said they felt closest to Labor would be told that David or Melissa Lee was interested in running for Labor, whereas someone who had reported feeling closest to the Greens would be told David or Melissa Lee was interested in running for the Greens, and so on. When a respondent does not lean toward any particular party, the candidate profile makes no mention of which one the candidate is standing for.
Public Evaluations of Potential Candidates
This section sets out the findings of our experimental survey (Holloway, McDonnell, and Evans Reference Holloway, Duncan and Michelle2025). We assess first how candidates from different racial backgrounds and with different skin tones were viewed in terms of competence and then how they were seen in terms of warmth. 25 Hypotheses 1–3 center on the observed average differences between stimulus groups across the whole survey sample; that is, estimates of the causal effect of respondents exposed to varied candidates on evaluations of personality traits along dimensions of competence and warmth. We test for differences through comparisons of group means and one-way ANOVAs. 26 Our fourth hypothesis relates to the moderating effect of respondents’ ideological positions. We test for this with linear regression models incorporating an interaction between respondent self-placement on a left–right scale and the candidate stimulus shown.
Competence
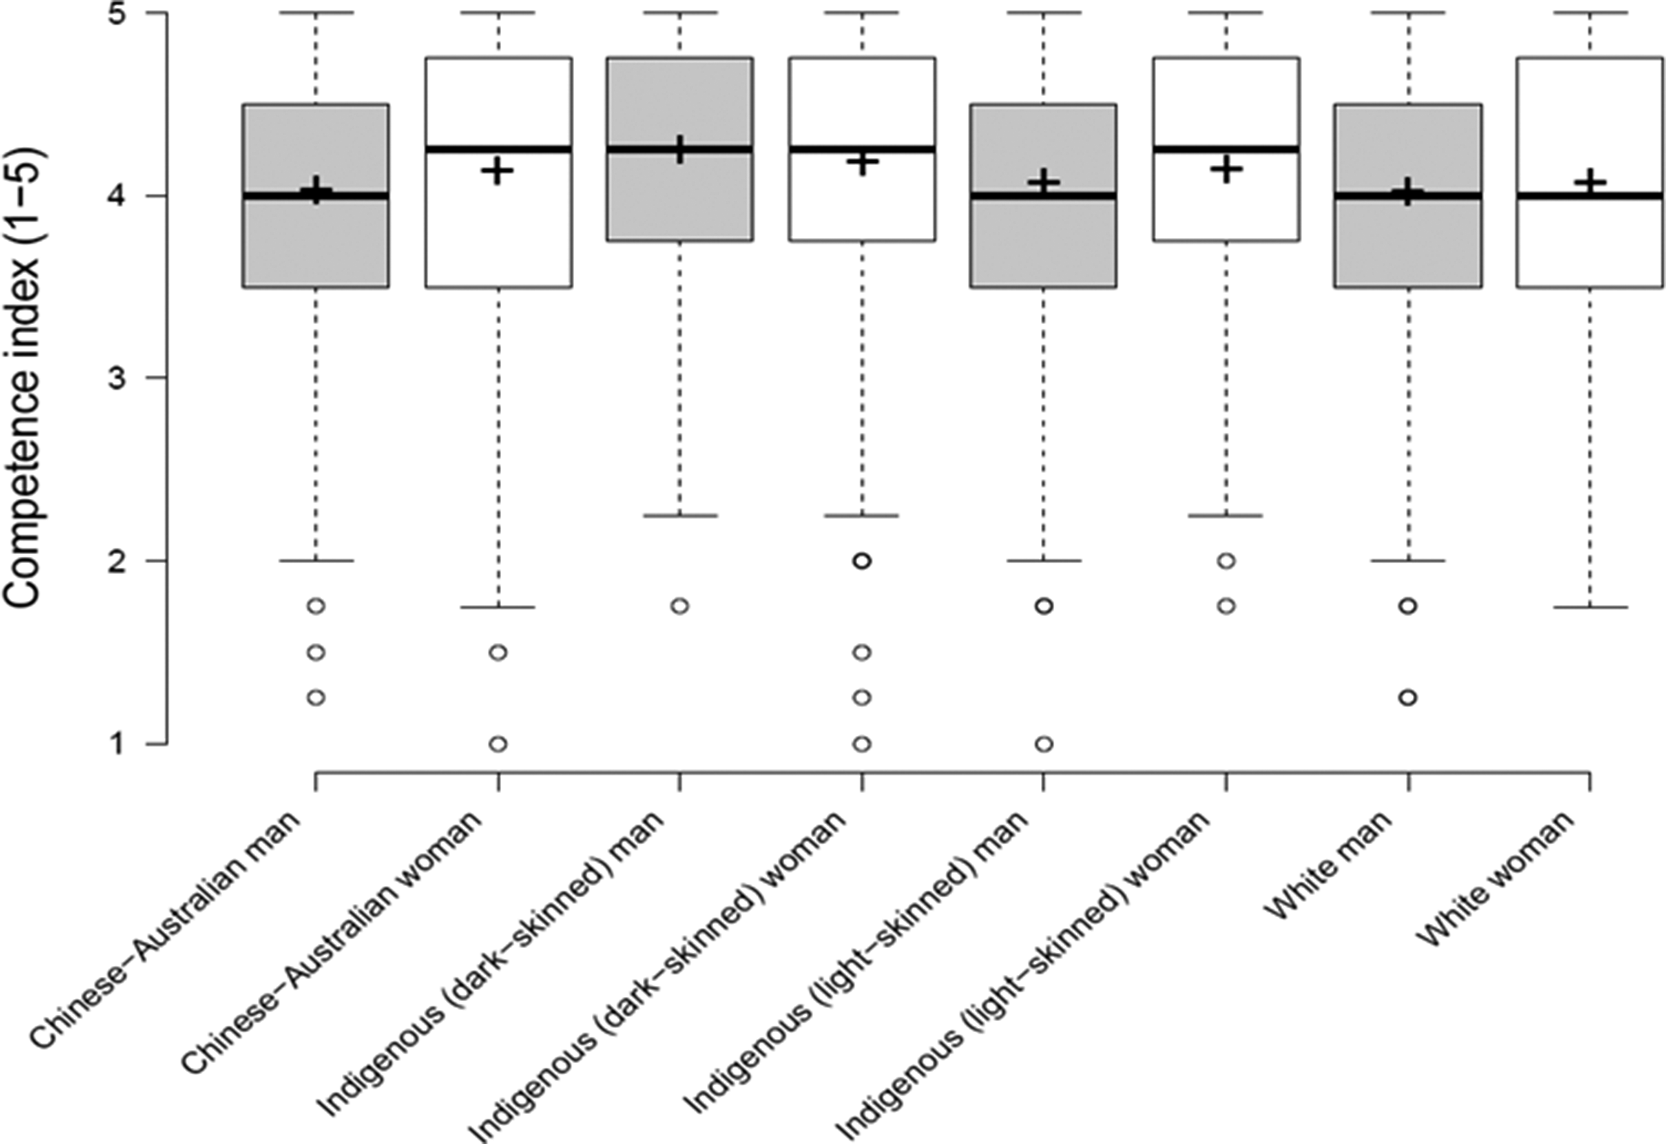
Although all potential candidates were viewed as highly competent in our additive index, as might be anticipated given their profiles, evaluations across the treatment groups differed markedly in ways we did not expect. The boxplot and comparison of means in figure 2 show that our candidate profile was typically perceived as more competent when coupled with a dark-skinned Indigenous Australian headshot, contrary to our first three hypotheses. There is also scant difference in the range of competence ratings for the dark-skinned Indigenous candidates. These results are striking compared to, for instance, the variance of evaluations seen between the Chinese Australian man and woman candidates. Differences in mean candidate perceptions are also noteworthy, with the largest gap found between the darker-skinned Indigenous candidates (4.22 man, 4.15 woman) and the White man (3.99). Indeed, despite the dominance of Australian legislatures by White men, it is this candidate background that fares worst in impressions of competence (although the Chinese Australian man does little better).

Figure 2 Boxplot and Comparison of Means: Competence Index (1–5)
Note: Means indicated with (+). Full table of means available in appendix E1. Results for men candidates are shaded. n = 3,914.
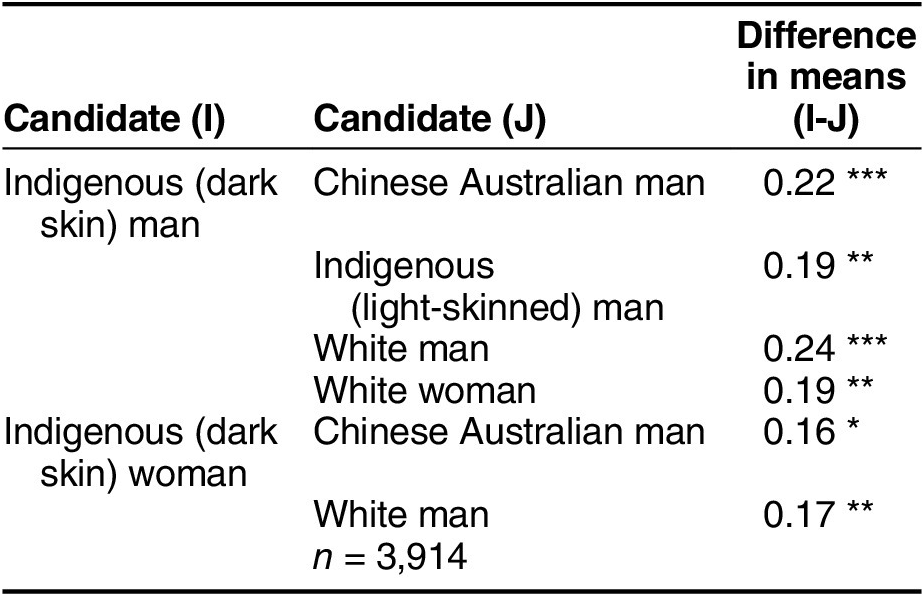
Table 3 presents the results of a one-way ANOVA with Tukey’s post hoc test. The table shows significant group variation across the candidate set (F(7, 3906) = 6.5, p < 0.001), but post hoc testing reveals that meaningful differences are fewer in pairwise comparisons. 27 The multiple comparisons section of the table shows only those results that met statistical significance thresholds. In reading candidate comparisons, values in the “Difference” column result from subtracting the mean evaluation of candidate ‘J’ from candidate ‘I’ (bolded). Only positive differences (in favor of candidate ‘I’) are included in the table, but there is of course a corresponding negative difference for each candidate ‘J’. Although the variance in means may appear small at first glance, it is important to recall that the scores collapse responses to four trait questions into a single index ranging from just 1–5, with treatment effects substantial enough to reveal between-group difference that “swamps” (Mutz Reference Mutz2011, 86) the in-group variance among the large split-samples of respondents.
Table 3 Multiple Comparisons (Tukey’s): Competence Index (1–5)

*p < 0.05,**p < 0.01, *** p < 0.001.
Table 3 emphasizes the clear aggregate perception of the higher competence of the dark-skinned Indigenous candidates, with significant differences in mean competence relative to most other candidate types, albeit, driven more so by the man. 28 Our analysis of views about competence thus elicits no support for H1a: neither of the two White candidates were evaluated more positively than any of the four Indigenous ones. Likewise, we find no clear support for H2a: little suggests that in the aggregate there exists a discernible hierarchy placing Chinese Australian candidates above Indigenous ones. Indeed, the Chinese Australian man is perceived as less competent than the dark-skinned Indigenous candidates, but not noticeably differently from either of the White ones. No significant differences exist between the Chinese Australian woman and the Indigenous or White aspirants in either direction. H3a is also not supported because no manifestation of colorism is apparent in the results. In fact, the lighter-skinned Indigenous man fares worse than the darker-skinned Indigenous man. 29 Finally, it is worth noting that there are no significant differences between Chinese Australian prospective candidates and white ones (see table E3 in the appendix), suggesting that our surprising results are less likely to be attributable to a simple social desirability explanation. In other words, if respondents were driven by a desire to seem unbiased, we would expect them also to favor the Chinese Australian candidates over White ones.
Hypothesis 4a investigates the potential moderation effect of respondent ideology. To test this, we examined the interaction of left–right placement and candidate racial background (and skin tone) in predicting results for perceived candidate competence. Table 4 presents a linear regression model incorporating these interaction effects, with left–right positions mean-centered. 30 The White man candidate is set as the reference category because of the preponderance of White men in Australia’s legislatures. The results show that, at the ideological midpoint, three of the four Indigenous potential candidates, plus the Chinese-Australian woman, receive significantly higher competence ratings relative to the White man. The positive coefficient for left–right placement indicates that right-leaning ideological placement is associated with higher competence ratings for the reference category (White man), but negative and significant interaction terms modify this effect for other candidates. For instance, the interaction between right-wing respondent placement and the Indigenous dark-skinned man candidate is negative and significant, pointing to the fact that as respondents move rightward ideologically, the perceived competence of this candidate diminishes. A similar pattern holds for the Indigenous dark-skinned woman, Indigenous light-skinned man, and Chinese Australian man.
Table 4 Linear Regression, Competence Index, Candidate x Left–Right Position

Note: n = 3,363.
*p < 0.05, **p < 0.01, *** p < 0.001.
A predicted values plot (figure 3) illustrates the interaction effects set out in table 4 and provides some support for H4a. 31 As respondents locate themselves further to the right ideologically, their evaluations of candidate competence demonstrate markedly divergent patterns depending on candidate racial background. Both the White man and woman see a pronounced increase in perceived competence as respondent ideology moves rightward. By contrast, the two dark-skinned Indigenous candidates experience a steady and similar decline the further right the respondent considers themselves. Interestingly, the light-skinned Indigenous woman candidate fares noticeably better among respondents who are right-wing. Overall, however, it is important to keep in mind that, regardless of these differences, dark-skinned Indigenous candidates are still, on average, rated as more competent than the White man.

Figure 3 Predicted Values: Competence Index (1–5), Left–Right Respondent Position
Warmth
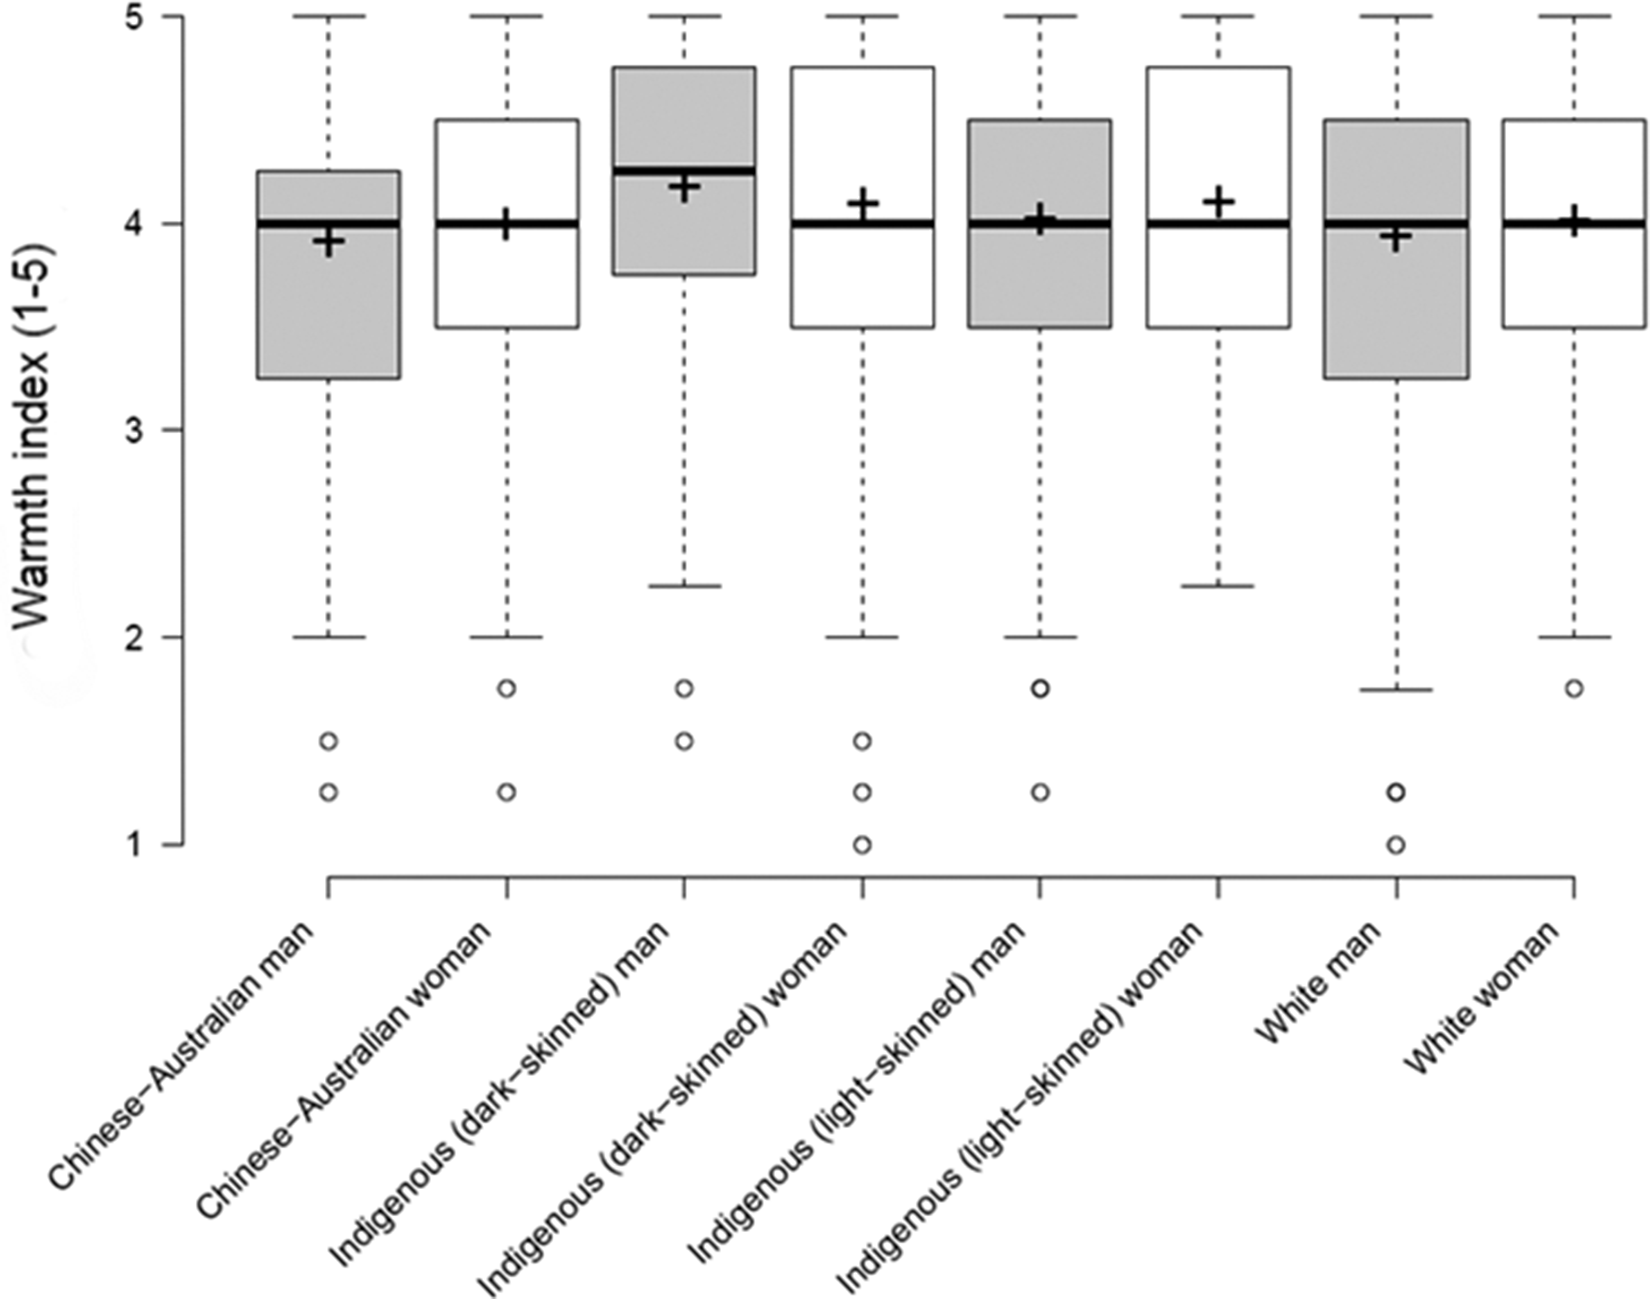
Dark-skinned Indigenous headshots coupled with our candidate profile also provoked notably higher evaluations of warmth, again contrary to our hypotheses. Figure 4 shows that, across the treatment groups, all potential candidates were seen as relatively warm. Given that respondents were presented with someone said to be embedded in the local community and working in a respected vocation, the generalized high scores across likeability, trustworthiness, compassion, and approachability are not surprising. Once more, there is a moderate spread in evaluations within groups, especially for the Indigenous women. Comparing group means, the Chinese Australian (3.88) and White Australian (3.9) men are seen as possessing decidedly less warmth than the dark-skinned Indigenous man (4.14) and woman (4.06), as well as the light-skinned Indigenous woman (4.07).

Figure 4 Boxplot and Comparison of Means: Warmth Index (1–5)
Note: Means indicated with (+). Full table of means available in Appendix E2. Results for men candidates are shaded. n = 3,914.
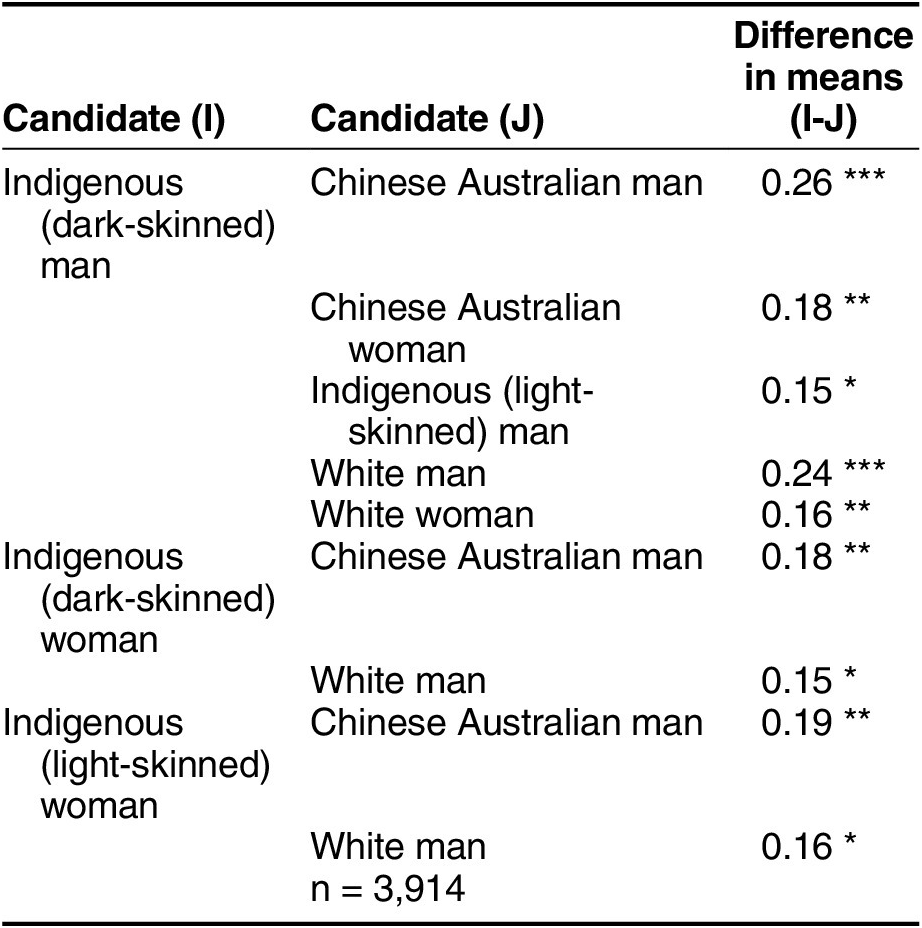
Turning to the results of the warmth index one-way ANOVA, we find statistically significant variation across groups (F(7, 3906) = 7.21, p = <0.001). 32 Tukey’s post hoc tests uncover significant differences in pairwise comparisons of candidate warmth—and, indeed, between more candidate comparisons than was found for the competence index (table 5). Notably, there is no support for H1b. White prospective candidates do not foster greater impressions of warmth relative to Indigenous ones; in fact, the results indicate the opposite in all but one of the four cases (the light-skinned Indigenous man). We find similar contraventions to H2b, though less pronounced for the Chinese Australian woman, who is only considered significantly less warm than the darker-skinned Indigenous man. Moreover, as with competence, the Chinese Australian candidates do not fare significantly better or worse than the White ones (see table E4 in the appendix). Again, as we noted in our discussion of the competence results, this absence of systematically higher ratings for the Chinese Australian candidates suggests that our results are less likely to be driven by social desirability bias. Finally, there is no support for H3b, with warmth evaluations for lighter- relative to darker-skinned candidates being either of no significant difference or, in the case of the Indigenous men, the darker-skinned candidate was considered warmer. In sum, three of our four Indigenous aspirant candidates outperform multiple others as regards warmth, particularly the White and Chinese Australian men. 33
Table 5 Multiple Comparisons (Tukey’s): Warmth Index (1–5)

*p < 0.05, **p < 0.01, *** p < 0.001.
Moving on to our fourth hypothesis about the moderation of evaluations of warmth by respondent ideology, table 6 presents linear regression results with interactions between candidate shown and left–right position. 34 Left–right position values are mean-centered, and the White man candidate is the reference category. The coefficients for the candidate categories show that, at the ideological midpoint, each candidate other than the Chinese Australian man has a positive effect on the warmth index relative to the White man. Statistical significance is reached for both dark-skinned Indigenous candidates and the light-skinned Indigenous woman. There is also a significant positive link between right-leaning ideological position and warmth for respondents evaluating the reference candidate (White man). Critically, however, the interaction terms again moderate this ideological effect, just as with competence. As respondents’ ideological self-position moves rightward, the warmth advantage of other candidates against the White man weakens, and for three of four Indigenous candidates and the Chinese Australian man, this relationship is statistically significant.
Table 6 Linear Regression, Warmth Index, Candidate x Left-Right Position

Note: n = 3,363.
*p < 0.05, **p < 0.01, *** p < 0.001.
Indeed, as the predicted values plot shows (figure 5), the warmth advantage for the dark-skinned Indigenous candidates in particular reverses as ideological placement moves rightward (although, as we noted previously regarding competence, it is still the case that, on average, Indigenous dark-skinned candidates are ranked higher than the White man). Overall, therefore, although the effect sizes are small, they do provide evidence in favor of H4b. 35

Figure 5 Predicted Values: Warmth Index (1–5), Left–Right Respondent Position
Before moving on to our conclusions, it is worth acknowledging at this point a few possible criticisms of our study and its findings. We cannot entirely rule out the possibility of social desirability bias affecting our results. However, there are several factors that suggest it may not be a significant influence. First, our survey experiment was anonymous, self-administered online, avoided direct candidate comparison, obscured the study’s purpose, and included strict confidentiality assurances—all research design features that are known to reduce this bias (Krumpal Reference Krumpal and Maggino2023; Larson Reference Larson2019). Second, socially desirable responses entail compliance with a perceived social norm, in our case most plausibly the “antiracism norm” (Ivarsflaten et al. Reference Ivarsflaten, Blinder and Ford2010). However, the absence in our results of significantly higher scores of competence and warmth for Chinese Australian candidates compared to white ones diminishes the likelihood that social desirability is driving our findings in any systematic way (especially given, as we discussed earlier, the strong prejudice that Chinese Australians have suffered not only historically but also in recent times). Third, if Indigenous candidates specifically benefited from social desirability bias, we would expect to see high appraisals of these candidates across all measures. Yet, when we asked our survey respondents also to evaluate candidate attractiveness, Indigenous candidates performed poorly (see appendix M). In fact, the dark-skinned Indigenous candidates both scored lower than the two White candidates. These findings run contrary to what one would expect if respondents were artificially boosting evaluations of Indigenous candidates in line with a perception of “socially desirable” responses. Finally, socially desirable survey responses on racial prejudice may be less of a concern than once thought. As Blair et al. (Reference Blair, Coppock and Moor2020, 1310) observe, “If anything, subjects overreport racist attitudes” under direct questioning. Relatedly, Australians holding negative attitudes toward Indigenous people have not previously shown any significant tendency to self-censor (Falls and Anderson Reference Falls and Anderson2022).
Additionally, a common criticism levied at survey experiments such as ours is that they are limited in their generalizability beyond the precise conditions tested. The strength of survey experiments rests more in their internal validity and capacity to reveal causal effects, and our experiment is indeed focused on a defined range of candidates and settings. At the same time, multiple aspects of our survey design bolster its external validity, including the large representative sample of survey respondents, random assignment to candidate group, the explicit nature of the stimuli set—although it is low-information, it resembles “real-world” candidate biographies, and its transparency allows for replication. Given these aspects, we are reassured that our findings do not stem from the survey experiment environment. Instead, we provide new insight into attitudes toward prospective minority candidates at a stage of candidate emergence where party gatekeepers’ (mis)perceptions of candidate appeal are often decisive (van Oosten et al. Reference Van Oosten, Mügge and van der Pras2024), and minorities’ aspirations to stand for elected office can be diminished both by their own and elites’ perceptions of public prejudice (McMahon and Alcantara Reference McMahon and Alcantara2021).
Conclusion
Public evaluations of people seeking election are said to be influenced by a racial hierarchy of bias, with some backgrounds preferred over others (Bobo Reference Bobo, Smelser, Wilson and Mitchell2001; Sigelman et al. Reference Sigelman, Sigelman, Walkosz and Nitz1995; Visalvanich Reference Visalvanich2017a; Reference Visalvanich2017b). However, until now, we did not know how Indigenous people aspiring to stand when fitted into this hierarchy. To investigate, we conducted a multistage study, which culminated in an experimental survey assessing public bias toward potential candidates among 4,000 adults in Australia, a long-standing democracy with an historically marginalized Indigenous population. Although we expected to find that Indigenous people hoping to run for office would fare worse than White and Chinese Australian ones and that darker-skinned Indigenous people would be more discriminated against than lighter-skinned ones, in fact we uncovered the contrary: an inverted hierarchy in which darker-skinned Indigenous aspirant candidates fared better than all others. Public bias toward Indigenous prospective candidates thus does exist, but, in our study, it favors, rather than penalizes, them. Conversely, the findings of the moderating influence of ideology aligned with our hypothesis, whereby dark-skinned Indigenous candidates fared poorer when evaluated by more right-wing respondents.
Although our overall results are surprising, it could be argued that they are the product of a positive “violation of expectations” (Burgoon 2015). As Sigelman et al. (Reference Sigelman, Sigelman, Walkosz and Nitz1995, 247) put it, when the conditions are right for the mechanism to occur, “a person with unexpectedly positive characteristics should be evaluated more favorably than a person with equally positive, but expected, characteristics.” Research in the United States has found evidence for this phenomenon in the case of Black job applicants (Jussim et al. Reference Jussim, Coleman and Lerch1987), whereas Sigelman et al. (Reference Sigelman, Sigelman, Walkosz and Nitz1995, 263) show that, in election situations, “certain types of black (and other minority) candidates find it easier, and others more difficult, to gain White support.” 36 In our study, when faced with physicians from an Indigenous background who were thinking of standing for election, our respondents may well have “rewarded” them for having achieved this position within mainstream society, despite the many challenges faced by Indigenous people in Australia. 37
Similarly, our findings can be understood through the “shifting standards model,” which posits that “the same traits can have very different meanings, depending upon the group membership of the target in question” (Biernat and Thompson Reference Biernat and Thompson2002, 130). It may thus be the case that our Indigenous candidates are considered competent and warm compared to respondents’ perceptions of other Indigenous people, and hence the opinions expressed are still underpinned by prejudice (i.e. encapsulated by such thinking as “she is very hardworking—for an Indigenous person”). Even if all this is true, however, the fact remains that highly qualified Indigenous prospective candidates fare better in our study than similarly highly qualified White and Chinese Australian ones. To investigate further why this is the case, future research could unpack the bases on which the traits of Indigenous, relative to White and ethnic minority, potential candidates are judged.
Our study has several theoretically, empirically, and societally important findings. As regards the first, it suggests that the racial hierarchy of bias may not work as expected in the case of Indigenous aspirant candidates. Our results therefore indicate the need for greater caution when theorizing how the public will react when faced with Indigenous and other potential candidates from minority backgrounds. As we have seen, the hierarchy can be inverted in certain conditions. Of course, our findings are based only on Australia, and it remains an open question how generalizable they are. Future research could conduct similar studies investigating the presence of hierarchies of bias in other democracies with Indigenous, White, and ethnic minority populations, such as the United States, Canada, New Zealand, and Sweden. Indeed, any investigation of attitudes toward Indigenous people considering entering politics in countries other than Australia would be welcome. This speaks to the empirical contribution of our study, which is the first anywhere to examine national-level bias toward Indigenous aspirant candidates.
We have thus brought a new, non-majority group into this field of study. Moreover, we have done so in a country where the marginalization of Indigenous people from the political system not only has a vexed history but also remains at the forefront of public debate. 38 Although, as mentioned, we cannot assume that the same dynamics we found in Australia are present in other settler democracies, it could be the case, as van Oosten et al. (Reference Van Oosten, Mügge and van der Pras2024) find regarding ethnic minority candidates, that public prejudice toward aspirant Indigenous candidates has been overestimated in other countries too and that the primary causes of underrepresentation instead lie in supply-side factors.
That leads us, finally, to the societal contribution of our findings that, we hope, will encourage party officials and power brokers to put aside considerations stemming from strategic discrimination (Bateson Reference Bateson2020) and not to presume that Indigenous candidates will be met with negative voter evaluations, particularly from the majority White population.Footnote 39 Or, as van Oosten et al. (Reference Van Oosten, Mügge and van der Pras2024, 35) observe when discussing minority candidates, “Party selectors need not fear electoral pushback as much as they do.” As our study has shown, if parties in Australia put forward Indigenous candidates from professional backgrounds, they will have a good chance of being positively evaluated by the public. Although doing so would exacerbate the socioeconomic unrepresentativeness of parliamentary institutions (Per Capita Reference Capita2022), at the same time it would lead to greater representation of Indigenous people and contribute to a less racially hierarchical democracy.
Acknowledgments
We extend our thanks to the 24 models who agreed to participate in this study, as well as the Indigenous Australian business, Little Rocket, who worked with us to source and photograph these models. We would like to thank the following colleagues for comments on previous versions of this article: Sofia Ammassari, Max Grömping, Osbern Huang, Ferran Martinez i Coma, and Lee Morgenbesser. Thanks also to the journal’s editors and reviewers for their constructive criticism. We acknowledge Kaurna, Wurundjeri, Wiradjuri, Jagera, and Turrbal People and Countries on which we live and work, their ancestors, elders and knowledges.
Data Replication
Data replication sets are available in Harvard Dataverse at: https://doi.org/10.7910/DVN/ATSAKJ.
Funding
This research was supported by the Australian Research Council [grant number IN170100036].


 Open access