


The prevalence of diet-related non-communicable diseases (DR-NCD) in India has been increasing over the years(Reference Dandona, Dandona and Kumar1). Approximately 65·9 % of deaths in India in 2019 were attributed to NCD, with diet-related factors contributing substantially to the burden of diseases such as type 2 diabetes, CVD and certain cancers(2,3) . Projections indicate that the overall percentage share of DR-NCD in India will increase to 58 % by the year 2051, which will further add to the health expenditures(Reference Barik and Arokiasamy4). Consecutive rounds of National Family Health Surveys in India show rising trends of obesity and DR-NCD(Reference Singh, Agrawal and Tripathi5). Over the years, the prevalence of overweight or obesity has risen to 24 % from 20·7 % among women and to 22·9 % from 18·9 % among men(6,7) . One of the biggest causes of increased DR-NCD among adults is the overconsumption of energy-dense and nutrient-poor diets(8).
Nutrition transition in India is witnessing a shift in dietary patterns as people are drifting away from fresh and minimally processed foods and traditional home-cooked food to processed, packaged and ultra-processed foods that are often high in fat, sugar, salt and other ingredients such as cosmetic additives, preservatives and components that are not used in household-level culinary practices(Reference Raza, Kalaivani and Ramachandran9–11). The limited data on dietary intake at the population level in India(12) show a deficiency of essential food groups such as pulses, milk and milk products, fruits and vegetables, whereas consumption data of packaged foods such as chips, biscuits, chocolates, sweets and sugar-sweetened beverages show an increasing trend(13). The Euromonitor (2020) data show that the overall per capita sales of packaged and processed foods in India nearly doubled from USD 31·3 in 2012 to USD 57·7 in 2018, with its consumption not being restricted to metropolitan cities but also spreading to smaller cities of the country(14,Reference Baker, Machado and Santos15) .
Different terminology has been applied to capture this range of packaged and processed foods, including junk foods, foods that are high in fat, sugar and salt, processed foods and ultra-processed foods (UPF). According to the Nova food classification system that categorises foods based on the purpose and the level of processing, UPF are a category of foods that undergo a series of industrial processes such as extrusion and moulding and have the presence of classes of additives such as flavours, flavour enhancers, colours, emulsifiers, thickeners and sweeteners whose function is to make the final product hyperpalatable or more appealing, Although not unique to UPF, they often include additives that prolong the product duration (shelf life) and protect original properties or prevent the proliferation of microorganisms(Reference Monteiro, Levy and Claro16–Reference Monteiro, Cannon and Lawrence19). Ready-to-consume packaged products like carbonated soft drinks and extruded snacks such as chips, chocolates, confectionery, ice creams and desserts, bread, spreads, biscuits, cakes, breakfast cereals, fruit drinks, pre-prepared ready-to-cook foods, instant soups and noodles are some common UPF(Reference Monteiro, Cannon and Lawrence19). These foods often present nutrient-poor profiles (e.g. high in fat, sugar and salt and low in dietary fibre, micronutrients and vitamins) and may have potential contaminants from packaging material and processing(Reference Monteiro, Cannon and Levy18). Dietary patterns rich in UPF have been associated with increased rates of obesity, development of DR-NCD such as dyslipidaemias, high blood pressure, hyperglycemia and premature mortality globally(Reference Baker and Friel20–Reference Srour, Fezeu and Kesse23). India is experiencing a ‘double burden of malnutrition’(Reference Escher, Andrade and Ghosh24,Reference Sahiledengle and Mwanri25) indicating the coexistence of undernutrition and overnutrition (overweight and obesity) with a rise in DR-NCD. In such a scenario, it becomes imperative to first develop a tool to systematically assess UPF consumption and then understand its role in increasing the burden of DR-NCD and all forms of malnutrition.
Despite a growing body of evidence supporting the amplified dietary share of UPF as a potent indicator of poor diet quality,(Reference Liu, Steele and Li26,Reference Shim, Shim and Cha27) there is a lack of comparable data on UPF consumption across contexts and over time, especially in low- and middle-income countries. National-level data are not readily available because assessing the dietary contribution of UPF using quantitative 24-h dietary recall or semi-quantitative food frequency data is expensive and time consuming(Reference Steinemann, Grize and Ziesemer28). Thus, the development of a simple and quick dietary screener with a low respondent and researcher burden for estimating UPF consumption across countries is essential(Reference Costa, Faria and Gabe29). One such dietary screener has been developed in Brazil(Reference Costa, Faria and Gabe29) called the ‘Nova-UPF Screener (for Brazil)’, which uses the Nova food classification(Reference Monteiro, Cannon and Lawrence19).
The present study aimed to adapt and validate a tool called the ‘Nova-UPF Screener (for India)’. The key output of the study was a validated screener in Hindi and English that would use a scoring system to quantify the individual-level UPF consumption among Indian adult consumers.
Methods
Study design
The screener developed during the formative phase(Reference Ghosh-Jerath, Khandpur and Kumar30) was presented to domain experts during six online consultations using purposive sampling for content validation. Following this, the revised screener was finalised in English language and translated into Hindi language for face and concurrent criterion validation using a cross-sectional survey.
Development of the Nova-UPF Screener (for India)
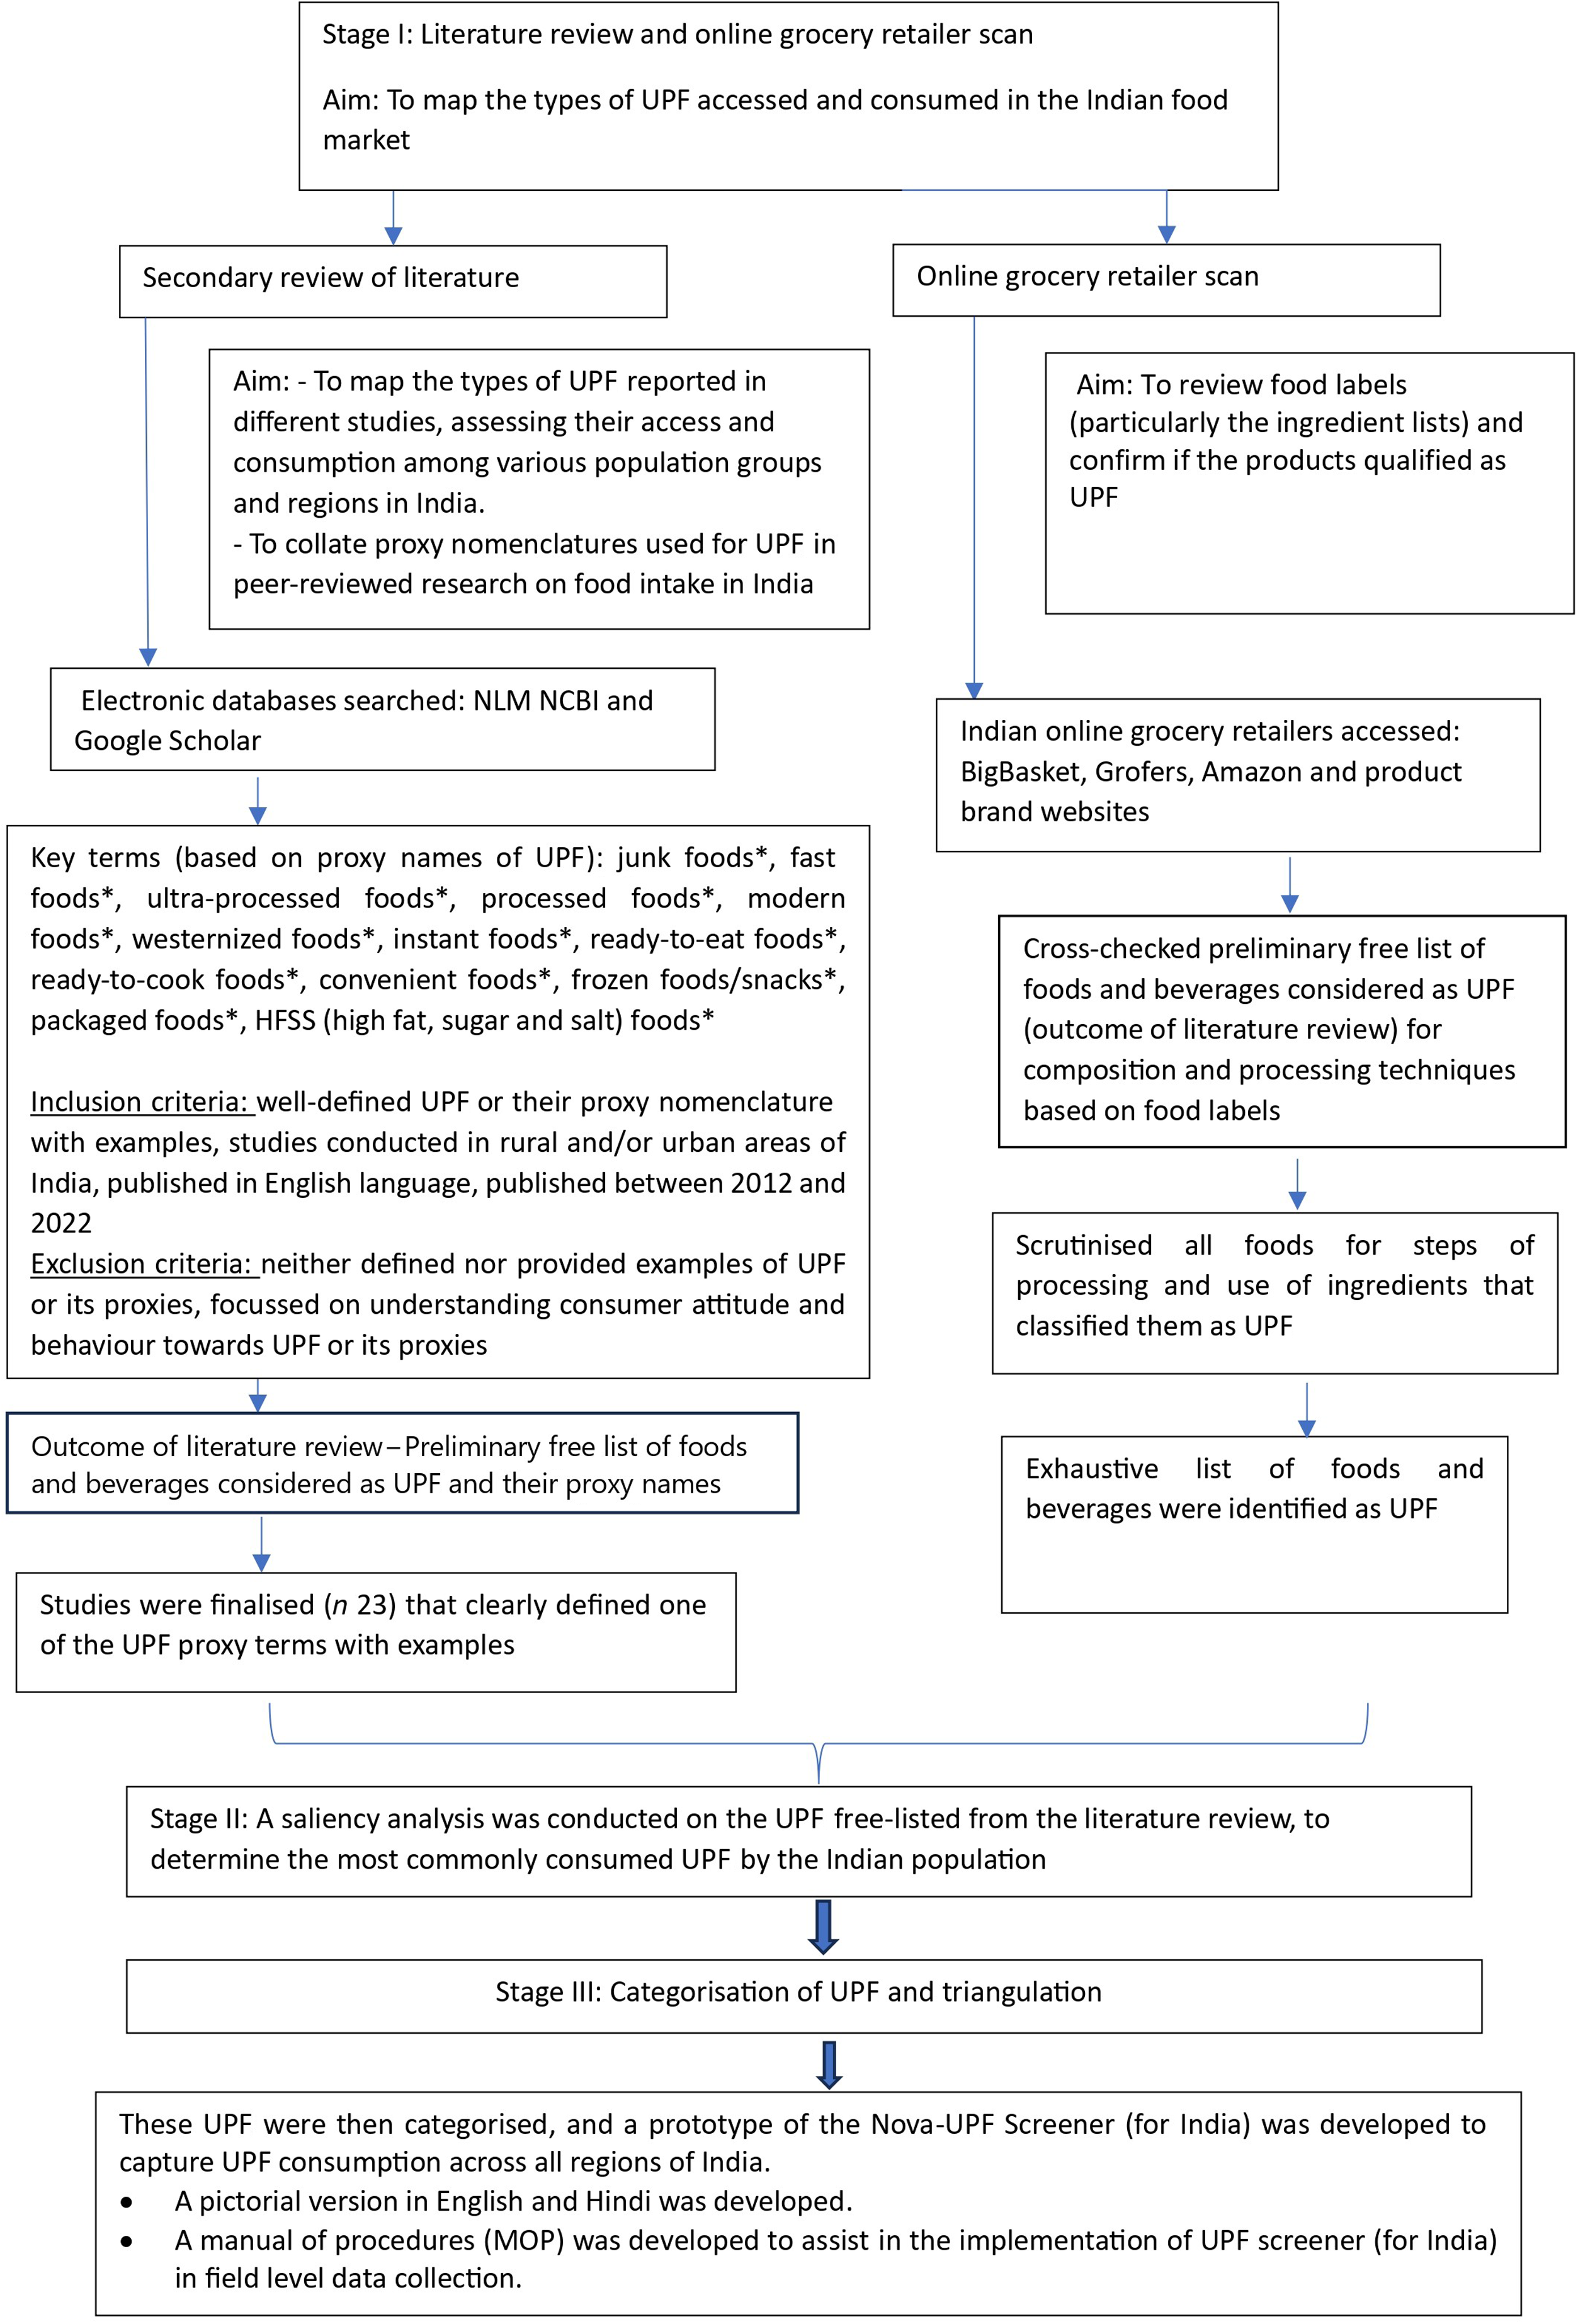
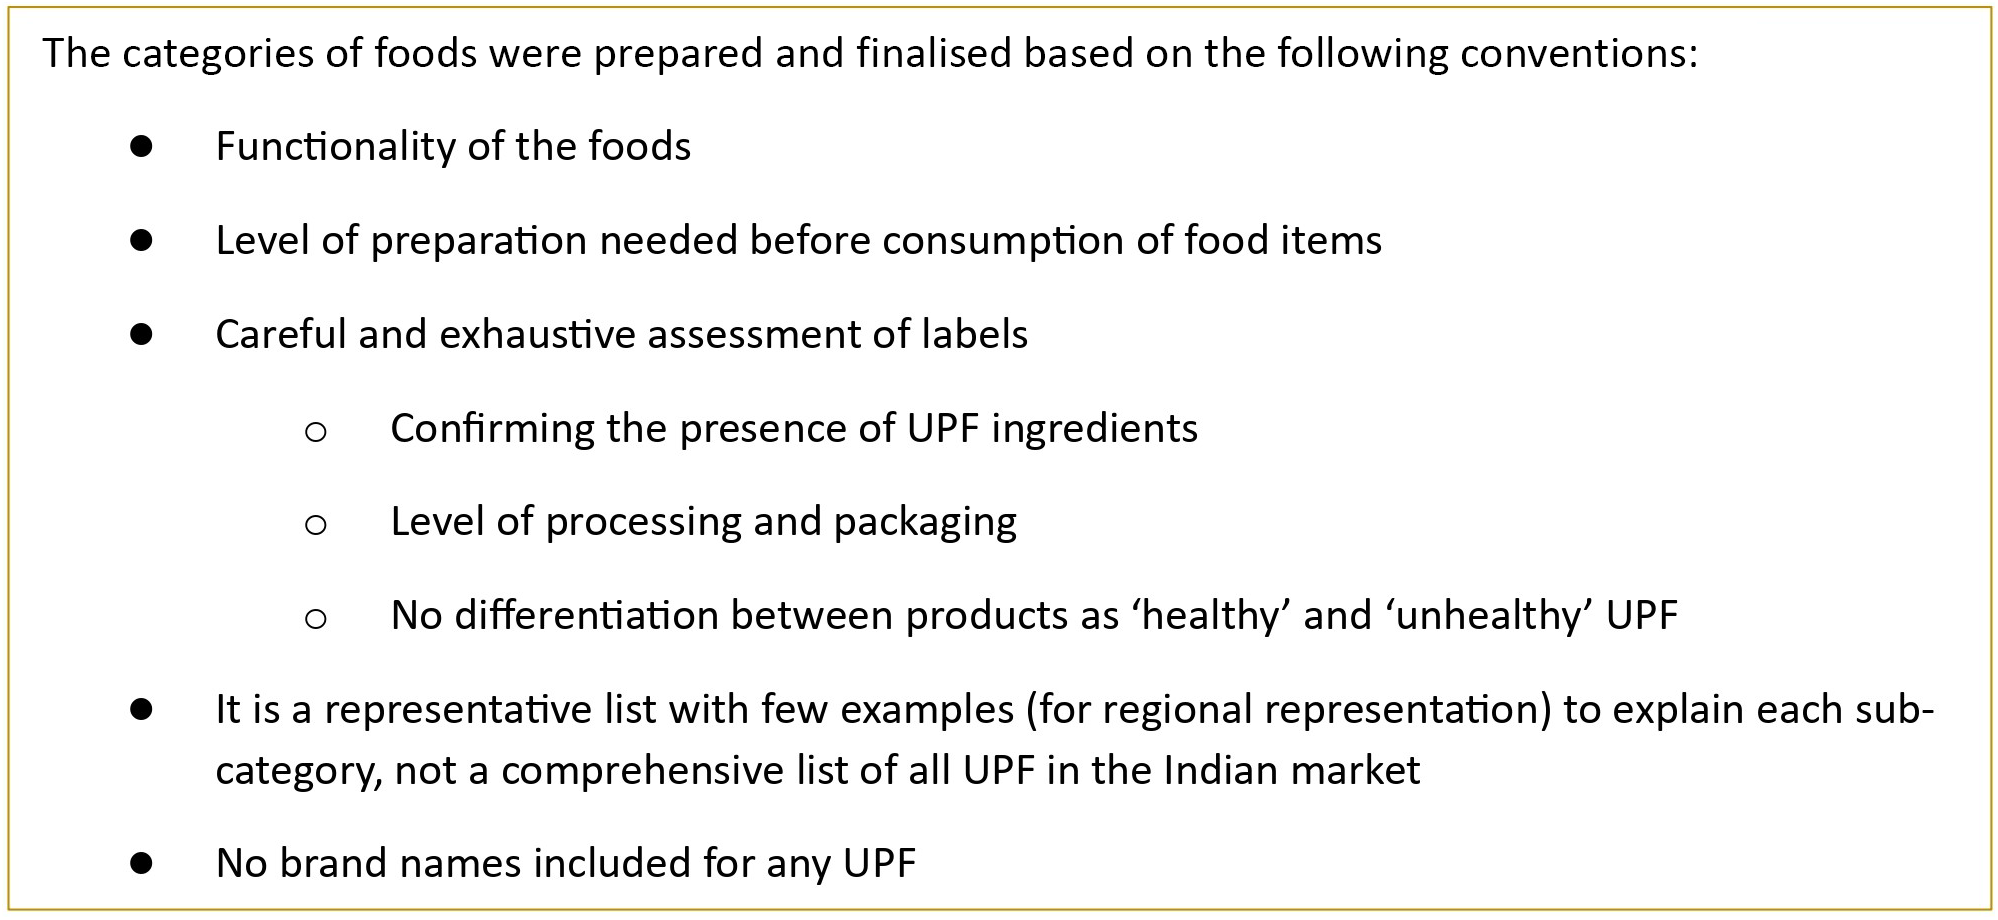
To develop the Nova-UPF Screener (for India), we conducted a formative research study involving three steps that identified a list of UPF relevant to the Indian context (Figure 1). Step 1 included an extensive review of the published literature on UPF accessed and consumed in India. The list of UPF generated was supplemented by an online grocery retailer scan in Step 2 of the study, where the food ingredients listed on the packaging labels were checked to see if they qualified as UPF ingredients. Foods containing additives (such as flavour enhancers, colours and emulsifiers) and industrially derived modified sugars, proteins and fats were confirmed to be ultra-processed. In Step 3, UPF thus identified were free-listed, and a saliency analysis was performed to understand the preference ranking of the UPF categories among the Indian population. The detailed study(Reference Ghosh-Jerath, Khandpur and Kumar30) is available that comprehensively explains the three steps involved in mapping of UPF in the Indian context. After generating a list of UPF most commonly accessed and consumed in India, a list of conventions (such as checking the functionality of UPF, i.e. it is a snack, an ingredient and the level of preparation needed before consumption) was set to categorise the UPF and develop the first draft of the Nova-UPF Screener (for India) in English (Figure 2). The Nova-UPF Screener, thus developed, was then validated through content(Reference Yusoff31), face(Reference Yusoff32) and concurrent criterion validation(Reference Mohajan33) techniques.

Figure 1. Adaptation of the Nova-UPF Screener (for India).

Figure 2. Conventions followed for classifying UPF into categories for the Nova-UPF Screener (for India).
Validation of the Nova-UPF Screener (for India)
Content validation
The content validation was conducted to obtain inputs from subject matter experts on the content of the screener. Online virtual consultations at the regional and national levels were organised for this purpose.
Study participants and study locale
Regional subject matter experts, comprising academics, public health professionals, dieticians, food technologists and food and nutrition scientists, were identified and invited through electronic mail invitations to take part in six consultations conducted across five regions of India. A total of sixty-four experts were invited, out of which fifty-four experts accepted the invitation and attended the respective regional consultations. The experts belonged to the states/ union territories of Delhi, Haryana, Punjab and Jammu and Kashmir from the North region (n 9); West Bengal from the East region (n 6); Assam, Meghalaya and Manipur from North-East region (n 14); Gujarat, Maharashtra, Madhya Pradesh, Rajasthan from West region (n 17) and Tamil Nadu, Kerala, Telangana, Karnataka from South region (n 8). National-level experts (n 20 invited, 13 attended) included key stakeholders from government bodies, non-governmental organisations, academia, public health experts, food technologists and international collaborators of this study.
Data collection
Regional group consultations were carried out virtually between February and April 2022, wherein a detailed presentation on the study’s background, rationale, objectives and purpose of the consultations was made. The screener in English was presented, followed by detailed deliberations on a set of questions about the screener’s content, length, language, regional representation and ease and modality of implementation. The experts provided their views through the questions (online Supplementary Table 1), which helped the study team make further revisions to the screener. Subsequently, a national consultation was convened virtually in May 2022 to present and deliberate on compiled suggestions from regional consultations. The practical considerations for including the tool as part of a national nutrition survey were also discussed at the national consultation. The expert views are presented in the supplementary table (online Supplementary Table 2). The screener was further modified, translated into Hindi and converted into a pictorial tool. Pictures, illustrations and/or food emoticons of some of the examples from each UPF category were used for a better understanding of the UPF categories. It was then subjected to face and concurrent criterion validation.
Face validation
In face validation, the screener was assessed for its appropriateness in capturing the consumption of UPF in the Indian population. The structure, appearance and design of the screener were assessed along with detailed inputs on clarity and ease of understanding. This was done using subjective and objective face validation techniques (as detailed below).
Study participants and study locale
For subjective face validation, the screener was administered to adults (n 50) aged 18–60 years, purposively selected from diverse geographic and demographic (urban, rural and peri-urban) strata. Consenting participants belonged to five states of India, namely, Maharashtra, Jharkhand, Uttarakhand, Madhya Pradesh and Delhi National Capital Region. The participants included nearly equal representation of males and females. For objective face validation, the screener was administered to purposively selected adults (n 20) aged 18–60 years with an equal representation of males and females, ten each from Delhi National Capital Region (Gurugram) and Andaman and Nicobar Islands, a union territory.
Data collection
Screener translated after content validation was back translated to ensure identical capture of information in both English and Hindi. After taking consent, the screener was administered to each participant based on their language preference (English or Hindi), to obtain their inputs on various aspects of the screener through a one-on-one interview. Participants were asked to provide detailed inputs on the screener’s structure, appearance and design and on the clarity, ease of understanding and interpretation of the list of UPF categories. For objective face validation, the screener was adapted to a digital platform using the Census and Survey Processing System software (version 7.7). Based on the language preference (English or Hindi) of the participants, an interviewer administered the screener to assess the participants’ understanding of instructions, the appropriateness of sub-categories, pictures and examples in the screener using a questionnaire (online Supplementary Table 3).
Concurrent criterion validation
The concurrent criterion validation was conducted to test the agreement of the scores obtained using the screener against the calorie share of UPF consumed using a 24-h dietary recall, a gold standard method for dietary intake assessment. Consenting adults (18–60 years) were conveniently selected from diverse geographic, socio-economic and demographic strata from three states, that is, Delhi-National Capital Region, Jharkhand and Madhya Pradesh.
Sample size calculation
The sample size for concurrent criterion validation was calculated based on the proportion of adults in urban India (73 %) purchasing processed foods and beverages(Reference Law, Green and Kadiyala34). The sample size was calculated to be 304, with a precision of 5 % and a 95 % level of significance using the following formula.
 $$n = {{{Z^2}P\;\left( {1-P} \right)}}\over{{{d^2}}}$$
Data collection
The study participants were informed about the purpose of the study through a participant information sheet that was explained by the field team and invited to participate in the study. Those who agreed to participate were asked to sign an informed consent sheet. The screener was then administered to them based on their language preference, English or Hindi, followed by assessment of their dietary intake using the 24-h dietary recall method. This 24-h recall survey form was pre-tested and administered by the nutritionist. The screener was administered before the 24-h dietary recall to avoid potential bias that could result from the prior application of a more detailed tool. During the administration of the screener, all twenty-four UPF categories were read out to the participants. Participants responded affirmatively as ‘yes’ if they consumed any food/drink item(s) from the example list of items comprising the UPF categories, in the past 24 h, which was explained to the participants as ‘the time period between the time they woke up in the morning yesterday to the time they went to bed at night to sleep yesterday’. For assessing their full day’s dietary intake using the 24-h dietary recall, participants were asked to recall and report details of their complete food intake for each meal consumed during the past 24 h. In order to facilitate this recall and portion size estimation, a culturally appropriate flip book with pictorial representations of portion sizes of various food items (fruits, vegetables, local fresh foods and locally available processed and ultra-processed foods) was developed and presented to participants. This addressed possible recall bias and provided a standardised estimate of dietary intake. Standard measuring cups and spoons were also used for estimating intakes in household measures. A detailed description of home-cooked mixed dish recipes with weight estimates of each ingredient (brand name, in case of UPF), total amount prepared and portion of the total recipe consumed was elicited and recorded. Details of the food eaten outside the home were also prompted and recorded.
Data analysis
Experts’ suggestions from regional and national consultations for assessing the screener contents were collated and thoroughly reviewed for UPF characteristics. The suggestions were listed, and each suggestion was handled as ‘to be incorporated’ and ‘no change was needed’, based on the votes received for each suggestion or based on the interpretation of the transcript of the discussion. Accordingly, all necessary changes were incorporated into the screener. This finalised version of the screener was presented for subjective face validation, where inputs from study participants were qualitatively analysed. For objective face validation, the percentage agreement for each question and overall agreement were quantitatively measured using the formulas given below. The screener’s attributes asked through these questions were retained when a percentage agreement of more than 90 % was reached, indicating full strength of agreement.


For concurrent criterion validation, firstly, the Nova-UPF score for each participant was calculated by the total number of UPF categories consumed. Each consumed category was scored one point, and the scores could range from 0 to 24. The 24-h dietary recall sheets were cleaned for entry errors and inconsistencies. Cleaned data were then integrated into DietCal Pro Survey Software (Version 12.0, Profound Tech Solution) for further analysis to estimate the dietary share of UPF in the day’s diet. Each food item reported in the 24-h dietary recall was initially classified into UPF or non-UPF categories based on the same criteria used for characterising the UPF as used for developing the UPF screener. Then, the consumed quantity of each item, reported in household measures, was transformed into grams and converted into calories using data from Indian Food Composition Tables(Reference Longvah, Ananthan and Bhaskarachary35) along with the data on nutritive values of processed and ultra-processed foods available on the food labels or from secondary literature. The percentage of calories obtained from UPF consumption reported in the 24-h recall was calculated and compared with the Nova-UPF scores. The variation in the average percentage of calories from UPF according to the score variation was expressed continuously and at intervals corresponding to fifths (quintiles) of their distributions. In both cases, linear regression models were used to test the linear trends. The degree of agreement between the fifths (quintiles) of Nova-UPF scores and the fifth (quintiles) of the percentage of calories shared from UPF was evaluated by calculating the prevalence-adjusted and bias-adjusted kappa (Pabak) index(Reference Byrt, Bishop and Carlin36). For the Pabak index, values greater than 0·80 indicate an almost perfect agreement; between 0·61 and 0·80, a substantial agreement; between 0·41 and 0·60, moderate; between 0·21 and 0·40, fair; and equal to or less than 0·20, slight agreement(Reference Costa, Faria and Gabe29,Reference Landis and Koch37) . The variation in the prevalence of relatively high consumption of UPF according to age group was assessed using two criteria (i) consumption equivalent observed in the upper fifth of the distribution of UPF screener scores (≥ 5) and (ii) consumption equivalent observed in the upper fifth of the distribution of the percentage share of calories from UPF (≥ 25·02 %). Pearson’s correlation was used to assess associations. Data analyses were performed with the Stata® 16.1 software, and the Pabak index was calculated using R Studio software.
Results
Development of the Nova-UPF Screener (for India)
The UPF screener was adapted from the Brazilian version using a review of the literature and an online Indian grocery retailer scan. A list of UPF commonly accessed and consumed by the Indian population was developed. This was followed by a saliency analysis for ranking the UPF based on their preferences among the Indian population as reported in the literature reviewed (Figure 1). The first draft of the Nova-UPF Screener (for India) was developed, which included twenty-four UPF categories along with a pictorial version of the screener to bring more clarity to the UPF included in the screener categories. A manual of procedures was developed to support training for administering the screener in the field during the validation process. The manual of procedures also included an exhaustive list of UPF examples for each category. After adaptation(Reference Ghosh-Jerath, Khandpur and Kumar30), the Nova-UPF Screener (for India) was validated for its suitability in the Indian context.
Validation of the Nova-UPF Screener (for India)
Content validation
Experts who participated in the regional consultations suggested the inclusion of various packaged traditional regional foods that have UPF equivalents available (online Supplementary Table 4). Only those packaged traditional food products were included in the screener that complied with the UPF definition of the Nova food classification system(Reference Monteiro, Levy and Claro16–Reference Monteiro, Cannon and Lawrence19).
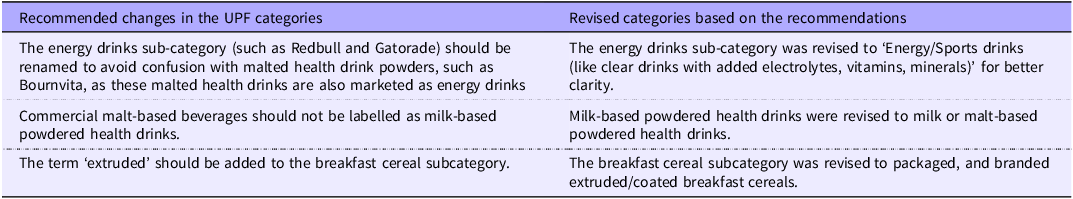
Certain suggestions like alcoholic beverages and ‘paan masalas’ (a traditional mouth freshener which sometimes contains chewable tobacco) were not included in the list because of their negative health effects independent of that of the dietary pattern and were deemed to be beyond the scope of the screener. Experts recommended the addition of food items such as pizzas, burgers, French fries, momos and other commonly consumed ready-to-eat commercial fast-foods under a specific section of the screener. They also appreciated the use of pictorial depiction for better comprehension of each UPF category and reiterated the refrain from displaying any brand names. The contents of manual of procedures for the screener were enriched by the experts’ suggestions. The length of the screener was considered appropriate by the experts. Changes were recommended for renaming certain UPF categories (Table 1). Further, for ease of understanding, the screener was divided into three major sections (Figure 3):
Table 1. Input from regional consultation experts on the draft categories of the Nova-UPF Screener (for India) during content validation


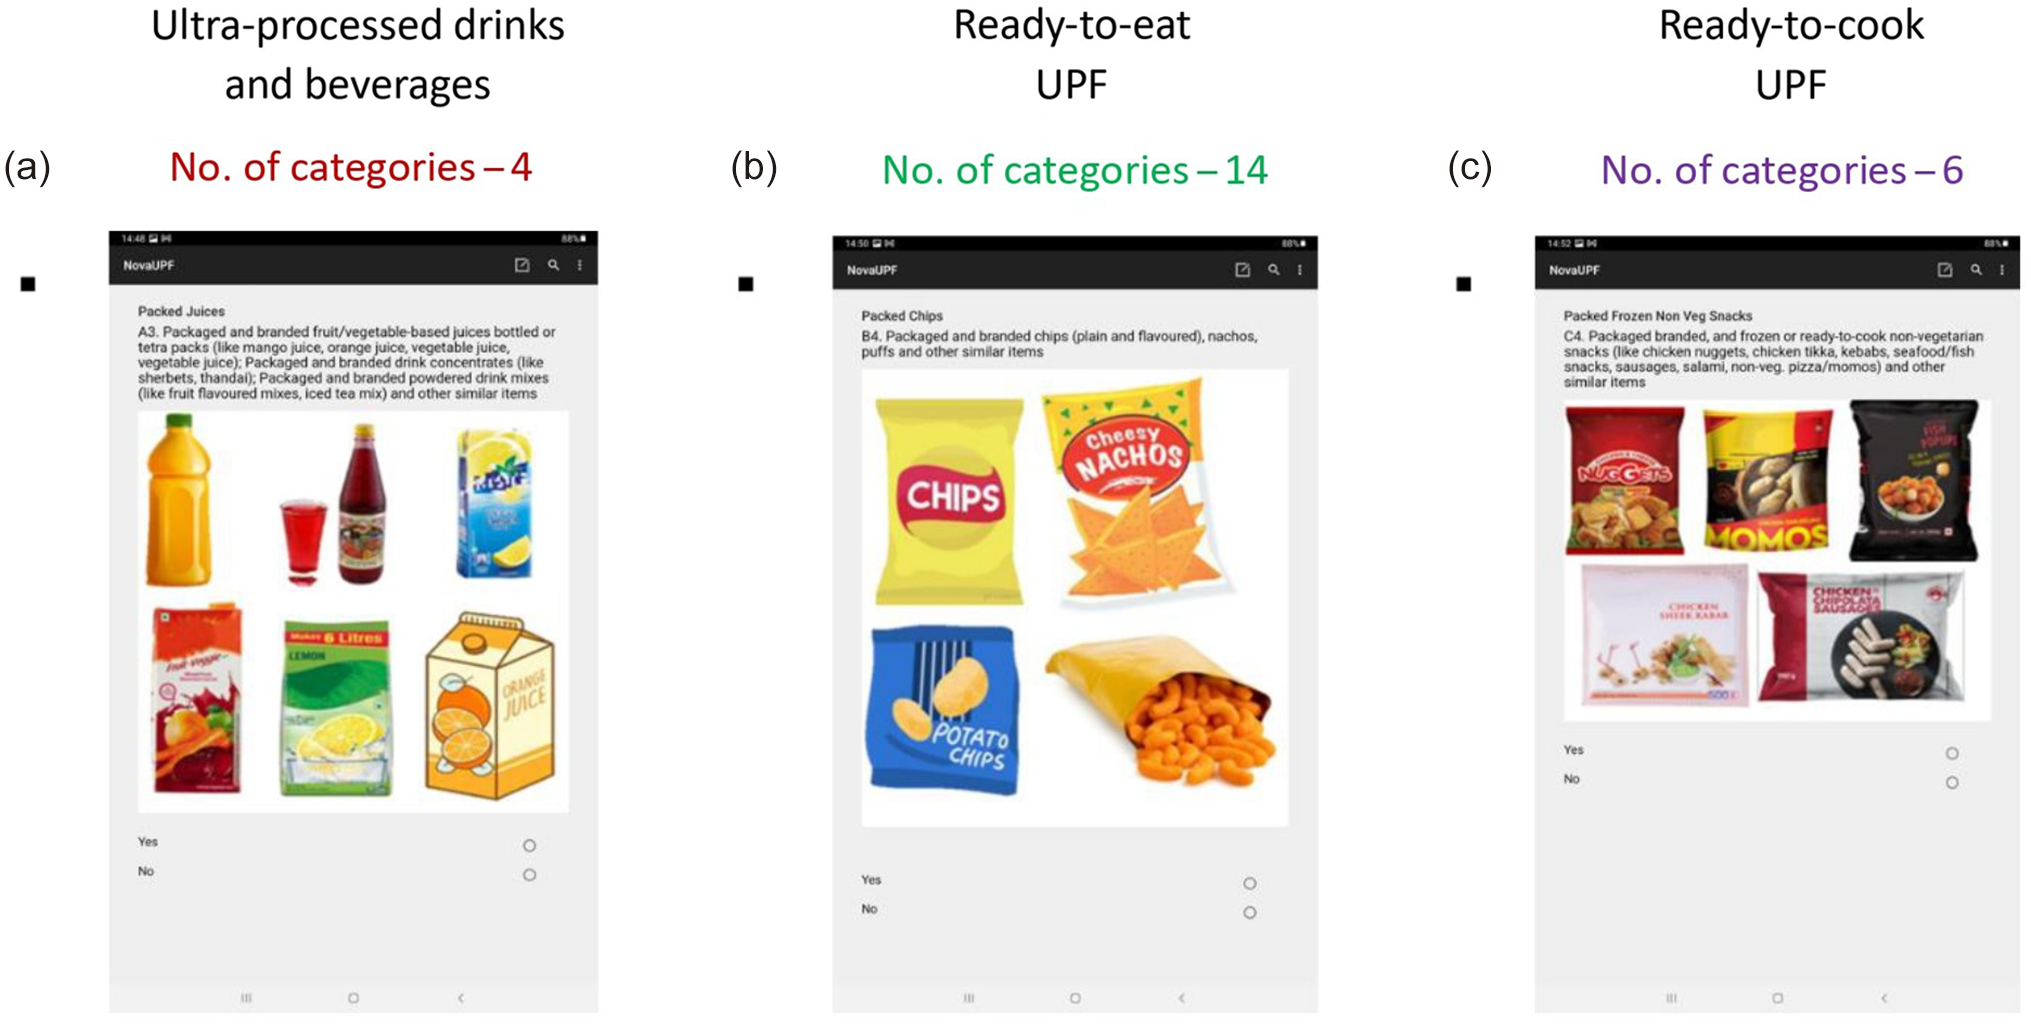
Figure 3. Final sections included in the Nova-UPF Screener (for India).
1. Section A – Ultra-processed drinks and beverages
2. Section B – Ready-to-eat UPF, no or minimal preparation needed
3. Section C – Ready-to-cook UPF
During the national consultation, experts shared their inputs on the content of the revised screener and its mode of administration. More UPF, such as protein powders and peanut butter, were added to the screener after verification, owing to their increased consumption among Indians. Experts agreed upon the feasibility of incorporating the UPF screener as an additional module in national nutrition surveys. The need for its translation into regional languages for application across India was underscored. Owing to the differential literacy rate in India, for administering the screener as part of the national survey, a face-to-face interview using an Android-based application was suggested as the preferred mode of administration of the screener.
Face validation
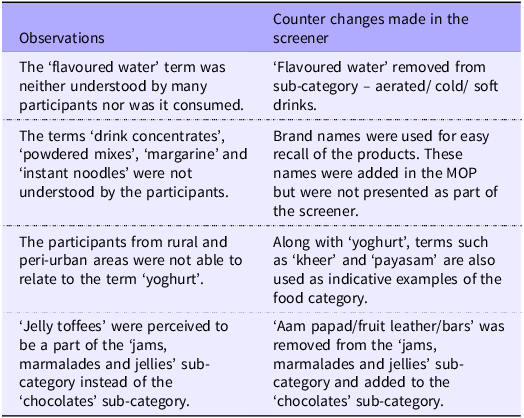
In face validation, views were invited regarding the ease of understanding and interpretation of the categories of UPF in the screener. Terms such as ‘drink concentrates’, ‘powdered mixes’, ‘margarine’ and ‘instant noodles’ were poorly understood. Participants from the rural and peri-urban areas could not understand the term ‘yoghurt’ mentioned in one of the categories. For better understanding, specific terms were revised, or appropriate examples were added to the screener and the manual of procedures for the screener (Table 2). Objective face validation resulted in a 100 % agreement on seven out of the eight questions regarding clarity of instructions, sub-categories, pictures, regional representation and length of the screener. One of the questions, ‘Were the examples given in each sub-category enough?’ achieved a percentage agreement of 95 %. All the questions had a percentage agreement exceeding 90 % demonstrating the full strength of the agreement, and each attribute pertaining to the questions was retained as such. The overall percentage agreement for the screener was 99·4 % (a strong agreement).
Table 2. Participant observations during face validation and counter changes made in the Nova-UPF Screener (for India)

MOP, manual of procedures.
Concurrent criterion validation
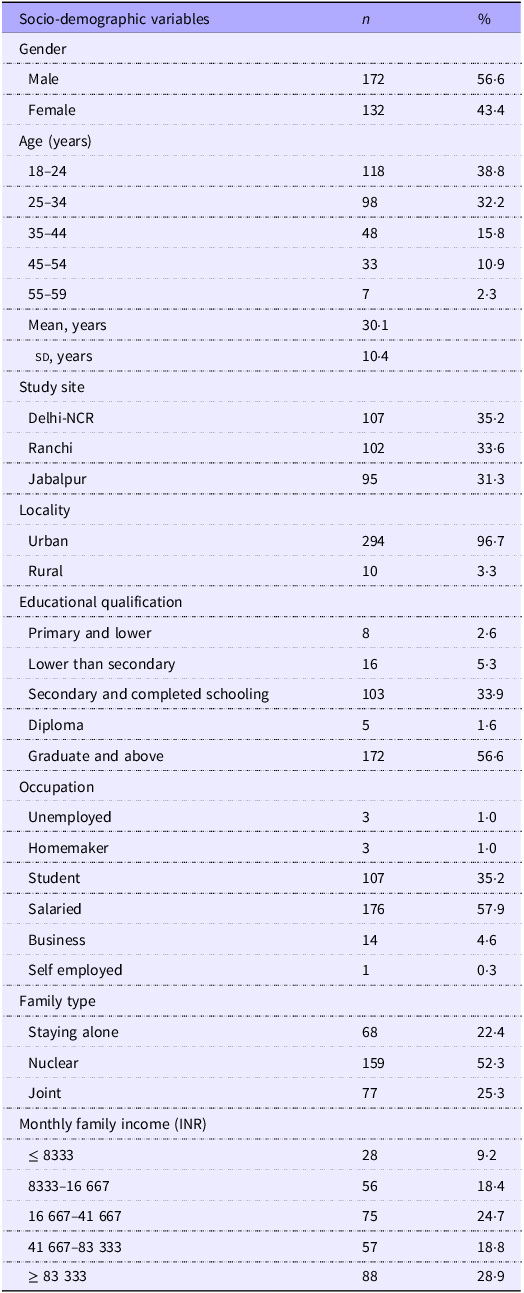
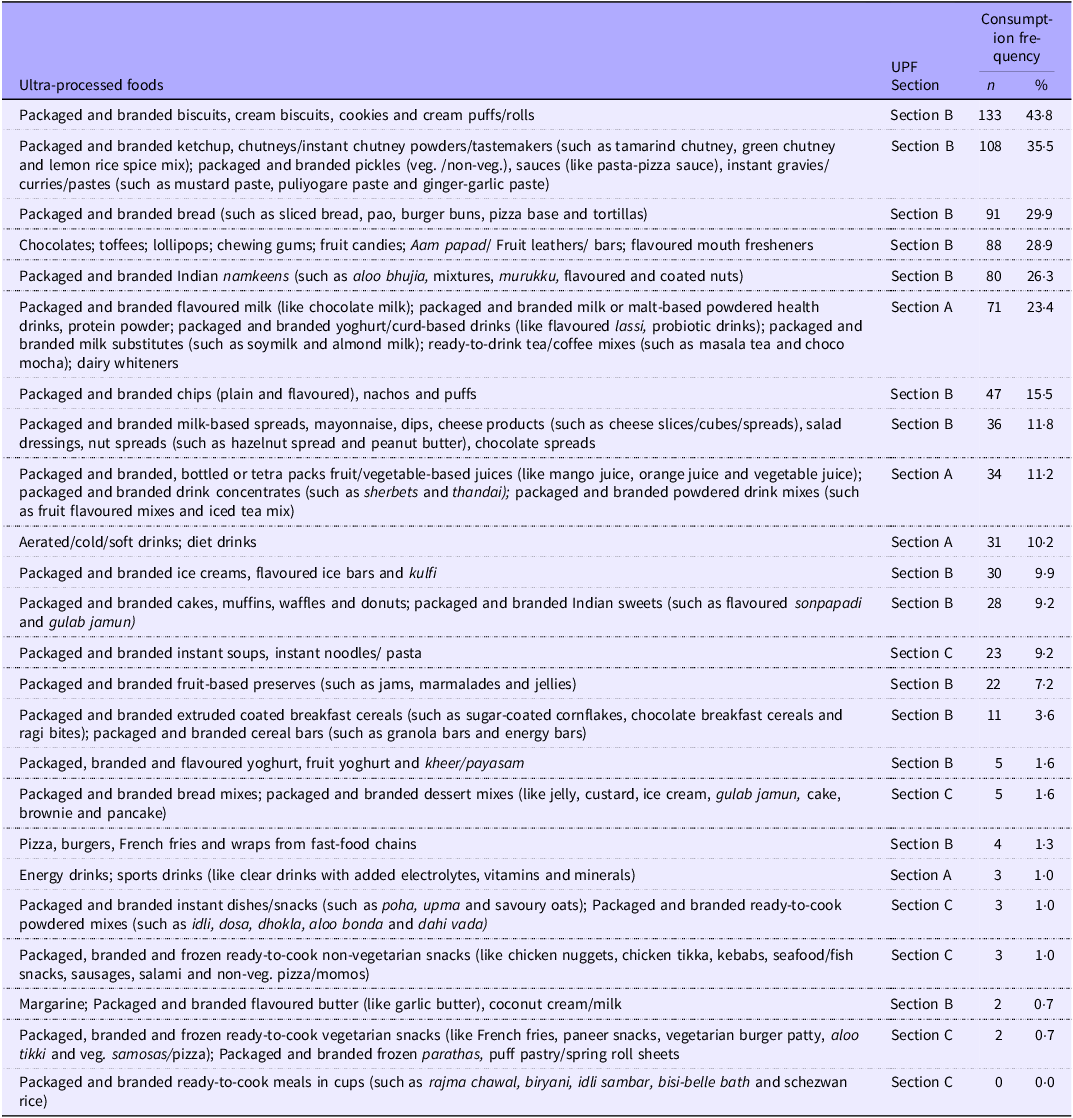
The final version of the Nova-UPF Screener (for India), comprising twenty-four UPF categories, was subjected to concurrent criterion validation. The screener was administered to 304 participants, followed by the administration of a 24-h dietary recall questionnaire. The mean age of the participants was 30·1 (sd 10·4) years; the majority of whom had completed schooling (92 %), (i.e. those who completed schooling till the highest class of a secondary school). These participants belonged to urban areas (97 %) of Delhi-NCR, Ranchi, in the state of Jharkhand and Jabalpur in the state of Madhya Pradesh. Most participants (58 %) were salaried employees, and one-third (35 %) were college students (Table 3). Table 4 shows the consumption frequency of the UPF based on the participants’ responses to the screener, depicting that most participants (44 %) consumed ‘packaged and branded biscuits, cream biscuits, cookies and cream puffs/rolls. Additionally, approximately one-third of the participants (36 %) reported consuming ‘packaged and branded ketchup, chutneys/instant chutney powders/tastemakers; packaged and branded pickles, sauces, instant gravies/curries/pastes’ and 30 % consumed ‘packaged and branded bread’. One-fourth of the participants (26·3 %) consumed ‘packaged and branded Indian namkeens (traditional Indian Savoury snacks)’ and 23·4 % reported intakes of ‘packaged and branded flavoured milk; packaged and branded milk or malt-based powdered health drinks, protein powder; packaged and branded yoghurt/curd-based drinks; packaged and branded milk substitutes and ready-to-drink tea/coffee mixes and dairy whiteners’ (Table 4).
Table 3. Socio-demographic characteristics of study participants of the concurrent criterion validation of the Nova-UPF Screener (for India) (n 304)

NCR, National Capital Region.
Monthly household income classes were constructed based on data from the Consumer Pyramids Household Survey (CPHS), conducted by the Centre for Monitoring Indian Economy (CMIE). Income groups were categorised into fixed brackets for ease of interpretation.
Table 4. Consumption frequency (%) of ultra-processed foods (UPF) on the day prior to the interview among participants (n 304) based on 24 UPF categories of the screener

Section A, UPF drinks and beverages; Section B, ready-to-eat UPF; Section C, ready-to-cook UPF.
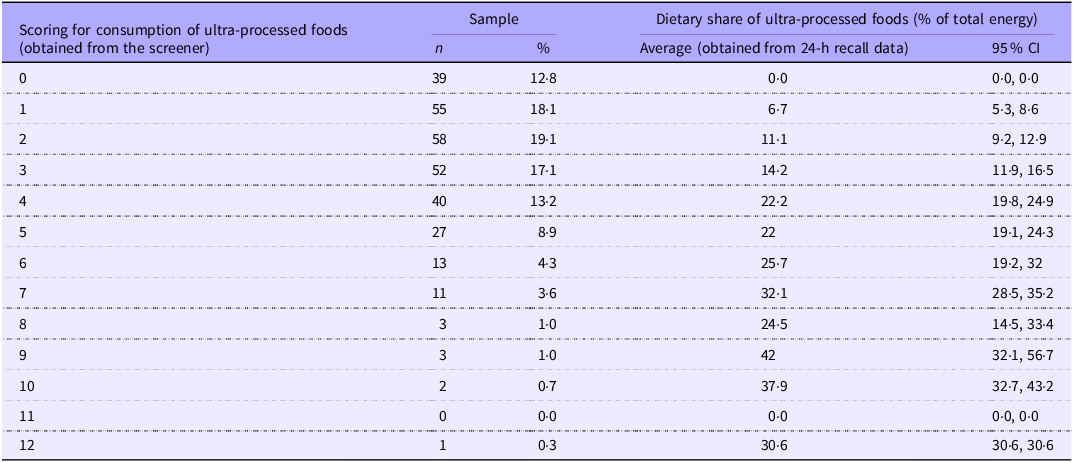
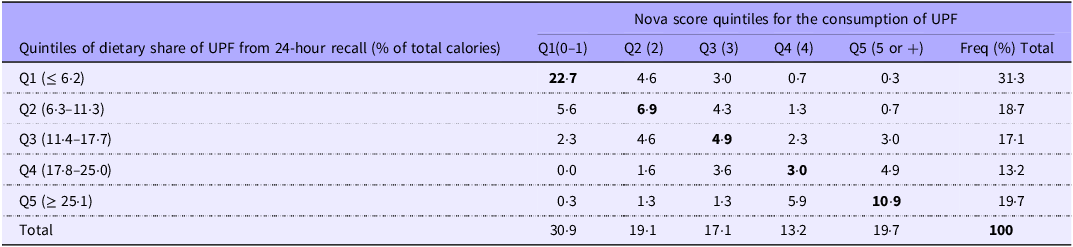
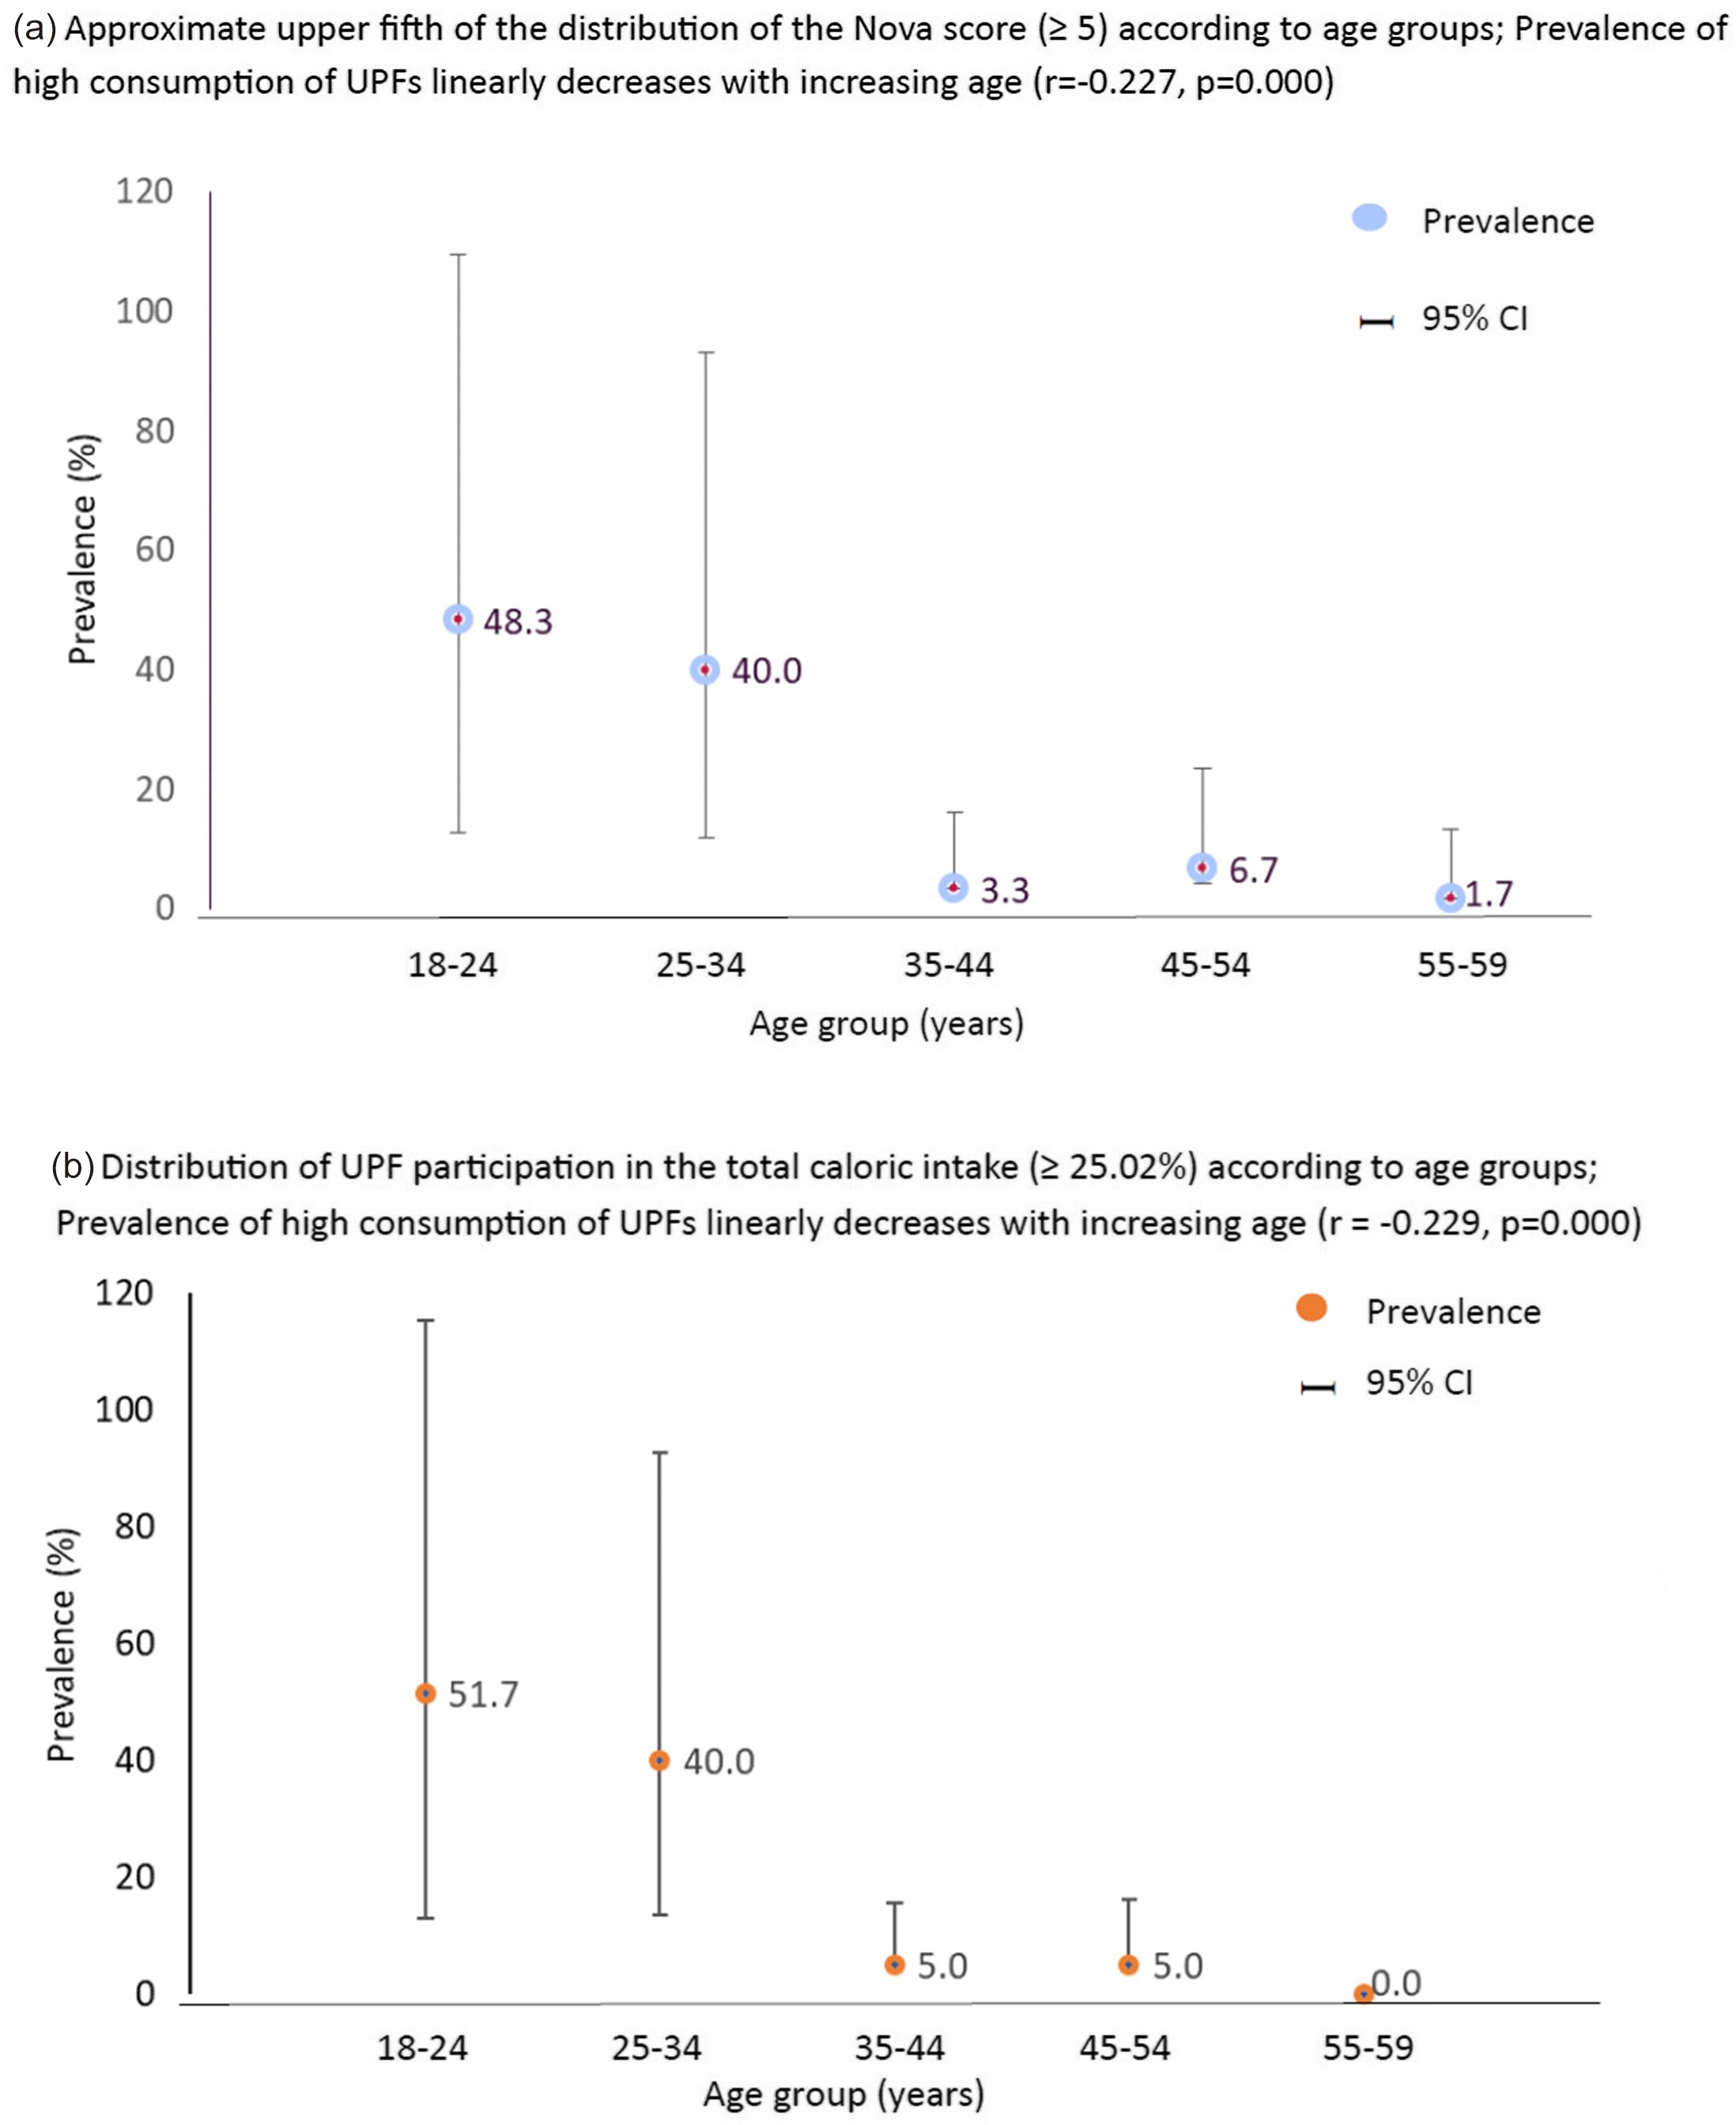
The average Nova-UPF scores among participants were 3 (sd 2·2) (range 0–12). Most participants obtained a score of 2 (19·1 %), followed by 1 (18·1 %), 3 (17·1 %) and 4 (13·2 %), while 13 % of the participants did not consume any UPF on the previous day. Table 5 shows the distribution of Nova-UPF scores among participants and the percentage energy share from UPF in the diet. On measuring the linear correlation between the Nova-UPF score and dietary share of UPF, a strong positive correlation was observed (r = 0·76, P < 0·001). Most participants (19·1 %) had a dietary share of UPF contributing to 11·1 % of the total day’s calorie intake. The distribution of participants (Table 6) based on their classification according to the fifths of the dietary share of UPF and Nova-UPF scores showed ‘an almost perfect agreement’ (Pabak index = 0·85). Figure 4 presents the variation in prevalence of high UPF consumption according to age group based on Nova Score (≥ 5) and total caloric intake (≥ 25·02 %) among participants. The prevalence of relatively high consumption of UPF in the approximate upper fifth distribution of the Nova-UPF scores (≥ 5) and upper fifth distribution of UPF per cent share in the total caloric intake (≥ 25·02 %) linearly decreased with increasing age (r = –0·227, P < 0·001 and r = –0·229, P < 0·001, respectively).
Table 5. Nova scores, % population and corresponding dietary share of ultra-processed foods based on 24-h dietary recall (n 304)

Table 6. Distribution of participants (%) by UPF energy contribution quintiles (from 24-h dietary recall) and Nova-UPF score quintile (n 304)

UPF, ultra processed foods.
Pabak index (prevalence-adjusted bias-adjusted Kappa) = 0·85 (0·75–0·95).
Quintiles were made by dividing the variable into five equal parts using percentile points (P20, P40, P60 and P80) as the cut-off values.

Figure 4. Variation in the prevalence (%) of high consumption of ultra-processed foods according to age group based on Nova Score (≥ 5) and total caloric intake (≥ 25·02 %) among participants (n 304).
Discussion
This paper presents the findings of a validation study for a screener that captures the consumption of UPF in the Indian population. The Nova-UPF Screener (for India) was developed to suit the Indian context and then validated. The content validation provided critical inputs from regional and national level experts on the screener’s content, length, language, regional representation and ease and modality of implementation. Face validation provided insights into participants’ acceptance and understanding of the tool and also assured a strong agreement of 99·4 % for the screener. The concurrent criterion validation showed an almost perfect agreement between the distribution of participants based on the fifths of the dietary share of UPF and fifths of Nova-UPF scores (Pabak index = 0·85). The major consumption of UPF among the study population was reported from packaged and branded biscuits, breads, sauces and ketchups, chocolates, toffees and Indian savouries (namkeens).
Only a few studies(Reference Puttarathnamma, Prakash and Prabhavathi38–Reference Jain and Mathur40), to our knowledge, have reported the consumption of UPF in India, which could be attributed to the lack of uniform application of the classification of UPF as a food category in the literature on the Indian food environment. This study fills a critical gap by developing a screener that captures UPF consumption in the Indian context and validating it. The data obtained using the screener can provide some critical information to address policies trying to tackle the risk factors of the rising burden of DR-NCD in India, with the transitioning food environment being one of them. At present, most of the literature and policy documents have used ‘high in fat, sugar, and salt foods’ even though many such foods are ultra-processed in nature(Reference Rathi, Riddell and Worsley41,Reference Vasan42) . Recently, in May 2024, the National Institute of Nutrition – Indian Council of Medical Research (NIN-ICMR) released the UPF definition in Dietary Guidelines for Indians, 2024(43).
Since efforts were made not only to develop a new tool (a quick screener) to assess UPF consumption in India but also to coherently apply the term UPF to assess its consumption in India, it was critical to validate this tool meticulously and systematically for its content. This was an important step to ensure the development of a high-quality novel tool that could be used in nutrition research(Reference Yusoff31,Reference Almanasreh, Moles and Chen44) and also inform policies around regulating the food environment to prevent DR-NCD. The content validation exercise of the study provided a robust review of the tool by capturing the perceptions and views of experts working in this domain. The process not only evaluated the contents of the screener but also its applicability in a diverse country like India. Additionally, the screener’s comprehensibility is critical for its utilisation as a research tool to assess UPF consumption and a study instrument for any sentinel survey across India. Thus, ensuring face validation is an important step in establishing the overall validation of this assessment tool(Reference Yusoff32).
Validation by comparing the Nova-UPF scores with the dietary share of UPF using one of the gold standard methods of dietary assessment revealed an almost perfect agreement (Pabak index = 0·85). Our findings were similar to the earlier study, where the parent UPF screener developed for the Brazilian population showed significant agreement (Pabak index = 0·67) between the screener scores and the dietary share of UPF assessed using 24-h dietary recall(Reference Costa, Faria and Gabe29). This original screener, after due adaptation, was also validated in Senegal, where a near-perfect agreement was observed between the UPF score and the UPF dietary share, with a Pabak index of 0·84(Reference Kébé, Diouf and Sylla45).
In the present study, a fifth of the participants (19·1 %) had an average dietary share of UPF contributing to 11·1 % of the total energy intake in a day. The National Nutrition Monitoring Bureau survey conducted in India also highlighted that the intake of unhealthy packaged foods, mostly ultra-processed foods, such as chips, biscuits, chocolates, sweets and juices, among urban adults contributed to 11 % of their total energy intake(13) which is lower in comparison to developed nations. Studies conducted in developed nations have shown that the intake of UPF contributed to 25 %, 42 % and 58 % of total energy intake in the diets of adults in Korea, Australia and the USA, respectively(Reference Shim, Shim and Cha27,Reference Martínez, Popkin and Swinburn46,Reference MacHado, Steele and Levy47) . Akin to our results, evidence has shown that the consumption of UPF linearly decreases with increasing age(Reference Marino, Puppo and Del Bo’48). Studies have also reported that the factors affecting the consumption of UPF, such as the lack of time to prepare foods and the lack of motivation/willpower to eat healthy, reduce as age increases(Reference Sung, Park and Oh49–Reference Cortes, Louzado and Oliveira51). Nutrition transition in low- and middle-income countries such as India is witnessing a rise in the consumption of packaged ultra-processed foods that are high in fat, sugar and/or salt(Reference Baker and Friel20,Reference Law, Green and Kadiyala34,Reference Amour, Pandey and Reba52) . Overconsumption of such UPF is associated with obesity and risk of developing many DR-NCD, including diabetes mellitus, CHD and cancers in adults(Reference Rauber, Louzada and Steele53–Reference Elizabeth, Machado and Zinöcker56). Timely and appropriate interventions can slow down the rise in UPF consumption in low- and middle-income countries such as India(Reference Popkin and Ng57). Even though studies have shown that overconsumption of ultra-processed food leads to DR-NCD, comparable data are scarce on UPF intake in the Indian context. The screener developed and validated in the present study, however, needs to be validated in other population groups, such as children < 5 and adolescents.
The data obtained from screeners developed in the present study, which show the actual consumption of UPF, have policy implications. Higher taxes imposed on unhealthy foods in countries with higher consumption of UPF have been associated with a decline in their purchase as well as long-term health impacts by reducing obesity and the incidence of diabetes(Reference Amour, Pandey and Reba52–Reference Elizabeth, Machado and Zinöcker56). A few countries have also tried to control the health effects of UPF by setting limits on sugar, sodium, trans-fats, etc. front-of-package warning labels, regulating the marketing of UPF, especially for children, and controlling access to UPF in schools(Reference Popkin and Ng57–Reference Gavaravarapu, Priyadarshini and Hemalatha60). Thus, fiscal measures such as the combined effects of applying taxes on unhealthy foods along with subsidies on healthier foods, effective nutrition labelling and behaviour change communication strategies can help us to leapfrog the predictable trend of nutrition transition(11,Reference Caro, Valizadeh and Correa58–Reference Gavaravarapu, Priyadarshini and Hemalatha60) .
The present study has a few limitations. First, for concurrent criterion validation of the screener, a 24-h dietary recall was used, which is prone to recall and reporting biases(Reference Gibson, Charrondiere and Bell61). Second, this tool was only validated for the adult population; further validation on other age groups is warranted for the population-level data collection on UPF consumption. Although the sample size (n 304) was adequate to identify correlations between the Nova-UPF score and the UPF per cent share in the total caloric intake, the concurrent criterion validation study did not intend to stratify the sample further according to the socio-demographic and economic profile of the study population. Therefore, score performance according to socio-demographic characteristics may be further evaluated. Our study also has several strengths. It is the first study that aims to develop and validate a quick screener for UPF consumption tailored to the Indian context. The tool is easy, simple, has low participant burden, takes 6 min to administer and appropriately captures UPF consumption among a diverse population in different states of India. It can also be used for monitoring trends in UPF intake over time and informing policies.
Conclusion
This study focused on the validation of the adapted Nova-UPF Screener (for India), which is a quick, simple and easy-to-administer dietary assessment tool for capturing UPF consumption among Indian adults. The Nova-UPF Screener (for India) collects and calculates the scores quickly and practically, which has a great potential to monitor the rising trend of UPF consumption among Indian adults(11). To the best of our knowledge, the tool will be the first of its kind in India. This validated tool can be effectively implemented to add to the limited evidence on the actual consumption of UPF in diverse regions and among the different socio-economic strata in India. The objective estimates of UPF consumption among Indian adults using this screener can provide critical evidence on UPF intake trends over time, which may inform policies aimed at addressing the increasing burden of DR-NCD by developing and implementing interventions around creating healthier food environments. This tool can also be an effective instrument for documenting trends in UPF consumption objectively, thereby monitoring the efforts of the Government in addressing the food environment transition in India.
Supplementary material
For supplementary material/s referred to in this article, please visit https://doi.org/10.1017/S0007114525105230
Acknowledgements
We would like to appreciate the contribution of Inderdeep Kaur Bhamra, Tanuja Nandan and Bahastuti Bhatt for supporting the study team during the validation of the Nova-UPF Screener (for India). We would also like to acknowledge the support of Mr Manoj Soni in the digitisation of the screener.
This work was funded through the Innovative Methods and Metrics for Agriculture and Nutrition Action (IMMANA) programme (Grant IMMANA 3·06), led by the London School of Hygiene & Tropical Medicine (LSHTM). IMMANA is co-funded with UK Aid from the UK government and by the Bill & Melinda Gates Foundation INV-002962/OPP1211308.
The study was conceptualised, and its methodology was developed by K. S. R., S. G-J., N. K. and F. H. M-L., who also secured funding, supervised the research and contributed to manuscript review and editing. S. G-J. also supervised the overall conduct of the research. S. M. wrote the original draft, reviewed and edited. G. K. and S. K. were involved in project administration, data curation, visualisation, formal analysis and reviewed and edited the article. S. G-J. had primary responsibility for final content, and all authors read and approved the final manuscript.
The authors declare no conflict of interest.
This study was conducted according to the guidelines laid down in the Declaration of Helsinki, and all procedures involving human subjects were approved by the Ethics Committee [blinded for review]. All participants were informed about the purpose of the study, followed by obtaining written consent from all those willing to participate.


 Open access