


Introduction
Heavy industry equipment generally adopts customized manufacturing. In such projects, large sheet metal parts need to be cut out according to the content of customized engineering drawings and finally manufactured by welding and stamping operations. Efficiency and precision are critical to the manufacture of customized heavy industrial equipment. The specific process of the traditional way to obtain sheet metal parts in the manufacturing process of heavy industry equipment is manual recognition of engineering drawings (Ablameyko and Uchida, Reference Ablameyko and Uchida2007; De et al., Reference De, Mandal and Bhowmick2016) manual redrawing of specific graphics (Tovey, Reference Tovey1989; Madsen and Madsen, Reference Madsen and Madsen2016)-sheet metal cutting and stamping based on CAD/CAM integrated system (Pan and Rao, Reference Pan and Rao2009; Lu et al., Reference Lu, Ou and Liao2021; Favi et al., Reference Favi, Campi and Germani2022). The process of obtaining specific sheet metal parts in traditional ways is cumbersome and inefficient.
In recent years, with the development of artificial intelligence, the industrial field is also more inclined to use deep learning methods to solve engineering problems. Some studies have shown that this method has an excellent performance in solving engineering problems. For example, Lau et al. (Reference Lau, Chong and Yang2020) utilized deep learning image segmentation to replace the traditional manual road crack detection and achieved extremely high detection accuracy in road defect detection using the ResNet-34 pre-trained model. Tabernik et al. (Reference Tabernik, Šela and Skvarč2020) and Hou et al. (Reference Hou, Wei and Guo2017) utilized deep learning image segmentation techniques to achieve the automatic detection of defects on metal surfaces and the automatic detection of defects in the welding process, respectively. Zhang et al. (Reference Zhang, Joseph and Chen2024) improved the ability of computers to recognize the contents of 2D engineering drawings using deep learning data enhancement techniques. Li et al. (Reference Li, Zhang, Zhang and Emam2023) used a self-learning semi-supervised deep learning approach to achieve high-precision semantic segmentation of remote sensing images. Lu et al. (Reference Lu, Ren and Shi2023) achieved high-precision automated screening of hybridoma cells using the U-net segmentation model with a residual network attention mechanism. The commonly used deep learning method for plate part recognition is the graphical neural topology method, which is mainly applied to 3D part recognition and classification and is not yet able to satisfy the segmentation and extraction of the content contour of 2D engineering drawings (Ma and Yang, Reference Ma and Yang2024).
As we all know, many excellent segmentation networks already exist in deep learning image segmentation. The fully convolutional segmentation model (FCNs) of deep learning was first proposed by Long et al. (Reference Long, Shelhamer and Darrell2015). FCNs abandon the traditional fully connected layer, and the overall network structure uses a fully convolutional method to achieve end-to-end pixel-level dense prediction of image features, which is suitable for more complex global semantic feature segmentation tasks. The fully convolutional segmentation model uses transposed convolution operations to obtain semantically segmented images of the original size through upsampling. The input of FCNs is an RGB image of any size and the output is the same size as the input. At the same time, it proposes a classic skip connection for fusing features from deep layers (including classification information) and intermediate layers (including location information) to improve feature accuracy output. U-net (Ronneberger and Fischer, Reference Ronneberger and Fischer2015) can be considered a variation of FCNs, which still uses the encoder-decoder and skip structure. Compared with the former, the unique skip connection architecture of the U-net enables the decoder to obtain more spatial information lost during the pooling operation and restore a complete spatial resolution. The semantic difference between the encoder and decoder is reduced to achieve better segmentation performance. U-net mainly has two cores: (1) dimensional difference problem between the low-dimensional encoder and high-dimensional decoder in the process of semantic information fusion. How to effectively reduce the dimension difference in the image fusion process of the encoder and decoder? (2) The problem of image spatial position information, how can the encoder and decoder realize the learning of image spatial position information? Researchers have introduced many methods to solve the above problems to reduce the incompatible feature differences between these two groups.
Deeplab-v1, Deeplab-v2, Deeplab-v3, and PSPNet (Chen et al., Reference Chen, Papandreou and Kokkinos2014, Chen et al., Reference Chen, Papandreou and Kokkinos2017a, Reference Chen, Papandreou and Schroff2017b; Zhao et al., Reference Zhao, Shi and Qi2017) use null convolution and pooling with different step sizes to improve the resolution and accuracy of image segmentation, respectively, with more computational parameters in their processes. SegNet (Badrinarayanan et al., Reference Badrinarayanan, Kendall and Cipolla2017) removes the fully connected layer and proposes the up-sampling model structure of the conv layer instead of the Deconv layer, which improves the resolution and greatly reduces its model’s operation parameters. HRNet (Sun et al., Reference Sun and Xiao2019) adopts the design of a multi-resolution parallel tributary architecture, which better realizes the fusion of different depth semantic features. The segmentation networks focus on acquiring global image semantic features and spatial location information. Therefore, the model mainly integrates the global upper and lower semantic features in image segmentation and learns spatial location feature information. Currently, many improved models have emerged based on U-net, such as R2UNet, R2U++Net, CAggNet, MultiResUNet, NonlocalUNets, and UCTransNet (Alom et al., Reference Alom, Hasan and Yakopcic2018; Ibtehaz and Rahman, Reference Ibtehaz and Rahman2020; Wang et al., Reference Wang, Zou and Shen2020, Reference Wang, Cao and Wang2022; Cao and Lin, Reference Cao and Lin2021; Mubashar et al., Reference Mubashar, Ali and Grönlund2022). Such networks are improvements to the U-net hopping structure, to allow better integration of global contextual feature information in the encoder and decoder and thus improve segmentation performance. The unique hopping structure of the U-net model can better realize the fusion of global semantic information, which is characterized by high accuracy, low complexity, and high resolution in image segmentation tasks. As mentioned in UNet++ (Zhou et al., Reference Zhou, Rahman Siddiquee and Tajbakhsh2018), the dimensionality of the encoder semantic features at the front end of the jump structure is lower than that of the decoder semantic features at the back end, and thus, the large difference in feature dimensions in the jump structure makes the segmentation performance not good enough.
On the other hand, Fei Wang (Wang et al., Reference Wang, Jiang and Qian2017) proposed a residual attention network using an encoder-decoder approach. Based on this, Sanghyun Woo (Reference Woo, Park and Lee2018) proposed the CBAM (Convolutional Block Attention Module) module to realize the entire convolution channel semantic and spatial information calculation. UCTransNet is a recently proposed attention module inspired by the Self Attention Mechanism and Multi-Head Attention mechanisms in Transformer (Vaswani et al., Reference Vaswani, Shazier and Parmar2017), and its purpose is to enable the encoder-decoder to obtain more global information fusion. In this paper, an improved model based on U-net is proposed for the segmentation of specific units in sheet metal engineering drawings for heavy equipment manufacturing. The three models (a) (b) (c) in Figure 1 are all examples of model structures that improve the segmentation accuracy of different tasks by improving the U-net jump structure. (d) Figure 1 is a sheet metal engineering drawing outline extraction method based on the CBAM attention mechanism proposed in this paper, which is used for sheet metal segmentation in industrial equipment manufacturing.
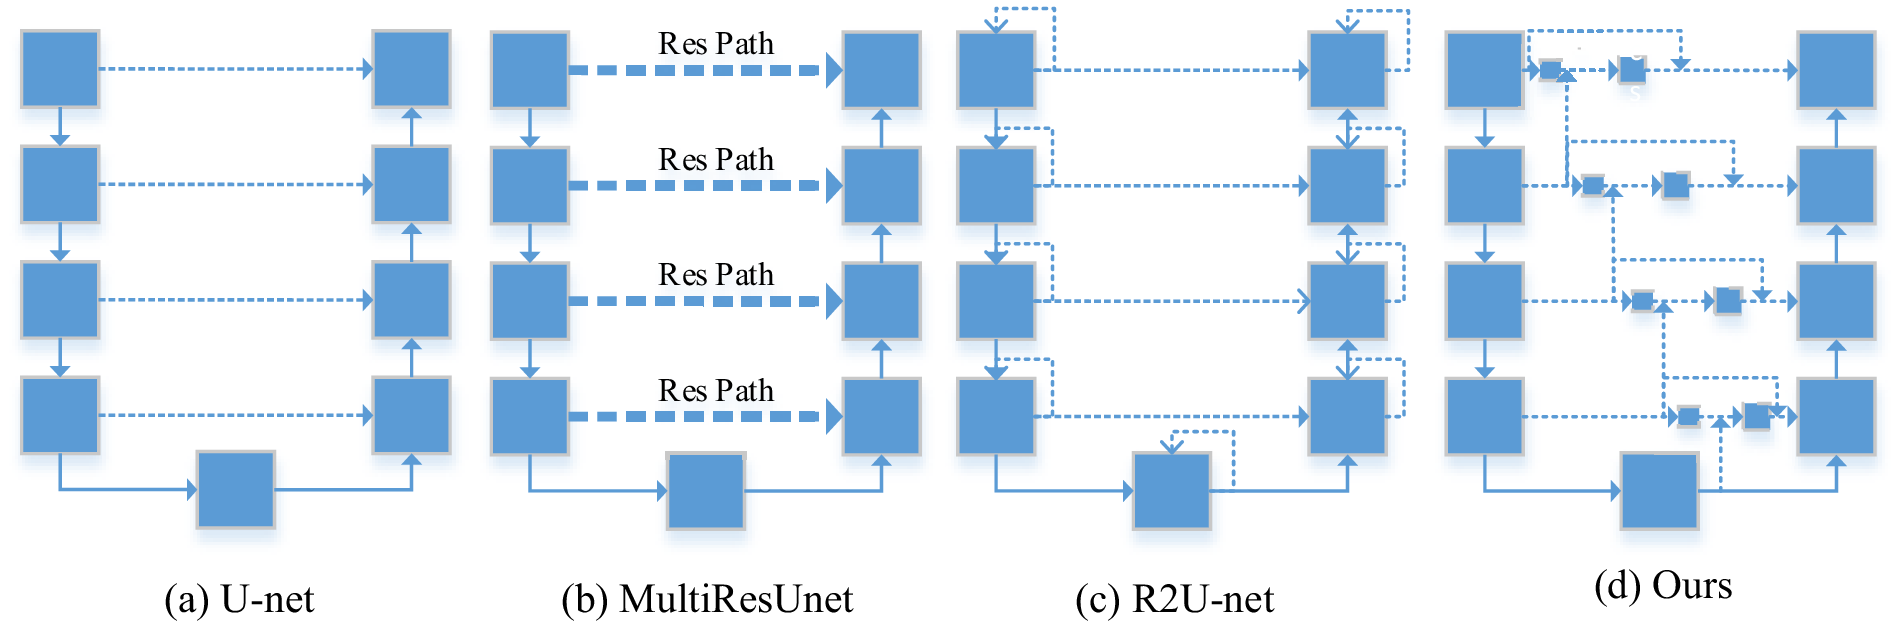
Figure 1. Comparison of our method (a) Skip connection structure of the original U-net model; (b) U-net model with residual network used as the skip connection; (c) U-net model with recurrent structures added to both the encoder and decoder; (d) with skip structure schemes of other models. Dashed lines denote skip connections.
By using traditional U-net to conduct feasibility experiments on the sheet metal welding pattern segmentation task, and using the attention mechanism to further study and analyze the structure and principle of U-net (Wang et al., Reference Wang, Jiang and Qian2017; Woo et al., Reference Woo, Park and Lee2018; Mohan and Bhattacharya, Reference Mohan and Bhattacharya2022). This paper proposes a dual-pooling convolutional fusion attention mechanism model based on CBAM, which considers the information fusion of channel and spatial dimensions as well as the dimensional difference between encoder and decoder features. Besides, this article proposes global information linkage between U-net encoders, which includes feature cluster integration between vertical encoders and vertical and horizontal double-pooling convolutions. The output features are fused with the original features through the attention module, and the whole jumps to the high-dimensional feature layer of the decoder to achieve secondary fusion. The improved U-net model can not only better extract global semantic features but also reduce the semantic differences in the process of encoder-decoder feature fusion. Compared with traditional models, this research method can better realize the global feature information fusion of encoder and decoder features, effectively reduce the dimensional difference between the low-dimensional encoder and high-dimensional decoder in the feature fusion process, and can better realize the segmentation of specific units in sheet metal engineering drawings. Through experimental verification, the method in this paper has better performance in the sheet metal graphics segmentation task. The main contributions of this study are as follows:
-
• Propose the automatic cutting technology of sheet metal parts based on U-net for heavy industry equipment manufacturing.
-
• The segmentation method combining CBAM and U-net is proposed to be suitable for (non-human-assisted) high-precision segmentation of sheet metal graphics.
-
• A double pooling + convolutional skip structure is proposed to reduce the dimensional difference between encoding and decoding features.
-
• A skip structure of vertical coding features is proposed to improve the fusion of global semantic information.
-
• The improved model has been verified for its high-performance segmentation capability of sheet metal graphics.
Related Work
CBAM-U-net model
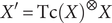
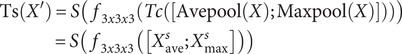
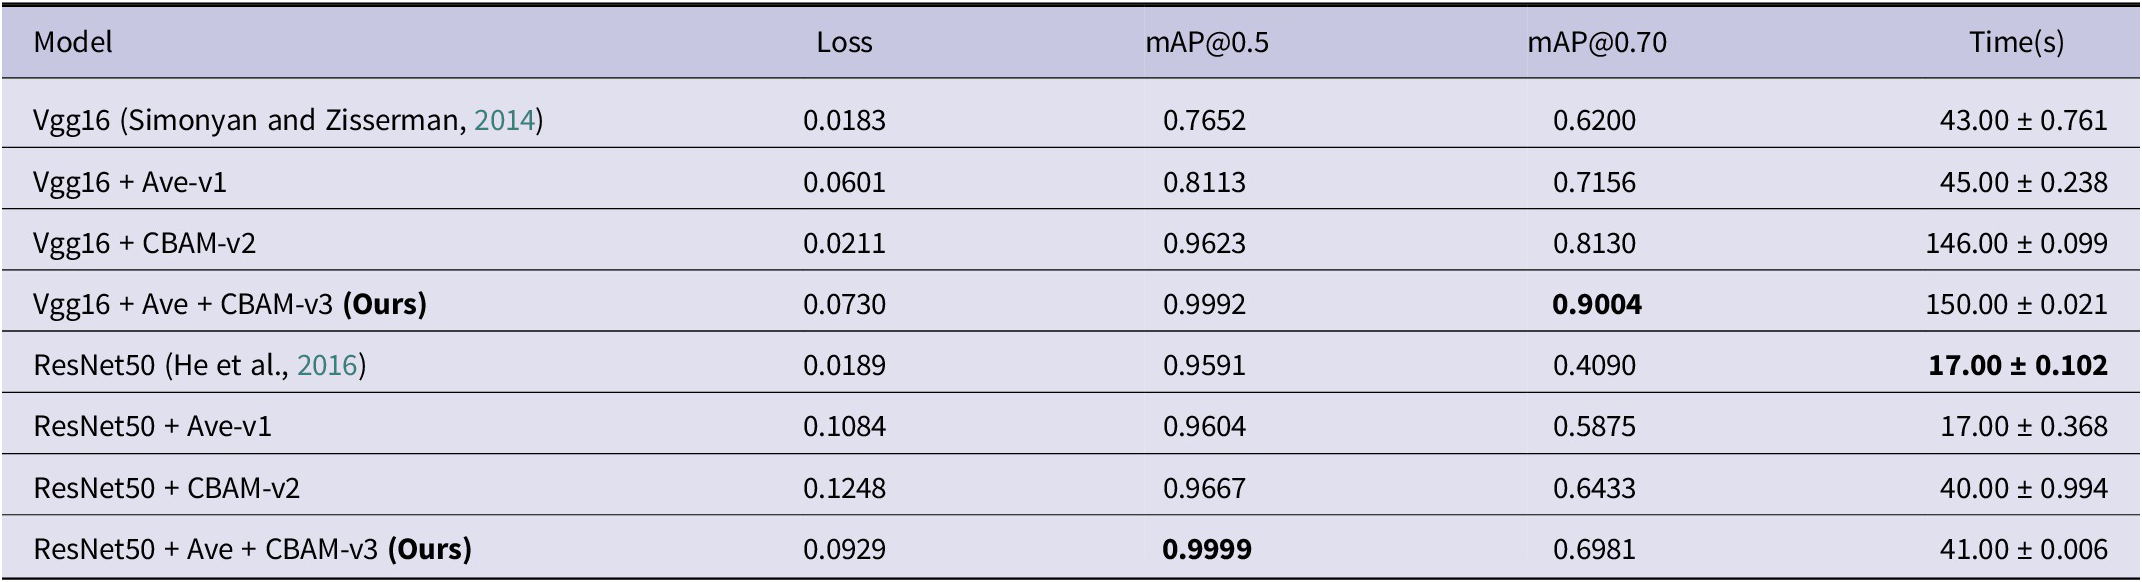
The Convolutional Block Attention Module (CBAM) (Woo et al., Reference Woo, Park and Lee2018) can improve the ability of the convolutional network to express the image of the feature layer, in the process of extracting image features, pay more attention to the feature factors that have a greater impact on the target, and suppress the expression of non-important features that have no obvious impact. Input the original sheet metal engineering drawing F, which is transformed into a featured image X through pooling + two convolution operations. The shallow feature map X∈ℝ C × H × W is input to the CBAM module, which infers the channel attention map Tc(X) and the planar spatial attention map Ts(X’), as shown in Figure 2. The overall attention process of the module is roughly as follows:
 $$ {X}^{\prime }=\mathrm{Tc}{(X)}^{\otimes }X $$
 $$ {X}^{{\prime\prime} }=\mathrm{Ts}{\left({X}^{\prime}\right)}^{\otimes }{X}^{\prime } $$
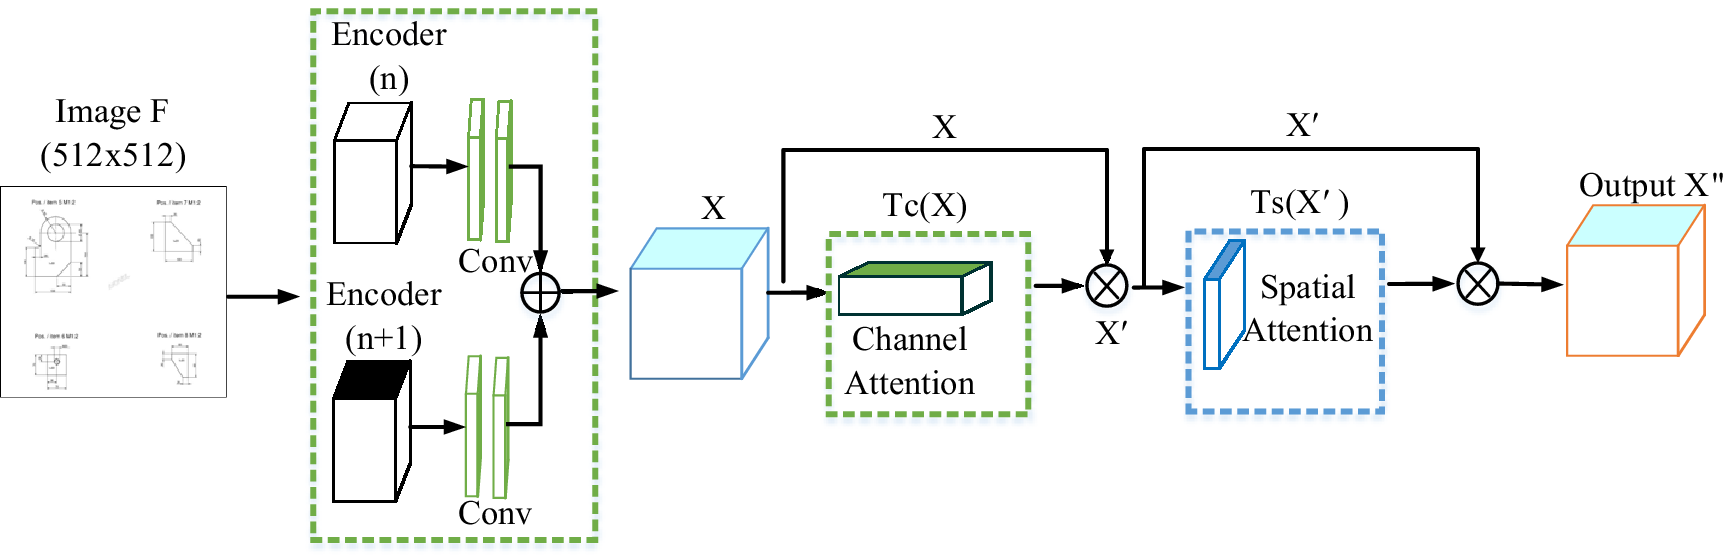
Figure 2. CBAM architecture. This module comprises a channel module and a spatial attention module consecutively. The encoder feeds the double-pooled and convolutional features into this module, and the CBAM generates global features with channel and spatial location information. (n) and (n + 1) respectively represent the encoders of different vertical layers of U-net.
where $ \otimes $
means element-wise multiplication. In the operation process, the CBAM module can continuously obtain the 1D channel attention feature map Tc(X)∈ℝ
C × 1 × 1 and the 2D spatial attention feature map Ts(X’)∈ℝ
1 × H × W according to the input feature map X∈ℝ
C × H × W. In image feature extraction, the CBAM module assigns corresponding attention weights to the image features that have a greater influence on the target task (the attention weights in the spatial direction are propagated in the channel direction, and vice versa). The feature map X” marked with channel-spatial attention weights calculated and output by the CBAM module is finer than the image features output by traditional U-net. At the same time, X” is upsampled by 2x2 and fused with the low-dimensional feature cluster of the horizontal encoder, and the final feature F′ is output. Image features F′ are combined with decoder upsampled graph feature clusters to reduce global contextual semantic differences. The overall improved U-net network structure is shown in Figure 3.
$ \otimes $
means element-wise multiplication. In the operation process, the CBAM module can continuously obtain the 1D channel attention feature map Tc(X)∈ℝ
C × 1 × 1 and the 2D spatial attention feature map Ts(X’)∈ℝ
1 × H × W according to the input feature map X∈ℝ
C × H × W. In image feature extraction, the CBAM module assigns corresponding attention weights to the image features that have a greater influence on the target task (the attention weights in the spatial direction are propagated in the channel direction, and vice versa). The feature map X” marked with channel-spatial attention weights calculated and output by the CBAM module is finer than the image features output by traditional U-net. At the same time, X” is upsampled by 2x2 and fused with the low-dimensional feature cluster of the horizontal encoder, and the final feature F′ is output. Image features F′ are combined with decoder upsampled graph feature clusters to reduce global contextual semantic differences. The overall improved U-net network structure is shown in Figure 3.
Figure 3. The improved model overall architecture is proposed in this paper (input raw image pixel 512x512). Green squares represent average pooling and two convolution operations ((all abbreviated as ‘Ave’ in the ablation experiments for ease of writing)), Orange squares represent the CBAM attention mechanism module, and indigo squares represent feature cluster integration. Different colored arrows indicate different operations.
U-net attention module
The residual attention network (Wang et al., Reference Wang, Jiang and Qian2017) adopts pre-activated residual units ResNeXt (Xie et al., Reference Xie, Girshick and Dollár2017) and Inception (Szegedy et al., Reference Szegedy, Ioffe and Vanhoucke2017) as a two-branch parallel network structure stacked with residual attention modules. Zhou et al. (Reference Zhou, Khosla and Lapedriza2016) and Hu et al. (Reference Hu, Shen and Sun2018) used average pooling to aggregate and count spatial information, respectively. The convolutional attention module uses inter-channel feature relationships to compress the spatial dimension of the input feature map to compute channel attention. Moreover, it is verified that the average pooling and max pooling simultaneously can improve the feature network’s representation ability. What is mentioned here is that the traditional CBAM directly performs the maximum pooling and average pooling operations on the image input. CBAM uses average pooling and maximum pooling to fuse the spatial information of semantic features to generate two different global semantic space information expression features Fcave and Fcmax. In improving the U-net model structure, we made a small change to this. Instead of directly inputting the sheet metal image F to the CBAM module, we input the features extracted and fused by the vertical encoder. Feed the fused features X into a shared multi-layer perceptron (MLP). Therefore, at this time, CBAM uses average pooling and maximum pooling operations to generate two different global semantic space information expression features: Xcave∈ℝ C × 1 × 1 and Xcmax∈ℝ C × 1 × 1. At the same time, the shared multi-layer perceptron performs integration + ReLU operation on the input feature clusters to generate channel attention feature maps Tc(X)∈ℝ C × 1 × 1. Tc(X) contains the attention feature relations between the various channel axes of the input feature X. Then, Tc(X) is fused with the input feature X (Note: X is the image feature after the original image F has been pooled and convolved by the upper and lower encoders) to generate a feature map X’. According to the semantic difference between the Upper-encoder and Lower-encoder features, the convolution and linear rectification unit (ReLU) are used to continue to calculate the spatial information relationship of the feature X’, and generate the attention space feature map Ts(X’). The channel attention feature X’ is merged with the spatial position attention feature Ts(X’) to generate a globally informative feature X” with channel-spatial dual attention. The detailed calculation process of the attention module is as follows.
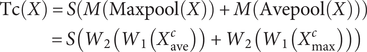 $$ {\displaystyle \begin{array}{l}\mathrm{Tc}(X)=S\left(M\left(\mathrm{Maxpool}(X)\right)+M\left(\mathrm{Avepool}(X)\right)\right)\\ {}\hskip4.1em =S\left({W}_2\left({W}_1\left({X}_{\mathrm{ave}}^c\right)\right)+{W}_2\left({W}_1\left({X}_{\mathrm{max}}^c\right)\right)\right)\end{array}} $$
where Tc(X) is a 1-dimensional channel attention image feature, S is a sigmoid activation function, and M represents a multi-layer perceptron (MLP) shared layer. Maxpool(X) and Avepool(X) are the secondary pooling operations of horizontal low-dimensional encoder features and vertical high-dimensional encoder features, respectively (X is the result of vertical maximum pooling and horizontal average pooling). W1 and W2 represent the shared weights of the input multi-layer perceptron (MLP). The output of the ReLU activation layer is W1. The extraction process of spatial feature information in the CBAM structure is similar to that of channel feature extraction. The difference is that the sheet metal graphic feature F is input into the CBAM module as X after the convolution operation. The CBAM module still uses maximum pooling and minimum pooling to fuse image feature semantic information to generate two 2D images: Xsave∈ℝ 1 × H × W and Xsmax∈ℝ 1 × H × W. And perform a convolution operation on it to generate an image Ts(X’) containing spatial feature information. (It is worth noting that we use three 3x3 convolutions instead of 7x7 convolutions in CBAM to reduce calculation parameters). The image spatial feature information is calculated as follows:
 $$ {\displaystyle \begin{array}{l}\mathrm{Ts}\left({X}^{\prime}\right)=S\left(\hskip0.4em {f}_{3x3x3}\left( Tc\left(\right[\mathrm{Avepool}(X);\mathrm{Maxpool}(X)\left]\right)\right)\right)\\ {}\hskip4.4em =S\left(\hskip0.4em {f}_{3x3x3}\left(\left[{X}_{\mathrm{ave}}^s;{X}_{\mathrm{max}}^s\right]\right)\right)\end{array}} $$
Ts(X’) is a 2-dimensional spatial position information feature, and f3x3x3 represents three 3x3 convolution operations. Among them, the spatial attention feature layer performs average pooling and maximum pooling operations on the channel attention feature layer Tc(X) during the calculation process, instead of inputting the welding graph F. The detailed structure of the attention module is shown in Figure 4. Experiments were conducted only on sheet metal engineering drawings of heavy equipment provided by MCC (a partner company). Vgg16 and ResNet50 are used as the backbone networks to validate the modeling performance of this paper’s method, respectively. From the computational analysis results in Table 1, it can be concluded that the method proposed in this paper, in terms of average accuracy, is significantly better than both Vgg16 and ResNet50 as the baseline. In addition to that, the Vgg16 model using this paper’s method is better than ResNet50 in terms of global segmentation effect.
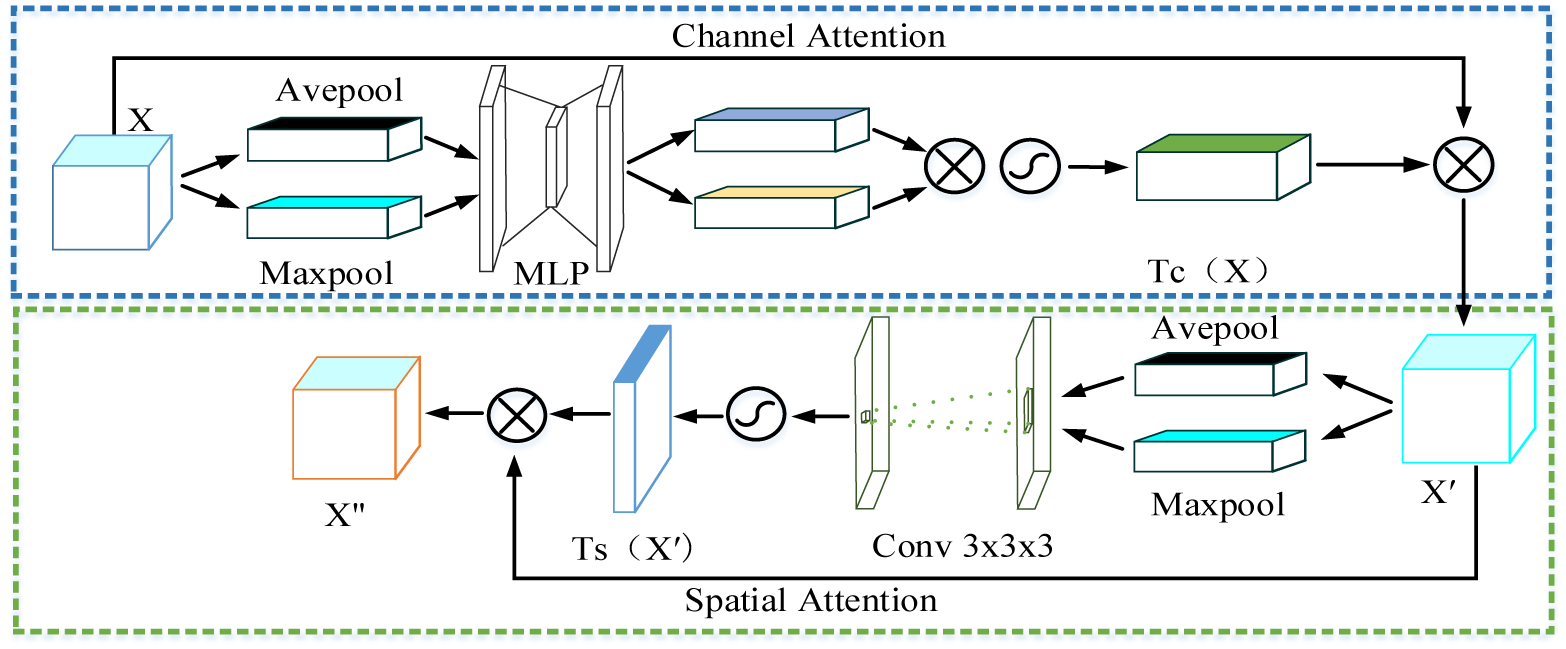
Figure 4. Principle of attention mechanism. X is used as input to the multi-layer perceptron (MLP), and the feature X’ with channel attention information is generated through feature cluster multiplication and Softmax operation. X’ output features X” with channel spatial information through a similar operation of the spatial attention module.
Table 1. Training cost analysis and model mean accuracy comparison between Vgg16 and ResNet50 with different model structures
Note: Same benchmark, bold font means excellent.
This study improves the U-net segmentation network, the main purpose of which is to use artificial intelligence to apply it to the manufacturing process of heavy industry equipment welding engineering, so that it can automatically cut the entire sheet metal, thereby liberating labor and improving enterprise efficiency. Encapsulate the improved model after training in an integrated cutting and processing center with visual functions to realize the automatic cutting of sheet metal parts in the process of intelligent manufacturing. The specific process is shown in Figure 5. At present, this research has been initially applied to the cutting processing center of China Metallurgical Equipment Corporation to realize a simple sheet metal cutting test.
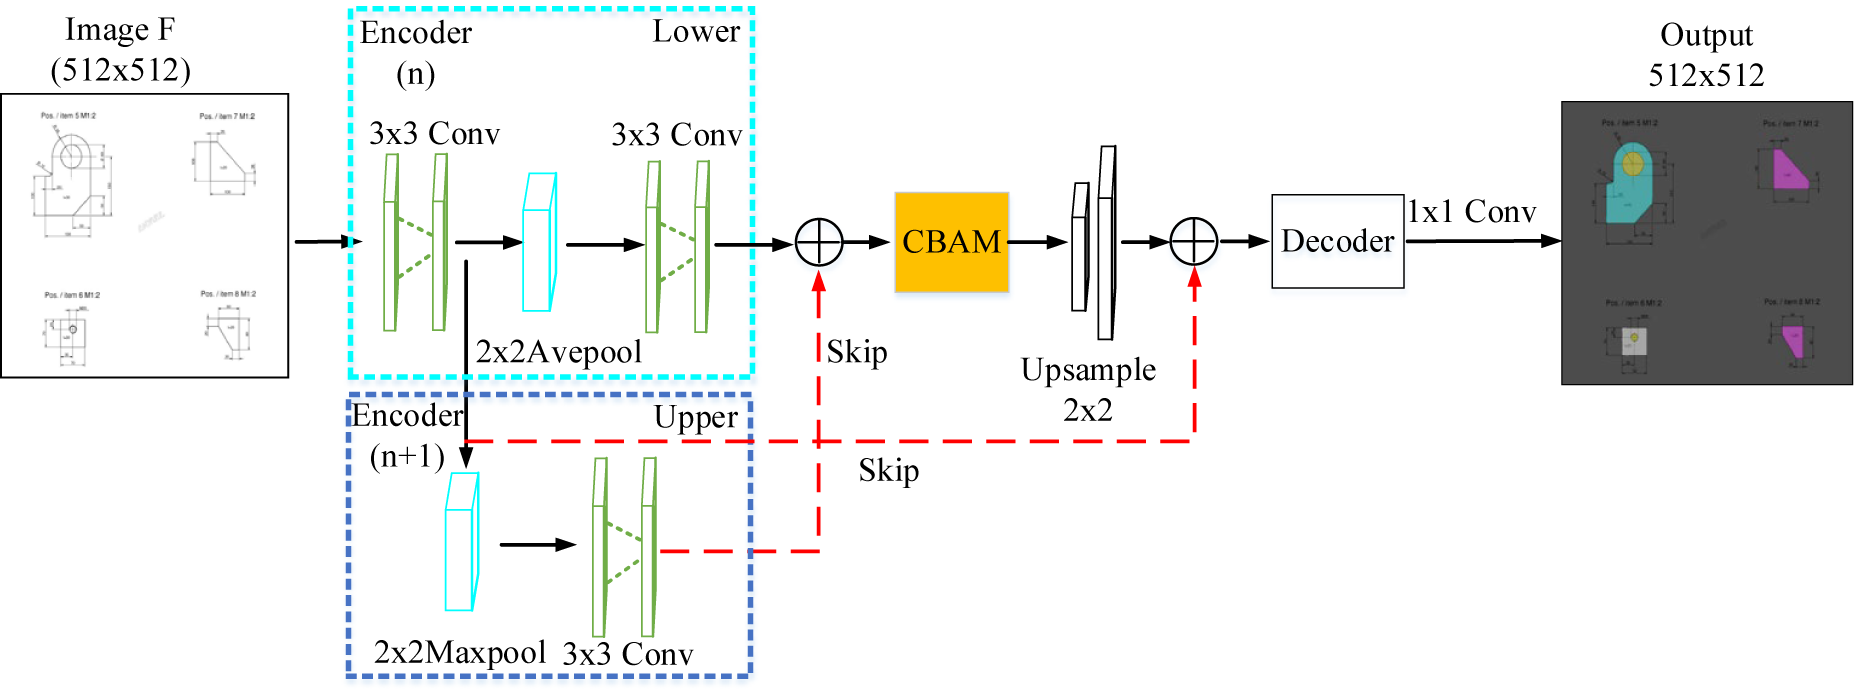
Figure 5. Improve the U-net model by cutting sheet metal specific contour mechanism. Segmentation extracts the specific unit of welding engineering graphics, and the cutting device automatically cuts the corresponding parts on the whole sheet metal relying on vision.
Experiments
Dataset
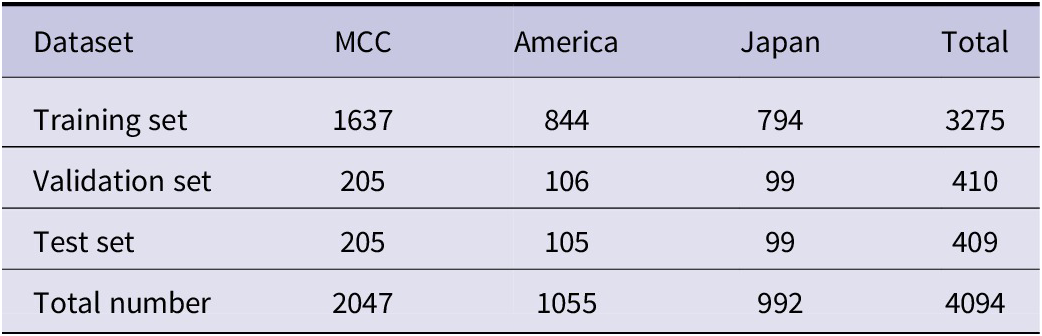
The training data set is a non-public engineering atlas of complex welding structures used in the manufacture of heavy industry equipment provided by the cooperative heavy-pressure riveting and welding company, as well as some public welding engineering atlases in the United States and Japan. Its quantity is shown in Table 2. It is well known that the size of the dataset directly affects the training results, and the network may overfit when there are few training samples. To avoid the problem of biased training results due to the small number of data sets, data set enhancement processing is performed on the provided data sets. First of all, this study uses manual annotation to select 600 welding engineering graphics provided by China Metallurgical Group, the United States, and Japan from the welding equipment engineering atlas collection. The dataset was augmented by cropping, mirroring, deflecting, adding noise, etc., resulting in a dataset of 4094 annotated engineering drawings.
Table 2. Sources of welding engineering datasets and the number of datasets after data enhancement processing
Evaluation metrics
 $$ \mathrm{IoU}=\frac{\mathrm{Area}\left( Pp\cap Pgt\right)}{\mathrm{Area}\left( Pp\cup Pgt\right)} $$ $ Pp $
is the prediction frame,
$ Pp $
is the prediction frame, $ Pgt $
is the ground truth frame, and
$ Pgt $
is the ground truth frame, and $ IoU $
is the intersection area of the
$ IoU $
is the intersection area of the $ Pp $ $ Pgt $
regions divided by the union area.
$ Pgt $
regions divided by the union area.
 $$ \mathrm{Accuracy}=\frac{\left(\mathrm{TP}+\mathrm{TN}\right)}{\left(\mathrm{TP}+\mathrm{FP}+\mathrm{FN}+\mathrm{TN}\right)} $$ $ \mathrm{TP} $
This means that the sample is positive and the predicted value is positive.
$ \mathrm{TP} $
This means that the sample is positive and the predicted value is positive. $ \mathrm{FP} $
This means that the sample is negative and the predicted value is positive.
$ \mathrm{FP} $
This means that the sample is negative and the predicted value is positive. $ \mathrm{FN} $
This means that the sample is positive and the predicted value is negative.
$ \mathrm{FN} $
This means that the sample is positive and the predicted value is negative. $ \mathrm{TN} $
This means that the sample is negative and the predicted value is negative.
$ \mathrm{TN} $
This means that the sample is negative and the predicted value is negative.
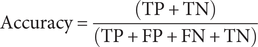
Accuracy is used to judge the accuracy of the prediction results, the total number of correct predictions the total number of samples. There are two cases when the prediction is accurate: the sample is positive, the prediction is positive, and the sample is negative.
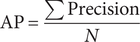 $$ \mathrm{AP}=\frac{\sum \Pr \mathrm{ecision}}{N} $$
Precision is the sample precision, and N is the total number of samples.
 $$ m\mathrm{AP}=\frac{\sum \mathrm{AP}}{N\mathrm{class}} $$ $ \mathrm{AP} $
is the average precision and
$ \mathrm{AP} $
is the average precision and $ N\mathrm{class} $
the number of classes.
$ N\mathrm{class} $
the number of classes. $ \mathrm{AP} $
The average precision rate is the sum of the precision rates for each sample (of a particular category) divided by the total number of samples.
$ \mathrm{AP} $
The average precision rate is the sum of the precision rates for each sample (of a particular category) divided by the total number of samples. $ m\mathrm{AP} $
Is the mean, and the average precision is the sum of the
$ m\mathrm{AP} $
Is the mean, and the average precision is the sum of the $ \mathrm{AP} $
values of all categories divided by the number of categories (note:
$ \mathrm{AP} $
values of all categories divided by the number of categories (note: $ m\mathrm{AP} $
in the table is the
$ m\mathrm{AP} $
in the table is the $ m\mathrm{AP} $
of the validation set).
$ m\mathrm{AP} $
of the validation set).
Implementation details
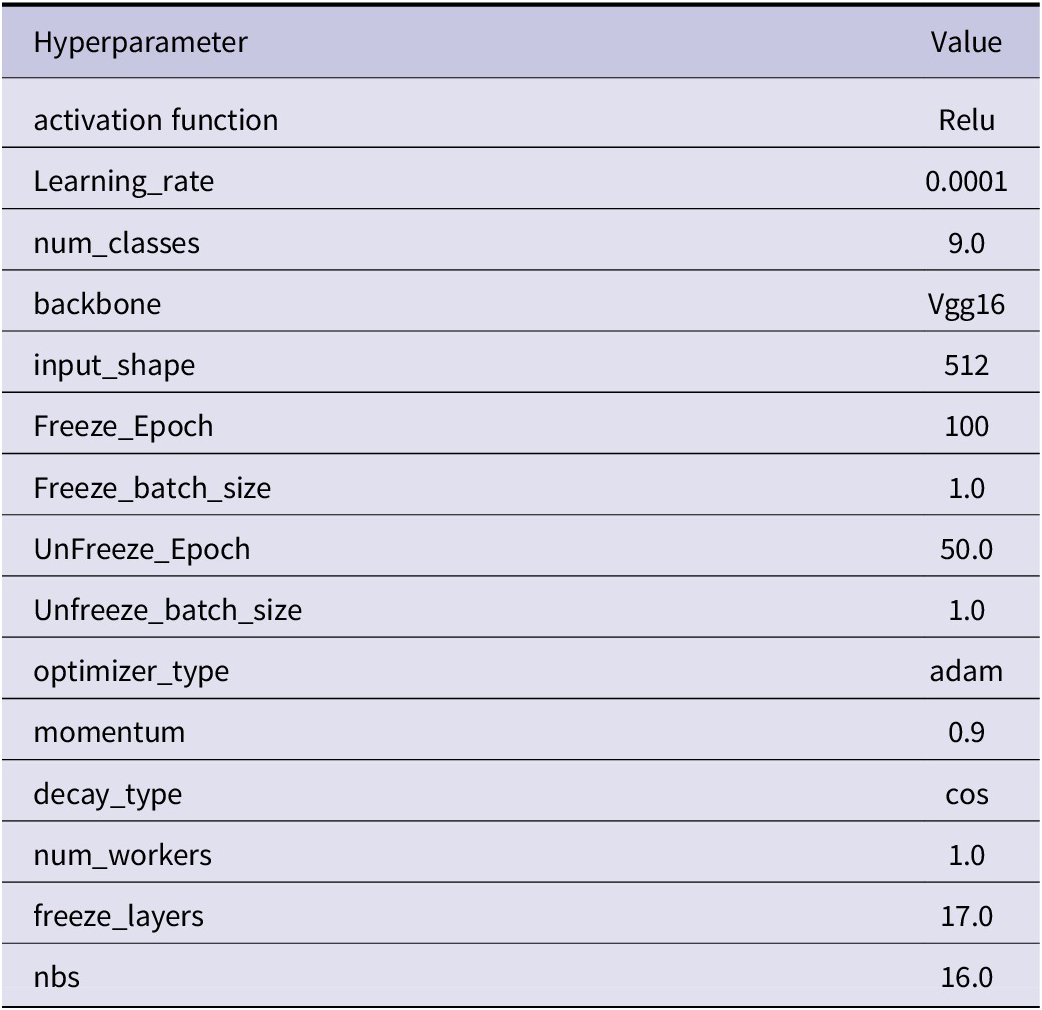
This experiment is carried out on the environment framework environment of Anaconda3, using the GPU accelerated training method of CUDA parallel computing architecture. Vgg16 (Simonyan and Zisserman, Reference Simonyan and Zisserman2014) serves as the backbone network for the whole structure, the input graph size is 512 x 512, and the optimizer is trained using the Adam optimizer with internal momentum = 0.9. Considering memory issues, a pre-trained model with a total number of Epochs of 100 is used during the experiments and frozen experiments are performed. The initial learning rate is set to 0.0001 and the minimum learning rate is 0.000001 in cos descent. Since this segmentation experiment has 9 classes, Dice loss is not used during the experiment. Model hyperparameters used for all experiments are shown in Table 3.
Table 3. Hyperparameter values are used for all training
In addition, by combining the actual requirements and comparing the use of the Focal loss with better results, the main purpose is to reduce the weight of easily distinguishable samples and focus on samples that are difficult to distinguish. The experimental comparison results are shown in Table 4. When the network is trained to the 50th epoch, the network starts to load and evaluate the validation set. The K-fold cross-validation method (K = 5) was used to validate the model as shown in Figure 6.
Table 4. The performance comparison results of various loss functions used by CBAM-U-net to deal with imbalanced datasets
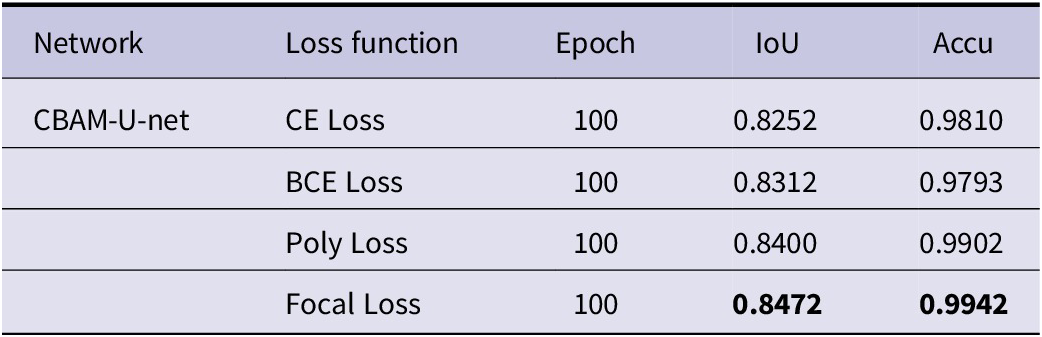
Note: Same benchmark, bold font means excellent.
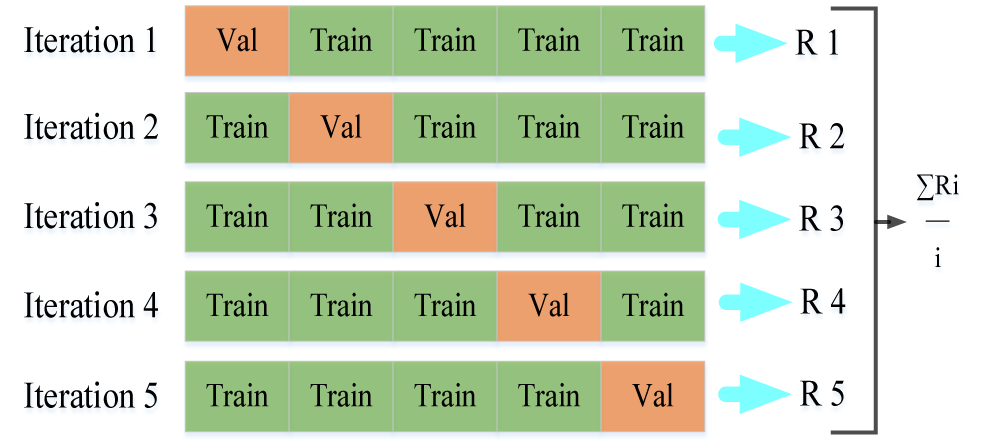
Figure 6. The welding engineering atlas adopts a K-fold cross-training verification process, the training set and verification sets are 4:1, and the stratification factor is K = 5.
Sheet metal cutting techniques in the manufacture of heavy equipment must comply with international standards. The method in this paper is used to segment and extract specific unit contours from sheet metal engineering drawings, and the segmentation accuracy of the graphic boundaries meets the weld width and fineness required by MCC-Shaanxi Pressure Company. The technical requirements of the sheet metal welding drawing are shown in Table 5.
Table 5. Technical requirements detail sheet
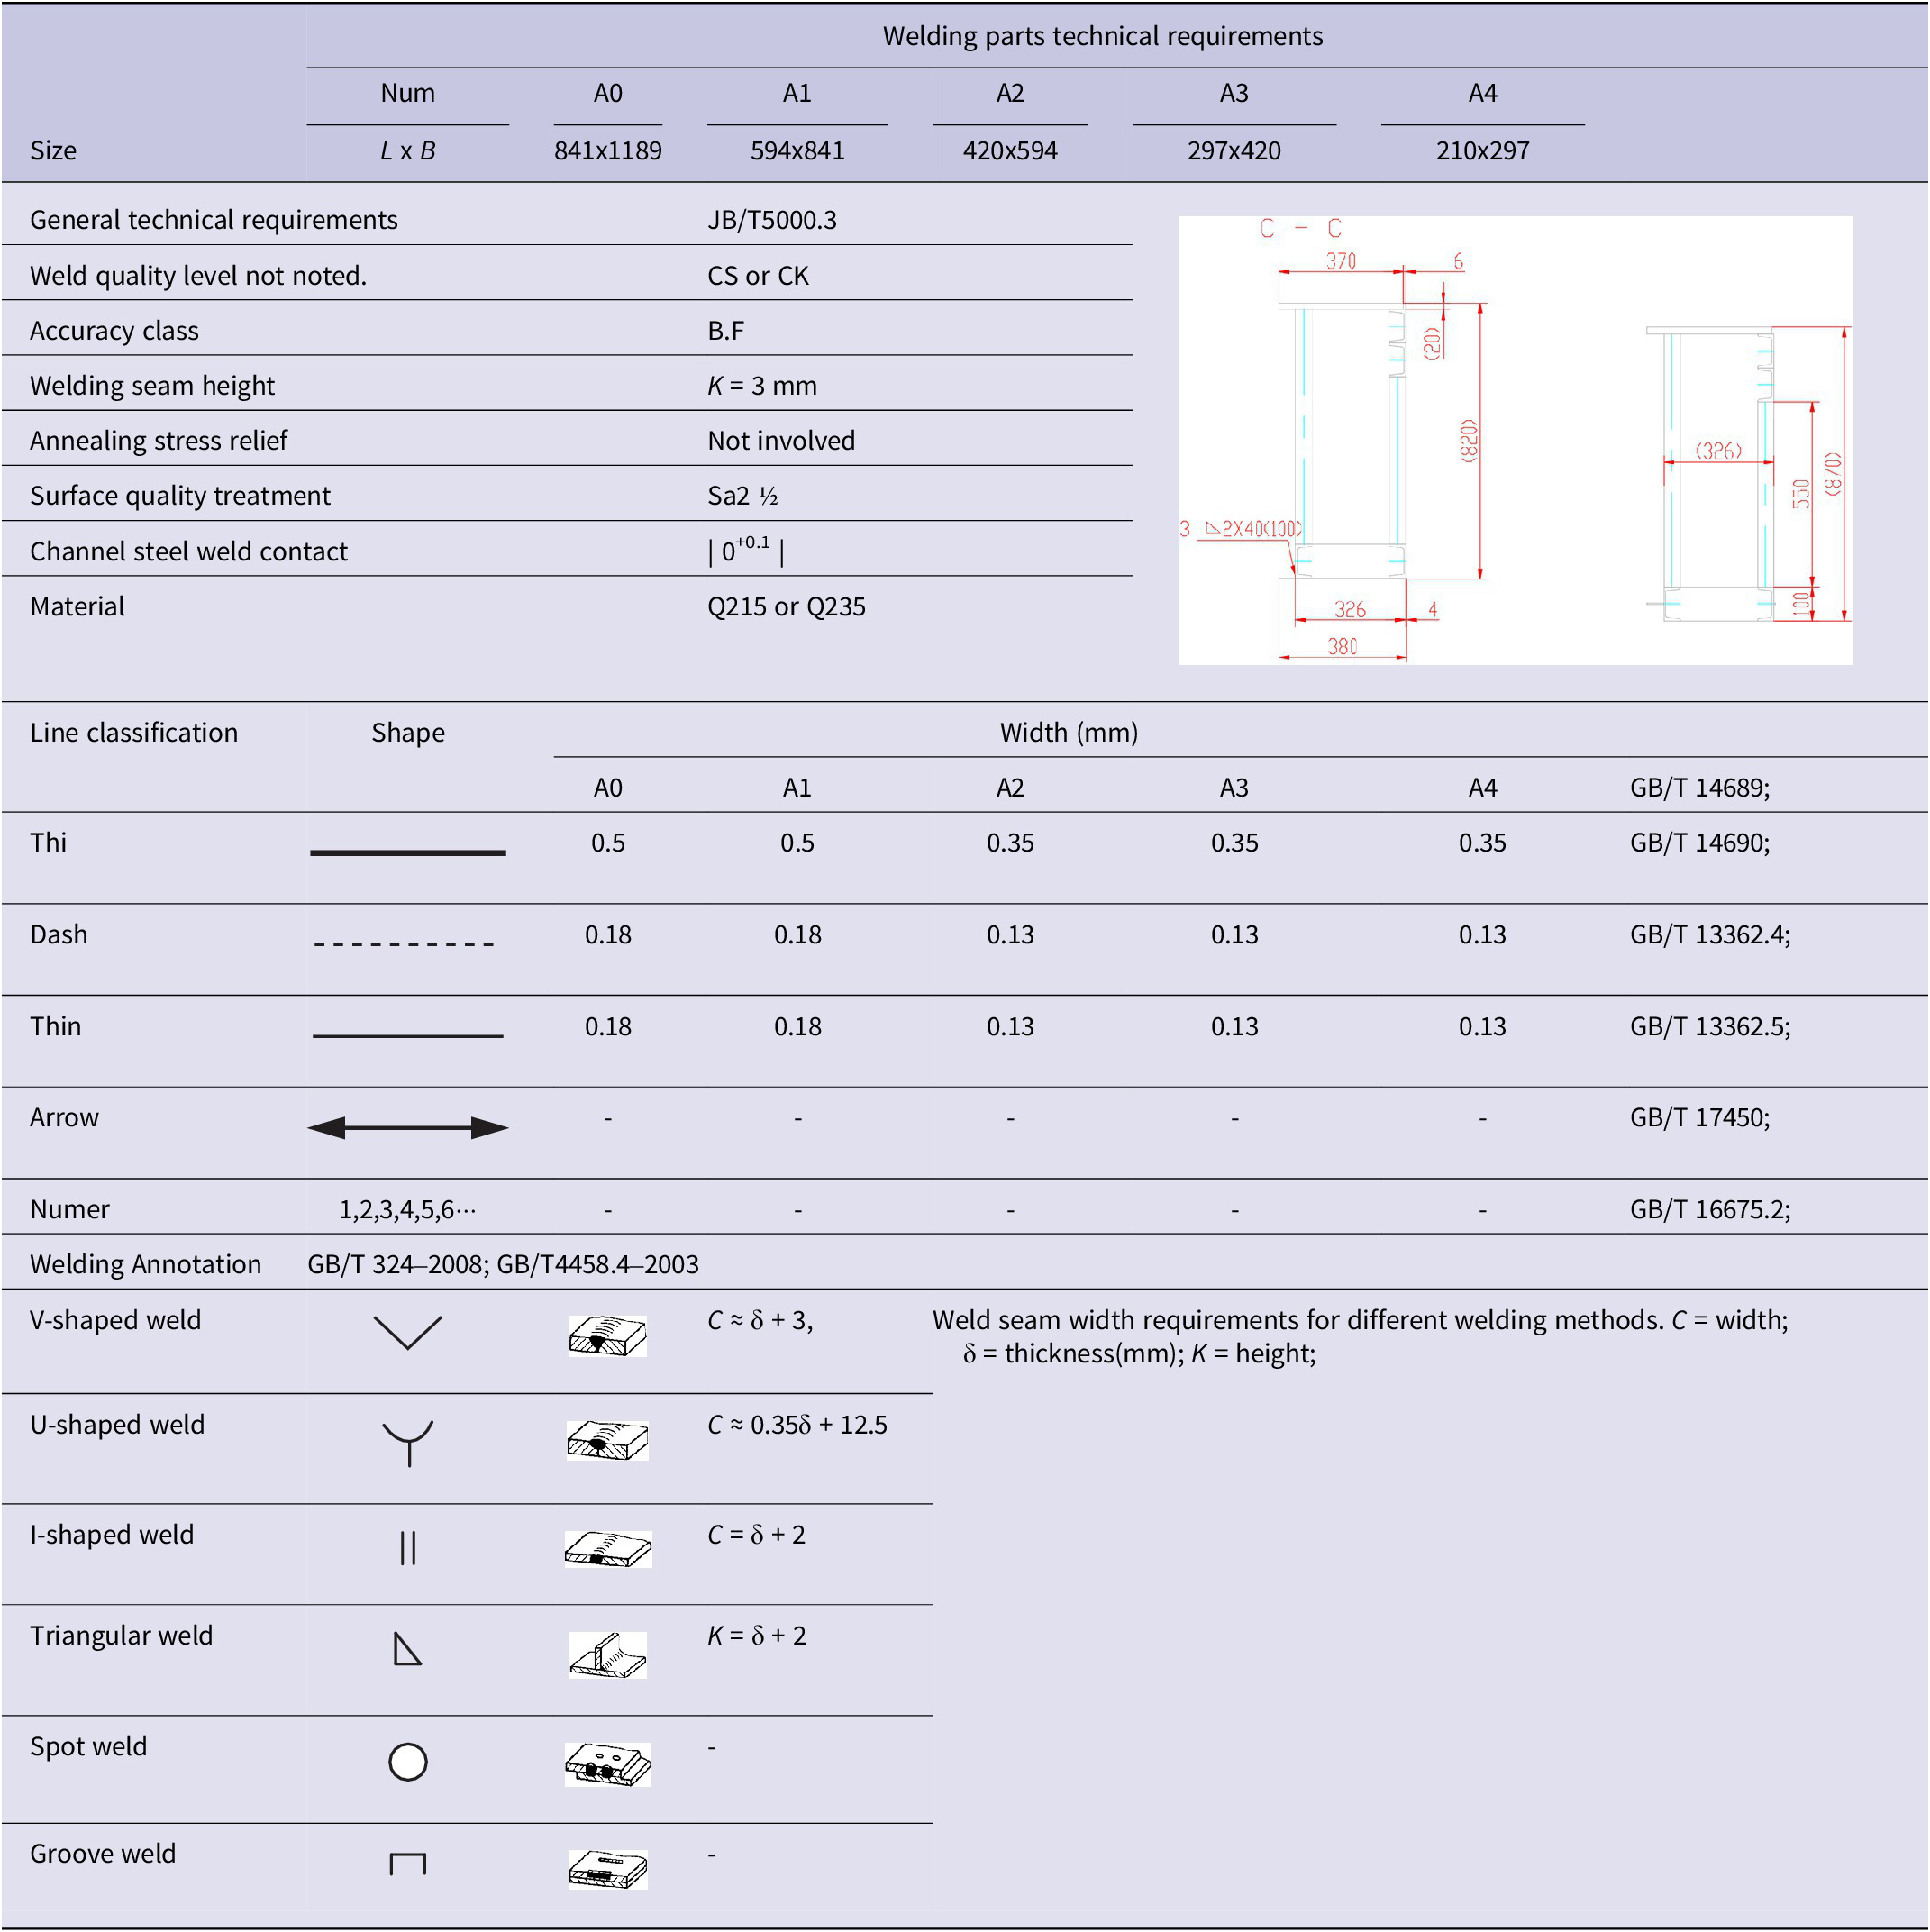
Note: Thick solid lines, thin solid lines, dashed lines, arrow lines, and number lines are denoted by ‘Thi’, ‘Thin’, ‘Dash’, “Arrow “and “Numer” are indicated.
The performance of the improved welded graph U-net segmentation model was evaluated by using the Intersection Over Union (IoU), Accuracy (Accu), and Mean Prediction Precision (mAP) metrics. Its training loss curve is shown in Figure 7. During the experimental training process, the Loss plot verifies that the model structure of this paper is stable and there is no model collapse. To directly demonstrate the segmentation effect of our proposed U-net improved model on welding engineering drawings, the results are compared with the traditional U-net segmentation effect through ablation experiments. Its visualization effect is shown in Figure 8. By comparing the traditional U-net segmentation performance with the horizontal encoder average pooling + double convolution vertical encoder jump structure fusion method proposed in this paper, a comparative experiment is carried out. After that, we continue to compare the traditional U-net segmentation performance with the crossbar encoder jump structure of the attention mechanism CBAM proposed in this paper. The results of the comparative experiments are shown in Table 6.
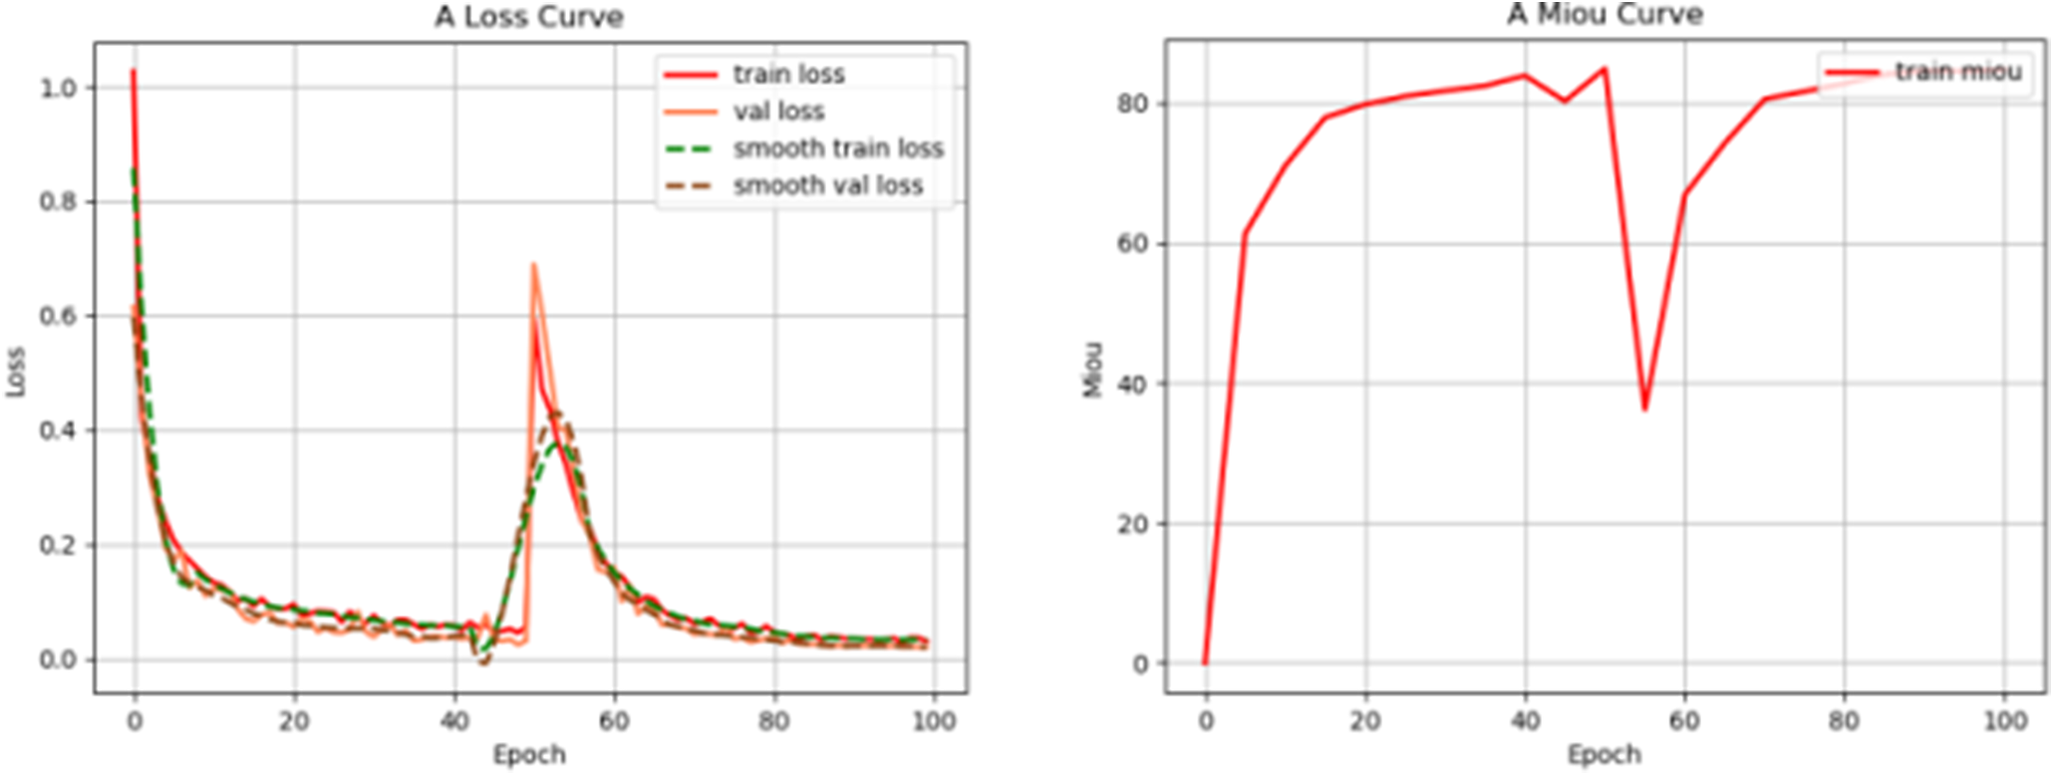
Figure 7. The loss curve graph during training and the 50th epoch model reaches a state of convergence. When training to 50 epochs, the network starts to unfreeze the evaluation model. The model will be reloaded from its original form, and fluctuations will have no effect.
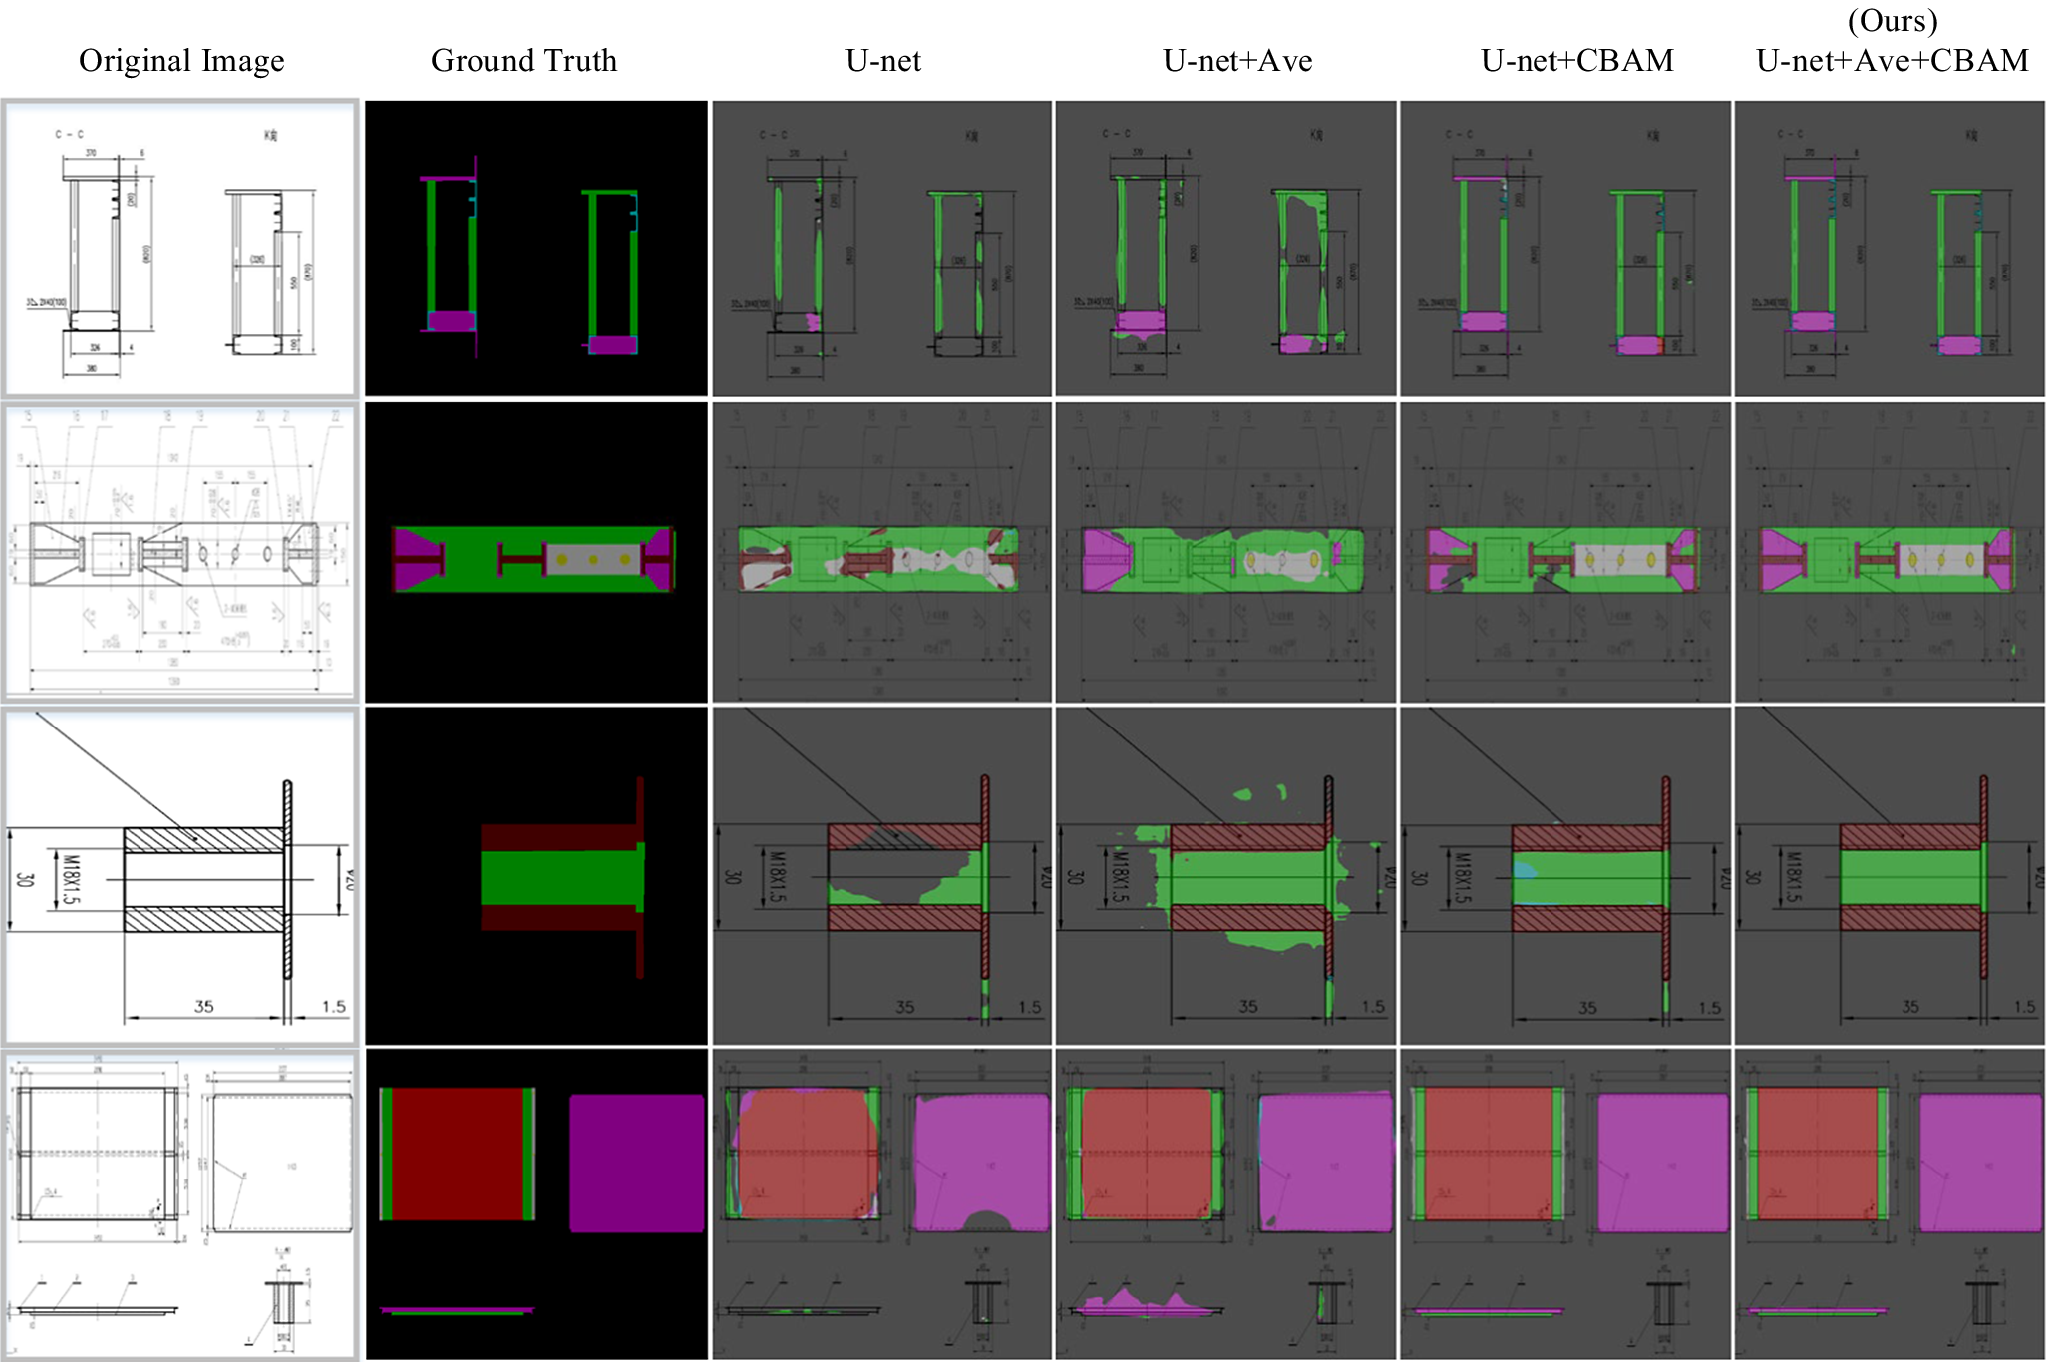
Figure 8. Visual comparison of segmentation effects between different methods. The original input is a welded structure drawing, and the second column is the ground truth mask. Where ‘Ave’ is denoted as the average pooling and convolution operations as green squares in Figure 3, CBAM is the attention module, as shown in the orange court in Figure 3.
Table 6. Comparison of welding engineering map segmentation by different methods, ‘Ave’ is denoted as average pooling and convolution operations, and CBAM is denoted as attention module
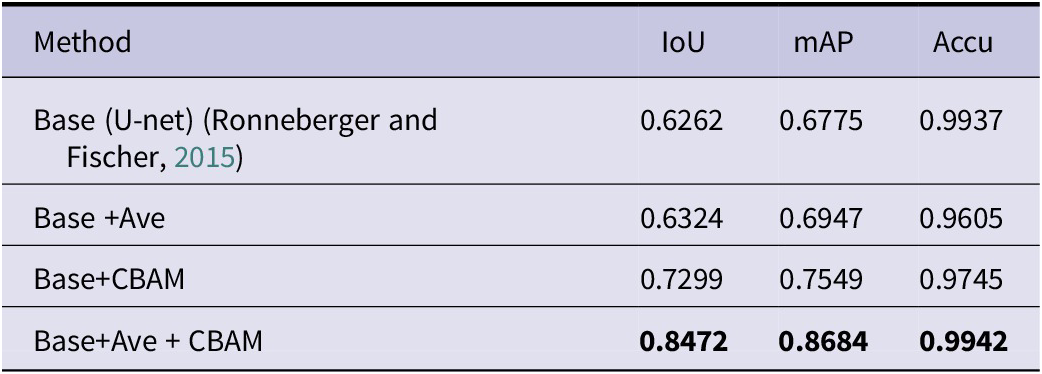
Note: Same benchmark, bold font means excellent.
To avoid problems such as the increased variance of the estimated value and mean shift when the network model extracts features. In the U-net improved model, this paper proposes to use horizontal low-dimensional encoder average pooling and vertical high-dimensional encoder maximum pooling to better capture global feature information. After the encoder performs a double pooling operation, its horizontal encoder continues to perform two convolution operations to extract higher-dimensional spatial information of the image. The input image resolution is 512x512, and the encoder uses a repeated convolution operation of 3x3 (same padding), followed by a linear rectification unit (ReLU). The vertical high-dimensional encoder uses max-pooling with stride 2 of size 2x2, and the horizontal encoder uses equal-sized average pooling. Perform two 3x3 (same padding) convolution operations on the average pooled semantic features. The semantic feature clusters of the vertical high-dimensional encoder after max-pooling convolution are fused with the semantic feature clusters of the horizontal low-dimensional encoder after average pooling convolution. The fused feature clusters are input into the jump structure module of the CBAM attention mechanism to realize global context information fusion. The feature information output by the improved model added to the attention mechanism module is fused with the feature information of the low-dimensional encoder (this low-dimensional feature information does not perform any pooling operation). Finally, the dimensionality reduction of the fused semantic features is performed through 1x1 convolution through the jump structure, and the features with a resolution of 512x512 channels and 64 channels after upsampling by the decoder are fused again. Perform 3x3 convolution and 1x1 convolution on the integrated feature map to realize the mapping of each component feature vector class and achieve its segmentation effect.
To further verify the scientificity and effectiveness of the method proposed in this paper, we use CNN to continue to use this method to segment and extract the specific outline of the welding engineering drawing. Abandoning the jumping structure of the traditional U-net, the method proposed in this paper is applied to the traditional convolutional neural network to perform segmentation and extraction experiments on welding graphics. The model uses consecutive 3x3 convolution operations, and the last layer uses the principle of mapping to achieve the segmentation effect. By using double-pooling convolution operations and adding attention mechanism operations in the CNN network model, different CNN models are compared for segmentation performance experiments. Figure 9 shows the Loss diagram of the CNN model with dual pooling convolutional fusion and attention mechanism added simultaneously, from which it can be seen that the model has no collapse phenomenon and the structure is stable for training. The visualization result of the specific contour segmentation of the welding engineering drawing is shown in Figure 10.
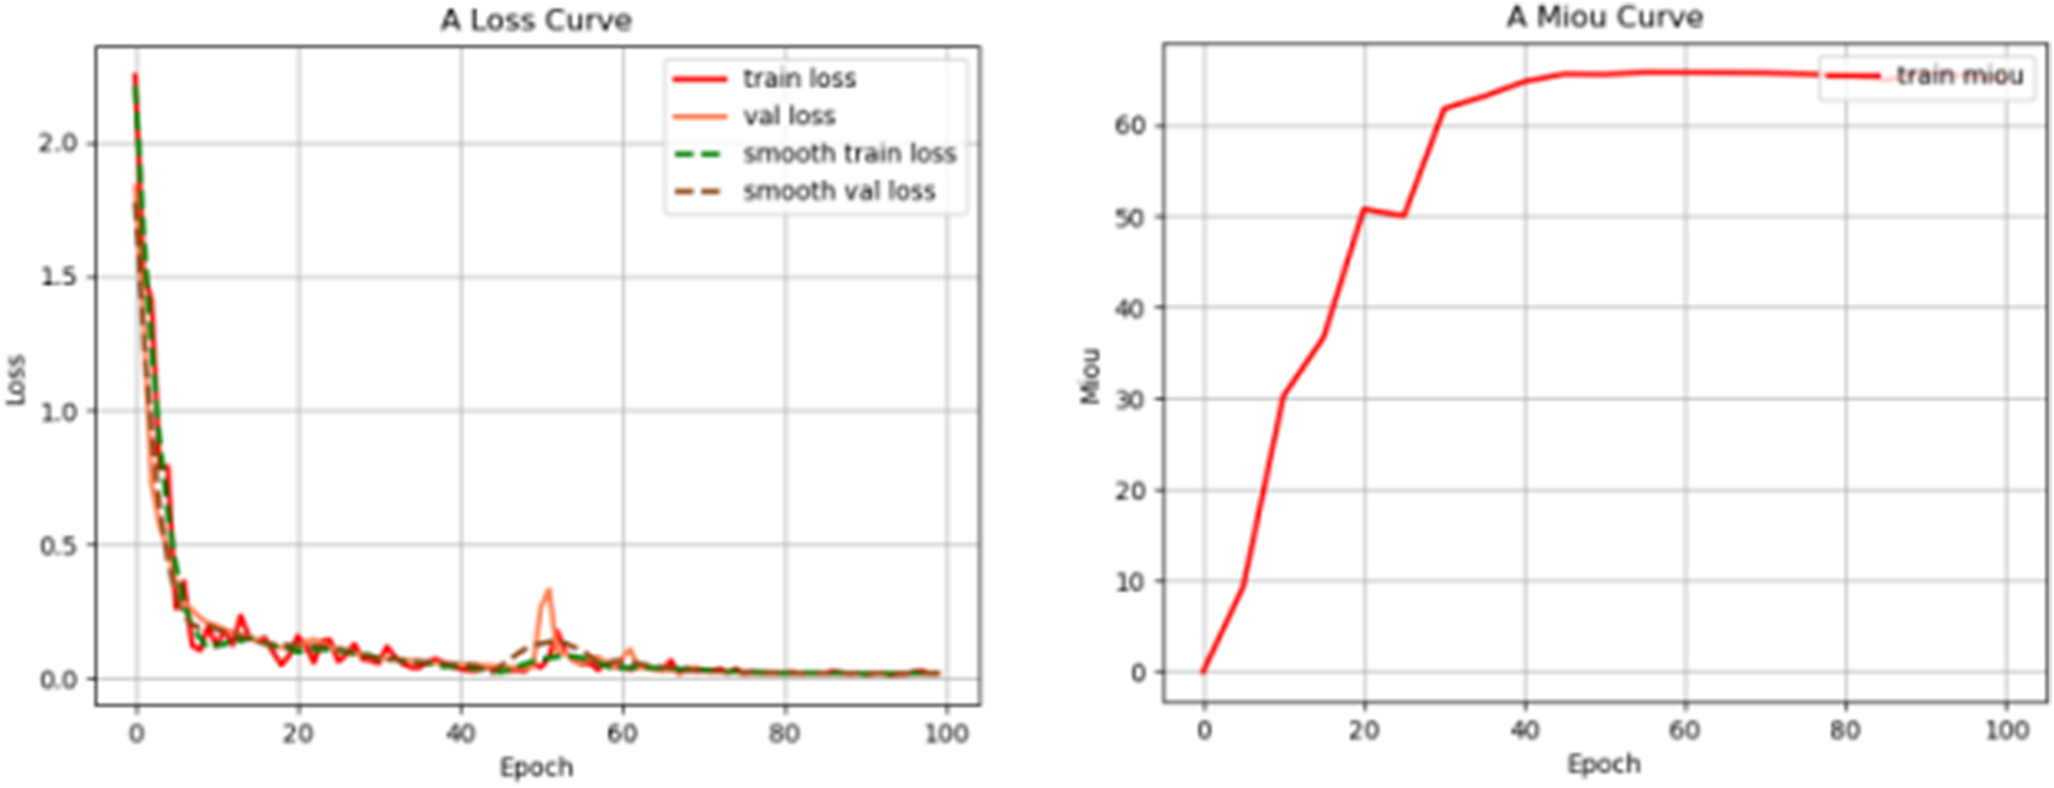
Figure 9. A graph of the loss curve of a continuous convolutional CNN. When the training has gone through 45 epochs, the model reaches the state of convergence.

Using the traditional multi-layer convolutional neural network as the baseline, the CNN network structure model is constructed using the method in this paper, and different CNN models are experimentally compared on the task of segmenting specific contours in heavy equipment welding engineering drawings. The experimental details are shown in Table 7. It can be concluded from Table 7 that the method proposed in this paper has high accuracy in segmenting and extracting specific contours in heavy equipment engineering drawings.
Table 7. In the comparison of different methods for the segmentation results of specific welding engineering units, ‘Ave’ is expressed as the average pooling and convolution operation, and CBAM is the attention mechanism
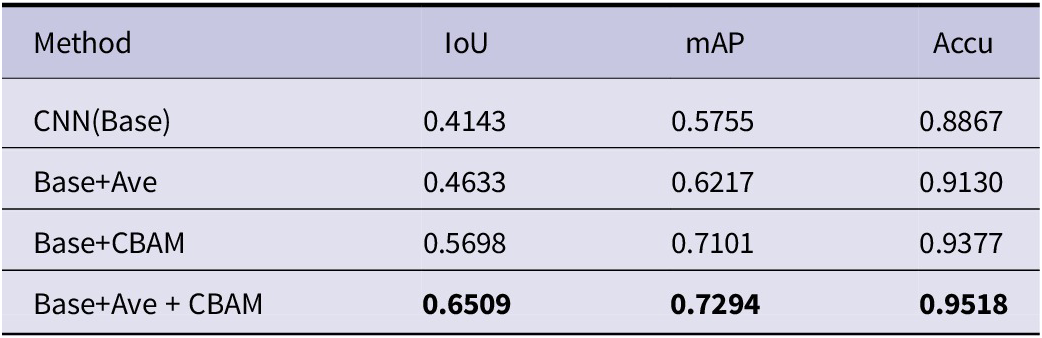
Note: Same benchmark, bold indicates excellent.
At the same time, ablation comparison experiments are carried out with this paper’s method and different excellent segmentation techniques on the task of segmenting sheet metal engineering drawings in intelligent manufacturing. The experiments show that the method of this paper has excellent segmentation accuracy for the segmentation of the contents of sheet metal engineering drawings for engineering manufacturing, and also fully verifies the scientificity of the method of this paper. The details of the SOTA experiments are shown in Table 8.
Table 8. Experimental comparisons and analyses have been carried out using the method of this paper and the current state-of-the-art segmentation technique (SOTA), and the experimental results have been analyzed for different sets of sheet metal welding project drawings
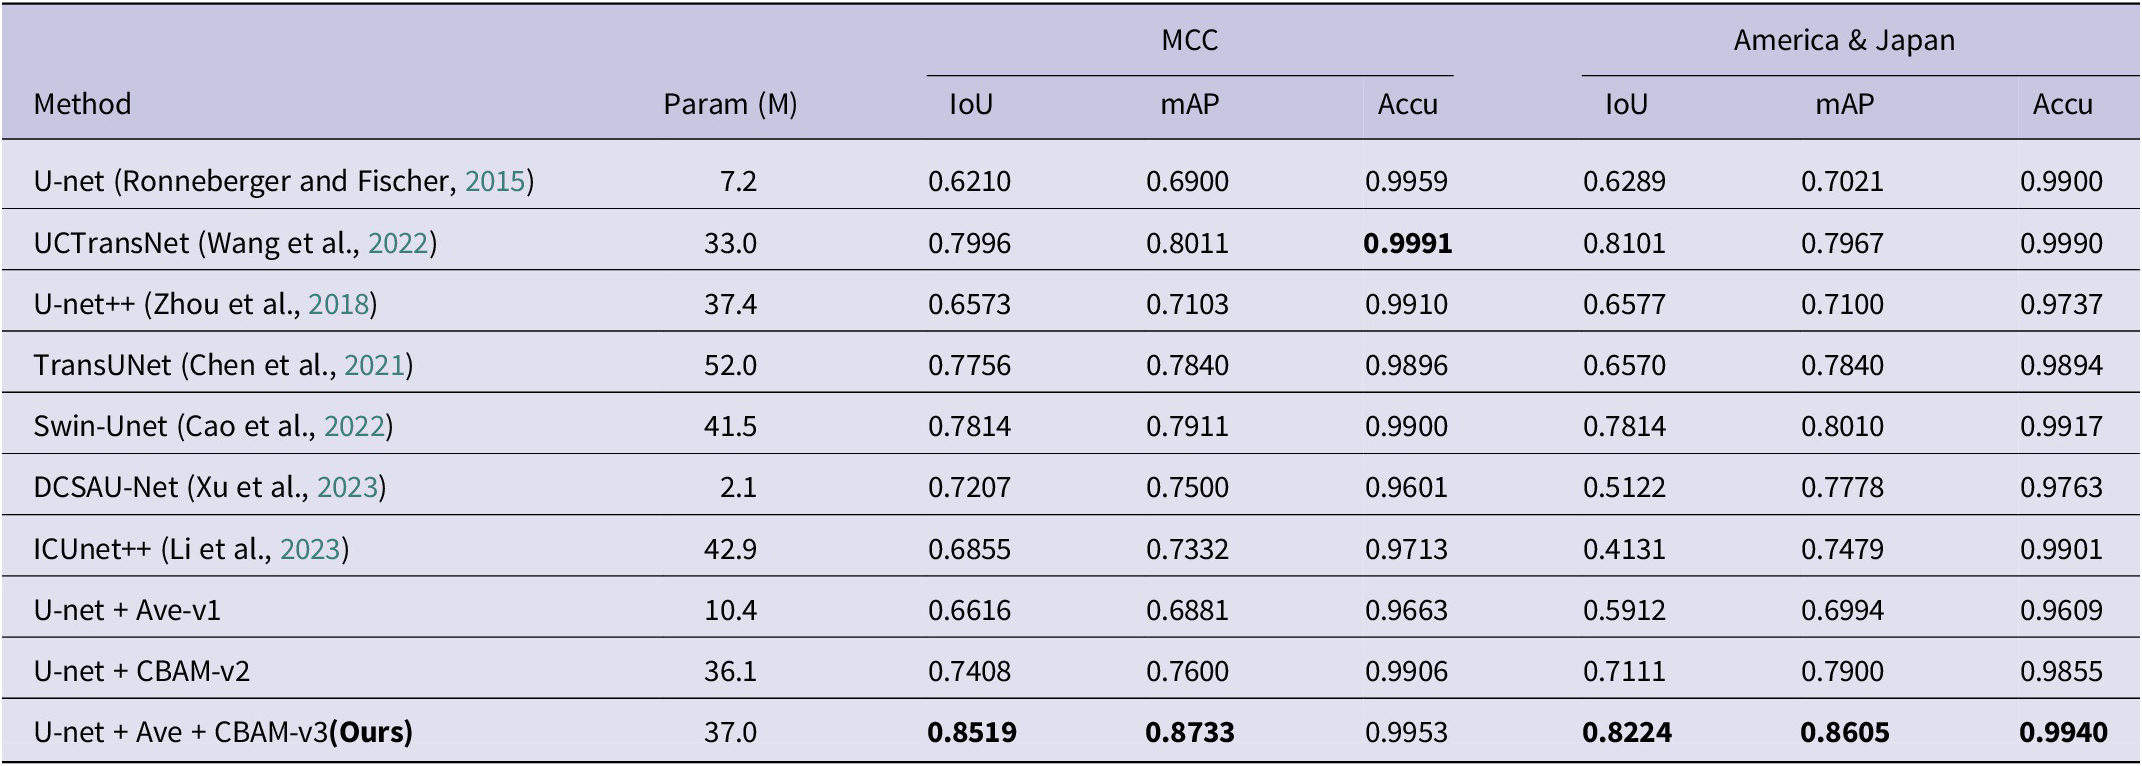
Note: Same benchmark, bold indicates excellent.
To further verify the scientific validity and rigor of the proposed method in this study, the CBAM-U-net, CBAM-CNN, U-net, and CNN models of Focal loss were used to classify multiple types of lines in welding engineering drawings, respectively. The confusion matrix is used to realize the visualization of multi-type line classification in welding engineering graphics, and the result is shown in Figure 11. Column elements in the confusion matrix represent true label values for different types of lines, and rows represent true predicted values for different types of lines. Use “Thi,” “Thin,” “Dash,” “Arrow” and “Numer” to represent the thick solid line, thin solid line, dashed line, arrow line, and numbered line in the content of the welding engineering drawing, respectively. From the classification visualization results, it can be concluded that the improved model CBAM-U-net, CBAM-CNN proposed in this paper improves the prediction performance of different types of lines relative to the traditional U-net, CNN network model, and the results are mainly reflected in the prediction effect of thick solid, thin solid, dashed and arrow lines.
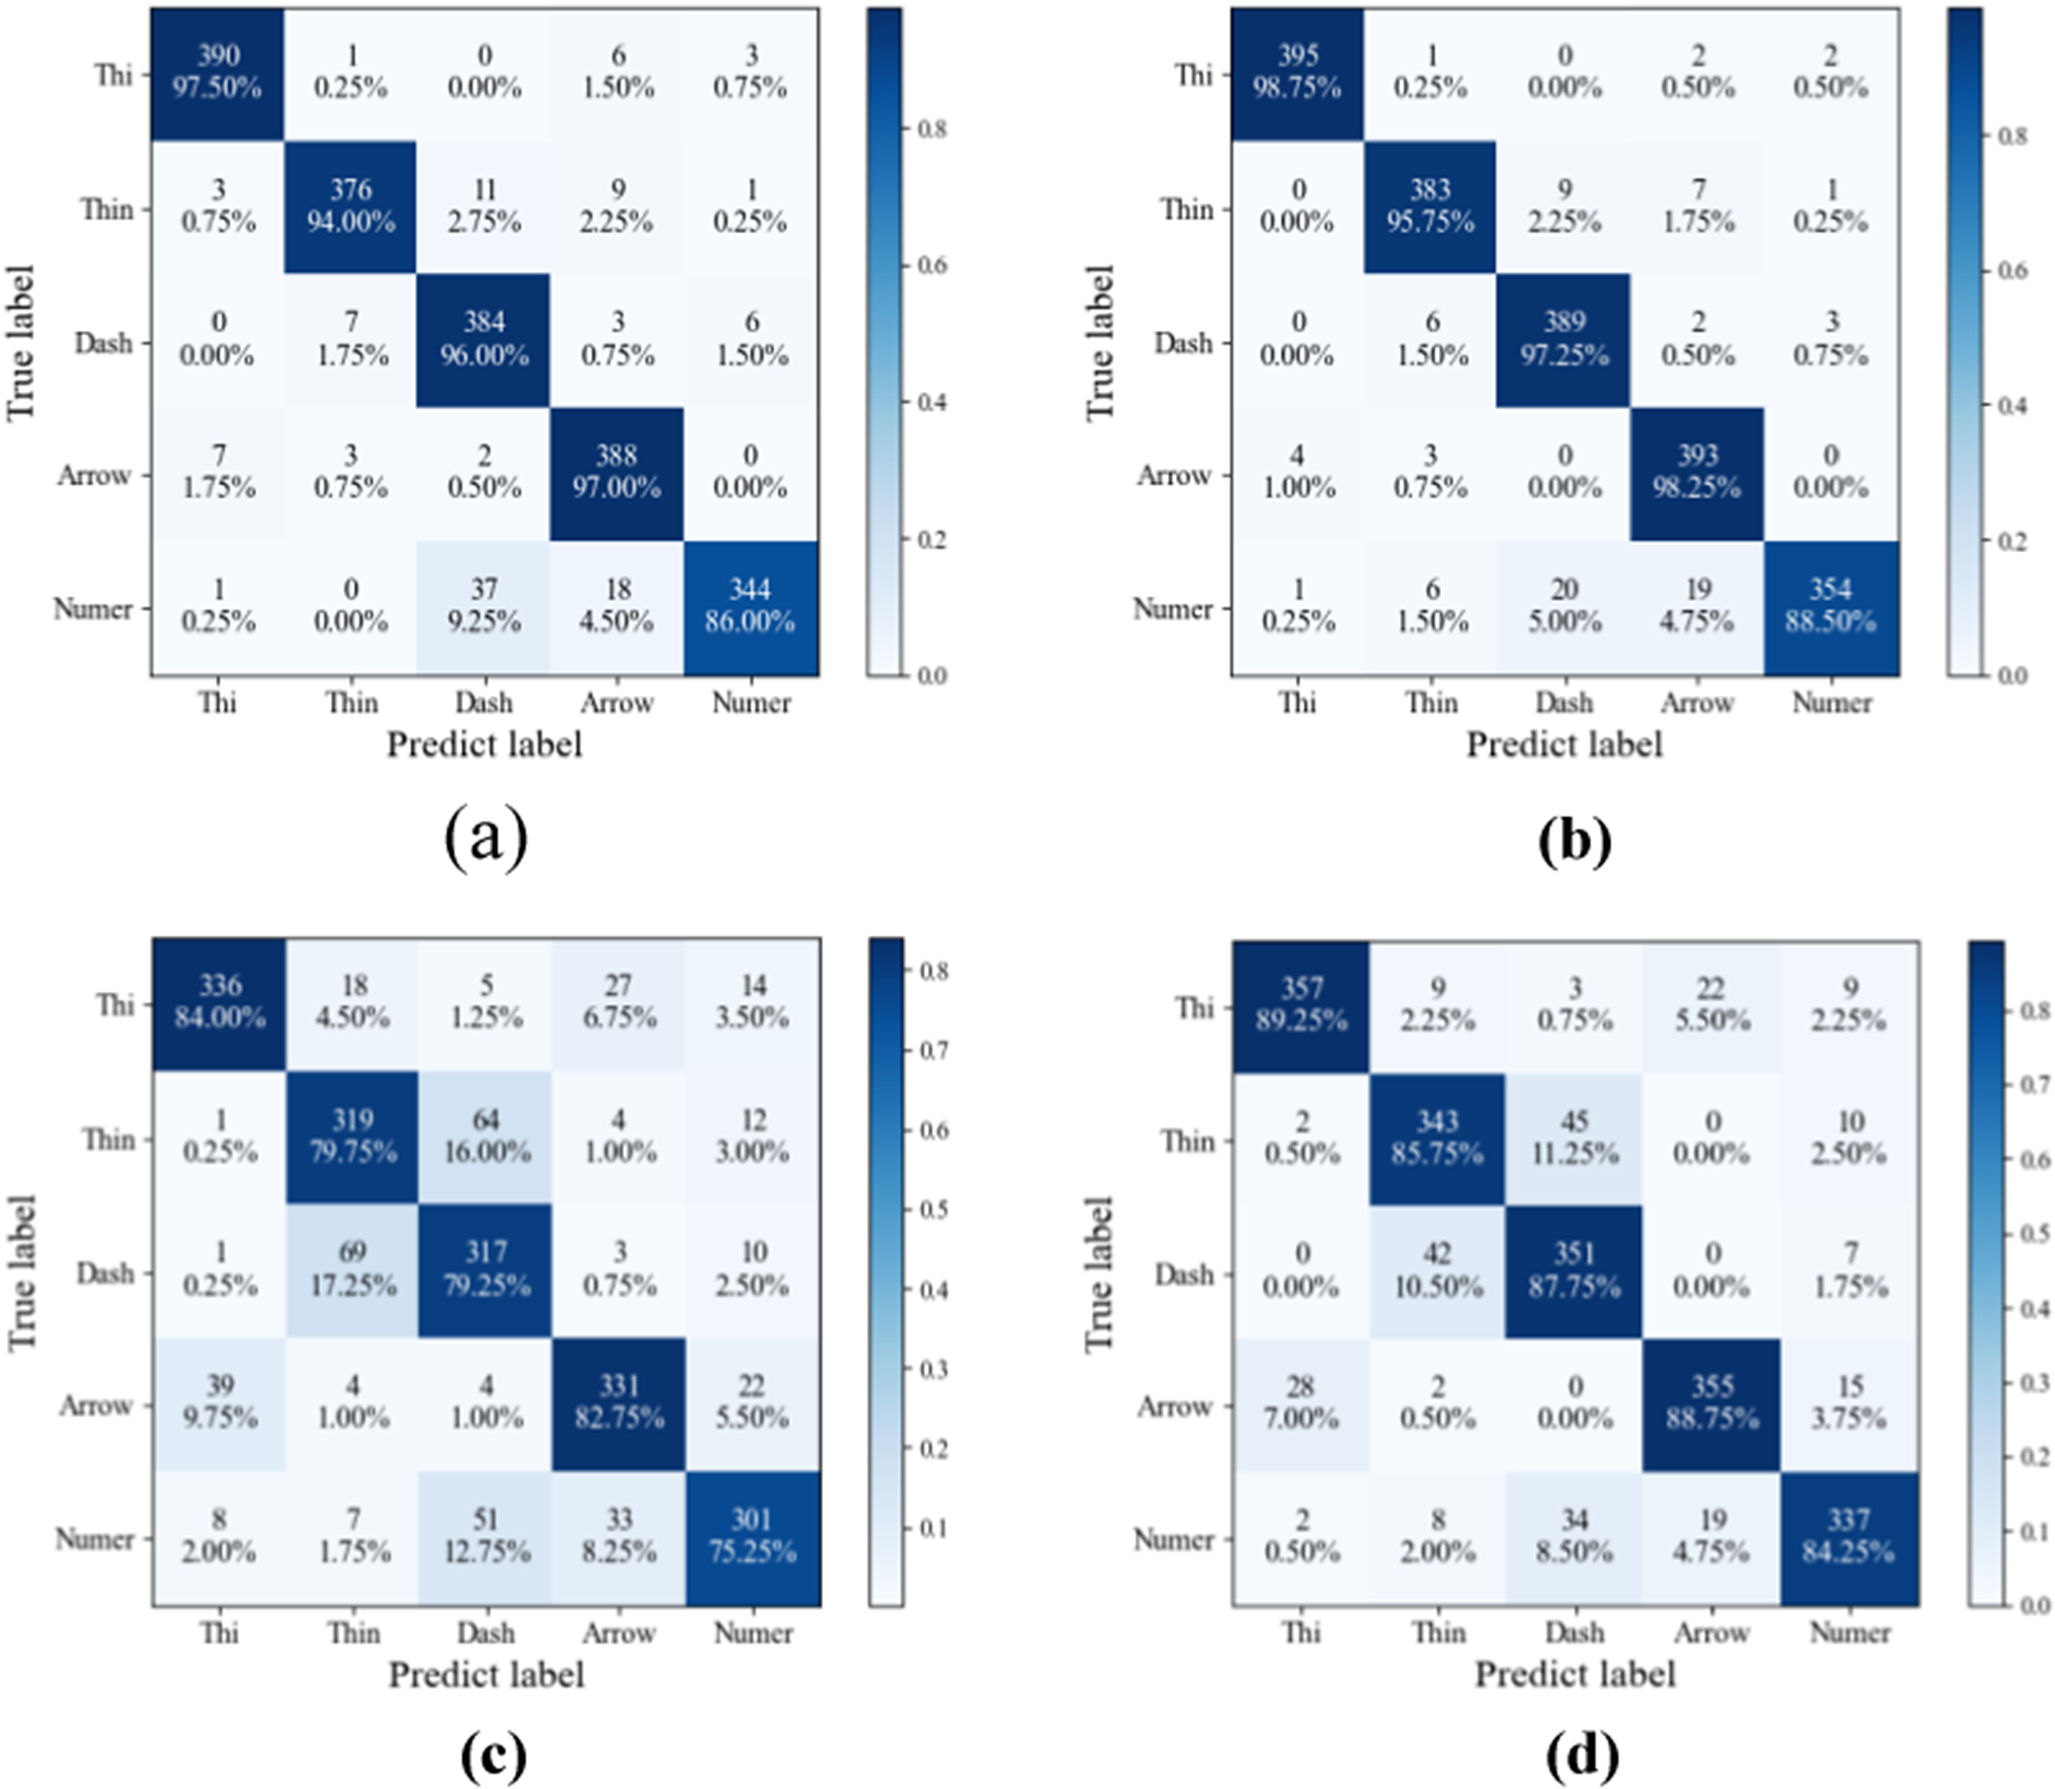
Figure 11. Comparison of confusion matrix results between U-net and CBAM-U-net models ((a) U-net, (b) CBAM-U-net(Ours), (c) CNN, (d) CBAM-CNN).
Results and discussion
The results are shown in Table 6. The original U-net model is applied to the segmentation and extraction of specific units of welding structure engineering drawings, and the average accuracy of the intersection-over-union ratio (IoU) can reach 62.62%, and the category means (mAP) and accuracy (Accu) are 0.6775 and 99.37%, respectively. The third column in Figure 8 is the segmentation visualization result of the traditional U-net. It can be seen from the figure that the segmentation accuracy of the traditional U-net in the welding engineering-specific unit has some shortcomings. To solve this problem, this paper proposes to add average pooling + two convolution operations in the horizontal encoder jump structure, and at the same time proposes a vertical jump fusion of high-dimensional vertical encoder feature clusters and low-dimensional horizontal encoder feature clusters-model one.
Model one adopts the double-pooling convolution jump structure of the horizontal encoder and the vertical encoder, which reduces the dimensional difference between the encoder and the decoder based on improving the fusion of global semantic features, and realizes the improvement of its segmentation performance. The intersection-over-union ratio (IoU) accuracy of model one segmentation to extract specific units of welding engineering graphics is 63.24%, and the category means (mAP) and accuracy (Accu) are 0.6947 and 96.05%, respectively. However, as can be seen from Figure 8, model one still performs poorly. Immediately, an improved model of adding an attention mechanism to the traditional U-net jump structure was proposed- model two. Model two pays more attention to the channel and spatial information of global semantic features, and reduces the difference of global feature information to achieve better segmentation. The intersection-over-union ratio (IoU) accuracy of model two segmentation to extract specific units of welding engineering graphics is 72.99%, and the category means (mAP) and accuracy (Accu) are 0.7549 and 97.45%, respectively. To make the model better extract the global feature information, the improved model of average pooling, vertical jumping, and attention module is added to the traditional U-net horizontal jumping structure at the same time – Model three. The improved model three can not only reduce the global information ambiguity but also reduce the information dimension difference between the encoder and the decoder and greatly improve its segmentation performance as a whole. The intersection-over-union ratio (IoU) of the specific unit of welding engineering graphics extracted by model three segmentation is 84.72%, and the category means (mAP) and accuracy (Accu) are 0.8684 and 99.42%, respectively. All in all, the performance of the three improved models proposed in this paper for segmenting specific units of welding engineering graphics has been significantly improved compared with the traditional U-net. Among them, the IoU, mAP, and Accu of model three are improved by 22.10%, 19.09%, and 0.05%, respectively, compared with the traditional U-net in the segmentation task of the specific unit of the welding pattern. To prove the scientificity and rigor of the method proposed in this study, a series of multiple 3x3 convolutional networks was used to continue further verification. From the experimental results in Figure 10 and Table 7, it can be concluded that the method in this paper can effectively improve the specific unit segmentation performance of its model for welded structure engineering graphics.
This paper discusses the application of the U-net-based improved model to the segmentation and extraction task of specific units in welding engineering graphics. It mainly realizes the automatic cutting of sheet metal parts through artificial intelligence machine vision and improves the manufacturing efficiency of heavy industry equipment. However, there are still many deficiencies in the positioning of the cutting device, the calculation of the utilization of the sheet metal, and the cutting seam. For example, in the process of cutting sheet metal parts by machine vision, the cutting device cannot calculate the utilization rate of the whole sheet metal, and the positioning redundancy is large, which leads to material waste. In addition, the method in this paper is only applicable to the cutting of sheet metal for heavy equipment, because the welding process of heavy equipment has a large weld seam and low welding accuracy, so the cutting accuracy requirements are not high, and the current cutting method can fully meet the precision of heavy equipment manufacturing. For high-precision segmentation tasks in the manufacturing industry, the ability of the segmentation model to extract semantic features and fuse semantic features needs to be further increased, while at the same time, the dimensional difference between low-dimensional and high-dimensional features needs to be further eliminated. The attention model with cyclic semantic extraction and fusion will likely be better applied to industrial high-precision segmentation tasks.
Conclusion
Deep learning image segmentation technology has achieved excellent performance in many engineering fields. In this study, it is proposed to use the U-net network to realize the segmentation and extraction of specific units of welding structural engineering graphics in heavy industrial equipment manufacturing, so that the cutting device can automatically cut sheet metal parts by machine vision, thereby improving manufacturing efficiency. Based on the research and analysis of the existing U-net improved model, we propose to add the CBAM module and design the double pooling jump model structure of the upper and lower encoders to realize the global semantic fusion of image features. Not only that, this paper performs two convolution operations on the semantic feature clusters after double pooling to reduce the dimensional difference between the encoder and decoder. The proposed method is trained and validated on a dataset of engineering graphics of complex welded structures. Experimental results show that our proposed improved model outperforms currently existing state-of-the-art segmentation techniques(SOTA) in segmenting specific cells of welded structural engineering drawings.
Data availability statement
All data that support the findings of this study are included within the article (and any supplementary files).
Author contribution
All authors contributed to the study’s conception and design. Material preparation, data collection, and analysis were performed by [Zhiwei Song], [Hui Yao], [Tian Dan], and [Gaohui Zhan]. The first draft of the manuscript was written by [Zhiwei Song] and all authors commented on previous versions of the manuscript. All authors read and approved the final manuscript.
Funding statement
This paper is supported by the Shaanxi Provincial Innovation Capacity Support Plan: Shaanxi Provincial Bearing Digital Design and Monitoring Technology Innovation Service Platform Project (2022PT-02). Computing resources are provided by the Institute of Advanced Manufacturing, Xi’an Technological University.
Competing interests
The authors declare that they have no known competing financial interests or personal relationships that could have appeared to influence the work reported in this paper.


 Open access