

6.1 Introduction
Is digitalisation the key to a sustainable future? At the World Economic Forum’s 2022 meeting in Davos, Switzerland, this question was answered by industry representatives with a clear Yes, it is! (WEF 2022). And indeed, digitalisation and sustainability are increasingly regarded as closely intertwined complements. In the area of international trade governance, for instance, the World Trade Organisation (WTO) recently joined forces with the United Nations (UN) and other stakeholders to explore how ‘[u]sing data and digital technologies [can] advance sustainable trade and environmental transparency’ (WTO 2021).
One popular example of the link between digitalisation and environmental sustainabilityFootnote 1 in the area of international trade governance is cross-border paperless trade. This term was first coined in a 2016 UN report, defining cross-border paperless trade as ‘trade in goods, including their import, export, transit and related services, taking place on the basis of electronic communications, including exchange of trade-related data and documents in electronic form’ (UN 2016, p. 4). The idea is that paperless trade fosters sustainability through at least two channels: first, the eliminated use of paper in trade procedures reduces the amount of resources required for the production of paper and the greenhouse gas emissions associated with it; second, paperless digital trade procedures are expected to create broader process efficiency gains that further reduce resource intensity. While these effects might be partially offset by the resources used for electricity to power servers and computers, empirical studies indicate that the positive effect of paperless trade on the reduction of emissions dominates (see, e.g., UN 2021).
A more specific example which illustrates the increasingly close link between digitalisation and sustainability is the electronic processing of food trade-related documentation. Most importing countries around the world require sanitary and phytosanitary (SPS) certificates issued by the exporting country to certify that products have been inspected and are free from pests and diseases. The (analogue) application and issuance of such SPS certificates are used to complicate and prolong cross-border processes for food products. Recently, however, there has been a big push for digitalisation in this area. In 2017, only twelve countries worldwide had partially or fully implemented the electronic application and issuance of SPS certificates. By 2021, this number had already increased to sixty-four. To a large extent, these electronic SPS certificates are now directly electronically exchanged between exporters and importers (WCO 2021; UN 2022).
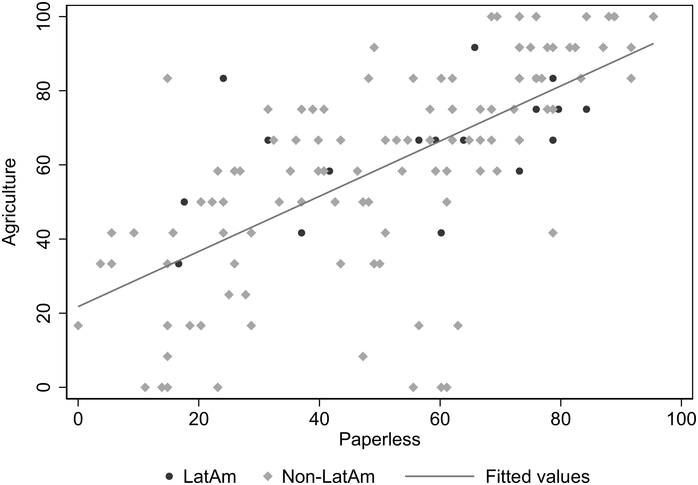
Given the link between digitalisation and sustainability, one would expect that governments coordinate their policies in these areas. In the area of trade facilitation at least, this appears to be the case indeed. A recent UN (UN 2022) on the digital and sustainable trade facilitation measures of 144 countries indicates a positive correlation between paperless trade and agricultural trade facilitation measures (Figure 6.1). Countries which put in place digital trade-facilitating measures are also likely to put in place sustainable trade-facilitating measures in the field of agriculture, and vice versa.
This chapter explores the link between digitalisation and sustainability in international trade governance further. The focus lies, more precisely, on digital and environmental provisions in preferential trade agreements (PTAs)Footnote 2. The first substantial digital trade-related provisions in PTAs were introduced in Jordan–US (2000), while the first environmental provisions date back to the early 1990s and the establishments of the European Economic Area (1992) and the North American Free Trade Agreement (NAFTA) (1993). To provide a comparative account of digital and environmental provisions in PTAs, this chapter focuses primarily on PTAs signed between 2000 and 2019. In line with this book’s overarching theme, we focus on PTAs signed by Latin American countries and consider their impact on trade values and on trade composition.
This chapter is organised as follows. The first part begins by briefly outlining some of the most relevant and recent literature on the design of digital and environmental provisions in PTAs. While it is not the purpose of this chapter to explain in detail how digital and environmental policies at the domestic and international levels may be related, the following section does provide an overview of the domestic policy landscape in Latin America. Following this, the next section explores the design patterns both between PTAs and within PTAs – thus between PTAs’ digital and environmental trade provisions. Finally, the first part of this chapter addresses the question as to whether Latin American countries are rule-makers or rule-takers in the area of digital and environmental trade governance in PTAs. Having outlined the design features of Latin American PTAs in this section, the second part of this chapter explores these design features as the principal explanatory variables to assess the impact of PTA design on the quantity and composition of international trade flows. The final section of this chapter summarises the findings, discusses limitations, and offers pathways for future research.
6.2 Digital and Environmental Trade Governance
Digital trade and environmental trade topics have been part of the multilateral trade policy regime, administrated by the WTO, and the plurilateral trade policy regime, represented by PTAs, for some time now. As previously mentioned, digital trade-related topics were first addressed in PTAs in the early 2000s while environmental topics were already featured in PTAs signed in the early 1990s. Similarly, the WTO became active in the area of digital trade when the Information Technology Agreement (ITA) was reached in 1996 and the Work Programme on Electronic Commerce was established in 1998. While the interest and progress in this topic was limited during the following years (Elsig and Klotz Reference Elsig and Klotz2021), digital trade discussions were revived with the Joint Initiative on E-Commerce in 2019, which by now counts eighty-eight participating WTO members. In the area of environmental trade, a group of fourteen WTO members launched negotiations for an Environmental Goods Agreement (EGA) in 2014, which by now counts forty-six participating WTO members.
The study of how environmental considerations are covered in PTAs advanced considerably over the past years. The publication of the TRade & ENvironment Database (TREND; Morin et al. Reference Morin, Dür and Lechner2018; updated in 2022) was an important driver as researchers gained access to information on nearly 300 different types of environment provisions in 775 PTAs. Subsequent work analysed why countries include such provisions in PTAs (Blümer et al. Reference Blümer, Morin, Brandi and Berger2020), how such provisions diffuse between PTAs (Morin et al. Reference Morin, Blümer, Brandi and Berger2019; Hollway et al. Reference Hollway, Morin and Pauwelyn2020; Jinnah and Morin Reference Jinnah and Morin2020), how such provisions relate to other development policies (Brandi et al. Reference Brandi, Morin and Stender2022), and how such provisions impact trade flows (Berger et al. Reference Berger, Brandi, Morin, Schwab, Beverelli, Kurtz and Raess2020; Brandi et al. Reference Brandi, Schwab, Berger and Morin2020).
In the area of digital trade governance, it was the publication of the Trade Agreements Provisions on Electronic-commerce and Data dataset (TAPED; Burri and Polanco Reference Burri and Polanco2020) which provided researchers access to detailed information on around 100 provisions in more than 340 PTAs. Using TAPED, subsequent work analysed how digital trade-related provisions diffuse through PTAs (Elsig and Klotz Reference Elsig and Klotz2022) and how digital trade governance in PTAs is related to ongoing work in the WTO (Elsig and Klotz Reference Elsig and Klotz2021). Other influential work focused on the growing digital divide between the US, the European Union, and China (Aaronson and Leblond Reference Aaronson and Leblond2018; Gao Reference Gao2018; Azmeh et al. Reference Azmeh, Foster and Echavarri2020). Polanco (Reference Polanco and Burri2021) provides a detailed analysis of the regulatory convergence of data rules in Latin American PTAs, which goes far deeper and beyond the scope of this chapter.Footnote 3
The contributions by Morin et al. (Reference Morin, Dür and Lechner2018; TREND) and Burri and Polanco (Reference Burri and Polanco2020; TAPED) are closely related to the Design of Trade Agreements database (DESTA; Dür et al. Reference Dür, Baccini and Elsig2014). All three databases serve as sources for the descriptive and empirical analyses conducted in the first and second part of this chapter, respectively.
6.3 Domestic Digital and Environmental Policies in Latin America
Before discussing the design of Latin American PTAs and their impact on international trade flows, this section briefly outlines the domestic landscape of digital and environmental sustainability policy. The focus lies on the countries that are signatories to the PTAs assessed in the subsequent sectionsFootnote 4.
While it is not the purpose to explicitly assess the link between domestic and international trade policy here, existing research does point to a strong correlation in both directions. In the area of digital policy, for example, Elsig and Klotz (Reference Elsig and Klotz2022) find that countries with more domestic digital policies are more ambitious in the digital trade-related provisions of their PTAs. In the area of environmental policy, Brandi et al. (Reference Brandi, Schwab, Berger and Morin2020) find that the design of environmental provisions in PTAs promotes green transformations at the domestic level.
In the area of sustainability and climate-related policies, Latin American countries have become increasingly more active since the early 2000s. In 2000, the region counted eight climate policies, up to ninety in 2005, and 250 in 2010. By 2021, the cumulative count of climate policies in Latin America is around 700. Mexico, Argentina, Colombia, and Chile are the main drivers of this development (Figure 6.2).
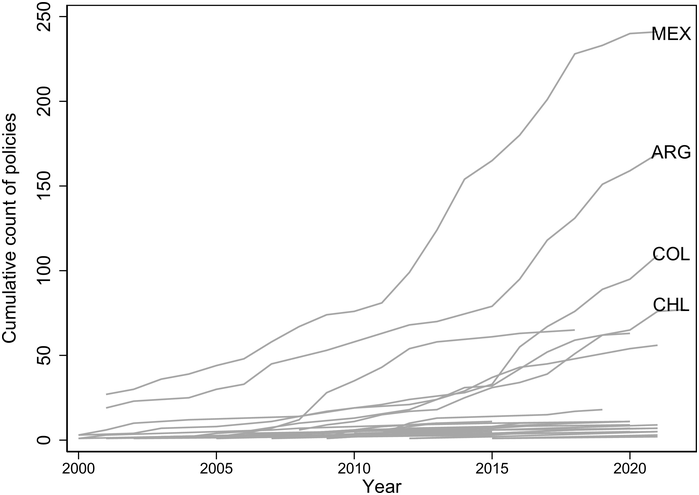
Figure 6.2 Climate policies in Latin America, 2000–2021.
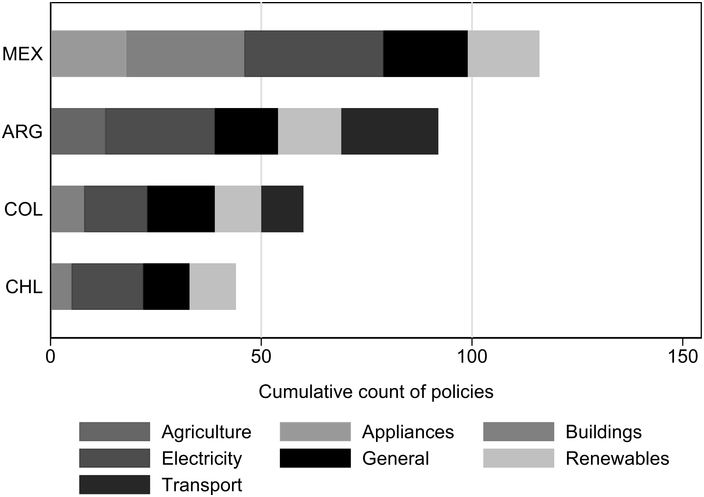
A closer look at these four countries illustrates some of the different climate policy foci. In all four countries, electricity is the primary target sector. Mexico and Argentina focused around 30 per cent of their climate policies on this sector, Colombia and Chile around 25 per cent and 35 per cent, respectively. After this, however, policy foci diverge. Mexico targeted around 25 per cent of its climate-related policies on the buildings sector, whereas Argentina focused an equal share on transport. Chile targeted around 23 per cent of its climate-related policies on renewables, whereas Colombia’s policies were more general. Within this four-country group, Mexico is the only country to have focused any climate-related policies on appliances, and Argentina is the only country with such policies in the agriculture sector (Figure 6.3).
In the area of digital policies, there appears less of a gap between leading and lagging countries. Argentina is leading in this group with just under forty policies. Almost half of these policies focus on online sales and transactions and quantitative trade restrictions for information and consumer technology (ICT) goods, products, and online services. Ecuador focuses the largest share of its digital policies (21 per cent) on telecommunication infrastructure and competition. For Colombia, quantitative trade restrictions for ICT were also the primary policy focus (18 per cent), followed by public procurement of ICT goods and online services (12 per cent) (Figure 6.4).
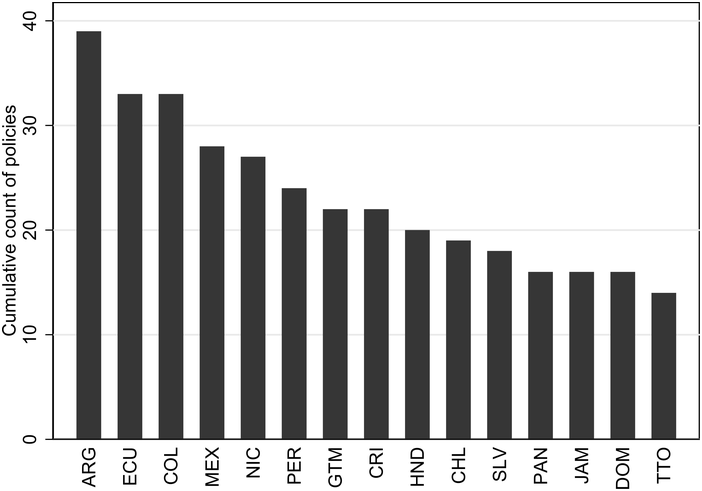
Figure 6.4 Digital policies in Latin America.
For this group of countries overall, around half of the digital policies are targeted at online sales and transactions (15 per cent), telecommunication infrastructure and competition (15 per cent), and the public procurement of ICT goods and online services (Figure 6.5).
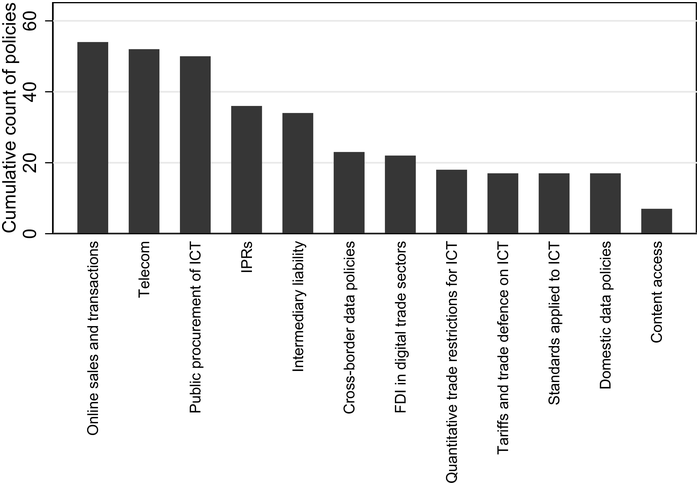
Figure 6.5 Digital policies in Latin America by policy area.
6.4 Digital and Environmental Trade Governance in Latin America
This section explores the design of Latin American PTAs with a specific focus on digital and environmental provisions collected by the Trade Agreements Provisions on Electronic-commerce and Data (TAPED) dataset (Burri and Polanco Reference Burri and Polanco2020) and the Trade and Environment Database (TREND, Morin et al. Reference Morin, Dür and Lechner2018). The set of PTAs used for the descriptive analysis of this section includes 168 PTAs, 14 PTAs (8 per cent) of which are signed among Latin American countriesFootnote 5 (LatAm–LatAm), 35 PTAs (21 per cent) are signed by at least one Latin American country and at least one non-Latin American country (LatAm–Non-LatAm), and 119 PTAs (71 per cent) are signed among non-Latin American countries (Non-LatAm–Non-LatAm).Footnote 6
Perhaps unsurprisingly, the scope of digital and environmental provisions in PTAs is positively correlated. Indeed, PTAs which include many digital trade-related provisions also tend to include many environmental provisions, and vice versa (Figure 6.6).Footnote 7 With regard to both digital and environmental provisions, Latin American PTAs show a higher scopeFootnote 8 than non-Latin American PTAs. On average, non-LatAm PTAs include fifteen digital trade-related provisions, while LatAm–LatAm and LatAm–Non-LatAm PTAs include an average of twenty-eight provisions. Similarly, non-LatAm PTAs include an average of eleven environmental trade-related provisions, while LatAm–LatAm and LatAm–Non-LatAm PTAs include a respective average of fifteen and twenty such provisions.
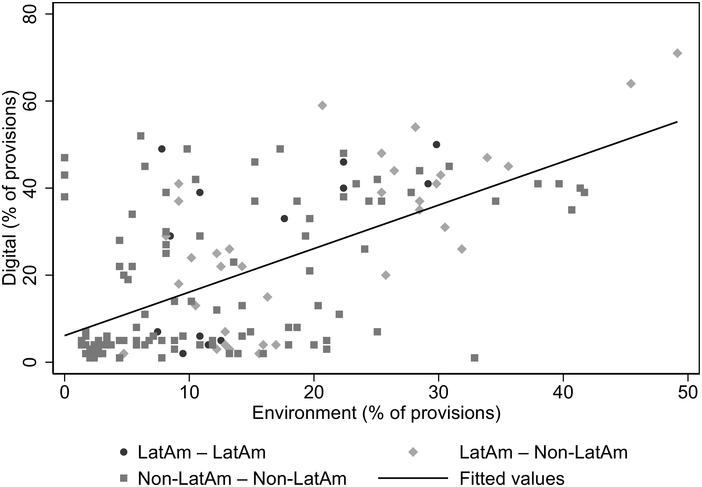
Figure 6.6 Digital and environmental provisions in PTAs.
Zooming into the PTAs further suggests that Central America–Dominican Republic–United States Free Trade Agreement (CAFTA-DR) (2004) is the LatAm PTA with the largest number of digital (50) and environmental provisions (88) (Figure 6.7). Central America–Panama (2002) and Mexico–Uruguay (2004), by contrast, are the LatAm PTAs with the smallest number of digital (2) and environmental (22) provisions. Overall, Central America–Panama (2002), Costa Rica–Peru (2011), Panama–Peru (2011) , Guatemala–Peru (2011), and Mexico–Uruguay (2004) appear to be relatively more ambitious with regard to the inclusion of environmental provisions than digital provisions, while the opposite is true for the other, the majority of, LatAm PTAs in the sample. Mexico–Panama (2014) stands out in particular; with forty-nine provisions, it presents the second most ambitious LatAm PTA in digital content. With only twenty-three environmental provisions, however, it presents the second-least ambitious LatAm PTA in this field.

The LatAm–Non-LatAm PTA with both the largest number of digital (71) and environmental (145) provisions is the United States–Mexico–Canada Agreement (USMCA) (2018) (Figure 6.8). Guatemala–Taiwan (2005) and Chile–Japan (2007), by contrast, present with only two digital and two environmental provisions the least ambitious PTAs in this group. Similar to the LatAm–LatAm PTAs, the majority of LatAm–Non-LatAm PTAs are relatively more ambitious with regard to digital than environmental provisions. A number of PTAs – including Chile–Japan (2007), Guatemala–Taiwan (2005), Chile–Korea (2003), Chile–Turkey (2009), China–Costa Rica (2010), China–Peru (2009), Panama–Taiwan (2003), Japan–Peru (2011), Canada–Costa Rica (2011), Central America–European Free Trade Association (EFTA) (2013), and Canada–Panama (2009) – are relatively more ambitious in the governance of environmental trade than digital trade. This gap is most notable in Australia–Peru (2018), which has a relatively large number of digital provisions (59) but a relatively small number of environmental provisions (61).
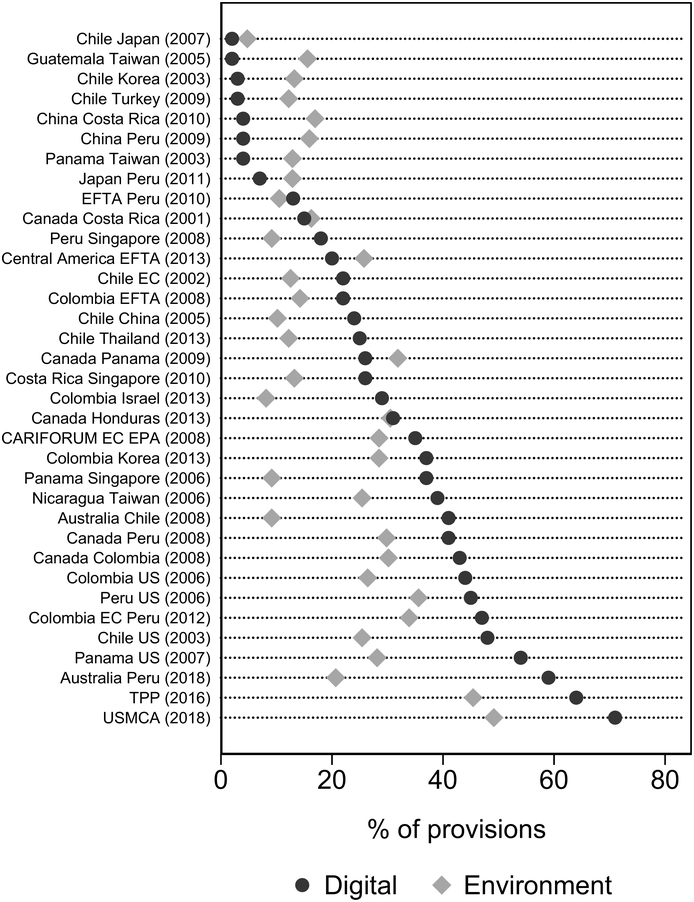
Figure 6.8 Digital and environmental provisions in PTAs between Latin American and non-Latin American countries.
To put the previously outlined observations into context; the non-LatAm–non-LatAm PTA with the highest number of digital provisions (52) is Australia–Japan (2014), while EC–Vietnam (2019) is the non-LatAm–non-LatAm PTA with the highest number of environmental provisions (123).
6.5 Latin American PTAs: Rule-Makers or Rule-Takers?
Out of the 100 digital provisions covered in TAPED, only one provision (1 per cent) was first introduced by a LatAm–LatAm PTA: CAFTA–DR (2004) was the first PTA to include a provision on the customs value of carrier mediums. Over the following years, this provision also diffused through the PTA network. Indeed, this provision is now included in another twenty PTAs: four of those LatAm–LatAm PTAs, five LatAm–Non-LatAm PTAs, and eleven Non-LatAm–Non-LatAm PTAs.
Another twenty-seven digital provisions (27 per cent) were first introduced by LatAm–Non-LatAm PTAs, including Canada–Costa Rica (2001), Chile–EC (2001), Chile–US (2003), Chile–China (2005), Nicaragua–Taiwan (2006), CARIFORUM–EC (2008), Canada–Colombia (2008), Colombia–EC–Peru (2012), Chile–Thailand (2013), Trans-Pacific Partnership (TPP) (2016), and USMCA (2018) (Annex).
Out of the 295 environmental provisions included in TREND, nineteen provisions (6 per cent) were first included by LatAm–LatAm PTAs. Central America–Panama (2002) introduced eight such provisions, CAFTA–DR (2004) introduced seven, Mexico–Uruguay (2004) two, and Panama–Peru (2011) and Colombia–Panama (2013) each introduced one such provision. Some of these provisions diffused considerably through the PTA network. For instance, the provision on the inappropriateness of encouraging investment by relaxing environmental measures, first introduced in Central America–Panama (2002), was subsequently included in eighty-three other PTAs; eleven of those LatAm–LatAm PTAs, twenty-three LatAm–Not-LatAm PTAs, and forty-nine Non-LatAm–Non-LatAm PTAs.
Another 114 environmental provisions (38 per cent) were first introduced by LatAm–Non-LatAm PTAs, including Canada–Costa Rica (2001), Chile–EC (2001), Chile–Korea (2003), Chile–US (2003), Panama–Taiwan (2003), Colombia–US (2006), Nicaragua–Taiwan (2006), Panama–Singapore (2006), Peru–US (2006), CARIFORUM–EC (2008), Canada–Colombia (2008), Canada–Peru (2008), Colombia–EFTA (2008), Canada–Panama (2009), China–Peru (2009), China–Costa Rica (2010), Colombia–EC–Peru (2012), Colombia–Korea (2013), and TPP (2016).
6.6 Effects on Trade Values and Composition of Digital and Environmental Provisions in Latin American PTAs
To assess the economic impact of digital and environmental provisions in Latin American PTAs, the analysis presented here follows the framework proposed by Berger et al. (Reference Berger, Brandi, Morin, Schwab, Beverelli, Kurtz and Raess2020). Given this book’s specific focus on Latin American countries, the analysis is conducted separately for exports and imports because the analysis also concerns trade flows with extra-regional partners and regional partners not included in the TREND and TAPED datasets. The robustness of the empirical results presented below is tested through different settings with the aim of unveiling any alternative factors or characteristics that may drive the results. This approach is complemented by testing the possible changes to the composition of trade as suggested by Brandi et al. (Reference Brandi, Schwab, Berger and Morin2020).
The main dependent variable is constructed based on bilateral country-pair trade flows of merchandise trade as reported in the UN Comtrade dataset. The values present the total volume of exports (or imports) in manufacturing, mining, and agricultural products from (to) a Latin American country to (from) other countries around the world in million USD. In line with the literature, the natural log of trade values is used as the dependent variable ( ).
).
The resulting panel of more than 65,000 observations is unbalanced in trade relationships as countries may report only one side of trade in any given year. Other countries in the region may only report trade flows for a subset of the period, while their ‘missing’ observations are reported by their regional partners. For seventeen of the twenty-three Latin American countries reporting trade figures, the coverage extends to at least seventeen years between 2000 and 2021. At the aggregate level, import flows account for almost half of the sample (48.7 per cent).
To construct the explanatory variables, the maximum number of digital and environmental provisions in PTAs for each Latin American country-partner pair is used. Since two partners may be part of more than one unique PTA, the maximum number of provisions is used to signal a strengthened commitment. However, the de facto possibility for cumulation of commitments across PTAs is excluded. These two variables are denoted as  and
and  in the equation below. It is important to note that, given the inclusion of dummy variables capturing the existence of one (or more) PTA(s) between two countries, these counts of maximum numbers of provisions aim at identifying the additional impact of these provisions across PTAs. The basic econometric specification is the following:

where  is the index for the Latin American country in the sample,
  for the partner country, and
  for the respective year. Note that all variables described above vary by bilateral dyad and time, and all regressions include a demanding set of three fixed effects: country-partner, country-year, and partner-year. In total, more than 6,000 fixed effects are estimated in every regression, controlling for specific nation-wide shocks or specificities (such as endowments, GDP levels, and unilateral openness or liberalisation to trade) in the countries of interest and their partners as well as for particularities such as geography, connectivity, and historical elements, which may explain closer or not trade relationships between dyads. Finally,
  denotes the error term, which is also clustered by dyads, implying that bilateral errors can be correlated over time. As usual, values for estimates are to be interpreted as additional percentages of exports or imports for the existence of a PTA or for an additional digital or environmental provision.
6.6.1 Results
Table 6.1 presents the results of this specification on the aggregate level of imports and exports where the number of each type of provision in the PTA has been introduced after estimating the aggregate effect for PTAs in place. One, perhaps surprising, result is that the existence of a PTA does not have a statistically significant impact on imports by Latin American countries from their partners (first column) while an existing PTA can be associated with an increase of 10 per cent of exports (third column). This result highlights that negotiations tend to improve market access conditions for Latin American exports while for imports either improvements are not strongly perceived, or negotiations do not lead to improved market access. Eventually, integrating here the type and number of digital and environmental provisions will allow a better understanding of the absent impact for imports.
| Whole sample | Whole sample | |||
|---|---|---|---|---|
| Imports | Exports | |||
| PTA dummy | −0.0507 | −0.000203 | 0.105* | 0.305*** |
| (0.0415) | (0.0914) | (0.0536) | (0.0882) | |
| # of digital provisions | −0.00356 | 0.00760* | ||
| (0.00655) | (0.00418) | |||
| # of environ. provisions | 0.00103 | −0.00659*** | ||
| (0.00349) | (0.00217) | |||
| Country-Year FE | Yes | Yes | Yes | Yes |
| Partner-Year FE | Yes | Yes | Yes | Yes |
| Country-Partner FE | Yes | Yes | Yes | Yes |
| Error-clust. ctry-partn. | Yes | Yes | Yes | Yes |
| Observations | 33,694 | 33,694 | 32,045 | 32,045 |
| R-squared | 0.939 | 0.939 | 0.923 | 0.923 |
Robust standard errors in parentheses. *** p < 0.01, ** p < 0.05, * p < 0.1.
Columns 2 and 4 of Table 6.1 show the results after including the maximum number of provisions included in PTAs for Latin American countries. The absence of a statistically significant impact persists for imports while the results for exports deserve a closer analysis. Allowing for this heterogeneity increases the impact of the existence of a PTA with no digital and environmental provisions almost threefold. This observation is confirmed by the negative coefficient for the number of environmental provisions, which in this context seems to act as a deterrent for Latin American exports. On the contrary, the positive coefficient of digital provisions indicates that these provisions act as facilitators of trade as each additional digital provision increases exports by 0.7 per cent. Interestingly, the estimate for environmental provisions is of the same magnitude but of the opposite sign, indicating that an additional environmental provision cancels the positive outcome by an additional digital provision.
The following analysis explores in more detail the heterogeneity of these, rather puzzling, results. The first two columns of Table 6.2 aim to understand whether imposing a linear impact for the number of provisions may be a reason for the lack of statistical significance. For this, the square of the numbers of provisions is included, allowing sufficient flexibility to capture increasing or decreasing returns for additional provisions but also a change in sign at the extreme. Despite showing statistical significance at the individual level for some of those squared terms, the full derivative of the outcome with respect to the number of provisions is statistically significant neither for digital nor for environmental provisions. Consequently, this form of heterogeneity can be discarded. Although not reported here, an interaction term to capture potential synergies between digital and environmental provisions was also tested and yielded no statistically significant results.
| Whole sample | Regionally | Extra-regionally | ||||
|---|---|---|---|---|---|---|
| Imports | Exports | Imports | Exports | Imports | Exports | |
| PTA dummy | 0.254 | −0.306 | 0.0352 | 0.304* | 0.196 | 0.0931 |
| (0.270) | (0.284) | (0.118) | (0.158) | (0.130) | (0.117) | |
| # of digital provisions | 0.0176* | 0.00301 | 0.00470 | 0.000216 | −0.000493 | 0.0115** |
| (0.00912) | (0.0122) | (0.00454) | (0.00877) | (0.00965) | (0.00493) | |
| Sq. # of digital provisions | −0.000422** | 0.000107 | ||||
| (0.000194) | (0.000239) | |||||
| # of environ. provisions | −0.0177* | 0.0203 | −0.00269 | −0.00327 | −0.00460 | −0.00744** |
| (0.00981) | (0.0124) | (0.00265) | (0.00392) | (0.00542) | (0.00316) | |
| Sq. # of environ. provisions | 0.000159** | −0.000221** | ||||
| (7.30e-05) | (0.000102) | |||||
| Country-Year FE | Yes | Yes | Yes | Yes | Yes | Yes |
| Partner-Year FE | Yes | Yes | Yes | Yes | Yes | Yes |
| Country-Partner FE | Yes | Yes | Yes | Yes | Yes | Yes |
| Error-clust. ctry-partn. | Yes | Yes | Yes | Yes | Yes | Yes |
| Observations | 33,694 | 32,045 | 26,132 | 25,048 | 7,562 | 6,997 |
| R-squared | 0.939 | 0.923 | 0.939 | 0.917 | 0.937 | 0.951 |
Robust standard errors in parentheses. *** p < 0.01, ** p < 0.05, * p < 0.1.
The four columns on the right of Table 6.2 explore another dimension of heterogeneity by disentangling between trade flows with regional and non-regional partners. Results for imports remain statistically not significant while this splitting adds an interesting perspective to the previous observations. Regional exports take a boost out of the existence of one or several PTAs with the importing partner in the region, while this positive impact vanishes for exports towards extra-regional partners. On the other hand, the impact of provisions is mostly absorbed by PTAs with extra-regional partners. One potential explanation for this may be the limited number of PTAs among Latin American countries including these types of provisions.
As a next step, the analysis incorporates the World Bank classification of (non-) high-income countries for partners of Latin American countries. The use of a fixed classification facilitates the interpretation of results and avoids introducing a potential bias to the previously outlined observations. More precisely, the analysis now explores the difference in results around two points in time: at the beginning of the period (classification in 2000) and at the end of the period (classification in 2020). These results are presented in Table 6.3 for non-high-income and high-income countries, denoted as Non-HIC and HIC respectively.
| Non-HIC in 2000 | HIC in 2000 | Non-HIC in 2020 | HIC in 2020 | |||||
|---|---|---|---|---|---|---|---|---|
| Imports | Exports | Imports | Exports | Imports | Exports | Imports | Exports | |
| PTA dummy | 0.0213 | 0.236** | -0.139 | 0.184 | 0.288*** | 0.160 | −0.475*** | 0.265** |
| (0.118) | (0.111) | (0.135) | (0.177) | (0.0919) | (0.132) | (0.167) | (0.132) | |
| No. of digital provisions | −0.00420 | 0.0105** | 0.00275 | 0.00539 | −0.00110 | 0.0101* | −0.0135 | 0.00127 |
| (0.00797) | (0.00486) | (0.00668) | (0.00921) | (0.00394) | (0.00597) | (0.0149) | (0.00572) | |
| No. of environ. provisions | −0.000278 | −0.00680** | 0.000335 | −0.00554 | −0.00493** | −0.00431 | 0.0105 | −0.00459 |
| (0.00455) | (0.00267) | (0.00330) | (0.00457) | (0.00240) | (0.00345) | (0.00764) | (0.00316) | |
| Country-Year FE | Yes | Yes | Yes | Yes | Yes | Yes | Yes | Yes |
| Partner-Year FE | Yes | Yes | Yes | Yes | Yes | Yes | Yes | Yes |
| Country-Partner FE | Yes | Yes | Yes | Yes | Yes | Yes | Yes | Yes |
| Error-clust. ctry-part. | Yes | Yes | Yes | Yes | Yes | Yes | Yes | Yes |
| Observations | 22,068 | 21,748 | 11,626 | 10,297 | 16,929 | 17,483 | 16,765 | 14,562 |
| R-squared | 0.931 | 0.920 | 0.952 | 0.932 | 0.941 | 0.920 | 0.937 | 0.929 |
Robust standard errors in parentheses. *** p < 0.01, ** p < 0.05, * p < 0.1.
The splitting between more and less advanced countries in the year 2000 indicates that all trade impacts observed for Latin American countries are concentrated in exports to 2000 non-high-income countries. The structure of these results is qualitatively identical to the one observed in Table 6.2. In the last four columns of Table 6.3, however, a different pattern can be detected. Latin American imports from non-high-income countries in 2020 benefit from PTAs, although not specifically from the inclusion of environmental provisions in them. Imports from 2020 high-income countries are negatively affected by the presence of PTAs, although this may be related to a reorientation of previous imports to new destinations with more attractive or closer markets. The PTA impact on the export side is positive when exports are shipped to 2020 high-income countries, while the positive impact of digital provisions remains mainly with 2020 non-high-income countries. These changes between the left and right sides of Table 6.3 are due to the status changes of a limited number of countries: twenty-six partners shifted from non-high-income-country to high-income-country status over the period. These countries include nine European countries, four Latin American countries (Chile, Panama, Uruguay, and Trinidad and Tobago), and Korea, as well as several small island states. The enlargement of the European Union and the economic development of regional partners have been key to turning PTAs into drivers of exports. Digital provisions and likely the digitalisation of procedures have been a successful trigger for higher exports to less developed partners.
At this point, it seems necessary to consider whether an aggregate impact can be expected from digital and environmental provisions whose impact may be related to a smaller subset of goods. Regarding environmental provisions, one might expect that products considered as environmentally relevant are the ones which are more significantly impacted by these provisions. The identification of this subset of products is based on Zugravu‑Soilita (Reference Zugravu-Soilita2018). More specifically, this product list combines different proposals put forward by several WTO members and international agenciesFootnote 9 for the classification of environmental goods based on Harmonised System (HS) six-digit codes.
The conversion of this list to the 1997 HS nomenclature yields 364 environmental HS six-digit product categories. Regarding digital provisions, the list of ICT goods in the OECD Handbook for Measuring Digital Trade (2019) is used. After conversion, this results in sixty-four ‘digital’ or rather ICT products. It is true that these products are not the only ones to be affected by digital provisions, and they may not even be targeted directly by these provisions. However, the analysis presented here follows the current ‘standard’ in the literature. There is a minor overlap of products between the two lists, which includes office machines (HS 847290), photosensitive semi-conductor devices (HS 854140), electrical machines and apparatus (HS 854380), and lasers other than laser diodes (HS 901320).
Figure 6.9 indicates that although environmental goods are present in most of HS sections, they account for more than 5 per cent of HS product categories in sections XI (Chemicals and Allied Industries), IX (Wood and Wood Products), XI (Textiles), XIII (Footwear), XV (Metals), XVI (Machinery and Electrical), and XVIII (Precision Instruments). These are the same HS sections concerned with the presence of ICT goods. The assumption here is that the impact of digital and environmental provisions should be more sizeable for these HS sections. The remaining analysis is limited to these HS sections, further restricting the sample.
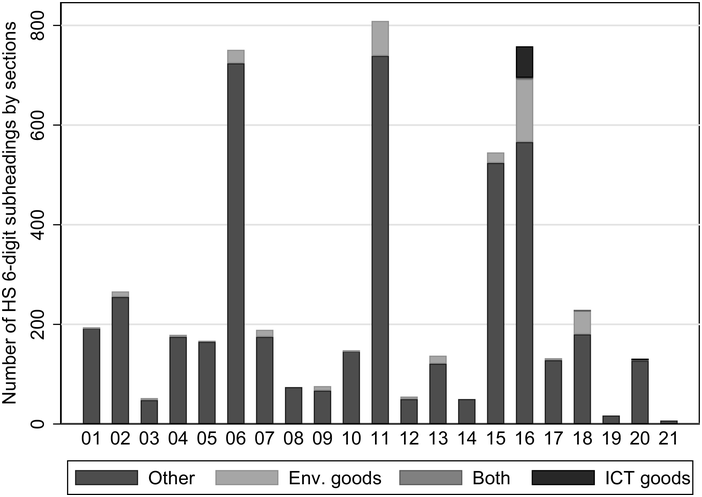
Figure 6.9 Environmental and ICT product categories across HS sections.
Table 6.4 combines specifications run for aggregate values in Tables 6.1 and 6.2. The impact of PTAs and provisions on imports remains not statistically significant. However, the results for exports are confirmed qualitatively and estimates are larger, confirming a protectionist behaviour for environmental provisions.
| Selected sample | Regionally | Extra-regionally | ||||
|---|---|---|---|---|---|---|
| Imports | Exports | Imports | Exports | Imports | Exports | |
| PTA dummy | 0.108 | 0.464*** | −0.0320 | 0.496** | 0.434** | 0.253* |
| (0.112) | (0.121) | (0.105) | (0.231) | (0.181) | (0.140) | |
| No. of digital provisions | 0.00124 | 0.0114** | −0.00104 | 0.0190 | 0.0105 | 0.0164*** |
| (0.00502) | (0.00555) | (0.00396) | (0.0122) | (0.00846) | (0.00620) | |
| No. of environ. Provisions | −0.00273 | −0.0124*** | 0.000435 | −0.0163*** | −0.0132*** | −0.0126*** |
| (0.00287) | (0.00344) | (0.00244) | (0.00626) | (0.00498) | (0.00435) | |
| Country-Year FE | Yes | Yes | Yes | Yes | Yes | Yes |
| Partner-Year FE | Yes | Yes | Yes | Yes | Yes | Yes |
| Country-Partner FE | Yes | Yes | Yes | Yes | Yes | Yes |
| Error-clust. ctry-part. | Yes | Yes | Yes | Yes | Yes | Yes |
| Observations | 28,714 | 20,796 | 21,915 | 14,624 | 6,799 | 6,160 |
| R-squared | 0.951 | 0.931 | 0.953 | 0.919 | 0.948 | 0.964 |
Robust standard errors in parentheses. *** p < 0.01, ** p < 0.05, * p < 0.1.
While considering regional and extra-regional differences, imports from regional partners are the only configuration not to achieve any statistical significance. The structure of results is almost identical for the different types of trade flows, although digital provisions only play a significant role for exports out of the region. PTAs have a positive impact on the different trade flows, and environmental provisions show a negative impact.
Table 6.5 considers the impact of partners with high-income status at the beginning and at the end of the period, as previously illustrated in Table 6.3. The economic development of partners is key to achieving a positive impact of PTAs on exports while imports do not depict a clear pattern. The positive impact of digital provisions is limited to developed countries, while the negative impact of environmental provisions is reflected in almost all trade flows.
Table 6.5 Heterogeneity by income levels of partners (beginning and end of period) on selected HS sectors.
| Non-HIC in 2000 | HIC in 2000 | Non-HIC in 2020 | HIC in 2020 | |||||
|---|---|---|---|---|---|---|---|---|
| Imports | Exports | Imports | Exports | Imports | Exports | Imports | Exports | |
| PTA dummy | 0.217 | 0.447*** | −0.230* | 0.334 | 0.336*** | 0.445*** | −0.345* | 0.395** |
| (0.150) | (0.143) | (0.120) | (0.264) | (0.130) | (0.172) | (0.192) | (0.197) | |
| No. of digital provisions | 0.00317 | 0.00839 | −0.000487 | 0.0461*** | 0.00859* | 0.00964 | −0.0101 | 0.0213* |
| (0.00651) | (0.00584) | (0.00587) | (0.0120) | (0.00444) | (0.00711) | (0.00952) | (0.0113) | |
| No. of environ. provisions | −0.00679* | −0.00975** | 0.00283 | −0.0270*** | −0.0111*** | −0.00971** | 0.00812** | −0.0165*** |
| (0.00398) | (0.00402) | (0.00315) | (0.00602) | (0.00381) | (0.00477) | (0.00410) | (0.00600) | |
| Country-Year FE | Yes | Yes | Yes | Yes | Yes | Yes | Yes | Yes |
| Partner-Year FE | Yes | Yes | Yes | Yes | Yes | Yes | Yes | Yes |
| Country-Partner FE | Yes | Yes | Yes | Yes | Yes | Yes | Yes | Yes |
| Error-clust. ctry-part. | Yes | Yes | Yes | Yes | Yes | Yes | Yes | Yes |
| Observations | 18,168 | 13,862 | 10,546 | 6,920 | 13,650 | 11,125 | 15,064 | 9,661 |
| R-squared | 0.941 | 0.934 | 0.966 | 0.932 | 0.952 | 0.934 | 0.951 | 0.933 |
Robust standard errors in parentheses. *** p < 0.01, ** p < 0.05, * p < 0.1.
As another attempt to understand the impact of these provisions on the composition of trade flows, the share of the aggregated export or import flows for the selected HS sections that is related to environmental and ICT goods is calculated. The dependent variable in this case is bounded between 0 and 100, following closely the approach proposed by Brandi et al. (Reference Brandi, Schwab, Berger and Morin2020).
The results in Table 6.6 do not indicate any ‘greening’ of these trade flows, neither a ‘digitalising’ of them. The most consistent effect to be identified is the negative impact of PTAs, on average, on the ‘greening/digitalising’ of imported values.
| Selected sample | Regionally | Extra-regionally | ||||
|---|---|---|---|---|---|---|
| Imports | Exports | Imports | Exports | Imports | Exports | |
| share | share | share | share | share | share | |
| PTA dummy | −4.867*** | −2.708 | −5.019** | 0.287 | −5.999** | 0.0537 |
| (1.775) | (2.162) | (2.307) | (4.342) | (2.592) | (1.811) | |
| No. of digital provisions | 0.121* | −0.0944 | −0.0182 | 0.0404 | 0.186* | −0.129 |
| (0.0660) | (0.0812) | (0.0911) | (0.136) | (0.0996) | (0.0798) | |
| No. of environ. provisions | −0.00216 | 0.0695 | 0.0676 | −0.0425 | −0.0252 | 0.0416 |
| (0.0401) | (0.0447) | (0.0536) | (0.0767) | (0.0612) | (0.0474) | |
| Country-Year FE | Yes | Yes | Yes | Yes | Yes | Yes |
| Partner-Year FE | Yes | Yes | Yes | Yes | Yes | Yes |
| Country-Partner FE | Yes | Yes | Yes | Yes | Yes | Yes |
| Error-clust. ctry-part. | Yes | Yes | Yes | Yes | Yes | Yes |
| Observations | 26,909 | 18,282 | 20,361 | 12,373 | 6,548 | 5,887 |
| R-squared | 0.671 | 0.706 | 0.656 | 0.729 | 0.705 | 0.671 |
Robust standard errors in parentheses. *** p < 0.01, ** p < 0.05, * p < 0.1.
6.7 Conclusion
This chapter takes a close look at the design and the effects of digital and environmental provisions in Latin American PTAs. To give some context, a brief discussion on the, rather heterogeneous, domestic landscape of digital and environmental policies in Latin America is provided. This heterogeneity is also found in the design of digital and environmental provisions in Latin American PTAs. Overall, however, a positive link can be observed: countries with more ambitious digital policies also tend to be more ambitious in their environmental policies, and vice versa, both at the domestic and international trade policy levels. An empirical investigation into the effects of PTA design differences on the volume and composition of trade flows yields a number of interesting insights. Digital provisions in Latin American PTAs are found to increase exports, while environmental provisions are associated with a decline in such trade flows. For imports, no such results of statistical significance can be detected. Neither does the analysis provide statistically significant evidence for a ‘greening’ or ‘digitalising’ of trade flows – that is, on the composition of international trade.
There are a number of avenues for future research on this topic. One limitation that future research may address is related to the nature of digital and environmental provisions in PTAs. The analyses outlined in this chapter focus primarily on the scope, or the number, of such provisions included in PTAs. A more fine-grained classification of provisions according to their purpose and/or legal enforceability would surely add considerable value to the debate. This may also contribute to a deeper understanding of the identified effects of PTA design on exports and imports. Notwithstanding these limitations, it is hoped that this chapter contributes to an increasingly active debate on the link between digitalisation and environmental sustainability, and the economic impacts associated with it.


 Open access