


Introduction
Patterns of structural change in the labour force, known as polarisation or upgrading, are among the most debated topics in labour economics. They have led to theoretical and empirical work that has developed conceptual frameworks to model them. The first one, known as the Skill-Biased Technical Change (SBTC) hypothesis, states that the relative demand for labour is higher the more educated/skilled workers are (Katz and Murphy Reference Katz and Murphy1992; Acemoğlu and Autor Reference Acemoğlu, Autor, Shelterer and Card2011). SBTC explained the structural changes in the occupational structure that occurred mainly in the 1980s.
More recent evidence has challenged SBTC. The Routine-Biased Technical Change (RBTC) hypothesis (Acemoğlu and Autor Reference Acemoğlu, Autor, Shelterer and Card2011) shows that the share of middle-skilled jobs with a higher content of repetitive, automatable tasks has shrunk relative to both high-skilled and low-skilled jobs. Such change is usually referred to as job polarisation and has been used to describe the structural changes that have taken place in most labour markets since the 1990s; indeed RBTC has become the dominant analytical framework due to its higher degree of complexity and ability to explain actual developments.
While job polarisation has captured most of the debate on the changing structure of the labour market, there is a substantial body of research showing that it is, by no means, guaranteed to happen. Although several studies conclude that the RBTC hypothesis holds and that polarisation is occurring in Europe (Goos et al Reference Goos, Manning and Salomons2009), other research shows that labour markets in Western European countries have exhibited a variety of structural change patterns, with job polarisation being less common than occupational upgrading (Fernández-Macías and Hurley Reference Fernández-Macías and Hurley2017).
Knowledge of job polarisation has also evolved by looking beyond the basic dichotomy of high and low-skill job growth versus the middle-skill decline in employment. Foster and Wolfson (Reference Foster and Wolfson2010) show that polarisation is in fact primarily associated with strong gains in high-skill occupations, with low-skilled jobs experiencing rather modest gains, conclusions supported by Hunt and Nunn (Reference Hunt and Nunn2022) and Spareboom and Tarvid (Reference Sparreboom and Tarvid2016).
These findings refine the observed patterns of structural change, indicating the occurrence of both polarisation and upgrading, even for Central and Eastern Europe (Nchor and Rozmahel Reference Nchor and Rozmahel2020). They suggest that these phenomena may not be incompatible and that, even if one of the two patterns emerges as dominant, it is often not unambiguous (Haslberger Reference Haslberger2021).
Drawing upon the extant literature, it is evident that the nexus between polarisation and upgrading is characterised by numerous nuanced considerations. This study interrogates the simultaneity of these two phenomena and the capacity to concurrently explain the evolution of the employment structure. To this end, we have conducted a comprehensive examination of the latest developments in the occupational structure across all EU countries in order to unveil the true nature of the prevailing structural changes occurring in national labour markets. The analysis employs the ISCO-08 occupational structure in its entirety for the first time and incorporates all new Member States, for which there has been little analysis of the occupational structure to date. The article continues with a literature review, followed by a description of the data and methods used. The subsequent section aims to provide a comprehensive overview of the interplay between polarisation and upgrading as key drivers of structural change in national labour markets. This section also delineates the analytical framework that underpins the analysis and conclusion sections of the article.
Literature review
The SBTC hypothesis was originally formulated to explore and explain the changes effected by the increasing automation and computerisation of the workplaces (Katz and Murphy Reference Katz and Murphy1992). The hypothesis essentially assumes that the more educated are more likely to have jobs and fare better in the new, emerging economy. This is formalised as a two-class-worker model: the skilled and the unskilled. The emphasis on a more educated workforce, possessing the right skills and abilities able to match the new work requirements, is identified by several authors (Autor Katz and Krueger Reference Autor, Katz and Krueger1998; Acemoğlu Reference Acemoğlu2002) as the main driving force behind the structural changes in the occupational structure. Empirical evidence demonstrates that the most educated workers tend to be the most productive, earning higher wages, and experience greater employment growth (Acemoğlu and Autor Reference Acemoğlu, Autor, Shelterer and Card2011). However, this analytical framework makes the simplistic assumption of a direct correspondence between tasks and skills (Acemoğlu and Autor Reference Acemoğlu, Autor, Shelterer and Card2011).
Nevertheless, new empirical evidence suggested that the impact of automation on occupations is not solely determined by their level of training and education. Works by several authors (Autor, Levy, and Murnane Reference Autor, Levy and Murnane2003, Goos and Manning Reference Goos and Manning2007) have shown that evolution in employment tasks was no longer monotonous across earning levels. Shifts in occupational structure in favour of those at both ends of the wage distribution have defined structural changes in the labour markets (Acemoğlu and Autor Reference Acemoğlu, Autor, Shelterer and Card2011). This new reality has been formalised in a new theoretical model, which explains the dynamics of occupational change by adding the class of middle-skill workers. The model also introduces a task-based approach that models the influence of tasks on skills allocation and its impact on earnings and occupational structure (Acemoğlu and Autor Reference Acemoğlu, Autor, Shelterer and Card2011).
Changes in the occupational structure are thus explained by the impact of new technologies or new business practices (Acemoğlu and Autor Reference Acemoğlu, Autor, Shelterer and Card2011), the implementation of which enables the replacement of tasks deemed to be ‘routine’ or repetitive. The tasks under discussion are distinguished from those designated as ‘non-routine’ in that they demand the application of skills in contexts necessitating problem-solving, complex communication, creative content, or personal services (Haslberger Reference Haslberger2022; Autor Reference Autor2015). In many non-routine contexts, technology has an augmenting role, which is consistent with the findings of Frey and Osborne (Reference Frey and Osborne2017), who identify the ‘engineering bottlenecks’ as tasks that are not easily automatable: namely, manual tasks involving perception and manipulation, as well as creative and social tasks. In both approaches, the task and skill content of jobs is analysed and acknowledged as one of the key drivers which explain the structural shifts of employment towards the non-automatable/ hard-to-automate jobs (Pouliakas Reference Pouliakas2018).
A significant body of research has focused on defining the task content of occupations from the routinisation perspective. According to Haslberger (Reference Haslberger2021), the main approaches related to defining the task content are laid out by Autor and Dorn (Reference Autor and Dorn2013) and identify three task categories: routine, abstract, and manual tasks, and by Macias and Hurley (Reference Fernández-Macías and Hurley2017), who build three indexes based on survey responses aggregated at the job level.
These approaches have materialised as routine task intensity (RTI) indexes, which refer to both manual and non-manual tasks, in an attempt to explain the decline of routine jobs consistent with the RBTC hypothesis (Autor and Dorn Reference Autor and Dorn2013; Fernández-Macías and Hurley Reference Fernández-Macías and Hurley2017; Haslberger Reference Haslberger2022). Complexity indexes, on the other hand, seek to explain the above-average performance of jobs that are difficult, if not impossible, to automate (Fernández-Macías and Hurley Reference Fernández-Macías and Hurley2017; Haslberger Reference Haslberger2022) by summarising higher-level skills such as communication, abstraction, and decision-making associated with above-average employment growth (Caines et al Reference Caines, Hoffmann and Kambourov2017). These indexes serve as an alternative to the routine dimension of occupational change, rather than as a counterpoint to RTI indexes (Haslberger Reference Haslberger2021).
Analysing structural changes in the occupational structure often generates sweeping conclusions and predictions. Thus, SBTC usually predicts straightforward occupational upgrading (Goldin and Katz Reference Goldin and Katz2008, cited by Haslberger Reference Haslberger2022), while RBTC tends to predict straightforward polarisation (Autor et al Reference Autor, Levy and Murnane2003; Goos et al Reference Goos, Manning and Salomons2009). In many cases, the analytical framework and conclusions consider that a dichotomy exists between the two (Haslberger Reference Haslberger2022; Oesch and Picitto Reference Oesch and Piccitto2019; Oesch and Rodrigues-Menes Reference Oesch and Rodriguez Menes2011; Macias and Hurley Reference Fernández-Macías and Hurley2017), often driven by the fact that polarisation is the prevailing, mainstream analytical framework. This reality is more striking as it does not occur only in multi-country studies. Even in single-country studies for UK and Spain, divergent conclusions have been reached for similar periods (Sebastian Reference Sebastian2019; Salvatori Reference Salvatori2018).
This artificial dichotomy that shaped the literature on structural employment changes has overlooked several arguments. Acemoglu and Autor (Reference Acemoğlu, Autor, Shelterer and Card2011) state that SBTC is a ‘natural starting point’ in explaining structural changes in the occupational structure, whose findings are being refined following empirical evidence by RBTC. Autor (Reference Autor2015) also states that polarisation is likely to be less relevant in explaining the structural changes in the occupational structure in the future, as (middle-skill) job contents will increasingly incorporate non-routine tasks requiring higher levels of technical and interpersonal skills. This finding aligns with Sebastian (Reference Sebastian2018), who noted that in Spain, middle-skill workers transition to both low-skill and high-skill occupations.
New insights have shown that the realities of occupational change are more nuanced than the ‘hollowing out of the middle’ picture. Foster and Wolfson (Reference Foster and Wolfson2010) were among the first to show the unbalanced nature of polarisation, with the high-skill jobs showing significant expansion, whereas low-skill jobs posting only marginal gains. Similar findings are obtained for the US by Hunt and Nunn (Reference Hunt and Nunn2022). The strong expansion of high-skill jobs as a key driver of polarisation is formalised by Sparreboom and Tarvid (Reference Sparreboom and Tarvid2016), whose polarisation index factors in the ‘imbalanced nature of polarisation’, and also helps determine to what extent it is tilted towards job expansion at (usually) the higher end of the wage distribution.
These findings are confirmed by multi-country evidence. The diversity of structural change patterns across several European countries has been highlighted by several authors, including Fernández-Macías (Reference Fernández-Macías2012) and Martinaitis et al (Reference Martinaitis, Christenko and Antanavičius2021). They have demonstrated that polarisation is only one of several structural change patterns in these countries and is not even the prevalent one. Rather, research focusing on several countries arrives at strong conclusions in favour of upgrading (Oesch and Picitto Reference Oesch and Piccitto2019; Oesch and Rodriguez-Menes Reference Oesch and Rodriguez Menes2011). On the other hand, the performance of service workers has partially explained the polarisation patterns of the occupational structure (Tahlin Reference Tahlin2019; Acemoglu and Autor Reference Acemoğlu, Autor, Shelterer and Card2011). Gender, age structure, industry, and immigration are also used to explain occupational structure changes (Salvatori Reference Salvatori2018; Tahlin Reference Tahlin2019; Murphy and Oesch Reference Murphy and Oesch2018). While these factors have explained country-specific changes in the occupational structure, they have not been able to lead to a consistent model that can unequivocally explain the occurrence of either polarisation or upgrading.
The diversity of results has been summarised by Haslberger (Reference Haslberger2022), who concludes that most studies do not yield clear-cut results in favour of either upgrading or polarisation. This is evident in Appendix 2 Table A1 which focuses on multi-country studies. Although the list is not exhaustive, we observe different results for similar countries and time periods.
This diversity of conclusions is not confined to multi-country studies. Results for analysis sub-periods confirm the fact that changes in occupational structure have not been consistent across time. Hunt and Nunn (Reference Hunt and Nunn2022) show that structural occupational change patterns differ and that the shape of changes does not correspond to unambiguous polarisation, but to situations where low-skill jobs outperform the middle-skill ones in the sense that their decline is less pronounced. Tahlin (Reference Tahlin2019) observes that polarisation over a longer period comprises periods of mid-upgrading. Oesch and Murphy (Reference Oesch and Rodriguez Menes2017) show that polarisation patterns occurred in the 1980s in Switzerland and Ireland. Given this evidence, we adopt a critical stance on the validity of some single-period, long-term analyses, as the employment structure of the start year can significantly influence overall results, potentially overlooking major interim changes.
We consider that for the purpose of analysing structural changes in European labour markets, data limitations are extremely important. In many cases, analysis has been carried out for several sub-periods (Eurofound 2015; Fernandez-Macias and Hurley Reference Murphy and Oesch2018; Sebastian Reference Sebastian2018), and due to major data breaks, results are explicitly reported over smaller periods in order to avoid reaching overall conclusions based on inconsistent data. A similar problem has occurred in the US (Hunt and Nunn Reference Hunt and Nunn2022), where the handling of a data break practically reversed the well-known polarisation result of Autor (2015) considered ‘an artefact of occupation code redefinitions’ (Hunt and Nunn Reference Hunt and Nunn2022).
Data and methods
Employment data come from European Union Labour Force Survey (EU-LFS), available at the two-digit ISCO-08 occupation level, which is the most appropriate for a ‘job approach’. The analysis period spans from 2011, the first year in which data were reported using the ISCO-08 classification, to 2023.
Significant data issues have contributed to our choice. While a longer time period may help to better assess changes in the occupational structure, major data breaks between 2008 and 2011 (Fernandez-Macias and Hurley Reference Fernández-Macías and Hurley2017; Sebastian Reference Sebastian2018) can significantly alter the results of the analysis. The transition between ISCO-88 and ISCO-08 data is not properly documented by Eurostat, as no 2011 data were reported using the ISCO-88 classification. Thus, the best option was to choose a period for which data is fully consistent.
The perceived impact of COVID-19-related measures on labour markets (OECD 2021; Livanos and Ravanos Reference Livanos and Ravanos2024) which resulted in major changes in work arrangements was also considered, leading to the choice of 2019–2023 as the maximum available time period to assess structural changes that persisted after the lockdown restrictions ended.
The first period of analysis, 2011–2019, corresponds to the recovery phase following the Great Recession, with 2019 representing a peak year in terms of employment progress and economic growth (European Commission 2019). While this affects the results for the first period, valid results on structural change can be obtained even for non-standard periods (Verdugo and Allègre Reference Verdugo and Allègre2020).
Wage data come from the Structure of Earnings Survey (SES), with waves of 2014 and 2018, representing the earliest and most reliable comparable data based on the ISCO-08 classification.
Country-specific changes are presented as distributional trends/patterns using occupational shares by wage-ranked employment quintiles, consistent with several cross-country analyses (Fernández-Macías and Hurley Reference Fernández-Macías and Hurley2017; Salvatori Reference Salvatori2018). Data availability and reliability issues for some countries, and outcomes observed by several authors (Fernández-Macías Reference Fernández-Macías2012; Oesch and Piccitto, Reference Oesch and Piccitto2019) made us choose/use a two-digit occupation-based wage structure, which provides a strong focus on job quality.
A scatter plot and a local polynomial fitting curve are employed to model changes in employment shares, using a rank-based ordering of 2-digit occupational wages as implemented by Dauth (Reference Dauth2014), starting from the lowest (1) to the highest (38) one to accommodate a wide variety of wage levels and distributions across the EU member states.
The Job Polarisation Index (JPI) (Sparreboom and Tarvid Reference Sparreboom and Tarvid2016) is used to explore the existence and unbalanced nature of job polarisation. As an analytical approach that complements the analysis of distributional patterns, the JPI uses the changes in employment shares over a six-year period, noted with the ${{\overline {{\Delta _{\rm{5}}}} }}$
operator (Sparreboom and Tarvid Reference Sparreboom and Tarvid2016), for high (h), medium (m), and low (l) level job tiers/categories using the following formula:
${{\overline {{\Delta _{\rm{5}}}} }}$
operator (Sparreboom and Tarvid Reference Sparreboom and Tarvid2016), for high (h), medium (m), and low (l) level job tiers/categories using the following formula:
 $${p\! = {{\rm{1}} \over {\rm{2}}} \cdot \left( {{{\overline \Delta }_{\rm{5}}}l + {{\overline \Delta }_{\rm{5}}}h} \right) \cdot \left( {{\rm{1}} + \left| {{{\overline \Delta }_{\rm{5}}}h - {{\overline \Delta }_{\rm{5}}}l} \right|} \right) \cdot {\rm{100}}}$$
The index is positive if polarisation occurs while a negative value shows a pattern of mid-upgrading (Fernández-Macías Reference Fernández-Macías2012). It also helps to distinguish, to some extent, cases of ‘true polarisation’ with lower positive values, from cases of occupational upgrading, with higher positive values. For consistency with the country-specific job quintiles, country-specific income terciles based on ISCO08 2-digit occupational wages are used in order to accommodate the diversity of wage-based national occupational hierarchies (Haslberger Reference Haslberger2021).
The RTI and complexity indexes are calculated in order to verify both RBTC and SBTC hypotheses using the methodology proposed by Haslberger (Reference Haslberger2022). Considering the analysis period, only Eurofound Working Conditions survey data from waves 5 and 6 (Eurofound 2023) are used, which correspond to the 2010 and 2015 years. Footnote 1 The analysis of the wage schedules for RTI and complexity indexes is carried out using local polynomial fitting curves, which can provide an accurate understanding of the extent to which the polarisation or upgrading patterns are confirmed. Panel regression models with HAC covariance matrices are used to assess whether either, or both indexes, have statistical significance in explaining changes in occupational structure, for both periods taken separately. Following the results of Hausman tests, and because they refer to all countries in our panel, estimations are carried out using fixed effects models, for all specifications.
Most of the calculations and graphs are performed using R software. Apart from R base functions, the following packages used are: ggplot2 for graphs, and the plm package for estimating unbalanced panel regression models with country fixed effects.
Research questions and conceptual issues
Our main goal is to enhance the understanding of job polarisation and occupational upgrading, in terms of their compatibility and ability to explain the changes in the occupational structure observed in the recent past for the EU-27 countries.
To this end, our analysis starts from the generally accepted definitions used in the literature. Thus, job polarisation is defined as a decline in the share of middle-skill jobs accompanied by growth in both the high-skill and low-skill occupations and (occupational) upgrading when the share of high-skill jobs expands at the expense of both middle-skill and low-skill jobs (Fernández-Macías et al Reference Fernández-Macías and Hurley2017; Oesch and Piccito Reference Oesch and Piccitto2019) as an addition to the original two-class canonical model as described in Acemoğlu and Autor (Reference Acemoğlu, Autor, Shelterer and Card2011). Footnote 2 Based on the findings of several authors (Fernández-Macías Reference Fernández-Macías2012; Oesch and Piccito Reference Oesch and Piccitto2019; Tahlin Reference Tahlin2019; Haslberger Reference Haslberger2021), the fact that national labour markets can exhibit a variety of occupational change patterns is also taken into account.
Thus, using the RBTC three-class framework (Acemoğlu and Autor Reference Acemoğlu, Autor, Shelterer and Card2011), a distinction is made between unambiguous polarisation, where both low-skill and high-skill jobs show increase at the expense of the middle-skill jobs, and dominant polarisation, where the decline of middle-skill jobs occurs while the share of low-skill jobs, in most instances, or high-skill jobs, in rare cases, actually decreases at a lower rate than that of middle-skill jobs. Similarly, a distinction is drawn between unambiguous upgrading, where higher skill levels are (monotonically) associated with higher increases, or lower decreases in employment shares, than those for lower skill levels, and dominant upgrading, where the decline in low-skill jobs is less pronounced than that of middle-skilled jobs, a situation similar to that described by Hunt and Nunn (Reference Hunt and Nunn2022) for the 1989–1999 period. Footnote 3 The fact that polarisation and upgrading are not complete opposites, as shown by Haslberger (Reference Haslberger2021), is also analysed. Considering the three job tiers, it can be easily be shown that, if upgrading is present, polarisation can still occur if the gains of high-skill jobs are large enough to offset the decline in the low-skill jobs, decline which is lower than that of middle-skill jobs. Otherwise put, the share of the middle-skill jobs would shrink, as the decline in low-skill jobs is more than offset by the expansion of high-skilled jobs. This is explained in detail in Appendix 1.
Given the focus of this article, which is to explore whether polarisation and upgrading are both compatible explanations of occupational change and can both describe the current changes in the occupational structure of the labour market, the analysis will only examine the patterns of polarisation and upgrading, as defined by most authors, which predominate among the EU countries. Further information on structural change in several countries is provided in Appendix 2, so that interested readers can examine patterns that differ from those that are the focus of this article.
Results and discussion
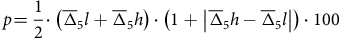
Figure 1 shows the changes in employment shares, over the 2011–2018 and 2019–2023 periods, weighted by the shares of each occupational group from the start year of each observation period. Despite considerable variation in national estimates, a dominant upgrading pattern is observed for the 2011–2019 period, with the lowest-paid occupations having smaller job losses than middle-paid ones. An upgrading trend defines the occupational change for the 2019–2023 period, in line with COVID-19 impact towards increased automation (Livanos and Ravanos Reference Livanos and Ravanos2024). A more careful look shows that, in both cases, growth occurred almost exclusively in the high-skill jobs, middle-skill jobs experienced the largest declines, while employment losses for the lowest-paid jobs plateaued at the bottom of the wage ranks during the 2019–2023 period.
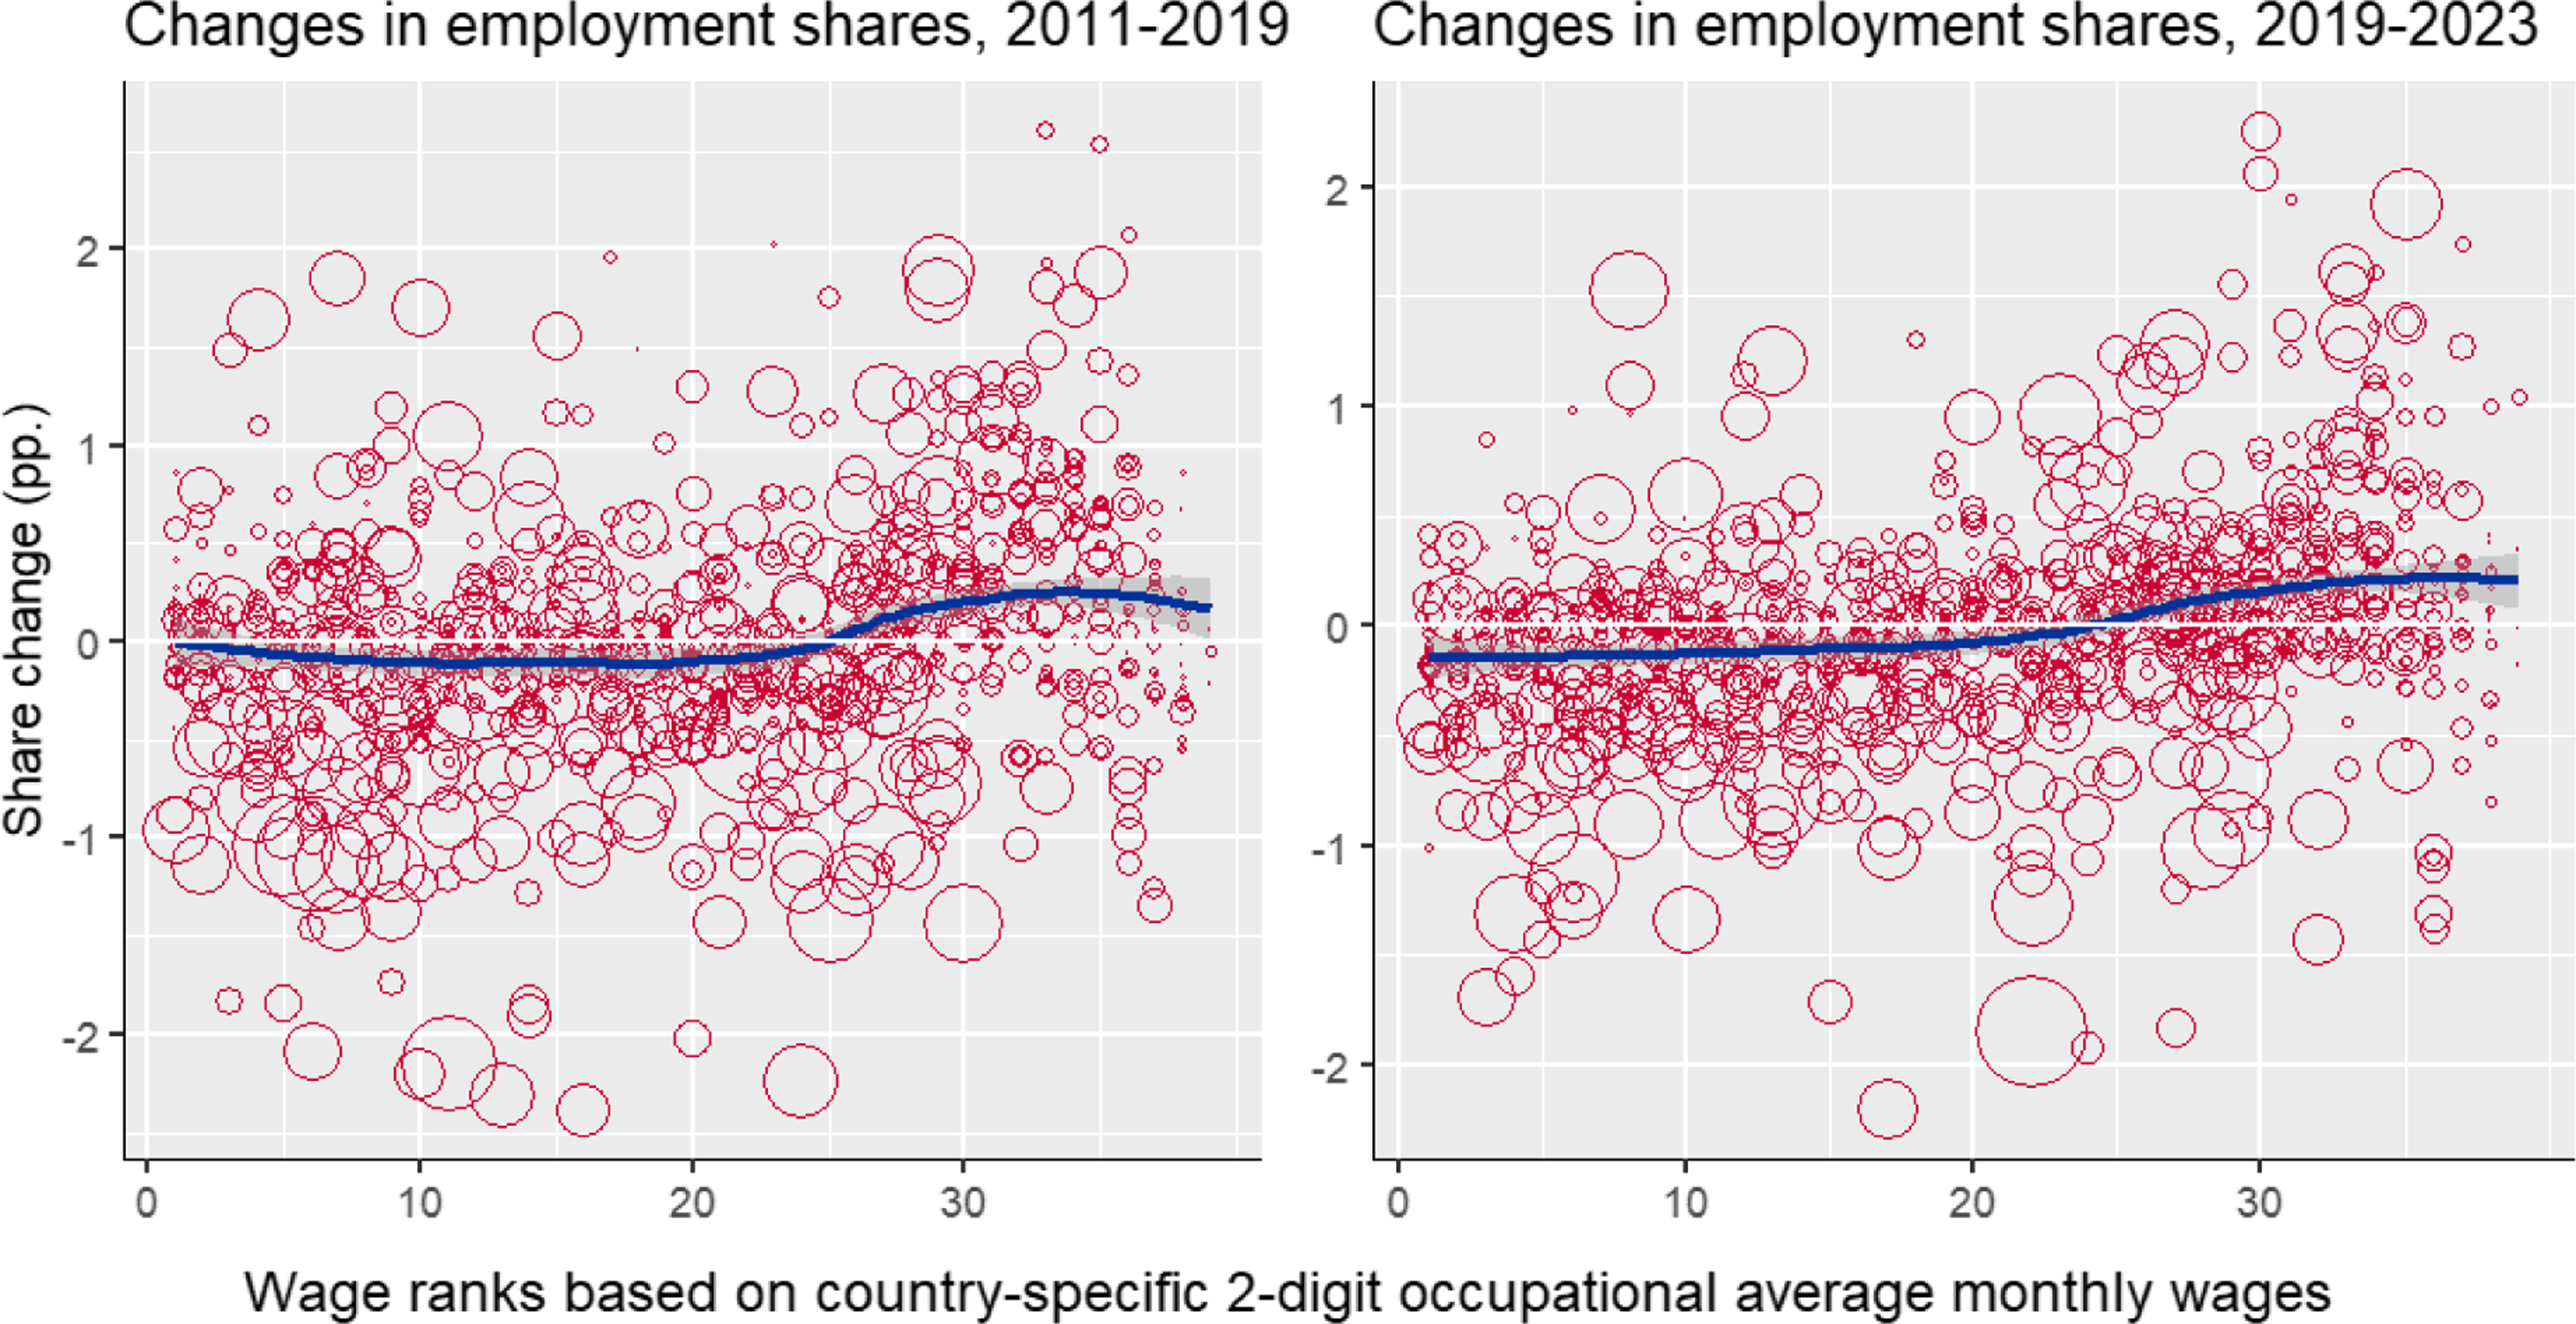
Figure 1. Employment share changes in EU-27 countries by occupational wage ranks.
Note: Some outliers were removed to improve readability.
Source: Authors’ calculations.
These findings are largely confirmed by national-level evidence. Figure 2 shows the polarisation and upgrading (unambiguous and dominant) patterns that are most prevalent in the EU-27 countries (21 and 19 countries respectively). Other cases, including those with discernible patterns such as downgrading, mid-upgrading, or dominant polarisation where only the share of the low-skilled workers increases, are presented in the Appendix 2. In distinguishing the patterns, we allowed for some irregularities in the share changes and considered whether the combined/average change for two adjacent quintiles would be consistent with one of the three patterns being analysed.
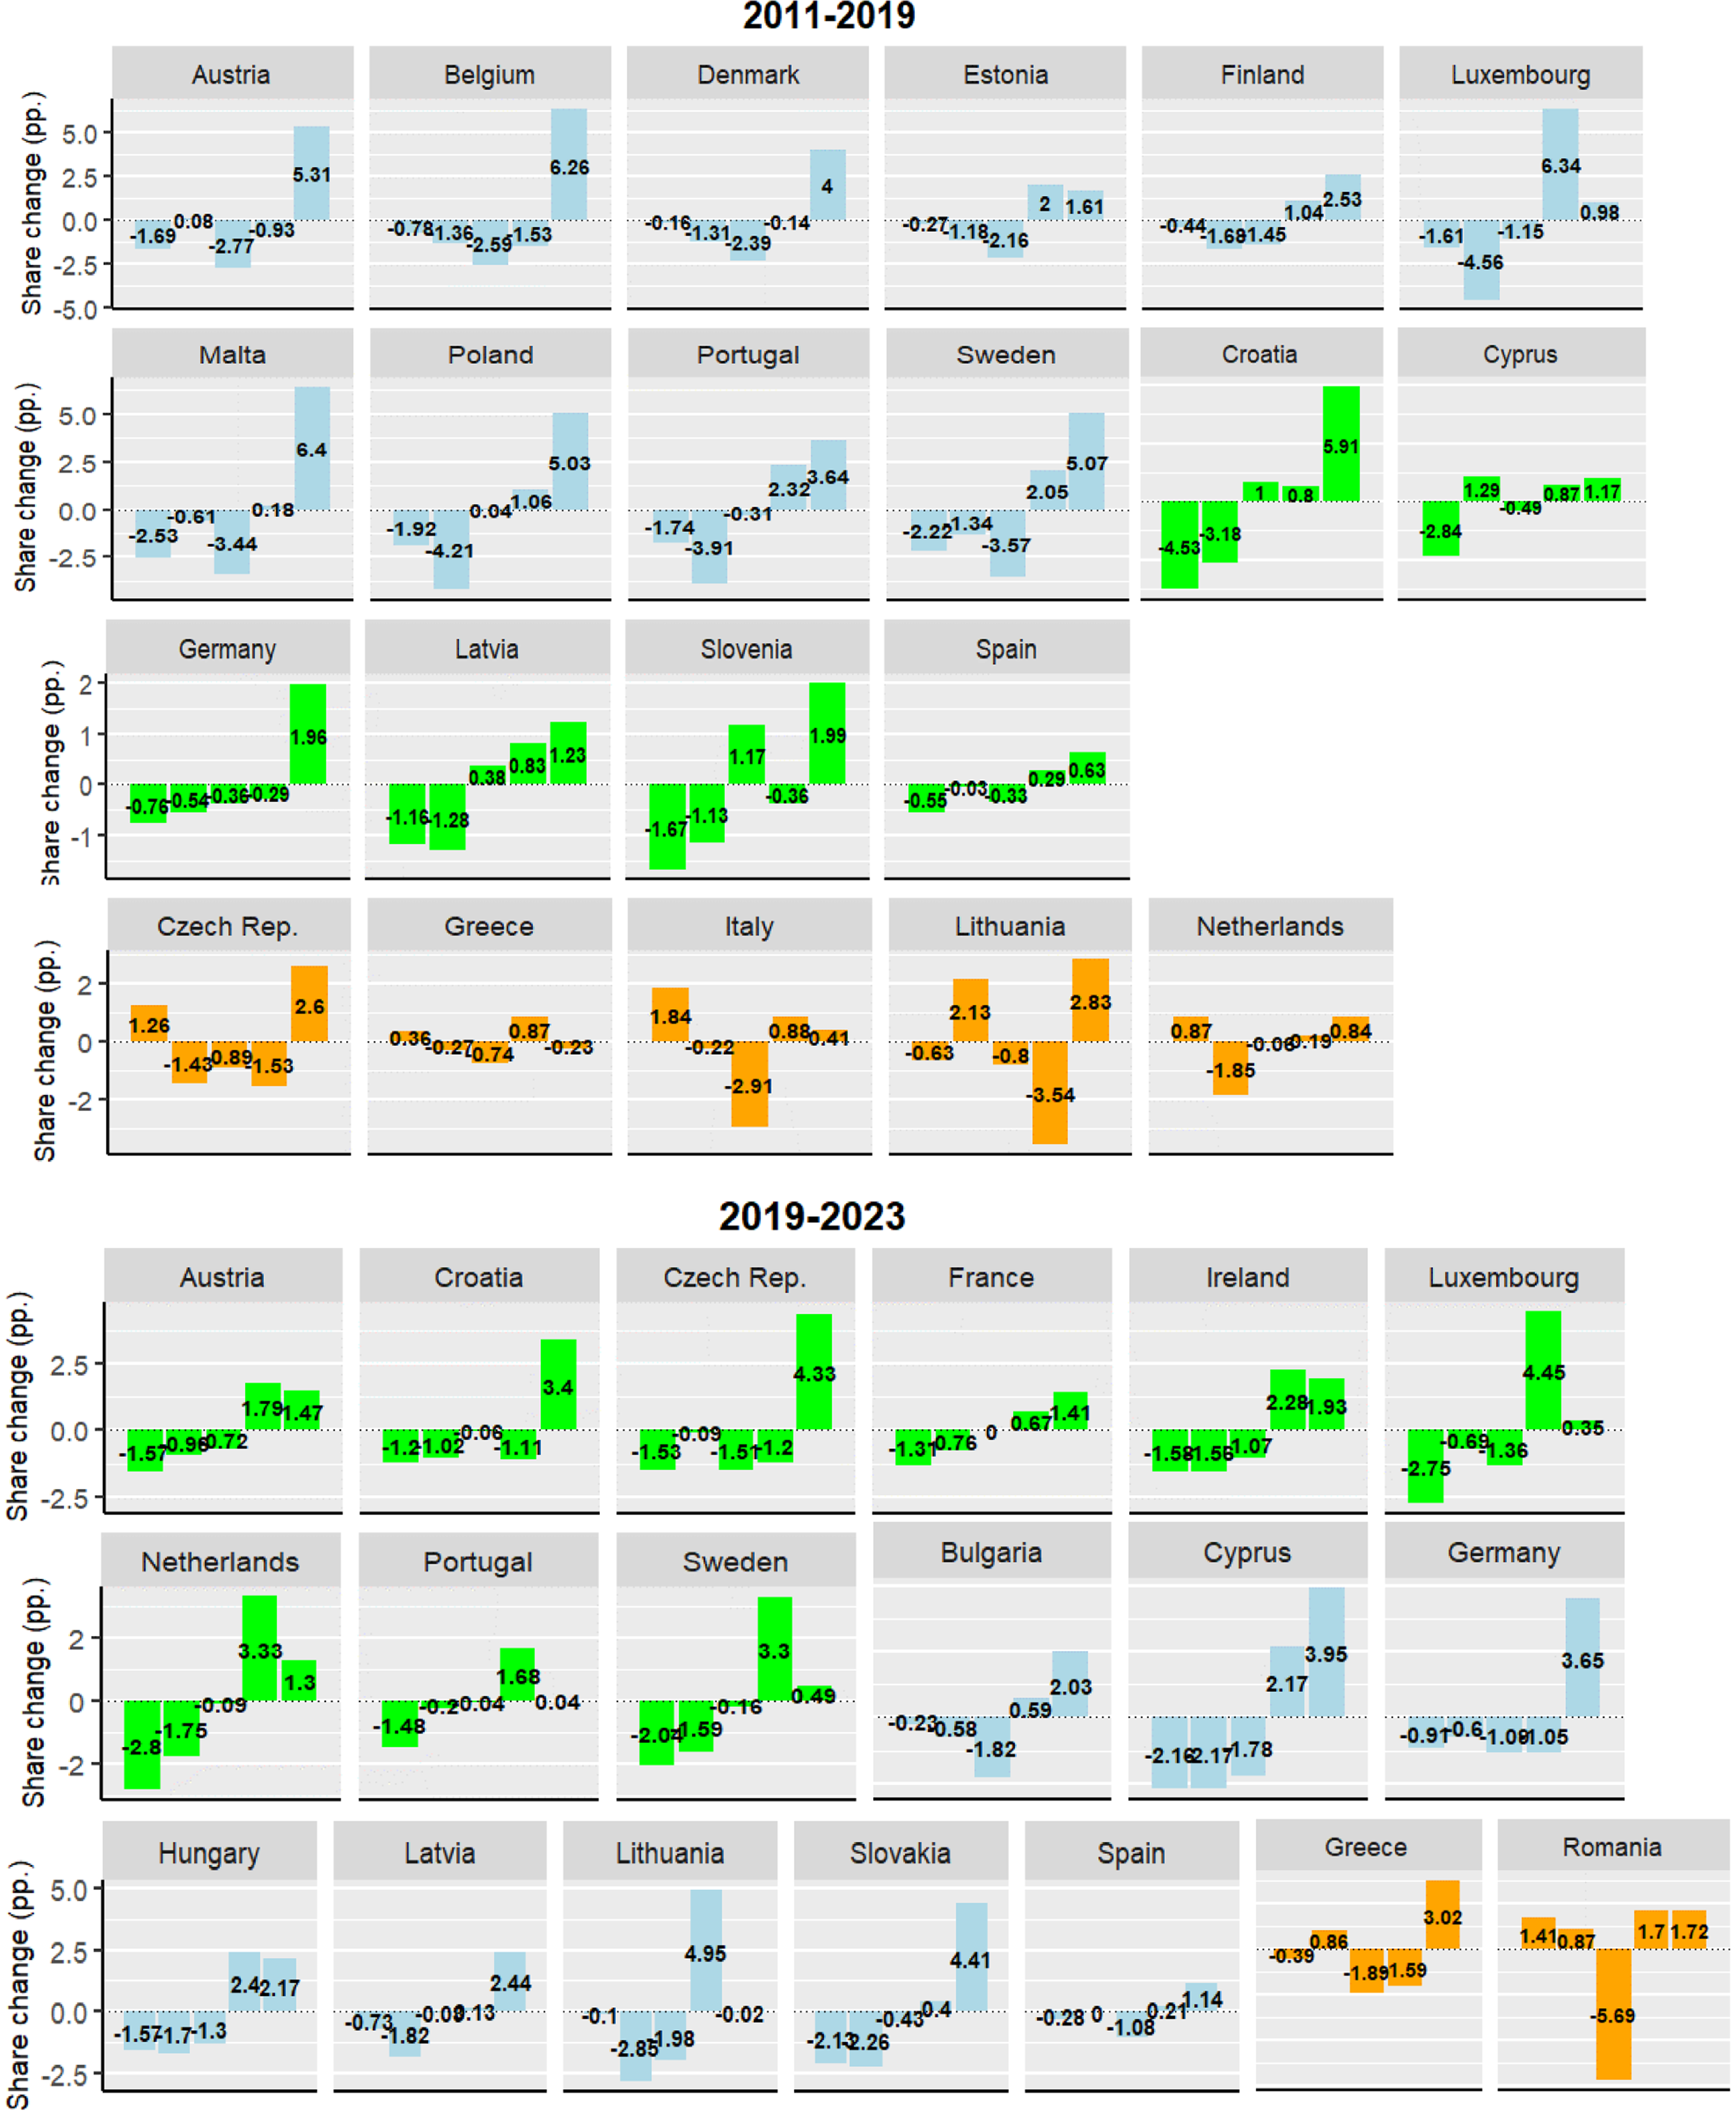
Figure 2. Relative change in employment shares by wage quintile.
Legend: Orange- unambiguous polarisation, Green- unambiguous upgrading, Light blue-dominant upgrading. Wage quintiles from 1 to 5 on the horizontal axis.
Note: Due to a break in data affecting most occupational groups, results for Germany are computed for 2012–2019 period
Source: Author’s work.
For both periods, upgrading patterns were far more prevalent than polarisation, but the latter still occurred when considering cases of dominant upgrading. In the 2011–2019 period, dominant upgrading, where the lowest ranked occupations experienced lower declines than the middle one(s), was the most frequent pattern, followed by upgrading. This is reversed to some extent in the 2019–2023 period when unambiguous upgrading was slightly more prevalent. However, for several countries, e.g. Cyprus and Ireland, the changes in employment shares for the last two quintiles were extremely close, making the distinction between clear and dominant polarisation rather irrelevant.
As far as unambiguous polarisation is concerned, it is increasingly rare (which is confirmed by the RTI-wage schedules presented below). Consistent with findings in Figure 1, both forms of upgrading predominate in the analysis period, and despite the decline in unambiguous cases, polarisation trends still persist.
Results from the JPI index, presented in Figure 3, offer additional insights. Although using occupational terciles can reduce the intuitiveness of the results, and its strong focus on polarisation has limitations in explaining upgrading trends,Footnote 4 it is useful in showing the imbalanced nature of polarisation. It also gives insights into cases where there is dominant upgrading with sizeable polarisation. As the existence of polarisation is computed against previous five-year averages, it has the potential to provide a more reliable assessment of whether polarisation is occurring than the analysis of changes in employment shares computed using the start and the end of the period.
Figure 3. Job polarisation index results for selected countries with observed upgrading and polarisation patterns.
Note: ^ stands for unambiguous upgrading and * for unambiguous polarisation patterns observed. The 2018 results are based on SES 2014 wage structure, whereas 2023 results use the SES 2018 structure.
Source: Authors’ calculations.
The results in Figure 3 show that polarisation was more prevalent than the expansion of middle-skill jobs for both periods, with the latter often occurring in the presence of unambiguous upgrading patterns, especially in the first period. However, the fact that polarisation occurred for most countries in the second period up to 2023, despite the strong upgrading patterns observed in the graphs, proves that it is to a large extent compatible with upgrading. Furthermore, if the second term of the index is considered, it is obvious that the index had higher values in situations where dominant upgrading occurs compared to cases of unambiguous upgrading.
While there is no perfect compatibility with the previous country-level findings, flagged for convenience in Figure 3, the overall picture is fairly consistent. Low or negative index values were mostly obtained for countries with unambiguous upgrading, and dominant upgrading cases tended to have polarisation scores above those for unambiguous upgrading.
Explanations of the evolution of the occupational structure consider the skills and task content of jobs, with a focus on routine vs. non-routine tasks that can be easily automated. The routinisation index has been contrasted with the task complexity index (Fernández-Macías and Hurley 2016; Haslberger Reference Haslberger2022) as a measure of skill bias towards easy versus hard-to-automate jobs (Figure 4).

Figure 4. RTI and complexity index, all EU 27 countries.
Note: Results for the complexity index with 2018 wage ranks are very similar to those for 2014.
Source: Authors’ calculations.
The analysis of the RTI and Complexity indexes calculated for wave 5 and 6 of the European Working Condition Survey (EWCS) (Eurofound 2023) yielded results that are comparable but, to a certain extent, different from those obtained by other authors. While the complexity index has the expected shape, the RTI index has a concave shape for both periods, which is to some extent consistent with the existence of occupational polarisation. However, for the upper half of the distribution, the shape was consistent with occupational upgrading, considering the theoretical framework laid out by Haslberger (Reference Haslberger2021). An important point to observe is that the lowest-paid occupations had routine task index values lower, but comparable to the middle-skill ones. The correlations between RTI and complexity indexes were only -0.59 for the occupation cells and -0.36 for the occupation and country cells. These results are lower than those obtained by Haslberger (Reference Haslberger2022) for RTI and complexity scores derived from EWCS waves 3 to 6, but close to those obtained by Feng and Graetz (Reference Feng and Graetz2020).
The regression results confirm the relationships between changes in occupation-specific employment shares and both indexes. Both coefficients are statistically significant for both periods, and the results are comparable, in terms of statistical significance of the RTI and complexity indexes, to Haslberger (Reference Haslberger2021). However, there are important differences. When it comes to changes in the employment structure, the complexity index has, as expected, a much stronger explanatory power than RTI. This finding aligns with the overall shape of the RTI curves, where attempts to utilise a polynomial model have not yielded a significant coefficient for a squared RTI term, as reported by Goos and Manning (Reference Goos and Manning2007). However, for univariate models, the RTI coefficients have, with one exception, higher values than those reported for the complexity indexes Table 1.
Table 1. Tasks and employment demand table
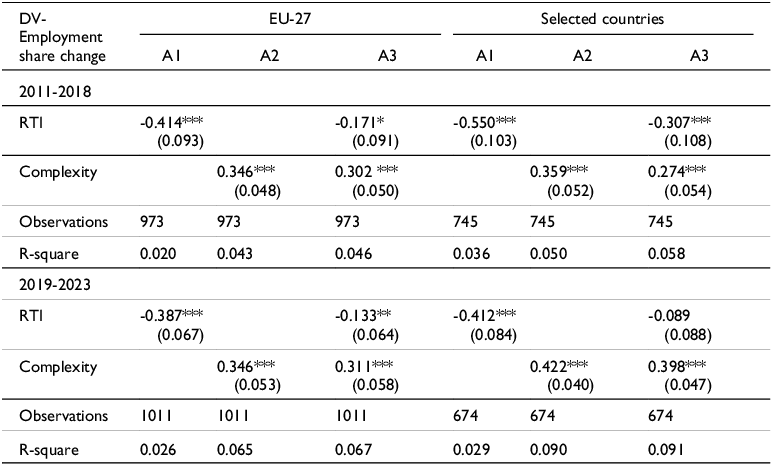
All point estimates (and standard errors in parentheses) are multiplied by 100. *** p < 0.01, ** p < 0.05, * p < 0.1
Source: Authors’ calculations.
Unsurprisingly, the complexity index appears to have a stronger explanatory power in the last period than in the first, confirming the stronger upgrading trends observed for most countries. The results are similar when the analysis is restricted to countries that show either clear polarisation or upgrading. One notable result is that the coefficient of the RTI index is not significant in the multivariate model, but is significant in the univariate model.
Conclusion
The study argues that polarisation and upgrading, as broad descriptors of structural change, are not opposites but rather, to varying degrees, both can simultaneously describe the evolution of occupational structure. Understanding that, with the exception of particular national cases, both trends are shaping the current evolution of occupational structure is of paramount importance in exploring current and future developments, which is essential for informed policymaking, with potential applications in modelling labour market trends and occupational outlook projections.
The empirical evidence provides important insights into structural labour market changes over the last 12 years. Occupational upgrading turns out to be the most prevalent trend in the EU-27 countries, while cases of polarisation found in Goos et al (Reference Goos, Manning and Salomons2009) or Autor (2015), for example, are rather exceptional, especially for the analysis period 2019–2023.
However, despite the predominant upgrading trends observed, polarisation seems to persist, especially when analytical measures are employed. This indicates that, except in cases where the JPI index is negative or close to 0, the share of medium-skilled workers is in most cases declining. This situation is more often consistent with a dominant upgrading situation where low-skill workers usually experience marginal declines, much lower than for middle-skill jobs, with the highest job growth being committed to high-skill occupations. Thus, the results indicate that, despite the fact that the myth of a pervasive, ‘unambiguous’ polarisation does not hold (Oesch and Picitto 2019) polarisation remains a valid explanatory framework for changes in the occupational structure, with its strongly unbalanced nature shifting towards high-skill occupations. This reaffirms the validity of both the SBTC, as a simpler framework, and the RBTC as a more complex one, while calling for a more rigorous use of the existing theoretical frameworks to disentangle the two trends, both of which, to varying degrees, shape, the evolution of national occupational structures.
The RTI and complexity indexes, as explanatory factors which correspond to a good extent to the RBTC and SBTC explanations of structural change, also provide additional insights. The RTI structure for all countries indicates that polarisation remains an explanation for changes in the occupational structure, albeit with a shape that leans towards stronger upgrading patterns for most of the wage schedule. This is reinforced by the unambiguous results from the complexity index, the content of which reflects the need for an increasingly diverse range of skills and corresponds to increased education and training requirements.
Furthermore, the correlation between the two indexes also provides valuable insights, showing that they are increasingly different from similar measures computed for previous periods. This may point to developments consistent with findings not only of Autor (2015), who asserts that the skill content of jobs may evolve in the future so that their routine and non-routine components may actually change, leading to different outcomes than those observed in the past, but also from Sebastian (Reference Sebastian2018) who shows that middle-skill workers tend to migrate to both low-skill and high-skill tiers.
The limitations of our analysis are related to the specificities of national labour markets, which can only be captured to a certain extent. Due to the need to use an analytical framework applicable to all EU-27 countries, some country-specific developments and data issues are likely to need more in-depth scrutiny. In addition, data quality issues and the impact of COVID-19 have affected our analytical approach due to their unique situation and their potential to lead to biased conclusions. Despite this, the analysis has presented, for the first time, the main developments and diversity observed for all EU-27 national labour markets. This provides a starting point for assessing both their similarities and perceived differences, for better and more informed policymaking aimed at monitoring and correcting adverse labour market trends that may negatively impact national economies in the present and near future.
Another important limitation pertains to the ability of existing theories and empirical tools used in the labour economics literature to explain how the occupational structure changes under the influence of technology. However, addressing this limitation of the labour economics literature from an empirical perspective, with input from the sociological literature and with an improved understanding of the empirical results obtained for analysis sub-periods, will lead to unbiased assessments of occupational change, and the way in which both upgrading and polarisation shape these changes, to different degrees, for different time periods. This would provide a more useful guide for public policymaking and career orientation decisions taken at a higher/strategic level, with a better focus on the low-skill occupations, whose evolution is not fully compatible with either the SBTC or RBTC frameworks, and a better monitoring of how middle-skill jobs job losses are absorbed by the other skill categories.
Supplementary material
The supplementary material for this article can be found at https://doi.org/10.1017/elr.2025.12
Data availability statement
The data that support the findings of this study are available from Eurostat and Eurofound. Employment data are publicly available at https://doi.org/10.2908/LFSA_EGAI2D. Restrictions apply to the availability of Eurofound and Eurostat SES wage data, which were used under licence for this study.
Acknowledgments
We are grateful for the help of Mattias Haslberger and of Mr. Denis Leythienne from Eurostat Unit F.3 ‘Labour market and lifelong learning’, and for the valuable suggestions from ELRR’s two anonymous reviewers.
Funding statement
Daniela Manea and Dorel Paraschiv acknowledge partial financial support for this paper through the project ‘AI for Energy Finance (AI4EFin)’, CF162/15.11.2022, contract number 760048/23.05.2023, financed under the Romania’s National Recovery and Resilience Plan, Apel nr. PNRR-III-C9-2022-I8.


 Open access