

5.1 Introduction
The geographic structure of the European automotive industry has been described in the form of hierarchical core–periphery relationships based on the position of countries and regions in the spatial division of labor (Reference LungLayan and Lung, 2004; Reference Frigant and LayanFrigant and Layan, 2009; Reference Lampón, Lago-Peñas and CabanelasLampón et al., 2016). In addition to the core and periphery, it usually includes an “intermediate” or “pericentral” spatial zone (Reference JonesJones, 1993; Reference Bordenave and LungBordenave and Lung, 1996; Reference LungLung, 2004), which is often labeled as the semiperiphery (Reference Hopkins and WallersteinHopkins and Wallerstein, 1977; Reference Arrighi and DrangelArrighi and Drangel, 1986; Reference MartinMartin, 1990; Reference Hudson and SchampHudson and Schamp, 1995b; Reference Mordue and SweeneyMordue and Sweeney, 2020). Core–semiperiphery–periphery structures are networks of relations (Reference Borgatti and EverettBorgatti and Everett, 1999) that link integrated production processes structured in GVCs and GPNs (Reference Hopkins and WallersteinHopkins and Wallerstein, 1977; Reference Arrighi and DrangelArrighi and Drangel, 1986). Core and peripheral areas are integrated in spatial systems at different geographic scales through authority–dependency relationships, in which cores dominate peripheries (Reference FriedmannFriedmann, 1967), often through external control in the case of the automotive industry (Reference JacobsJacobs, 2017; Reference Jacobs2019; Reference PavlínekPavlínek, 2017a).
In the European automotive industry, core regions have been distinguished by large and affluent markets, the presence of strategic functions, especially R&D, management (decision-making) and marketing, and complex activities based on highly skilled labor, such as the assembly of high-end models and components requiring complex knowledge. Peripheral regions have been distinguished by smaller and less affluent markets, export-oriented assembly of inexpensive mass-market models and simple components, weak presence of strategic functions (Reference Bordenave and LungBordenave and Lung, 1996; Reference LungLung, 2004), risky low-volume export-oriented production of special models, and by experimenting with new organizational innovations (Reference Hudson and SchampHudson and Schamp, 1995b; Reference LayanLayan, 2006). As shown in Chapter 3, additional indicators that help distinguish the core, semiperiphery and periphery of the contemporary core-based automotive industry transnational macro-regional production networks include the degree of foreign ownership and control, the structure of automotive FDI, the presence of domestic global assembly firms, the number of domestic suppliers in the global top 100, the capabilities of domestic suppliers, labor costs and wage-adjusted labor productivity (Table 3.1 in Chapter 3).
There have been disagreements about the relative position of individual countries in the core–periphery structure of the European automotive industry. For example, some authors consider Eastern Europe to be part of the periphery of the European automotive industry (Reference LungLung, 2004; Reference PavlínekPavlínek, 2018; Reference Pavlínek2020), while others have argued that the most advanced Eastern European countries, such as Poland and Czechia, have become part of the semiperiphery (e.g., Reference Layan and LungLayan and Lung, 2007; Reference Domański, Guzik, Gwosdz, Medina, Carrillo and González MarínDomański et al., 2014). There are similar ambiguities about the relative positions of other countries, such as Spain (Reference Layan, Humphrey, Lecler and SalernoLayan, 2000; Reference Layan and LungLayan and Lung, 2007; Reference Lampón, Lago-Peñas and CabanelasLampón et al., 2016; Reference Frigant and ZumpeFrigant and Zumpe, 2017). These differences stem from different criteria and time periods used to evaluate the relative positions of countries in the European automotive industry.
These studies, however, usually fail to provide empirical evidence that would support the existence of this spatial hierarchy in the European automotive industry (for an exception, see, e.g., Reference JonesJones, 1993), determine the position of individual European countries in this hierarchy and in the transnational division of labor, and allow for the analysis of changes in the position of individual countries in this hierarchy over time. This chapter aims to fill this gap theoretically by drawing on Friedmann’s core–periphery model and Harvey’s theory of the spatiotemporal fix and uneven development in the context of GVC and GPN perspectives in order to explain the geographic expansion of the automotive industry production networks into peripheral areas. In particular, it builds on the GVC and GPN perspectives and spatial divisions of labor in spatial systems to evaluate the relative position of countries in transnationally organized production networks and the integrated spatial system of the European automotive industry. It also addresses this gap by developing a methodology that allows for empirical evaluation of the position of countries in the European production network in the automotive industry and its changes over time. It is based on mutual trade flows with automotive industry products among individual countries (Reference MahutgaMahutga, 2014), the power distribution and control through the degree of foreign ownership and control over production (Reference PavlínekPavlínek, 2018) and the innovation activity in the automotive industry. The specific goal of this chapter is to investigate the position of individual countries in the European automotive industry production system based on what I call automotive industry power, to empirically determine their position in the core, semiperiphery and periphery, and to analyze the changes in their position during the 2003–2017 period, which was selected because of data availability. Despite the spatial restructuring of the European automotive industry since 1990 (e.g., Reference LungLung, 2004; Reference Brincks, Klier and RubensteinBrincks et al., 2016; Reference PavlínekPavlínek, 2020), the empirical analysis has revealed a stable core–semiperiphery–periphery structure during the 2003–2017 period.
The chapter is organized as follows. First, I start with a conceptual explanation of the division of labor in transnational production networks in the automotive industry. Second, I propose a methodology for delimiting the core, semiperiphery and periphery of the European automotive industry, which is based on the combination of trade-based positional power, ownership power and innovation power of European countries. Third, I present the results of the empirical analysis for the 2003–2017 period. Fourth, I summarize the main findings in the conclusion.
5.2 Global Value Chains, Global Production Networks and the Dynamic Geography of Transnational Production Networks
The dependency and world-systems approaches have employed the concepts of the core and periphery in order to conceptualize development and economic relations since the beginning of states and the system of states (Reference WallersteinWallerstein, 1974; Reference Chase-Dunn and HallChase-Dunn and Hall, 1991; Reference Chase-Dunn and Hall1997; Reference Chew and LauderdaleChew and Lauderdale, 2010). The world-systems perspective has also introduced the concept of commodity chains (Reference Hopkins and WallersteinHopkins and Wallerstein, 1977; Reference Hopkins and Wallerstein1986; Reference Arrighi and DrangelArrighi and Drangel, 1986), which was popularized by Reference Gereffi and KorzeniewiczGereffi and Korzeniewicz (1994) and evolved into the global commodity chains and, later, the GVC approaches (e.g., Reference GereffiGereffi, 2018; Reference Kano, Tsang and YeungKano et al., 2020). The global commodity chains and GVC approaches broke away from the world-systems perspective by shifting focus away from states to industries. They emphasized three fundamental features of transnationally organized industries in order to explain how industries and places evolve over time: the geography of value chains, including the geographic distribution of value-adding activities; the power distribution among firms and other actors in the chain with emphasis on the power and role of lead firms, particularly transnational corporations; and the role of institutions in influencing and structuring the operation of industries in different regions and at multiple geographic scales, with a particular emphasis on the role of the state and regional development strategies (e.g., Reference Sturgeon, Van Biesebroeck and GereffiSturgeon et al., 2008; Reference GereffiGereffi, 2018). The global commodity chains and GVC approaches have also emphasized the importance of the integration of peripheries into the commodity or value chains of larger transnationally integrated systems and how it affects their chances for successful economic development (Reference GereffiGereffi, 2018).
The GPN approach shares with the GVC approach the focus on the integration of places, regions and countries via trade and FDI into transnationally organized production networks and how it affects their potential for development. It is particularly concerned with how and where the processes of value creation, enhancement and capture take place in GPNs and how their uneven distribution affects economic development (Reference Coe, Hess, Yeung, Dicken and HendersonCoe et al., 2004; Reference YeungCoe and Yeung, 2015; Reference Coe and Yeung2019). The GPN approach recognizes different modes of articulation or strategic couplings (namely indigenous, functional and structural) of regions into transnational production networks, which reflect different regional assets of regions in the core, periphery and semiperiphery of the world economy that are being sought by TNCs. It also recognizes the unfavorable position of peripheral regions integrated in GPNs via structural couplings that might ultimately reiterate their peripheral status in the international division of labor (Reference YeungYeung, 2009; Reference Yeung2015; Reference Yeung2016; Reference YeungCoe and Yeung, 2015; Reference MacKinnonMacKinnon, 2012) (Table 5.1).
| Global value chains | Global production networks | Spatial divisions of labor | |
|---|---|---|---|
| Focus | Transnational organization and control over the automotive industry, governance | Transnational organization of production networks, different modes of strategic couplings of regions and places into these networks | Territorial division of tasks between core and peripheral regions |
| Main vehicle of development | Different forms of upgrading, the ultimate goal is shifting from lower-value-added activities to higher-value-added activities in the value chain | Strategic coupling between extra regional actors (TNCs) and regional assets, value creation, enhancement and capture | Regional specialization and competitiveness based on the uneven distribution of factors of production (e.g., regional innovation systems in core regions, FDI in peripheral regions) |
| Driving actors of development | TNCs, various institutions, especially the state | TNCs, states, local firms, regional and local institutions, labor | TNCs, states (e.g., via facilitating FDI in peripheral regions), regional institutions |
| Examples of publications | Reference Sturgeon, Van Biesebroeck and GereffiSturgeon et al. (2008); Reference Sturgeon and Van BiesebroeckSturgeon and Van Biesebroeck (2011); Reference Contreras, Carrillo and AlonsoContreras et al. (2012); Reference Rodríguez-De La Fuente and LampónRodríguez-De La Fuente and Lampón (2020) | Reference Coe, Hess, Yeung, Dicken and HendersonCoe et al. (2004); Reference YeungCoe and Yeung (2015); Reference PavlínekPavlínek (2018); Reference Pavlínek and ŽenkaPavlínek and Ženka (2016) | Reference Brincks, Domański, Klier and RubensteinBrincks et al. (2018); Reference Mordue and SweeneyMordue and Sweeney (2020); Reference PavlínekPavlínek (2020); Reference Trippl, Baumgartinger-Seiringer, Goracinova and WolfeTrippl et al. (2021) |
Both GPN and GVC approaches have argued, however, that the relative position of host country firms and regions in the international division of labor can be improved through upgrading (e.g., Reference Rodríguez-De La Fuente and LampónRodríguez-De La Fuente and Lampón, 2020), which is defined as the movement of countries, regions, firms and workers from low- to high-value-added activities (Reference Gereffi, Smelser and SwedbergGereffi, 2005). The notion of industrial upgrading has evolved from that of a one-directional process (e.g., Reference GereffiGereffi, 1999) to a more nuanced understanding of different upgrading and downgrading trajectories (Reference YeungCoe and Yeung, 2015; Reference BlažekBlažek, 2016), which recognizes both the potentially positive and potentially negative long-term effects of integration of firms and regions into GPNs.
Approaches related to divisions of labor in spatial systems distinguish the core, semiperiphery and periphery by different functions that receive different economic rewards (Reference Hopkins and WallersteinHopkins and Wallerstein, 1977). Consequently, relative positions of countries in spatial systems have implications for their value creation and capture in particular economic activities that, in turn, influence their long-term effects for economic development (see Chapter 6). It has long been recognized in both economic geography and economics that higher-value-added, knowledge-intensive and decision-making activities and control functions tend to concentrate in core regions, while lower-value-added routine production functions tend to concentrate in peripheral regions (e.g., Reference Hymer and BhagwatiHymer, 1972; Reference DickenDicken, 2015).
The core-like processes in the automotive industry include: (1) dominant trade relations with noncore countries, which is reflected in the high aggregate positional power of resident firms in the automotive industry; (2) ownership and control power in the form of direct ownership and control by core-based TNCs over production facilities and processes in noncore countries, resulting in the dominance effect and the transfer of value from the periphery to the core; and (3) a high rate of innovation in the automotive industry. The peripheral processes include: (1) dependent trade relations with core countries, which is reflected in the low aggregate positional power of resident firms in the automotive industry; (2) a high degree of foreign control of the automotive industry via the core by core-based TNCs, resulting in a net transfer of value to the core; and (3) a low rate of innovation in the automotive industry compared to the core. Semiperipheral regions are zones with a mixture of core and peripheral processes, in which neither core nor peripheral processes dominate. They are positioned in-between the core and periphery by housing both peripheral processes in relation to the core and core-like processes in relation to the periphery in the core–periphery structure (Reference Hopkins and WallersteinHopkins and Wallerstein, 1977).
The dominant position of core areas is the outcome of their earlier innovations that allowed core-based institutions, such as TNCs, to penetrate and control the periphery (Reference FriedmannFriedmann, 1967). The innovation tends to gradually and selectively spread from the core to the periphery, although core regions continue to have higher rates of innovation because of more favorable conditions for innovative activities. These include the already existing highly localized concentrations of knowledge and innovation, strong institutional support and favorable governmental policies, high corporate and public spending on innovation, educated and skilled labor, diversified economy, high-quality technological infrastructure and agglomerations of firms in related industries (Reference Tödtling and TripplTödtling and Trippl, 2005; Reference Isaksen and TripplIsaksen and Trippl, 2017). The control of peripheries by core-based institutions leads to a net transfer of value from peripheries to the core that economically strengthens the core and weakens the periphery in the long run (Reference FriedmannFriedmann, 1967; Reference Dischinger, Knoll and RiedelDischinger et al., 2014a; Reference Pavlínek and ŽenkaPavlínek and Ženka, 2016). It is in this context that I investigate the core–periphery structure of the European automotive industry.
5.2.1 The Integration of New Peripheries into Transnational Production Networks
Transnational production networks in the automotive industry are integrated through investment and trade flows with automotive industry commodities: raw materials, parts, components, preassembled modules, semi-finished and finished vehicles, flows of capital in the form of FDI, dividends and the transfer of profits, flows of labor and personnel, and flows of information, know-how and knowledge that allow for a fine-grained division of labor and increased regional specialization. The spatial dynamism of transnational production networks in the contemporary automotive industry is based on the investment strategies of core-based firms that are constantly looking for investment opportunities in peripheral areas in order to improve or maintain the rate of profit by lowering production costs, which are the total cost of production and delivering finished products to the market (Reference PavlínekPavlínek, 2018; Reference Pavlínek2020).
The transnational integration in the automotive industry has been extensively analyzed generally (e.g., Reference Carrillo, Lung and van TulderCarrillo et al., 2004) and in the context of the European automotive industry since the early 1990s (e.g., Reference JonesJones, 1993; Reference Freyssenet, Shimizu and VolpatoFreyssenet et al., 2003b). Chapters 3 and 4 of this book conceptualize the geographic expansion of automotive industry production networks into new geographic areas and the contemporaneous restructuring in the existing production regions by drawing on Harvey’s theory of uneven development and spatiotemporal fix (Reference HarveyHarvey, 1982; Reference Harvey2005b), which emphasizes the investment strategies of core-based automotive firms in peripheral lower-production-cost regions. Although core-based automotive firms use various strategies to ensure profitability (Reference Boyer and FreyssenetBoyer and Freyssenet, 2002), they always strive to minimize production costs by controlling the cost of factors of production. Firms can more easily control labor costs than the costs of other factors of production (Reference DickenDicken, 2015) through technological and organization innovations and through the location of production into areas with labor surplus and low labor costs (Reference HarveyHarvey, 1982). A sharp decrease in transportation costs by more than 90 percent in the twentieth century (Reference Glaeser and KohlhaseGlaeser and Kohlhase, 2004), because of new transportation technologies (Reference LevinsonLevinson, 2006) and logistical systems (Reference Kaneko and NojiriKaneko and Nojiri, 2008; Reference DanylukDanyluk, 2018), along with the lowering of trade barriers and deregulation of FDI, made it easier for firms to establish production in low-cost areas at the international scale. The potential for higher profits in such areas has been further enhanced by government policies of investment incentives, low corporate taxes and financing the construction of modern infrastructure that lower set-up sunk costs for investing firms and, therefore, lower their investment risk (Reference Clark and WrigleyClark and Wrigley, 1995; Reference JacobsJacobs, 2019; Reference PavlínekPavlínek, 2016; Reference Pavlínek2020).
Chapters 3 and 4 of this book demonstrate how both assembly firms and component suppliers are attracted to lower-cost peripheral locations by the potential of a higher rate of profit. However, along with Reference HarveyHarvey (1982), I have argued that spatiotemporal fixes in the form of the establishment of production in new low-cost areas are only a temporary solution to declining profitability. As more and more firms are exploiting a spatiotemporal fix by establishing production in the same or similar peripheral regions, an increased demand for labor exhausts labor surplus, leading to rising wages that undermine the rate of profit and future growth. Rising production costs and declining profits eventually force firms that are most dependent on low labor costs to look for new production areas with labor surplus and lower wages, which often leads to relocations of the most labor-intensive activities, such as the assembly of cable harnesses, from the existing integrated peripheral regions to previously unintegrated peripheries (e.g., Reference Aláez-Aller and Barneto-CarmonaAláez-Aller and Barneto-Carmona, 2008; Reference Lampón, Lago-Peñas and González-BenitoLampón et al., 2015; Reference Lampón, Lago-Peñas and Cabanelas2016; Reference PavlínekPavlínek, 2015a). These new peripheral areas thus become competitive in attracting new investments of core-based firms especially in labor-intensive and routine production compared to the more expensive core or existing integrated peripheries (e.g., Reference Frigant and LayanFrigant and Layan, 2009). The influx of profit-seeking investment capital into areas with a potential for a higher rate of profit results in economic growth in new low-cost peripheral regions. The outcome of this spatial investment behavior is the geographic expansion of production into new areas that are integrated into a transnational production network through capital, commodity, trade and technology linkages (hence the integrated peripheries), along with the economic growth bouncing from region to region (Reference HarveyHarvey, 1982).
These processes can be demonstrated in the European automotive industry, where, as argued in Chapter 4 of this book, the geographic expansion of the automotive industry into peripheral regions and the development of transnational production networks have been strongly related to state development policies (Reference WardWard, 1982; Reference OberhauserOberhauser, 1987; Reference PavlínekPavlínek, 2016), regional integration, the establishment and expansion of the common market in the European Union and regional free-trade agreements with non-European Union countries (Reference Hudson and SchampHudson and Schamp, 1995b; Reference LungLayan and Lung, 2004; Reference JacobsJacobs, 2019). Since the early 1960s, carmakers have actively lobbied for the geographic expansion of European regional integration that would give them opportunities to establish production in low-cost areas (Reference Layan, Humphrey, Lecler and SalernoLayan, 2000; Reference LungFreyssenet and Lung, 2004). This has led to the geographic expansion of the automotive industry from its established centers into new areas since the 1960s, as documented in Chapter 4 of this book.
5.2.2 Restructuring in Core Areas
The growth of production in newly integrated peripheries impacts the existing locations within a transnational production network. The automotive industry in core areas continues to be favored by several crucial factors that make it attractive for additional investment, including large internal and external scale economies, high accumulated and exit sunk costs, an accessibility to large markets, low transportation costs, high-quality labor force, the proximity of R&D facilities, highly developed infrastructure and high-quality institutions (Reference Bordenave and LungBordenave and Lung, 1996; Reference Clark and WrigleyClark and Wrigley, 1997; Reference Carrincazeaux, Lung and RalletCarrincazeaux et al., 2001; Reference Frigant and LungFrigant and Lung, 2002). Core areas might benefit from the expansion of production in integrated peripheries because the finer division of labor and increased regional specialization within the transnational production network increase the specialization of core regions in capital-intensive production, skill-intensive, high-value-added activities and strategic functions. At the same time, the high-volume assembly of small cars with weaker engines and labor-intensive production of generic components can be gradually relocated to the integrated periphery because of lower production costs and labor surplus (Reference JonesJones, 1993; Reference PavlínekPavlínek, 2002d; Reference Pavlínek2020; Reference LayanLayan, 2006; Reference Frigant and LayanFrigant and Layan, 2009; Reference Jürgens and KrzywdzinskiJürgens and Krzywdzinski, 2009a). German automotive firms led by Volkswagen have been particularly successful in such complementary specialization by setting uplow-cost production of small cars and/or low-volume production of special models in Spain since the late 1980s (Reference JacobsJacobs, 2019), and Portugal (Reference Ferrão, Vale, Hudson and SchampFerrão and Vale, 1995) and Eastern Europe (Reference PavlínekPavlínek, 2002d) since the early 1990s. It resulted in the more efficient territorial division of labor in automotive GPNs and, consequently, in improved competitiveness and higher corporate profits (Reference ChiappiniChiappini, 2012).
At the same time, existing core locations and older integrated peripheries, such as Belgium and Spain, may experience declining production and job loss due to the expansion of production in new integrated peripheries, especially in labor-intensive, low-value-added and less profitable production of generic components that does not require proximity to other firms. In extreme cases, this restructuring may lead to factory closures and relocations of production, especially of automotive components (Reference Frigant and LayanFrigant and Layan, 2009; Reference Lampón, Lago-Peñas and González-BenitoLampón et al., 2015; Reference JacobsJacobs, 2019; Reference PavlínekPavlínek, 2020). As we can see in Chapter 4 of this book, in Western Europe, between 2005 and 2016, large restructuring events, resulting in the creation or loss of at least 100 jobs or 10 percent or more of the labor force in automotive industry firms or factories employing at least 250 workers, led to 181 factory closures, 50 relocations and 35 partial relocations. Additionally, 529 firms experienced rationalization and job cuts, leading to 387,000 job losses altogether. At the same time, 133,000 jobs were created, resulting in the overall loss of 254,000 jobs. Some labor-intensive activities that for various reasons cannot be relocated continue to persist in core areas. In those cases, labor surplus can be imported from abroad and immigrant labor has been used for the expansion of existing plants in Western Europe for decades (Reference WardWard, 1982).
Overall, therefore, the integration of peripheral regions into transnational automotive industry GPNs triggers restructuring in core regions, semiperipheries and older integrated peripheries that results in a finer division of labor and greater regional specialization. As we can see, this continuous process of change has underlined the dynamic geography of the European automotive industry since the early 1960s. Based on the conceptual discussion, I will next explain a methodology that I will use to delimit the spatial hierarchy of the European automotive industry, before presenting empirical results of the analysis.
5.3 Delimiting the Core, Periphery and Semiperiphery of the European Automotive Industry
The national economies of European Union member countries are the basic unit of analysis for two reasons. First, the methodology has specifically been developed to evaluate the relative positions of individual countries in the transnational macro-regional (European) production system. Second, the necessary automotive industry data for the conducted analysis are only available for national economies from Eurostat since 2003. These data are unavailable for subnational units.
The starting point of my analysis is Reference MahutgaMahutga’s (2014) measurement of the positional power of countries in GPNs as the aggregate positional power of country firms in a particular industry based on bilateral national trade data. I apply this approach in the automotive industry of European Union countries by using data extracted from Eurostat’s ComExt database for the 2003–2017 period. However, following Reference FriedmannFriedmann (1967), I argue that trade relations alone and trade-based measures, such as the value and volume of exports, are insufficient for determining the relative position of countries in transnational production systems. We also need to consider the decision-making power and the strength of innovation activities in the automotive industry. Therefore, I normalize the positional power of countries in the automotive industry by the indices of the degree of foreign control and innovation into an aggregate index, which I call the automotive industry power. I then use a cluster analysis of automotive industry power to determine the relative position of European Union countries in the European automotive industry production network between 2003 and 2017.
5.3.1 Positional Power
The positional power of countries estimates the average network position of firms in its territory (Reference MahutgaMahutga, 2014). It focuses on power asymmetries within GVCs/GPNs and considers the uneven economic power position of individual countries in transnational production networks based on international trade. The positional power of countries is calculated from national trade data in a particular industry. In the case of the automotive industry, we can measure country’s j’s producer driven power (
 ) as follows.
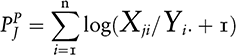
where Xji is the value of automotive industry exports from country j to country i, Yi is the total value of imports of the receiving country i and log is the base 10 logarithm. Country j has a high producer-driven power when it captures a large share of markets in many other countries through its exports, that is, these other countries depend on imports from country j. It has a low producer-driven power when it has a small number of such trade partners (countries).
Since the producer driven power is only based on exports, it ignores the buyer-driven power of large assembly firms and global tier-one suppliers in GPNs. It also underestimates the positional power of countries whose automotive industry is geared to large domestic markets rather than exports. Therefore, I have also calculated the buyer-driven power (
 ) of country j as follows (Reference MahutgaMahutga, 2014).
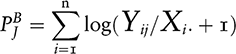
where Yij is the value of automotive industry imports imported by country j from country i, Xi is the total value of exports of the exporting country i and log is the base 10 logarithm. Country j has a high buyer-driven power when it has many trade partners (countries) from which it imports a high share of these countries’ total automotive industry exports, that is, these other countries depend on exports to country j. It has a low buyer-driven power when it has a small number of such trade partners.
The trade data were calculated for the product categories 870120–871690 of the HS6 product specification from the Eurostat ComExt database (Eurostat, 2020a). The positional power of a particular country in the automotive industry was then calculated as the average of its producer-driven and buyer-driven power for each year between 2003 and 2017 (Table 5.2). Since positional power does not measure the size of the automotive industry, countries with a larger output can have a smaller positional power than countries with a smaller output and vice versa.
| 2000 | 2001 | 2002 | 2003 | 2004 | 2005 | 2006 | 2007 | 2008 | 2009 | 2010 | 2011 | 2012 | 2013 | 2014 | 2015 | 2016 | 2017 | 2018 | |
|---|---|---|---|---|---|---|---|---|---|---|---|---|---|---|---|---|---|---|---|
| Austria | 0.358 | 0.355 | 0.349 | 0.360 | 0.352 | 0.304 | 0.300 | 0.291 | 0.307 | 0.314 | 0.327 | 0.312 | 0.314 | 0.301 | 0.279 | 0.298 | 0.307 | 0.297 | 0.279 |
| Belgium | 0.836 | 0.823 | 0.891 | 0.844 | 0.825 | 0.762 | 0.709 | 0.744 | 0.878 | 0.828 | 0.830 | 0.789 | 0.855 | 0.859 | 0.845 | 0.868 | 0.883 | 0.847 | 0.822 |
| Britain | 0.962 | 0.892 | 0.906 | 0.836 | 0.825 | 0.838 | 0.857 | 0.820 | 0.776 | 0.805 | 0.809 | 0.787 | 0.798 | 0.808 | 0.778 | 0.791 | 0.748 | 0.659 | 0.630 |
| Bulgaria | 0.014 | 0.011 | 0.013 | 0.015 | 0.014 | 0.017 | 0.022 | 0.137 | 0.119 | 0.063 | 0.053 | 0.052 | 0.050 | 0.067 | 0.058 | 0.064 | 0.076 | 0.083 | 0.074 |
| Croatia | 0.027 | 0.024 | 0.021 | 0.025 | 0.025 | 0.024 | 0.022 | 0.020 | 0.022 | 0.020 | 0.018 | 0.019 | 0.017 | 0.021 | 0.025 | 0.032 | 0.032 | 0.031 | 0.036 |
| Czechia | 0.148 | 0.145 | 0.142 | 0.131 | 0.220 | 0.269 | 0.296 | 0.309 | 0.321 | 0.391 | 0.413 | 0.411 | 0.415 | 0.413 | 0.458 | 0.444 | 0.438 | 0.467 | 0.469 |
| Denmark | 0.112 | 0.115 | 0.147 | 0.134 | 0.135 | 0.128 | 0.129 | 0.118 | 0.130 | 0.136 | 0.128 | 0.117 | 0.111 | 0.104 | 0.098 | 0.103 | 0.101 | 0.090 | 0.088 |
| Estonia | 0.045 | 0.049 | 0.055 | 0.065 | 0.121 | 0.146 | 0.162 | 0.152 | 0.120 | 0.097 | 0.093 | 0.112 | 0.136 | 0.158 | 0.124 | 0.098 | 0.102 | 0.100 | 0.106 |
| Finland | 0.232 | 0.214 | 0.201 | 0.194 | 0.180 | 0.178 | 0.152 | 0.136 | 0.140 | 0.138 | 0.127 | 0.126 | 0.124 | 0.118 | 0.125 | 0.119 | 0.118 | 0.119 | 0.120 |
| France | 1.204 | 1.123 | 1.134 | 1.105 | 1.141 | 1.108 | 1.002 | 0.948 | 0.959 | 1.036 | 1.077 | 1.036 | 1.018 | 0.987 | 0.912 | 0.870 | 0.870 | 0.902 | 0.933 |
| Germany | 2.568 | 2.568 | 2.655 | 2.735 | 2.838 | 2.841 | 2.805 | 2.704 | 2.706 | 2.777 | 2.838 | 2.835 | 2.841 | 2.812 | 2.861 | 2.904 | 2.899 | 2.862 | 2.716 |
| Greece | 0.050 | 0.046 | 0.044 | 0.050 | 0.054 | 0.049 | 0.048 | 0.058 | 0.056 | 0.055 | 0.036 | 0.022 | 0.020 | 0.022 | 0.024 | 0.023 | 0.030 | 0.033 | 0.037 |
| Hungary | 0.074 | 0.071 | 0.082 | 0.073 | 0.137 | 0.192 | 0.220 | 0.220 | 0.203 | 0.170 | 0.179 | 0.190 | 0.200 | 0.208 | 0.232 | 0.237 | 0.239 | 0.250 | 0.247 |
| Ireland | 0.036 | 0.032 | 0.031 | 0.026 | 0.029 | 0.030 | 0.031 | 0.030 | 0.025 | 0.013 | 0.015 | 0.014 | 0.016 | 0.018 | 0.022 | 0.026 | 0.026 | 0.025 | 0.026 |
| Italy | 0.705 | 0.690 | 0.658 | 0.678 | 0.686 | 0.661 | 0.662 | 0.681 | 0.698 | 0.631 | 0.616 | 0.589 | 0.550 | 0.535 | 0.524 | 0.538 | 0.555 | 0.546 | 0.551 |
| Latvia | 0.153 | 0.156 | 0.154 | 0.163 | 0.131 | 0.127 | 0.162 | 0.173 | 0.141 | 0.112 | 0.117 | 0.153 | 0.158 | 0.144 | 0.131 | 0.131 | 0.135 | 0.134 | 0.129 |
| Lithuania | 0.027 | 0.028 | 0.027 | 0.024 | 0.200 | 0.164 | 0.196 | 0.222 | 0.214 | 0.125 | 0.171 | 0.188 | 0.173 | 0.183 | 0.168 | 0.175 | 0.175 | 0.186 | 0.182 |
| Luxembourg | 0.013 | 0.014 | 0.012 | 0.018 | 0.018 | 0.017 | 0.018 | 0.020 | 0.023 | 0.023 | 0.021 | 0.019 | 0.021 | 0.021 | 0.021 | 0.018 | 0.019 | 0.023 | 0.023 |
| Netherlands | 0.374 | 0.331 | 0.334 | 0.332 | 0.329 | 0.308 | 0.315 | 0.343 | 0.359 | 0.326 | 0.362 | 0.395 | 0.370 | 0.370 | 0.349 | 0.361 | 0.355 | 0.433 | 0.442 |
| Poland | NA | NA | NA | NA | 0.238 | 0.252 | 0.284 | 0.298 | 0.362 | 0.394 | 0.398 | 0.380 | 0.402 | 0.426 | 0.420 | 0.438 | 0.436 | 0.478 | 0.499 |
| Portugal | 0.083 | 0.076 | 0.072 | 0.067 | 0.070 | 0.073 | 0.075 | 0.072 | 0.077 | 0.082 | 0.088 | 0.079 | 0.071 | 0.073 | 0.075 | 0.075 | 0.074 | 0.093 | 0.116 |
| Romania | 0.017 | 0.025 | 0.019 | 0.024 | 0.034 | 0.045 | 0.057 | 0.298 | 0.317 | 0.222 | 0.157 | 0.170 | 0.180 | 0.170 | 0.179 | 0.181 | 0.172 | 0.160 | 0.188 |
| Slovakia | NA | NA | NA | NA | 0.096 | 0.100 | 0.121 | 0.172 | 0.201 | 0.200 | 0.193 | 0.215 | 0.250 | 0.258 | 0.245 | 0.266 | 0.260 | 0.253 | 0.275 |
| Slovenia | 0.118 | 0.100 | 0.089 | 0.085 | 0.125 | 0.147 | 0.163 | 0.197 | 0.185 | 0.200 | 0.190 | 0.185 | 0.181 | 0.179 | 0.162 | 0.178 | 0.179 | 0.172 | 0.174 |
| Spain | 0.650 | 0.645 | 0.640 | 0.910 | 0.687 | 0.678 | 0.668 | 0.657 | 0.605 | 0.580 | 0.605 | 0.604 | 0.530 | 0.603 | 0.632 | 0.658 | 0.672 | 0.649 | 0.641 |
| Sweden | 0.436 | 0.388 | 0.364 | 0.404 | 0.418 | 0.399 | 0.429 | 0.413 | 0.397 | 0.347 | 0.409 | 0.430 | 0.409 | 0.408 | 0.390 | 0.384 | 0.383 | 0.366 | 0.359 |
5.3.2 Ownership and Control Power
Spatial systems based on the core–periphery structure are integrated through authority–dependency relationships, in which core areas dominate peripheral areas (Reference FriedmannFriedmann, 1967). Therefore, if we want to evaluate the power position of countries in such structures, we need to include a measure of power and control other than the one based on trade relations. We need to consider the uneven distribution of decision-making power among automotive industry firms, that is, who controls the industry and has the power to decide about the production and the distribution of its rewards. In other words, who controls who will produce what, where, for what price and how the benefits of production (e.g., profits) will be distributed within the GPN? These dominance and control relationships are very important proxies of the core and periphery position of countries (e.g., Reference FriedmannFriedmann, 1967; Reference LungLung, 2004; Reference FischerFischer, 2015).
Generally, core countries are those that control production in other countries through resident TNCs that directly own production facilities abroad in the case of the automotive industry. Indirectly, TNCs control production abroad also through setting the terms of trade with automotive products and through dominating captive local suppliers in peripheral regions (e.g., Reference Pavlínek and ŽížalováPavlínek and Žížalová, 2016; Reference PavlínekPavlínek, 2018). The decision-making power about the entire TNC and its GPN tends to be highly concentrated in the TNC headquarters in their home countries (e.g., Reference Pries, Wäcken, Covarrubias and Ramírez PerezPries and Wäcken, 2020).
Peripheral countries are those whose industry is predominantly controlled from abroad typically through the direct ownership of production facilities in the automotive industry by foreign TNCs. This capital dependency has strong implications for the strategic decision-making, technological, know-how and managerial dependency. Firm-level empirical evidence from the Eastern European automotive industry shows that the most important strategic decisions about foreign-owned factories are made by parent companies abroad in their TNC headquarters (Reference PavlínekPavlínek, 2016; Reference Pavlínek and ŽenkaPavlínek and Ženka, 2016).
Semiperipheral countries are positioned in-between; they control production in foreign (mostly peripheral) countries through TNCs based in semiperipheral countries and, at the same time, a significant share of their domestic industry is controlled through direct ownership from abroad, mostly from core countries. In Chapter 4 of this book, in terms of foreign ownership and control, I consider semiperipheral countries of the automotive industry as those that lack high-volume domestic assembly firms but have domestic “global suppliers” that invest in foreign countries (e.g., Britain, Canada, Sweden) (see also Reference Mordue and SweeneyMordue and Sweeney, 2020).
The positional power of countries has been therefore normalized by the index of foreign control (Reference PavlínekPavlínek, 2018), which calculates the relative importance of foreign-owned firms in the automotive industry in a given country. The index of foreign control has been calculated for each country and year between 2003 and 2017 as the average value of the share of foreign-controlled enterprises of five indicators in the manufacture of motor vehicles, trailers and semi-trailers (NACE 29 (2008–2017) and NACE 34 (2003–2007)) (Eurostat, 2020c): production value, value added at factor cost, gross investment in tangible goods, number of persons employed, and turnover or gross premiums written. A low degree of foreign control indicates a core position, while a high degree of foreign control indicates a periphery position in transnational production networks. The index of foreign control can vary between 0 and 1, with 1 indicating a total foreign control of the automotive industry and 0 indicating zero foreign control. The positional power of each country for each year was normalized by dividing it by the index of foreign control, which strengthened the relative position of countries with the low degree of foreign control of its automotive industry (e.g., Germany), while weakening it for countries with the high degree of foreign control (e.g., Slovakia).
5.3.3 Innovation Power
As discussed in the conceptual section of this chapter, the core areas of spatial systems are the prime zones of innovation activities while peripheral regions are typified by lower innovation activity (Reference FriedmannFriedmann, 1967; Reference LungLung, 2004; Reference Tödtling and TripplTödtling and Trippl, 2005; Reference Isaksen and TripplIsaksen and Trippl, 2017). In order to estimate the intensity of innovation activities in the automotive industry as a whole, the index of innovation was calculated from the share of total R&D personnel and researchers of persons employed and the share of business expenditure on R&D of the total value of production in the automotive industry (NACE 29 (2008–2017) and NACE 34 (2003–2007)) (Eurostat, 2020d). Both measures were normalized for each country and year using the following method. A country with the highest value was set to 1 and the values of all other countries were calculated in proportion to the strongest country. Therefore, the values for all countries and both variables fall between 0 and 1. In the next step, I calculated the average of these two normalized measures for each country and a particular year, which I call the index of innovation. The index of innovation thus measures the relative importance of innovation activities in the automotive industry of a given country. Next, I used the index of innovation to further normalize the positional power to arrive at the automotive industry power through multiplying the index of foreign control normalized positional power by the index of innovation, which lowers the index of foreign control normalized positional power by a greater degree for countries with a weak index of innovation than for countries with a strong index of innovation (Table 5.3).
Table 5.3 Values of automotive industry power in the European automotive industry by country, 2003–2017
| 2003 | 2004 | 2005 | 2006 | 2007 | 2008 | 2009 | 2010 | 2011 | 2012 | 2013 | 2014 | 2015 | 2016 | 2017 | |
|---|---|---|---|---|---|---|---|---|---|---|---|---|---|---|---|
| Austria | 0.255 | 0.234 | 0.172 | 0.195 | 0.279 | 0.284 | 0.263 | 0.279 | 0.267 | 0.250 | 0.236 | 0.222 | 0.251 | 0.249 | 0.236 |
| Belgium | 0.078 | 0.115 | 0.099 | 0.091 | 0.106 | 0.145 | 0.138 | 0.139 | 0.150 | 0.186 | 0.198 | 0.188 | 0.229 | 0.228 | 0.226 |
| Britain | 0.302 | 0.358 | 0.396 | 0.464 | 0.547 | 0.490 | 0.489 | 0.490 | 0.580 | 0.554 | 0.546 | 0.561 | 0.641 | 0.578 | 0.492 |
| Bulgaria | 0.000 | 0.000 | 0.000 | 0.000 | 0.000 | 0.000 | 0.000 | 0.000 | 0.000 | 0.000 | 0.000 | 0.000 | 0.005 | 0.005 | 0.004 |
| Czechia | 0.031 | 0.060 | 0.076 | 0.080 | 0.093 | 0.066 | 0.062 | 0.062 | 0.065 | 0.069 | 0.070 | 0.073 | 0.070 | 0.062 | 0.071 |
| Denmark | 0.032 | 0.046 | 0.042 | 0.045 | 0.017 | 0.049 | 0.104 | 0.073 | 0.103 | 0.098 | 0.118 | 0.052 | 0.054 | 0.063 | 0.053 |
| Estonia | 0.027 | 0.030 | 0.033 | 0.048 | 0.060 | 0.016 | 0.014 | 0.011 | 0.016 | 0.019 | 0.012 | 0.012 | 0.012 | 0.023 | 0.013 |
| Finland | 0.168 | 0.193 | 0.158 | 0.170 | 0.162 | 0.140 | 0.148 | 0.136 | 0.117 | 0.095 | 0.095 | 0.095 | 0.144 | 0.149 | 0.130 |
| France | 2.391 | 3.152 | 2.315 | 2.099 | 1.614 | 2.762 | 2.955 | 2.510 | 2.560 | 1.991 | 1.694 | 1.700 | 1.689 | 1.582 | 1.386 |
| Germany | 13.427 | 17.059 | 16.541 | 17.344 | 17.971 | 18.230 | 15.717 | 16.916 | 19.924 | 17.091 | 15.592 | 16.150 | 18.448 | 16.857 | 18.536 |
| Hungary | 0.006 | 0.009 | 0.014 | 0.016 | 0.028 | 0.026 | 0.021 | 0.023 | 0.027 | 0.029 | 0.030 | 0.031 | 0.032 | 0.032 | 0.036 |
| Ireland | 0.007 | 0.005 | 0.005 | 0.005 | 0.005 | 0.006 | 0.002 | 0.002 | 0.005 | 0.006 | 0.004 | 0.004 | 0.003 | 0.006 | 0.008 |
| Italy | 0.943 | 1.207 | 1.146 | 1.261 | 1.563 | 1.614 | 1.439 | 1.438 | 1.514 | 1.344 | 1.502 | 1.458 | 1.454 | 1.484 | 1.255 |
| Latvia | 0.008 | 0.012 | 0.010 | 0.016 | 0.032 | 0.021 | 0.023 | 0.020 | 0.011 | 0.012 | 0.018 | 0.015 | 0.023 | 0.019 | 0.016 |
| Lithuania | 0.001 | 0.060 | 0.004 | 0.008 | 0.061 | 0.043 | 0.038 | 0.045 | 0.066 | 0.050 | 0.063 | 0.041 | 0.043 | 0.031 | 0.028 |
| Netherlands | 0.151 | 0.215 | 0.180 | 0.178 | 0.199 | 0.156 | 0.152 | 0.176 | 0.299 | 0.275 | 0.316 | 0.313 | 0.295 | 0.269 | 0.322 |
| Poland | 0.009 | 0.015 | 0.018 | 0.020 | 0.020 | 0.025 | 0.018 | 0.013 | 0.021 | 0.033 | 0.047 | 0.051 | 0.058 | 0.061 | 0.075 |
| Portugal | 0.006 | 0.006 | 0.003 | 0.014 | 0.027 | 0.041 | 0.027 | 0.024 | 0.022 | 0.014 | 0.014 | 0.018 | 0.018 | 0.016 | 0.018 |
| Romania | 0.007 | 0.008 | 0.011 | 0.010 | 0.064 | 0.042 | 0.019 | 0.013 | 0.013 | 0.012 | 0.009 | 0.017 | 0.020 | 0.018 | 0.016 |
| Slovakia | 0.003 | 0.003 | 0.004 | 0.004 | 0.005 | 0.005 | 0.005 | 0.006 | 0.006 | 0.007 | 0.012 | 0.018 | 0.017 | 0.021 | 0.021 |
| Slovenia | 0.013 | 0.018 | 0.020 | 0.032 | 0.043 | 0.103 | 0.080 | 0.087 | 0.128 | 0.130 | 0.096 | 0.077 | 0.075 | 0.078 | 0.050 |
| Spain | 0.130 | 0.149 | 0.136 | 0.140 | 0.149 | 0.140 | 0.192 | 0.167 | 0.165 | 0.136 | 0.137 | 0.178 | 0.150 | 0.162 | 0.149 |
| Sweden | 0.714 | 0.808 | 0.767 | 0.724 | 0.792 | 0.851 | 0.738 | 0.684 | 0.708 | 0.729 | 0.676 | 0.591 | 0.548 | 0.560 | 0.527 |
5.3.4 Data Limitations
The 2003–2017 study period was selected because the data for the index of foreign control and innovation index is unavailable prior to 2003. The automotive industry product categories 870120–871690 of the HS6 product specification from the Eurostat ComExt database, which were used for the trade data, are not 100 percent compatible with the automotive industry product specification NACE Rev. 2 (NACE 29), which was used for the index of foreign control and the index of innovation for the 2008–2017 period.Footnote 1 No trade data is available for Malta and Cyprus. Luxembourg, Greece and Croatia also had to be removed from the analysis due to data unavailability for the index of foreign control and the index of innovation. Luxembourg had the lowest average 2003–2017 positional power of all European Union countries and Greece and Croatia were positioned just above the second-lowest-ranked Ireland but below Bulgaria, which suggests periphery positions for these three countries. Since none of them is an important automotive producer, their removal should not affect the overall analysis. Because trade data are unavailable for Poland and Slovakia for 2003, I used their 2004 trade data for 2003. The data for the index of foreign control and innovation index are based on NACE 34 for the 2003–2007 period and NACE 29 for the 2008–2017 period.Footnote 2 The 2003–2007 data for the index of foreign control and the index of innovation are unavailable for Ireland. I have used the average values of the 2008–2012 data for these two indicators to normalize the positional power of Ireland for the 2003–2007 period. In cases when one or two data values of the individual components used for the calculation of the index of foreign control for a particular country was not available for a particular year, I used the data for the closest available year as these values do not change dramatically from year to year. Belgium, Germany, Austria, Sweden and Britain provide the data of the share of total R&D personnel and researchers of persons employed only every other year. I have calculated the data for missing years as an average value of the previous and following years. Denmark, France and Britain did not provide the 2003–2006 data for R&D expenditures and I have used the 2007 values for these years instead.
5.3.5 Delimiting Spatial Categories
The K-means cluster analysis was applied on the descendent order of the natural logarithm of average automotive industry power values in order to delimit five clusters for the 2003–2017, 2003–2007, 2008–2012 and 2013–2017 periods. Five-year automotive industry power averages were used in order to minimize the effect of data limitations on annual fluctuations in automotive industry power. Five delimited clusters correspond with the spatial categories as follows: a higher-order core, lower-order core, semiperiphery, periphery and lower-order periphery (Table 5.4).
Table 5.4 Classification of countries into spatial zones in the European automotive industry system delimited by cluster analysis based on the natural logarithm of average values of automotive industry power during 2003–2007, 2008–2012, 2013–2017 and 2003–2017
| 2003–2017 | 2003–2007 | 2008–2012 | 2013–2017 | ||||||||||||||||
|---|---|---|---|---|---|---|---|---|---|---|---|---|---|---|---|---|---|---|---|
| Cluster | Distance | Cluster | Distance | Cluster | Distance | Cluster | Distance | ||||||||||||
| 1 | Germany | 1 | 0.000 | C | 1 | Germany | 1 | 0.000 | HC | 1 | Germany | 1 | 0.000 | HC | 1 | Germany | 1 | 0.000 | HC |
| 2 | France | 2 | 0.331 | LC | 2 | France | 2 | 0.583 | LC | 2 | France | 2 | 0.845 | LC | 2 | France | 2 | 0.059 | LC |
| 3 | Italy | 2 | 0.135 | LC | 3 | Italy | 2 | 0.054 | LC | 3 | Italy | 2 | 0.292 | LC | 3 | Italy | 2 | 0.059 | LC |
| 4 | Sweden | 2 | 0.162 | LC | 4 | Sweden | 2 | 0.529 | LC | 4 | Sweden | 2 | 0.391 | LC | 4 | Sweden | 3 | 0.778 | SP |
| 5 | Britain | 2 | 0.305 | LC | 5 | Britain | 3 | 0.802 | SP | 5 | Britain | 2 | 0.746 | LC | 5 | Britain | 3 | 0.748 | SP |
| 6 | Austria | 3 | 0.296 | SP | 6 | Austria | 3 | 0.005 | SP | 6 | Austria | 3 | 0.698 | SP | 6 | Netherlands | 3 | 0.127 | SP |
| 7 | Netherlands | 3 | 0.275 | SP | 7 | Netherlands | 3 | 0.202 | SP | 7 | Netherlands | 3 | 0.458 | SP | 7 | Austria | 3 | 0.110 | SP |
| 8 | Belgium | 3 | 0.096 | SP | 8 | Finland | 3 | 0.639 | SP | 8 | Spain | 3 | 0.179 | SP | 8 | Belgium | 3 | 0.222 | SP |
| 9 | Spain | 3 | 0.089 | SP | 9 | Spain | 3 | 0.275 | SP | 9 | Belgium | 3 | 0.124 | SP | 9 | Spain | 3 | 0.543 | SP |
| 10 | Finland | 3 | 0.054 | SP | 10 | Belgium | 3 | 0.085 | SP | 10 | Finland | 3 | 0.050 | SP | 10 | Finland | 3 | 0.779 | SP |
| 11 | Slovenia | 3 | 0.255 | SP | 11 | Czechia | 4 | 0.020 | P | 11 | Slovenia | 3 | 0.234 | SP | 11 | Slovenia | 4 | 0.856 | P |
| 12 | Czechia | 3 | 0.265 | SP | 12 | Estonia | 4 | 0.970 | P | 12 | Denmark | 3 | 0.448 | SP | 12 | Czechia | 4 | 0.774 | P |
| 13 | Denmark | 3 | 0.290 | SP | 13 | Denmark | 4 | 0.352 | P | 13 | Czechia | 3 | 0.726 | SP | 13 | Denmark | 4 | 0.759 | P |
| 14 | Lithuania | 4 | 0.341 | P | 14 | Lithuania | 4 | 0.446 | P | 14 | Lithuania | 4 | 0.735 | P | 14 | Poland | 4 | 0.604 | P |
| 15 | Poland | 4 | 0.261 | P | 15 | Slovenia | 4 | 0.047 | P | 15 | Portugal | 4 | 0.096 | P | 15 | Lithuania | 4 | 0.255 | P |
| 16 | Hungary | 4 | 0.130 | P | 16 | Romania | 4 | 0.577 | P | 16 | Hungary | 4 | 0.084 | P | 16 | Hungary | 4 | 0.006 | P |
| 17 | Estonia | 4 | 0.117 | P | 17 | Poland | 4 | 0.508 | P | 17 | Poland | 4 | 0.050 | P | 17 | Latvia | 4 | 0.565 | P |
| 18 | Romania | 4 | 0.021 | P | 18 | Latvia | 5 | 0.455 | LP | 18 | Romania | 4 | 0.163 | P | 18 | Slovakia | 4 | 0.583 | P |
| 19 | Portugal | 4 | 0.003 | P | 19 | Hungary | 5 | 0.604 | LP | 19 | Latvia | 4 | 0.292 | P | 19 | Portugal | 4 | 0.644 | P |
| 20 | Latvia | 4 | 0.019 | P | 20 | Portugal | 4 | 0.252 | P | 20 | Estonia | 4 | 0.411 | P | 20 | Romania | 4 | 0.687 | P |
| 21 | Slovakia | 4 | 0.286 | P | 21 | Ireland | 4 | 0.433 | P | 21 | Slovakia | 5 | 0.162 | LP | 21 | Estonia | 4 | 0.776 | P |
| 22 | Ireland | 4 | 0.568 | P | 22 | Slovakia | 5 | 0.149 | LP | 22 | Ireland | 5 | 0.162 | LP | 22 | Ireland | 5 | 0.314 | LP |
| 23 | Bulgaria | 5 | 0.000 | LP | 23 | Bulgaria | 23 | Bulgaria | 23 | Bulgaria | 5 | 0.314 | LP | ||||||
Notes: HC = higher-order core, LC = lower-order core, SP = semiperiphery, P = periphery, LP = lower-order periphery.
Drawing on the cluster analysis, I have evaluated changes in the position of countries during 2003–2017 as follows. First, I have used the clusters based on the 2003–2017 automotive industry power averages to determine positions of individual countries during the entire 2003–2017 period. Second, I have compared the 2003–2017 position of each country with its 2003–2007, 2008–2012 and 2013–2017 positions. If a country was classified in the same cluster during all three five-year periods as during the entire 2003–2017 period, I considered its relative position to be stable. If not, I considered its relative position to be unstable.
5.4 Results
5.4.1 Core Countries
5.4.1.1 Stable Core
The cluster analysis based on the natural logarithm of the average 2003–2017 automotive industry power values classified five countries in the core of the European automotive industry: Germany, France, Italy, Sweden and Britain (Table 5.4, Figures 5.1 and 5.2). Germany, France and Italy were delimited in the stable core, with Germany being classified in a separate cluster corresponding with its higher-order core position. France and Italy represented a much weaker lower-order stable core. The stable core countries consistently kept their automotive industry power rank positions during 2003–2017 (Table 5.5).
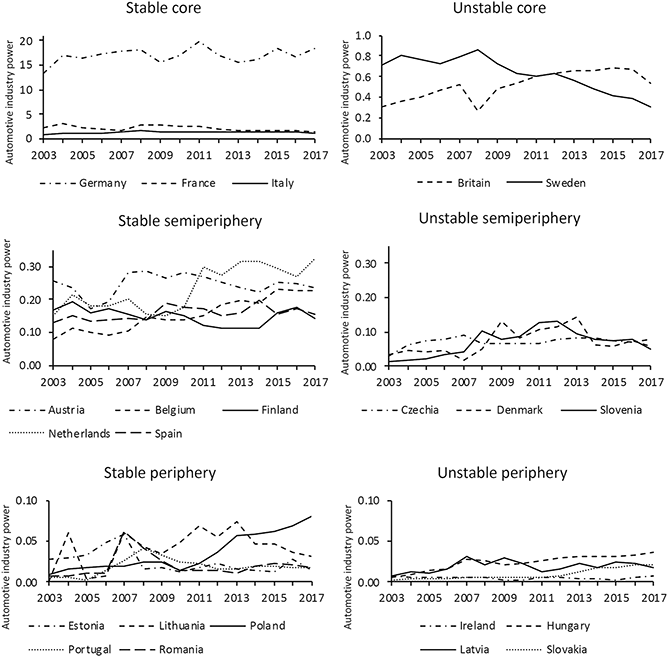

Table 5.5 Change in the relative position of European Union countries between 2003–2007 and 2013–2017 according to automotive industry power
| Rank 2003–2017 | Rank 2003–2007 | Rank 2013–2017 | Difference between 2003–2007 and 2013–2017 | |
|---|---|---|---|---|
| Germany | 1 | 1 | 1 | 0 |
| France | 2 | 2 | 2 | 0 |
| Italy | 3 | 3 | 3 | 0 |
| Sweden | 4 | 4 | 4 | 0 |
| Britain | 5 | 5 | 5 | 0 |
| Austria | 6 | 6 | 7 | −1 |
| Netherlands | 7 | 7 | 6 | 1 |
| Belgium | 8 | 10 | 8 | 2 |
| Spain | 9 | 9 | 9 | 0 |
| Finland | 10 | 8 | 10 | −2 |
| Slovenia | 11 | 15 | 11 | 4 |
| Czechia | 12 | 11 | 12 | −1 |
| Denmark | 13 | 13 | 13 | 0 |
| Lithuania | 14 | 14 | 15 | −1 |
| Poland | 15 | 17 | 14 | 3 |
| Hungary | 16 | 19 | 16 | 3 |
| Estonia | 17 | 12 | 21 | −9 |
| Romania | 18 | 16 | 20 | −4 |
| Portugal | 19 | 20 | 19 | 1 |
| Latvia | 20 | 18 | 17 | 1 |
| Slovakia | 21 | 22 | 18 | 4 |
| Ireland | 22 | 21 | 22 | −1 |
| Bulgaria | 23 | 23 | 23 | 0 |
Germany dominated trade relations with all European countries during the entire period (i.e., had the highest value of the positional power every year) (Tables 5.2 and 5.6), had the lowest index of foreign control (Table 5.7) and the second-highest average level of the innovation index (Table 5.8). Germany’s dominant position of the higher-order core is reflected by its automotive industry power being on average 8.4 times higher than that of France and 12.5 times higher than that of Italy (Table 5.3, Figure 5.1).
Table 5.6 Change in the relative trade position of European Union countries between 2003–2007 and 2013–2017 according to positional power
| Rank 2003–2017 | Rank 2003–2007 | Rank 2013–2017 | Difference between 2003–2007 and 2013–2017 | |
|---|---|---|---|---|
| Germany | 1 | 1 | 1 | 0 |
| France | 2 | 2 | 2 | 0 |
| Belgium | 3 | 4 | 3 | 1 |
| Britain | 4 | 3 | 4 | −1 |
| Spain | 5 | 5 | 5 | 0 |
| Italy | 6 | 6 | 6 | 0 |
| Sweden | 7 | 7 | 9 | −2 |
| Poland | 8 | 10 | 8 | 2 |
| Czechia | 9 | 11 | 7 | 4 |
| Netherlands | 10 | 8 | 10 | −2 |
| Austria | 11 | 9 | 11 | −2 |
| Slovakia | 12 | 19 | 12 | 7 |
| Hungary | 13 | 12 | 13 | −1 |
| Lithuania | 14 | 14 | 14 | 0 |
| Slovenia | 15 | 16 | 15 | 1 |
| Romania | 16 | 20 | 16 | 4 |
| Latvia | 17 | 15 | 17 | −2 |
| Finland | 18 | 13 | 18 | −5 |
| Estonia | 19 | 17 | 19 | −2 |
| Denmark | 20 | 18 | 20 | −2 |
| Portugal | 21 | 21 | 21 | 0 |
| Bulgaria | 22 | 22 | 22 | 0 |
| Ireland | 23 | 23 | 23 | 0 |
| Average 2003–2017 (%) | Average 2003–2007 (%) | Average 2013–2017 (%) | Rank 2003–2017 | Rank 2003–2007 | Rank 2013–2017 | Change in rank between 2003–2007 and 2013–2017 | |
|---|---|---|---|---|---|---|---|
| Germany | 14.6 | 14.1 | 14.8 | 1 | 1 | 1 | 0 |
| Italy | 20.3 | 20.8 | 19.6 | 2 | 2 | 2 | 0 |
| France | 22.8 | 23.1 | 23.5 | 3 | 3 | 3 | 0 |
| Finland | 28.4 | 26.5 | 29.7 | 4 | 4 | 4 | 0 |
| Denmark | 33.5 | 34.9 | 33.5 | 5 | 5 | 5 | 0 |
| Slovenia | 53.7 | 45.3 | 63.3 | 6 | 6 | 6 | 0 |
| Sweden | 56.9 | 52.3 | 66.1 | 7 | 7 | 8 | −1 |
| Estonia | 64.5 | 59.8 | 66.2 | 8 | 9 | 9 | 0 |
| Netherlands | 68.0 | 71.0 | 64.8 | 9 | 13 | 7 | 6 |
| Lithuania | 68.8 | 56.5 | 80.9 | 10 | 8 | 14 | −6 |
| Ireland | 72.6a | 65.7b | 79.4 | 11 | 10 | 13 | −3 |
| Austria | 77.3 | 72.8 | 79.4 | 12 | 15 | 12 | 3 |
| Latvia | 78.1 | 65.8 | 85.3 | 13 | 11 | 16 | −5 |
| Spain | 78.4 | 71.1 | 86.1 | 14 | 14 | 18 | −4 |
| Portugal | 79.3 | 80.4 | 79.3 | 15 | 17 | 11 | 6 |
| Britain | 80.0 | 76.7 | 82.9 | 16 | 16 | 15 | 1 |
| Belgium | 81.0 | 81.9 | 79.2 | 17 | 20 | 10 | 10 |
| Romania | 82.8 | 67.3 | 91.6 | 18 | 12 | 20 | −8 |
| Poland | 83.6 | 80.8 | 85.6 | 19 | 18 | 17 | 1 |
| Bulgaria | 85.0 | 81.5 | 87.8 | 20 | 19 | 19 | 0 |
| Czechia | 91.8 | 91.2 | 92.0 | 21 | 21 | 21 | 0 |
| Hungary | 93.1 | 92.1 | 94.6 | 22 | 22 | 22 | 0 |
| Slovakia | 95.6 | 93.1 | 96.4 | 23 | 23 | 23 | 0 |
Notes: a 2008–2017 average, b 2008–2012 average.
| Average 2003–2017 (%) | Average 2003–2007 (%) | Average 2013–2017 (%) | Rank 2003–2017 | Rank 2003–2007 | Rank 2013–2017 | Change in rank between 2003–2007 and 2013–2017 | |
|---|---|---|---|---|---|---|---|
| Sweden | 97.6 | 97.9 | 98.9 | 1 | 1 | 1 | 0 |
| Germany | 88.4 | 85.2 | 87.6 | 2 | 2 | 2 | 0 |
| Austria | 62.0 | 54.2 | 64.0 | 3 | 3 | 3 | 0 |
| Britain | 50.8 | 38.5 | 62.0 | 4 | 7 | 4 | 3 |
| France | 47.7 | 48.1 | 41.8 | 5 | 4 | 7 | −3 |
| Italy | 46.6 | 38.6 | 52.7 | 6 | 6 | 6 | 0 |
| Netherlands | 44.0 | 39.9 | 53.3 | 7 | 5 | 5 | 0 |
| Finland | 28.3 | 26.8 | 29.8 | 8 | 8 | 8 | 0 |
| Slovenia | 21.3 | 8.2 | 26.4 | 9 | 17 | 9 | 8 |
| Portugal | 18.8 | 13.4 | 17.1 | 10 | 14 | 14 | 0 |
| Spain | 18.7 | 14.4 | 20.8 | 11 | 13 | 11 | 2 |
| Czechia | 18.4 | 25.3 | 14.3 | 12 | 9 | 16 | −7 |
| Denmark | 18.1 | 9.8 | 22.2 | 13 | 16 | 10 | 6 |
| Ireland | 16.0a | 15.8b | 16.2 | 14 | 11 | 15 | −4 |
| Lithuania | 15.3 | 8.0 | 18.8 | 15 | 19 | 13 | 6 |
| Belgium | 14.9 | 10.3 | 19.6 | 16 | 15 | 12 | 3 |
| Estonia | 12.5 | 19.1 | 8.8 | 17 | 10 | 20 | −10 |
| Hungary | 11.1 | 8.0 | 13.0 | 18 | 18 | 17 | 1 |
| Romania | 10.5 | 15.0 | 8.5 | 19 | 12 | 21 | −9 |
| Latvia | 10.0 | 6.8 | 11.5 | 20 | 20 | 18 | 2 |
| Poland | 7.1 | 5.1 | 11.3 | 21 | 21 | 19 | 2 |
| Slovakia | 4.2 | 3.2 | 6.7 | 22 | 22 | 22 | 0 |
| Bulgaria | 1.1 | 0.0 | 3.2 | 23 | 23 | 23 | 0 |
Notes: a 2008-2017 average, b 2008-2012 average.
The lower-order core position of France is based on its second-strongest positional power, the third-lowest degree of foreign control and the fifth-strongest innovation index. The relative position of France weakened between 2003 and 2017 due to the relative decline of the French automotive industry since the second half of the 2000s (Reference Pardi, Covarrubias and Ramírez PerezPardi, 2020). France’s relative position also worsened in automotive innovation due to the partial relocation of automotive R&D abroad. Renault Technology Romania was opened in 2007 and it has employed 2,300 engineers at three sites in Romania who, in addition to providing technical support for Renault’s factories in Eastern Europe, Turkey and North Africa, develop and test vehicles on the M0 platform, which was previously done in France (Reference Benadbdejlil, Lung and PiveteauBenadbdejlil et al., 2017). Similarly, the Kwid had been the first Renault model that was completely designed abroad (in India) instead of the corporate R&D center in France (Reference Midler, Jullien and LungMidler et al., 2017). Consequently, despite the fact that French automakers continue to conduct the most important automotive R&D in France, the R&D’s share of total business expenditures and employment has declined in France.
Italy’s automotive industry power has been the weakest of the three stable core countries because of Italy’s weaker average positional power compared not only to France but also Belgium, Britain and Spain. Its car production halved after 2000 (Reference Calabrese, Covarrubias and Ramírez PerezCalabrese, 2020), weakening its positional power (Table 5.2). At the same time, Italy’s index of foreign control and index of innovation are similar to those of France. The second-lowest index of foreign control therefore differentiates Italy from unstable core countries and is the basis of its stable lower-order core position (Table 5.7).
5.4.1.2 Unstable Core
Sweden and Britain represent the unstable core since Sweden was delimited as the semiperiphery during 2013–2017, while Britain was delimited as the semiperiphery during 2003–2007 and 2013–2017, indicating their borderline core–semiperiphery position. Sweden’s core position was mainly based on the consistently highest index of innovation, with the exception of 2007 and 2008. Sweden’s weakening automotive industry power position after 2008 was related to its worsening positional power ranking and to the increased index of foreign control related to the collapse of Saab and takeover of Volvo cars by Ford and then Geely. The core position of Britain is based on its strong positional power and strong innovation combined with a high degree of foreign control. Britain was the fourth-largest vehicle producer in the European Union until 2018, with its export-oriented production geared toward European Union markets. The declining output since 2017 suggests that Brexit might negatively affect Britain’s relative position in the European automotive industry in the long run (e.g., Reference Coffey, Thornley, Covarrubias and Ramírez PerezCoffey and Thornley, 2020).
5.4.2 Semiperipheral Countries
The semiperiphery is an intermediate spatial zone that is geographically concentrated in Western Europe and is mainly distinguished by a high degree of foreign control, weaker positional power than Germany and France and variable strength of innovation activities (Tables 5.1–5.5, Figures 5.1 and 5.2).
5.4.2.1 Stable Semiperiphery
The cluster analysis delimited Austria, the Netherlands, Spain, Belgium and Finland in the stable semiperiphery. Spain is the second-largest vehicle producer in Europe. It represents an example of an older integrated periphery which developed based on FDI-driven growth (Reference JacobsJacobs, 2019) and advanced into the semiperiphery. Spain’s weaker-than-expected fifth average positional power is due to its specialization in the production of smaller low- to medium-value-added vehicles (Reference Aláez-Aller, Gil, Ullibarri, Galgóczi, Drahokoupil and BernaciakAláez et al., 2015). Spain’s relatively low automotive industry power also reflects its high dependence on foreign capital (Reference Aláez-Aller, Gil, Ullibarri, Galgóczi, Drahokoupil and BernaciakAláez et al., 2015; Reference JacobsJacobs, 2019) and a lower relative importance of R&D given the overall size of its automotive industry.
Belgium represents the second example of an old integrated periphery that advanced into the semiperiphery. Belgium’s positional power was the third-strongest in the European Union after Germany and France mainly due to the specialization of the two remaining assembly plants (Audi Brussels and Volvo Car Gent) in the export-oriented high-value-added production of luxury SUVs and electric vehicles (Reference JacobsJacobs, 2019). Despite the improvements in the comparative positions of Belgium in the index of foreign control, as a number of foreign-owned factories closed (Reference JacobsJacobs, 2019), and in innovation capacity, its automotive industry power continues to be undermined by a high degree of foreign control and a weak innovation index, which is at the level of Spain.
Austria had the highest average automotive industry power in the stable semiperiphery despite its weak positional power compared to other semiperipheral countries with larger automotive industries. Its position was mainly based on a strong innovation capacity (Reference Trippl, Baumgartinger-Seiringer, Goracinova and WolfeTrippl et al., 2021) with the third-highest average value of the index of innovation (after Sweden and Germany). The Netherlands’ average automotive industry power was only slightly lower than that of Austria but the Netherlands’ positional power grew faster after the 2008–2009 economic crisis. Its automotive industry power is also based on the sixth-highest index of innovation and a below-average index of foreign control for semiperipheral countries despite a weak positional power. Finally, Finland had a weak positional power combined with a very low degree of foreign control (the largest automotive firm in Finland is a domestic-owned contract manufacturer Valmet) and the eighth-strongest innovation index in the European Union.
5.4.2.2 Unstable Semiperiphery
The unstable semiperiphery was composed of Denmark, Czechia and Slovenia. However, these three countries were classified as peripheral during 2003–2007 and 2013–2017, highlighting their borderline periphery–semiperiphery position (Table 5.4, Figures 5.1 and 5.2). The automotive industry power of these countries increased during 2003–2012 but decreased after 2012 (Denmark and Slovenia) or stagnated (Czechia) and was significantly lower than the automotive industry power of the stable semiperiphery. Czechia has by far the largest automotive industry of these three countries with 1.4 million vehicles assembled in 2017 (Slovenia 189,000, Denmark zero). Denmark has a low positional power but the fifth-lowest index of foreign control and its innovation index is higher than any Eastern European country except for Slovenia. Slovenia had the sixth-lowest index of foreign control and recorded the largest improvement in rank by innovation index in the European Union between 2003 and 2017. This improvement was caused by a sixfold increase in the share of Slovenia’s business expenditure on R&D of the total value of production between the 2003–2007 and 2008–2012 averages, which might be related to changes in statistical accounting from NACE 34 to NACE 29.
Czechia had a strong and increasing positional power based on its rapidly growing automotive industry during the study period, which was undermined by the high degree of foreign control and worsening innovation index. Czechia used to have a relatively significant domestic automotive R&D before 1990. After 1990, the domestic sector decreased R&D spending and employment as it was taken over by foreign firms and the surviving domestic firms rationalized their R&D activities. At the same time, the growth in R&D spending and employment by foreign firms was slower than the growth of production (Reference PavlínekPavlínek, 2004; Reference Pavlínek2012).
5.4.3 Peripheral Countries
The cluster analysis delimited two clusters that are classified as the periphery and lower-order periphery. With the exception of Portugal and Ireland, the automotive industry periphery is located in Eastern Europe and is typified by the highest degree of foreign control, the lowest innovation index and mostly low positional power. Due to the rapid growth of the FDI-driven export-oriented automotive industry (e.g., Reference PavlínekPavlínek, 2017a), all Eastern European countries, with the exception of the Baltic countries, improved their positional power. However, the relative ranking of the most rapidly growing Eastern European countries worsened in innovation activities as the increase in production and trade was much faster than the increases in R&D expenditures and employment (Reference PavlínekPavlínek, 2012). The index of foreign control increased in all Eastern European countries but most in those with the largest and fastest-growing automotive industries. Eastern Europe thus recorded the highest degree of foreign control in the automotive industry, which underscores its peripheral position.
5.4.3.1 Stable Periphery
The stable periphery included Poland, Portugal, Romania, Estonia and Lithuania. Poland’s automotive industry power was rapidly growing after 2010, reaching the levels of Czechia in 2016 and 2017, and its relative position in innovation activities also improved, suggesting progression towards the semiperiphery. Romania experienced the second-largest improvement in the positional power ranking of all European Union countries, as the large influx of FDI led to the rapid development of low-cost production and the largest automotive industry job creation by large and medium-sized firms in the European Union between 2005 and 2016 (Reference PavlínekPavlínek, 2020). At the same time, Romania suffered the second-largest decrease in innovation index ranking and the largest drop in the index of foreign control ranking. This is despite the already-discussed significant growth of R&D expenditures and employment at Renault Technology Romania, which, however, did not keep pace with the rapid FDI-driven growth of the automotive industry in Romania as a whole (Reference PavlínekPavlínek, 2020). Consequently, the relative importance of R&D activities in the automotive industry as a whole decreased. This development reiterated Romania’s peripheral position as its overall automotive industry power-based relative position worsened during the study period. Portugal has a weak positional power but a stronger position of its domestic sector than Eastern European countries and an above-average index of innovation among peripheral countries. Estonia and Lithuania have small automotive industries with a significantly lower index of foreign control compared to the rest of Eastern Europe, which is the main reason behind their stable periphery position.
5.4.3.2 Unstable Periphery
Although the cluster analysis delimited Ireland, Hungary, Latvia and Slovakia as the periphery during 2003–2017, it delimited them in the lower-order periphery during one or two of the 2003–2007, 2008–2012 and 2013–2017 periods. Despite having large automotive industries, Slovakia was delimited as the lower-order periphery during 2003–2007 and 2008–2012, while Hungary was delimited as the lower-order periphery during 2003–2007. This is because Slovakia had the highest and Hungary the second-highest index of foreign control and Slovakia had the second-lowest index of innovation. The improvement in the relative automotive industry power position of both countries was therefore driven by large increases in the export-oriented production that strengthened their positional power. Indeed, Slovakia recorded the largest rank position improvements in both positional power and automotive industry power during the study period. Ireland and Latvia have small automotive industries, with Ireland recording the lowest average positional power during 2003–2017.
5.5 Conclusion
The goal of this chapter has been to analyze the core–semiperiphery–periphery spatial structure of the European automotive industry during the 2003–2017 period and determine the position of individual countries in these spatial zones. I have explained the different roles of these spatial zones in the integrated transnational automotive industry production system and, based on Harvey’s theory of spatiotemporal fix, the geographic expansion of the European automotive industry through the integration of new peripheries into transnational GVCs and GPNs. As we can see in Chapter 4, this integration is driven by the investment of predominantly core-based automotive TNCs that are continuously searching for new low-cost production sites with a potential for a higher rate of profit. I have also shown how this expansion and integration of new peripheries affects the existing automotive industry locations in the core and semiperipheral regions.
The combination of theoretical and conceptual insights of the GVC, GPN and spatial divisions of labor approaches has allowed for the identification of critical indicators for determining the relative position of countries in transnational production networks of the automotive industry. The GVC approach, along with the spatial divisions of labor approach, highlights the importance of transnational control in the automotive industry and its relationship to the core–periphery position of countries. The GPN approach, along with the spatial divisions of labor approach, reveals the importance of specialized regional assets, such as R&D and innovation assets, in reflecting the core–periphery position. The GPN and GVC approaches, with their emphasis on the transnational network organization of the automotive industry, have been instrumental for estimating the trade-based network position of firms of individual countries in the European automotive industry.
Drawing on this conceptual explanation of the spatial structure of transnational automotive industry production networks, this chapter has introduced a methodology for determining the automotive industry power of countries in order to evaluate their relative positions in the core, semiperiphery and periphery of the European automotive industry during the 2003–2017 period. The analysis revealed mostly stable relative positions of countries in this spatial hierarchy, although several countries were classified in less stable borderline positions. The stable core is dominated by Germany and also includes France and Italy. Sweden and Britain represent the unstable core countries on the borderline between the core and semiperiphery due to a significantly larger foreign control of their automotive industries, which also applies to the semiperiphery. The stable semiperiphery is located in Western Europe. The most distinguishable features of the periphery, which is mostly located in Eastern Europe, include a very high degree of foreign control and weak innovation capabilities, despite a large automotive industry in several peripheral countries. The results presented here are broadly in line with several previous studies (e.g., Reference JonesJones, 1993; Reference Bordenave and LungBordenave and Lung, 1996; Reference Mordue and SweeneyMordue and Sweeney, 2020) but they differ from studies that distinguish the core and periphery of the European automotive industry mainly on the basis of geography (e.g., Reference Brincks, Klier and RubensteinBrincks et al., 2016). It would be interesting to extend this methodology to the subnational regional level in order to determine the relative position of regions within the core–periphery structure of the European automotive industry, because it would show a more complex spatial pattern due to the high degree of spatial concentration and clustering of the contemporary automotive industry in particular regions (e.g., Reference Sturgeon, Van Biesebroeck and GereffiSturgeon et al., 2008). On one hand, it would reveal semiperipheral and peripheral regions of the automotive industry in core countries, while on the other hand it would identify the semiperipheral regions in peripheral countries. Unfortunately, the statistical data for this subnational analysis using the same methodology is currently unavailable.
The most likely changes in the foreseeable future will include the consolidation of positions of countries that were classified in unstable positions. Sweden and Britain have been trending from the unstable core towards the semiperiphery. Denmark, Czechia and Slovenia were classified in the semiperiphery only during the 2008–2012 period, which was affected by the global economic crisis, and are likely to consolidate their positions in the periphery rather than the stable semiperiphery in the foreseeable future. Slovakia and Hungary are likely to stabilize their periphery positions due the continuing growth of their automotive industries. The automotive industry in the periphery was the most dynamic during the study period as theorized in the conceptual explanation. Can we therefore expect the potential transitions of the most advanced peripheral countries into the semiperiphery in the long run, as happened in the cases of previous integrated peripheries of Western Europe, such as Belgium and Spain? Although Reference Domański, Guzik, Gwosdz, Medina, Carrillo and González MarínDomański et al. (2014) argue that it has already happened based on the structure of production, exports and product quality, the conceptual approach, methodology and empirical analysis presented in this chapter only partially support this conclusion. Still, the narrowing gap in automotive industry power between the most advanced and rapidly growing peripheral countries, such as Poland, and the stable semiperiphery suggests that it is a plausible scenario. However, a large modern automotive industry may not be sufficient to advance a country into the semiperiphery of automotive transnational production networks unless it has a reasonably strong domestic sector, including firms that are able to globalize, and have sizeable innovation activities (see also Reference Lampón, Lago-Peñas and CabanelasLampón et al., 2016; Reference Mordue and SweeneyMordue and Sweeney, 2020). The rapid growth of the automotive industry in the stable periphery has been slowing down and is unlikely to continue in the future because of the increasingly exhausted sources of labor surplus and, consequently, rising wages. Since the Eastern European automotive industry is overwhelmingly under foreign ownership and control, the only remaining ways to improve its relative position is through the strengthening of innovation activities and shifting to a higher-value-added production, which takes time. Given the spatial organization of the automotive R&D (Reference FrigantFrigant, 2007; Reference Sturgeon, Van Biesebroeck and GereffiSturgeon et al., 2008; Reference PavlínekPavlínek, 2012), the Eastern European periphery is likely to continue to trail behind Western Europe in innovation activities despite some selective recent growth. Additionally, despite some exceptions, the relative position of domestic firms in Eastern Europe has continued to weaken as they have been unable to strongly benefit from the FDI-driven growth of the automotive industry (Reference PavlínekPavlínek, 2020). For these reasons, we should not expect a shift of east European countries into the stable semiperiphery any time soon.
A policy advice to countries wishing to improve their relative position in transnational automotive industry production networks and increase the relative rewards accrued from the automotive industry is twofold. They should support the development of automotive R&D and other high-value-added activities through strategic industrial policies as well as nurture domestic automotive firms so they can grow and eventually globalize by investing abroad. In the coming decades, the European automotive industry will be affected by the transition to the production of electric vehicles, automation, robotics and digitalization (Industry 4.0), autonomous driving and new forms of car ownership. All these changes will potentially have significant impacts on the structure, employment and geography of production. Although the precise effects are currently unknown, this transformation will take place at different speeds in the core, semiperiphery and periphery. The core and semiperiphery countries are already experiencing some of these changes earlier and faster due to their greater innovation potential, stronger institutional support and the proximity to large and affluent markets. It remains to be seen how these changes will affect the spatial structure of the European automotive industry.


 Open access