


Party families are a foundational concept in the study of European party politics. Classifying parties into families – generally by their shared cleavage origins (Lipset & Rokkan, Reference Lipset, Rokkan, Lipset and Rokkan1967) – allows researchers to identify comparable parties across countries both as objects of study and for explanatory purposes. For example, party families form the basis for case selection in comparative efforts to understand how parties have changed over time in response to their political and economic environment (Berman, Reference Berman2006; Chiocchetti, Reference Chiocchetti2016; Kitschelt, Reference Kitschelt1994; Kitschelt & McGann, Reference Kitschelt and McGann1997; Ziblatt, Reference Ziblatt2017). Party families’ strength is also a critical explanatory variable in the study of the welfare state and the expansion of democratic rights (Bremer & McDaniel, Reference Bremer and McDaniel2020; Ennser‐Jedenastik, Reference Ennser‐Jedenastik2018; Häusermann, Reference Häusermann2010; Huber et al., Reference Huber, Ragin and Stephens1993; Huber & Stephens, Reference Huber and Stephens2001; Irving, Reference Irving1979; Röth et al., Reference Röth, Afonso and Spies2018).
Existing approaches to categorizing parties into families by their cleavage origins (Seiler, Reference Seiler1980; Von Beyme, Reference Von Beyme1985), membership in transnational groups (Hix & Lord, Reference Hix and Lord1997), names (Smart, Reference Smart1972), or some ad hoc combination thereof lack an empirically non‐subjective and replicable solution to diagnose declining ideological cohesion within party families or convergence between them (Mair & Mudde, Reference Mair and Mudde1998). If the goal of party families is to identify commonalities between parties for case selection and analysis, the grist of democratic politics and policymaking may erode party families’ internal commonalities and external differentiation over time. This is not to say that party families constructed on historical origins lack value for many research questions. But it does leave open the question, do the static canonical groupings continue to summarize the ideological positions of political parties in contemporary Europe?
As Kitschelt (Reference Kitschelt2018) argues, party families ought to be identified by analytical criteria based on the party's ideological program. Historically, a party family's profile was tightly linked with their origins. Social democratic parties advocated for social welfare and economic equality on behalf of the working class. Liberals proposed limiting the scope of government interference in the economy to allow the market to optimally allocate scarce resources. Agrarian parties pursued the interests of rural small landowners. Christian democrats aimed to infuse politics with a ‘Christian ethic’ (CDU, Reference Treue1968). Conservatives worked to maintain the position of the upper class in rapidly changing economic and social contexts (Ziblatt, Reference Ziblatt2017).
However, the extent to which parties’ origins are informative heuristics for parties’ ideologies may be in decline. Take two prominent examples. The social democratic family has drifted from its original ideology and has become more internally diverse. Some social democratic parties embrace market‐oriented policies while others try to maintain their traditional commitments (Berman, Reference Berman2003; Grant & Tilley, Reference Grant and Tilley2022; Jansen et al., Reference Jansen, Evans and de Graaf2013; Nachtwey, Reference Nachtwey2013; Petring et al., Reference Petring, Henkes and Egle2007). On the right of the political spectrum, scholars have also identified ideological convergence between the mainstream and radical right (Hjorth & Larsen, Reference Hjorth and Larsen2022; Krause et al., Reference Krause, Cohen and Abou‐Chadi2023; Spoon & Klüver, Reference Spoon and Klüver2020). Both party families have been responding to larger socioeconomic changes including the decline of their historic base of supporters, increasing rates of higher educational achievement, and an increasingly integrated global economy (Best, Reference Best2011; Dancygier & Walter, Reference Dancygier, Walter, Beramendi, Häusermann, Kitschelt and Kriesi2015; Ford & Jennings, Reference Ford and Jennings2020; Jansen et al., Reference Jansen, Evans and de Graaf2013; Kitschelt, Reference Kitschelt1994; Marks et al., Reference Marks, Attewell, Hooghe, Rovny and Steenbergen2022). These examples highlight the uncertainty in the field about whether origins‐based party families still capture commonalities of position and priority, not to mention the persistent differences between East and West European parties (Mair & Mudde, Reference Mair and Mudde1998, p. 215; Vachudova & Hooghe, Reference Vachudova and Hooghe2009).
Previous scholars have also identified the potential for a classification system based solely on party positions and ideology (Mair & Mudde, Reference Mair and Mudde1998). Kitschelt (Reference Kitschelt2018) even suggests that the concept of party families should only be defined by analytical criteria, not origins. However, there are two fundamental challenges to this approach: (1) how many groups are necessary and (2) how to specify the boundaries between groups. Consider the conservative and Christian democratic party families (Irving, Reference Irving1979). The Political Party Database codes these party families together (Langsæther, Reference Langsæther2019; Poguntke et al., Reference Poguntke, Scarrow and Webb2020), but the Manifesto Project Dataset and the Chapel Hill Expert Survey code them separately (Lehmann et al., Reference Lehmann, Burst, Matthieß, Regel, Volkens, Weßels and Zehnter2022). Indeed, Carroll and Kubo's (Reference Carroll and Kubo2019, p. 250) validation of their party placements based on candidate surveys shows that the estimated party positions of Christian democrats and conservatives occupy essentially the same range of left‐right values – as well as the liberal and radical right. How would one go about deciding if the two offer sufficiently differentiated policy content to warrant two separate groups today, and how would one decide on gray cases? Ideally, these questions would rely on replicable and transparent procedures, thereby avoiding subjective researcher judgements. Kitschelt (Reference Kitschelt2018) suggests a deductive approach by stipulating three key ideological dimensions (greed, grid, and group) and defines a party family as a group of parties occupying a unique combination of positions on those dimensions. However, the standard approach in the discipline remains to construct families based on shared cleavage origins.
In this research note, we propose model‐based clustering (MBC) as an inductive tool to both investigate and assess ideological clusters of parties. By transforming subjective decisions into questions of model selection with empirical benchmarks, MBC can select the optimal number of ideological clusters, relevant features, and optimal tuning parameters, and classify parties into these clusters, without the need for subjective or arbitrary decisions in the modeling process that are common in other clustering techniques (Ahlquist & Breunig, Reference Ahlquist and Breunig2012). As such, it not only provides a non‐subjective approach to clustering parties by ideology, but it also provides explicit criteria for identifying when allocating a party to a new group is appropriate.
To compare and contrast traditional party families with the ideological clusters generated using MBC, we use all common items in the Chapel Hill Expert Survey (CHES) from 2006 onwards (Jolly et al., Reference Jolly, Bakker, Hooghe, Marks, Polk, Rovny, Steenbergen and Vachudova2022). We refer to these groupings of parties as ‘ideological clusters’ and reserve ‘family’ for canonical usage. As the discussion above suggests, MBC allocates almost all conservative and Christian democratic parties – as well as many liberal and social democratic parties – to a single, large cluster. This indicates that the traditional party families of the center‐right offer broadly comparable policy offerings today, despite differing origins. However, MBC identifies the need for a specific cluster that very closely mirrors existing classifications of the radical right, likely a reflection of the extensive scholarship defining the radical right's ideological characteristics (Mudde Reference Mudde2019).
On the left of the ideological spectrum, MBC creates ideological clusters that roughly correspond to social democrats, greens, and the far left, though there is substantial mixing between the groups. This indicates a notable asymmetry. MBC rarely splits parties of the right into separate ideological clusters except for the radical right, but it identifies little reason to differentiate the families across multiple ideological clusters. Party families of the left, however, tend to be spread across more ideological clusters, but MBC still identifies the necessity of several ideological clusters to capture variation in left‐wing political supply.
In terms of temporal dynamics, about 80 percent of parties remain in the same ideological cluster across all CHES waves in which they are present in the data. However, there are also parties, such as the Lega, which switch clusters repeatedly. Cases of transition generally occur among ideological proximate clusters. As such, MBC captures the stability of party ideologies in contemporary European politics without enforcing static cluster allocations (Hooghe & Marks, Reference Hooghe and Marks2018).
Finally, our approach strongly indicates that using a common set of party families across Eastern and Western Europe obscures substantial heterogeneity. MBC identifies specific ideological clusters that capture the differing relationship between the economic, cultural, and European dimensions of contestation between East and West. This variation is obfuscated by the traditional set of party family labels.
In addition to providing insight into the nature of contemporary European politics, this approach could help us better understand party competition in other contexts, such as Latin America or Africa, or on different characteristics, like parties’ organizational characteristics and approaches to connecting with voters. By adding a new tool to our conceptual toolkit, scholars can develop bespoke categorizations to fit their research questions, enabling us to better understand political parties in the past and present.
Empirical approach
We seek to group parties based on their ideology, using a non‐subjective, time‐variant, and replicable method. Because we want a method that mitigates researcher subjectivity, we turn to machine learning procedures, in particular, to clustering techniques. Cluster analysis is uniquely suited for this task because the goal of cluster analysis is identifying groups in quantitative data.
However, traditional clustering techniques such as K‐means or hierarchical clusters have significant limitations. Specifically, they allow the researchers to make too many decisions during the clustering procedure (Ahlquist & Breunig, Reference Ahlquist and Breunig2012). How many clusters should we use to group the data? What variables should be used in the clustering procedure? How can we choose among different clustering parameters?
Model‐based clustering (MBC) provides a solution to these problems. One of the main advantages of MBC is that it is based on a probability model and uses standard methods of statistical inference (Bouveyron et al., Reference Bouveyron, Celeux, Murphy and Raftery2019). This means that researchers can use non‐subjective measures, based on a probability model, to select the variables, the number of clusters, and the tuning parameters used in the analysis. In other words, it turns most of the limitations of traditional clustering procedures into problems of model choice with non‐subjective decision criteria. MBC models the observed data as a finite mixture of multivariate distributions (normal or Gaussian distributions for continuous data) in which each distribution represents a cluster. Because the model assumes that the data are generated by probability distributions, MBC is a soft‐clustering technique that estimates the probability that each observation belongs to each of the distribution components.Footnote 1 This allows the researcher to assess the uncertainty of those estimates.
Given that MBC is based on probability distributions, we can use the posterior model probabilities to evaluate model fit. Using Bayes theorem, we evaluate the probability of each model given the observed data and choose the one that is most likely a posteriori. Commonly, the posterior likelihood of the models is approximated using the Bayesian information criterion (BIC), which can be used to compare models with different numbers of variables (Scrucca & Raftery, Reference Scrucca and Raftery2018), clusters, and tuning parameters. In other words, common problems associated with the use of cluster analysis become problems of model selection, which can be made based on non‐subjective criteria.
Data
To estimate the models, we use CHES 1999–2019 trend data (Jolly et al., Reference Jolly, Bakker, Hooghe, Marks, Polk, Rovny, Steenbergen and Vachudova2022). The CHES 1999–2019 trend file contains party positions on multiple dimensions for parties in Europe during a 20‐year window (See Table 4A for summary statistics). Research has consistently shown strong evidence of the validity, reliability, and cross‐national/regional comparability of CHES data (Bakker et al., Reference Bakker, Jolly, Polk and Poole2014; Hooghe et al., Reference Hooghe, Bakker, Brigevich, de Vries, Edwards, Marks, Rovny, Steenbergen and Vachudova2010; Marks et al., Reference Marks, Hooghe, Steenbergen and Bakker2007; Martínez‐Gallardo et al., Reference Martínez‐Gallardo, Cerda, Hartlyn, Hooghe, Marks and Bakker2022). In this research note, we use the average of experts’ placements on each question for each party‐wave observation rather than the individual expert ratings.
The results presented below cover the 2006–2019 period. We excluded the CHES’ first two rounds (1999–2002) because they include only a very small subset of variables.Footnote 2 We used all common questions from the 2006–2019 period except for two questions on salience and dissent regarding European integration. We excluded those two variables because they do not contain information about party positions. In total, we included 18 questions in the analysis. A comprehensive list of the variables is available in the appendix (Table 1A). Our analysis dataset, which is publicly available in the replication material for this article, contains the cluster assignments alongside CHES party IDs and MARPOR party IDs to facilitate other researchers’ use of our classification.
Results
Grouping parties using ideological positions
We implement the models using the clustvarsel R package (Scrucca & Raftery, Reference Scrucca and Raftery2018).Footnote 3 Using model fit, clustvarsel allowed us to find the (locally) optimal subset of cluster variables, clusters and model parameters. We evaluated the presence of 2 to 20 groups in the data and all possible parametrizations of the model. MBC models can vary in terms of 4 parameters regarding the distributions used to create the groups: type (univariate, spherical, diagonal, ellipsoidal), volume (equal/variable), shape (equal/variable) and orientation (Axis‐aligned/equal/variable). The results show that the optimal number of variables is 13 and the optimal number of ideological clusters is eight.Footnote 4 To interpret the clusters, we have assigned each an informative name based on its ideological tendencies. We have endeavoured to use names that are sufficiently distinct from the party family labels to avoid confusion. For example, although most of the major parties in the ethnic minority cluster represent geographically concentrated ethnic minorities, we do not include the word ‘regionalist’ in the cluster name in an attempt to avoid potential confusion.Footnote 5
Figure 1 shows the levels of certainty with which each party‐wave dyad was assigned to their respective cluster. Levels of certainty are very high. The mean level of confidence is 0.94 with a median of 0.992. The uncertainty level for 71 percent of the party‐waves is above 0.95. Overall, there are high levels of confidence in the assignments.

Figure 1. Probability of party‐wave assignment. Note: Dashed vertical line at 0.95.
Figure 2 displays the ideological clusters along relevant ideological dimensions. It is important to note that the clusters were estimated based on a 13‐dimensional space. To more easily visualize the clusters, we use principal component analysis (PCA). Like other dimensionality reduction methods, PCA allows us to reduce the number of dimensions while preserving most of the information. Figure 2 shows the average score of each ideological cluster on the four dimensions we extract from the PCA. For information on how the dimensions were derived, see Figure 4A and Table 5A in the online Supplementary Material.

Figure 2. Ideological clusters across four dimensions. Note: The x‐axis represents a set of summary dimensions. The Y‐axis represents the ideological clusters. 95% Confidence intervals estimated via non‐parametric bootstrap. Light grey dots represent party‐wave scores on each dimension. Summary dimensions are estimated based on a principal component analysis (PCA). For Left‐Right Economic, lower values indicate positions further to the left. For GALTAN, lower positions are more GAL. For European Union, lower values are more Eurosceptic. For Regions, lower values are more supportive of decentralization. Details regarding the PCA and the estimation of the scores are presented in the Supporting Information.
Internal coherence
With the ideological clusters in hand, we turn to comparing and contrasting CHES party family classifications with the ideological clusters. In particular, we focus on the degree to which a party family stays together under the cluster assignment (internal coherence) and the degree to which a party family is separate from other families under the cluster assignment (distinction).
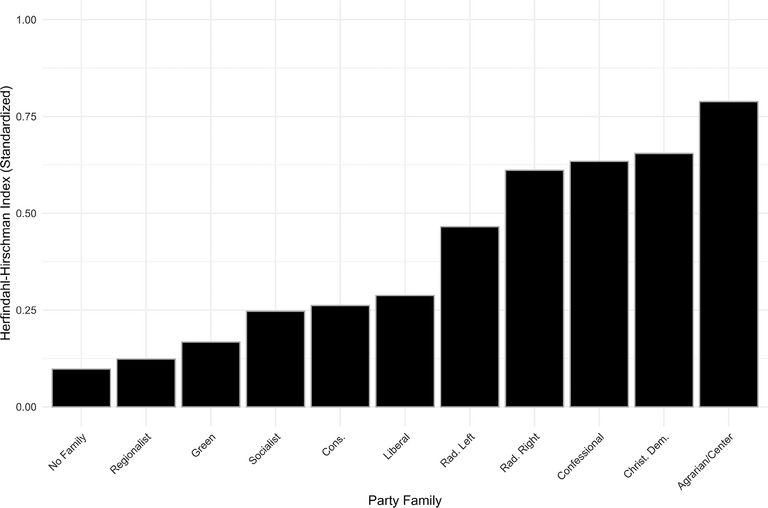
Table 1 displays the distribution of observations for each family across the ideological clusters as row percentages. Figure 3 plots the Herfindahl‐Hirschman index (HHI) – the sum of the square of each value in Table 1 by party family. We standardize the HHI to run from 0 to 1 with higher values indicating high levels of concentration. For our purposes, a high HHI in Figure 3 indicates that a family is more internally coherent because the MBC keeps the party family together in its classification. That is, families with a high HHI stick together when classified using non‐subjective criteria based solely on policy positions.
Table 1. Distribution of party families across clusters

Note: Table entries are row percentages.

Figure 3. Herfindahl‐Hirschman index by party family.
As one would expect, the ‘No Family’ party family has the lowest HHI, with its members distributed across several clusters. Additionally, the regionalist, greens, and socialist party families also have rather low HHI. Regionalist parties are primarily distributed between the center‐right pro‐EU, GAL‐left, and ethnic minority clusters, suggesting that the party family label obscures underlying heterogeneity. Similarly, almost 14 percent of green parties and 20 percent of socialist parties are categorized in the center‐right pro‐EU cluster. In general, it seems that MBC tends to split the mainstream left party families across multiple families, rather than keeping them together.
The party families of the right and center, however, tend to remain together as Carroll and Kubo's (Reference Carroll and Kubo2019, p. 250) findings suggest. A majority of parties from the agrarian/center, Christian democratic, liberal, and conservative party families are allocated to the center‐right pro‐EU cluster, which is the largest ideological cluster. Confessional parties, however, fit most commonly into the center‐right Eurosceptic cluster along with almost 20 percent of conservative parties.Footnote 6
MBC also keeps the radical left and radical right party families largely together. MBC classifies nearly 79 percent of radical right parties to the TAN cluster. Similarly, 69 percent of radical left parties are in the far left cluster.
In summary, MBC tends to split the mainstream left party families across ideological clusters, including non‐negligible proportions of these parties ending up in the center‐right pro‐EU cluster.Footnote 7 The radical right and radical left party families, in comparison, stick together to a higher degree. Mainstream party families on the right remain largely together as well. The next section, however, will demonstrate that internal coherence does not always translate into differences between families.
Inter‐family distinction
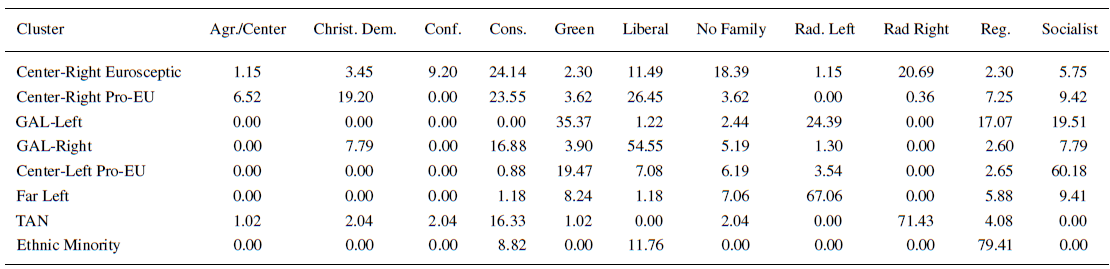
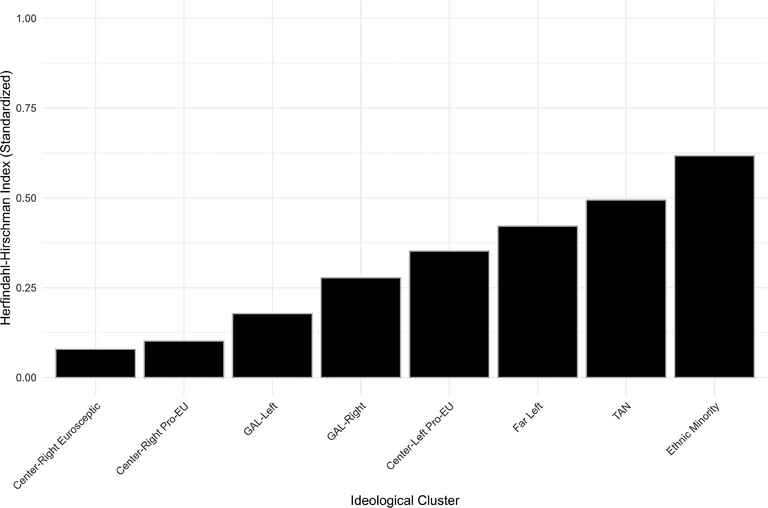
Table 2 and Figure 4, below, follow the same methodology as Table 1 and Figure 3, but with the ideological clusters as the rows and the party families as the columns. In this case, high HHI values indicate that an ideological cluster's members come primarily from a single or small number of party families. A low value indicates that an ideological cluster's membership is diverse concerning the party family of its members.
Table 2. Distribution of clusters across party families

Note: Table entries are row percentages.

Figure 4. Herfindahl‐Hirschman index values by ideological cluster.
This logic is clearest in the case of the ethnic minority cluster. Seventy‐nine percent of the party‐waves that MBC allocated to this ideological cluster are from the regionalist party family. This is not the same as most regionalist parties ending up in the ethnic minority cluster. Table 1 shows that MBC allocates only 35 percent of regionalist parties to the ethnic minority cluster. Therefore, there is a subset of regionalist parties who do warrant separation from other party families when evaluated solely on policy positions, but this subset constitutes a minority of regionalist parties. The TAN cluster also has a high HHI in Figure 4. Seventy‐one percent of its party‐waves come from the radical right. Unlike the ethnic minority cluster, however, the TAN cluster contains nearly 79 percent of radical right parties. High internal ideological coherence and differentiation from other families, in the case of the radical right, indicates that this party family label effectively identifies a distinct political offer. This is not surprising as the radical right's defining characteristics are programmatic, not historical (Mudde, Reference Mudde2019; Mudde & Kaltwasser, Reference Mudde and Kaltwasser2017).
At the other end of Table 2 and Figure 4, the center‐right pro‐EU and center‐right Eurosceptic clusters have the lowest HHI indices. In essence, these ideological clusters pool parties from a variety of party families on the broadly construed mainstream political right. Many of these same party families were among the most internally coherent in Table 1. This combination of internal similarity but a low degree of inter‐family differentiation indicates that the party family labels make distinctions that do not map onto substantive ideological differences.
The center‐left pro‐EU, GAL‐left, and far left clusters, which more or less correspond to the socialist, green and radical left party families, have intermediate HHI values. These ideological clusters have pluralities from one of the left‐wing party families, and they primarily draw from other left‐wing families. Therefore, while the right party families tend to stay together but end up in large, diverse ideological clusters, MBC mixes the left party families while still identifying the necessity of several distinct left ideological clusters. Very few right parties families are classified into the left clusters. So, MBC does discriminate between left and right party families. On the right, the mainstream parties split by positioning vis‐à‐vis European integration rather than historical origins. On the left, historical differences seem to have more staying power.
Regional differences
Next, we turn to whether there is meaningful regional variation. Existing party family categorizations apply the party family categories, which were primarily developed in the context of Western Europe, to parties in Eastern Europe. MBC received no indication of regional origins, so the identification of ideological clusters with either a very large or very small proportion of parties in the East indicates that the cross‐regional family scheme obscures sufficient ideological dissimilarities between regions as to warrant specific classification.
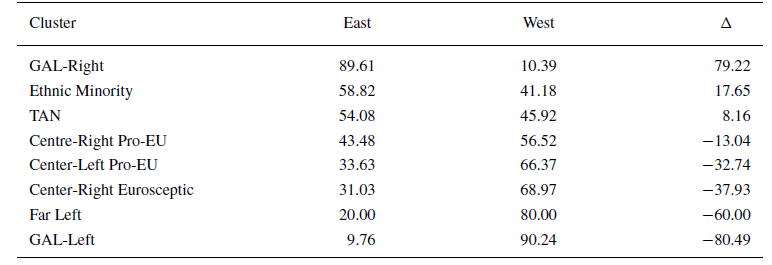
Table 3 displays the percentage of party‐waves in each ideological cluster from the East and West.Footnote 8 The final column is the difference between the two. The GAL‐right cluster is the clear standout on the table. Nearly ninety percent of cases in this ideological cluster are East European. This cluster has the most pro‐EU median position of any group, with notable parties including Civic Platform in Poland, the Hungarian Socialist Party, Citizens for European Development of Bulgaria, and (as its only major West European case) Macron's En Marche (Rovny, Reference Rovny2022).
Table 3. Regional differences in cluster preponderance

Note: Table entries are row percentages.
The ethnic minority cluster also stands out. Most of these parties are regionalist parties by family. However, a closer analysis of the categorization reveals that the most significant parties in this ideological cluster are East European parties that represent ethnic minorities. The three largest cases in this ideological cluster by vote share are the Movement for Rights and Freedoms in Bulgaria (representing the Turkish minority), the Hungarian Coalition in Slovakia, and Most–Híd (Bridge) – a multiethnic party in Slovakia. While these minorities are regionally concentrated, their commitments seem more ethnic than regional. No West European party in the ideological cluster received more than 4.6 percent of the vote, and even this was achieved by the Swedish People's Party in Finland, another party representing an ethnic minority with a proximate country where it is the majority.
Together, these ideological clusters and case examples indicate that MBC detects specific combinations of ideological positions that constitute an important part of political supply in the East that are rare in the West. The canonical party family labels, however, obscure these differences by trying to apply a common classification scheme across regions.
Temporal dynamics
One additional benefit of MBC is that it can allocate parties to different ideological clusters over time. This is a stark contrast to the cleavage approach. While the past is immutable, party positions are not. MBC can consider whether a party's positions have changed sufficiently to warrant reassignment.
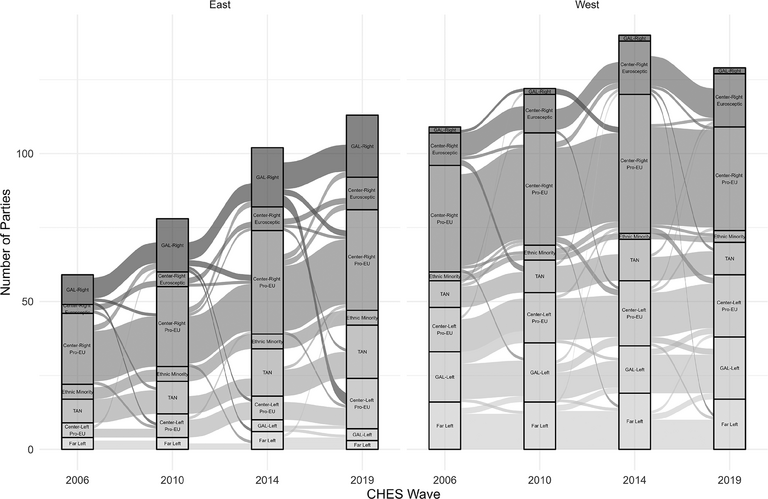
Figure 5 is an alluvial plot depicting parties’ movements between CHES waves disaggregated by region.Footnote 9 To maximize the legibility of the figure, the ideological clusters have been ordered in ascending order by their average values on the general left‐right dimension with the furthest right ideological clusters on top. The clearest takeaway is that stability predominates. Indeed, just under eighty‐two percent of parties remain in the same ideological cluster in every wave for which they are present in the data (see Figure 3A in the online appendix). Of the parties that change, two‐thirds change only a single time.

Figure 5. Party movements alluvial plot.
However, Figure 5 also shows that there is movement predominantly between relatively proximate ideological clusters. For example, transitions between the GAL‐left and center‐left pro‐EU clusters in the West are fairly common, but there are no cases where a party from the GAL‐left cluster is then allocated to the TAN cluster. Lega, as a notable case, changes ideological cluster twice. In 2006, Lega is in the Center‐right Eurosceptic cluster. However, in 2010 and 2014, MBC allocates Lega to the TAN cluster, indicating that its position sufficiently shifted to warrant placement among radical right parties. In 2019, Lega returns to its original cluster.
The upshot here is that MBC identifies a strong trend towards stability in ideological cluster assignment while being flexible enough to capture substantive changes in party positions. Crucially, MBC makes these decisions based on non‐subjective factors. This is a significant improvement in terms of both replicability and transparency over subjective decisions made by researchers operating on different or difficult‐to‐assess mental models of when a party warrants reclassification, if reclassification is even an option.
Conclusion
This research note analyzes the degree to which canonical party family labels continue to summarize the supply side of contemporary European politics. We use model‐based clustering to generate non‐subjective, empirically replicable clusters based on four waves of the Chapel Hill Expert Survey. This allows us to investigate both the degree to which party families remain together and the degree to which they are clustered separately from other parties. We also evaluate regional and temporal variation.
These comparisons lead us to three primary results. First, internal consistency and cross‐group differentiation are unevenly distributed across the ideological spectrum. MBC classifies party families on the right into a few large ideological clusters, suggesting that historical ideological differences between these party families have faded in contemporary European politics. Taking current ideological positioning into account, their differences seem insufficient to warrant categorizing them into distinct ideological groups. Instead, MBC divides the mainstream right parties based on the orientation towards European integration.
In contrast, MBC returns three ideological clusters that roughly correspond to the radical left, green, and social democratic party families, but these party families are more likely to be distributed across ideological clusters rather than kept together. This finding suggests high levels of ideological heterogeneity within left‐wing party families. However, MBC does identify a noted cleft between left‐ and right‐wing party families with a relatively small, though not ignorable, number of social democrats and greens crossing into the two large center‐right clusters.
Second, there is evidence of regional differences. Specifically, the model identifies two ideological clusters that consist largely of parties from Eastern Europe. This indicates that applying a single set of categories ‐ based on the West European experience ‐ across regions, as is common practice, likely obscures ideological variation within and between party families. Future work might even consider using MBC to create a bespoke set of party clusters to specifically model party competition in this region.
Third, MBC finds that most party‐cluster allocations are stable across time, which fits with previous research that parties' position' evolves slow (Hooghe & Marks, Reference Hooghe and Marks2018). However, MBC identifies instances where positional change is sufficient to reallocate a party's ideological cluster. That it does so based on a non‐subjective criterion is a substantial improvement over subjective approaches both in terms of transparency and replicability.
These results demonstrate that although party families may be useful to answer many research questions, they do not optimally summarize contemporary ideological party commonalities in contemporary Europe. If researchers wish to identify a set of parties for comparison based on party ideology, MBC is a more precise and replicable tool than classifications based on historical origin. Of course, the right tool must be used for the right task, and MBC may not be the appropriate tool for all research questions. By identifying incongruencies between ideological clusters and party families, we aim to raise awareness, so scholars can select the proper approach for their research question, not supplant or invalidate any existing approach writ large.
With this said, MBC provides researchers with a tool that may prove particularly useful in developing party classifications where party families are not commonly used. MBC in these contexts, such as Latin America or Africa, could help to identify meaningful ideological party groupings, which may prove beneficial in identifying comparable cases for studying or theorizing the causes of important outcomes. Even in a context where parties lack sufficiently crystallized ideological programs, MBC could be used to create categories based on factors such as party organizational characteristics or based on linkage types (Kitschelt & Wilkinson, Reference Kitschelt and Wilkinson2007). MBC could also prove effective for evaluating other data sources on political parties, such as party membership surveys, candidate surveys, or manifesto data. Identifying ideological heterogeneity within parties or clusters based on issue salience or the ideas above, for example, are just some natural applications of MBC that could continue to expand our understanding of political parties in an increasingly volatile party landscape.
Acknowledgements
This paper benefited from generous support from many friends and colleagues. In particular, we would like to thank Gary Marks, Liesbet Hooghe, Jonathan Hartlyn, Cecilia Martinez‐Gallardo, Ann‐Kristin Kölln, Ryan Bakker, Alejandro Ecker, Lena Huber, and the participants of the UNC Methods and Design Workshop for their generous advice and recommendations. We would also like to acknowledge the three anonymous reviewers whose insightful comments substantially improved this article.
Online Appendix
Additional supporting information may be found in the Online Appendix section at the end of the article:


 Open access