


1. Introduction
There were approximately 11.4 million undocumented immigrants residing in the US in 2017, accounting for around 30% of total immigrants (Baker, Reference Baker2021). Undocumented immigrants earn as much as 10% less than documented immigrants (Borjas & Cassidy, Reference Borjas and Cassidy2019). This wage gap may reflect that legal status is either correlated with an individual’s characteristics or directly affects labor market outcomes.
Lack of legal status may hurt immigrants’ labor market outcomes in two primary ways. First, undocumented immigrants may opt for jobs with a lower risk of being caught and deported. This restriction adds constraints to their job search and may push them into less desirable jobs, or discourage them from working altogether. Second, lack of legal status may also prevent undocumented immigrants from working for employers who run E-Verify to check employment eligibility.
In this paper, I examine the effects of temporary legal status on labor market outcomes among undocumented immigrants using the Deferred Action for Childhood Arrivals program (hereafter DACA) as a quasi-experiment. DACA, which was introduced in 2012, granted temporary legal status to individuals who had been brought into the US as children to reside and work without the constant threat of deportation. However, DACA does not provide a path to permanent legal status and recipients have to renew their status every 2 years.
I measure the effects of DACA eligibility on several labor market outcomes using a regression discontinuity design (RDD). To be eligible for DACA, an immigrant needs to have been under 31 years old on June 15, 2012. So, I compare the labor market outcomes of immigrants who were just above versus below the age of 31 in 2012. I focus on non-citizen immigrants who would otherwise be eligible for DACA, and compare people on one side to people on the other side of the threshold. Nonetheless, the eligibility criterion which I do not observe is the legal status of an immigrant. In practice, about 60% of 8.3 million non-citizen young adult immigrants are undocumented (Acosta et al., Reference Acosta, Larsen and Grieco2014; Baker, Reference Baker2021) while over 60% of DACA-eligible individuals applied for DACA as described in detail in Section 2. Thus, there are up to 36% changes in DACA uptake between one side of the threshold and the other. This paper measures the local average treatment effects of being on one side of the threshold versus just on the other side of the threshold, i.e., I measure an intention-to-treat type parameter rather than a treatment effect. For the remainder of the paper, I will refer to this as measuring the effect of DACA eligibility, though technically some people in the sample are not DACA-eligible regardless of which side they are on because they already have legal status. Although my effects are estimated locally and are difficult to generalize to the entire DACA population, I also attempt to gauge the upper bound estimates of DACA treatment effects from my intention-to-treat estimates and discuss more in Section 5.3.
I have four primary findings. First, depending on specifications, I find DACA eligibility yields between no effect and a 2% increase in the probability of working. It is most likely driven by individuals with at least a college degree.Footnote 1 Second, I find no effect on the probability of working in the last year, on the number of weekly working hours among likely eligible immigrants, and wage income. Third, DACA eligibility does not increase the probability of receiving health insurance from employers, suggesting a limited effect on the probability of working in a large-scale formal employment setting, where they are more likely to provide health insurance. Fourth, I find zero effects on job skill requirements, which are math skills, critical thinking, creativity, science knowledge, and the number of years of schooling of typical people in each occupation. These findings suggest that DACA eligibility had little effects on immigrants’ ability to find high-skilled jobs.
Because there is likely a priori that DACA eligibility would have improved labor market outcomes like hours, compensation, and occupational skill usage, I next consider what magnitude of positive effects can or cannot be statistically rejected. Taking the upper end of my confidence intervals (CI) and then adjusting for likely uptake rates, I find that the largest plausible treatment effect on the probability of being employed is 3 percentage points (ppts); on the probability of working last year is 2 ppts; and on weekly working hours is 1.2 h. For comparison, using a difference-in-differences approach, Pope (Reference Pope2016) finds DACA increases the probability of being employed by around 7 ppts (CI: 3–10 ppts); increases the probability of working last year by 4 ppts (CI: 0.8–7 ppts); and increases weekly working hours by 1.8 h (CI: 0.3–3.2 h).Footnote 2 However, Hamilton et al. (Reference Hamilton, Patler and Savinar2021) use the California Health Interview Survey and show that DACA has no impact on labor force participation (CI: −0.09 to 0.19 ppts) or the likelihood of finding employment (CI: −0.19–0.16 ppts) using DACA-ineligible undocumented immigrants as a control group. That is, my CIs generally overlap with those estimates by Pope (Reference Pope2016), but the region of overlap is at the low end of his CIs. My point estimates are most consistent with those of Hamilton et al. (Reference Hamilton, Patler and Savinar2021). Taking my estimates together with the previous literature, it seems likely that DACA may have improved participants’ labor market outcomes, but only moderately so. They are using a difference-in-differences framework while I am measuring a local average treatment effect for the oldest eligible cohorts of DACA, my estimates are not entirely comparable to theirs. In Section 5.3, I discuss the sample construction and the trade-off between statistical power and validity of empirical design.
Apart from the papers discussed above, there are several studies on the effects of DACA on educational attainment (Amuedo-Dorantes & Antman, Reference Amuedo-Dorantes and Antman2017; Henderson et al., Reference Henderson and Sperlich2023; Hsin & Ortega, Reference Hsin and Ortega2018; Kuka et al., Reference Kuka, Shenhav and Shih2020), health and health insurance (Bae, Reference Bae2020; Giuntella & Lonsky, Reference Giuntella and Lonsky2020; Giuntella et al., Reference Giuntella, Lonsky, Mazzonna and Stella2021), job mobility (Amuedo-Dorantes & Antman, Reference Amuedo-Dorantes and Antman2017; Villanueva Kiser & Wilson, Reference Villanueva Kiser and Wilson2024). Although many of them finds that DACA improves the lives of DACA participants, several research shows mixed or null impacts on distinct groups of DACA recipients (Amuedo-Dorantes & Antman, Reference Amuedo-Dorantes and Antman2017; Hamilton et al., Reference Hamilton, Patler and Savinar2021; Henderson et al., Reference Henderson and Sperlich2023). For example, Amuedo-Dorantes and Antman (Reference Amuedo-Dorantes and Antman2017) find positive effect on the likelihood of being employed among young non-citizen men, but not among women or other labor outcomes such as weekly working hours or hourly wage. Similarly, Hamilton et al. (Reference Hamilton, Patler and Savinar2021) report highly mixed effects on labor force participation and no significant effects on the probability of being employed, depending on whether DACA-ineligible or documented immigrants are used as control groups. Regarding job mobility, Amuedo-Dorantes and Antman (Reference Amuedo-Dorantes and Antman2017) find no effect on the probability of moving to high-skilled occupations, while Villanueva Kiser and Wilson (Reference Villanueva Kiser and Wilson2024) report a positive effect on the propensity to work in high-skilled occupations. Villanueva Kiser and Wilson (Reference Villanueva Kiser and Wilson2024) also conclude that they do not find significant effects on the movement of math and social skills. Zaiour (Reference Zaiour2023) shows that DACA increases employment in essential and licensed occupations, but not analytical-intensive tasks; however, the parallel trend does not strictly hold for outcome variable on essential occupation, casting doubt on this finding. In general, these mixed findings on the effects of DACA on various outcomes, particularly labor market outcomes and job mobility, underscore the importance of the research question in this paper. These contradictions may imply the difference in sample construction or potential issues in econometric models. Thus, it is important to examine this question in a different method. This paper departs from and contributes to existing literature in four primary ways. First, I construct a more comparable sample by assigning the treatment status to non-citizen individuals based on their ages in 2012. Second, this sample construction measures the effect of DACA eligibility on a group of likely older DACA individuals. This group enables me to examine the effects of DACA without the concerns about discontinuities on either side of the thresholds that arise when using age of arrival.Footnote 3 Furthermore, it is important to document the effects of DACA on this group because people in that age group accounted for the highest proportion of undocumented immigrants in the USFootnote 4 and are in their prime working ages. There is a common misconception that this group of DACA recipients has been addressed by Pope (Reference Pope2016),Footnote 5 indicating positive effects on several labor market outcomes. However, the findings in this paper show null effects, which is similar to the effects by Pope (Reference Pope2016) after adjusting for a coding error. See Section 5.3 for more details. Third, this paper implements a regression discontinuity design to examine the effects of DACA on various outcome variables of interest, which overcomes potential parallel trend issues in previous studies. Several studies have integrated elements of RDD into the difference-in-differences approach to estimate effects on specific groups (Amuedo-Dorantes & Antman, Reference Amuedo-Dorantes and Antman2017; Pope, Reference Pope2016). While that combination offers advantages in policy interpretation, it still relies on the parallel trend assumption. Fourth, this paper expands the set of outcome variables, which includes job skills measured by O*NET data, the probability of having employer-sponsored health insurance, and the years of schooling of typical people in a specific occupation.
This paper also contributes to the broader literature on the effects of the legalization of undocumented immigrants on their labor market outcomes, both in the U.S. (Kossoudji & Cobb-Clark, Reference Kossoudji and Cobb-Clark2002) and in other countries such as Italy (Devillanova et al., Reference Devillanova, Fasani and Frattini2018), Spain (Elias et al., Reference Elias, Monras and Vazquez-Grenno2022), and Colombia (Ibáñez et al., Reference Ibáñez, Moya, Ortega, Rozo and Urbina Florez2022). These studies find that legalization generally has positive effects on labor market outcomes. However, the context examined in this paper is different, focusing on temporary legalization rather than the permanent legalization provided by the Immigration Reform and Control Act of 1986 in the U.S. Furthermore, the profiles of undocumented immigrants in the U.S. differ significantly from those in other countries. For instance, asylum seekers represent a larger proportion of immigrants in Europe compared to the U.S. Additionally, children of undocumented immigrants in Europe also remain undocumented due to the absence of birthright citizenship, and the demographic composition of undocumented immigrants in Europe is more diverse than in the U.S.Footnote 6
The remainder of this paper is divided as follows. Section 2 describes the DACA program and its eligibility criteria. Section 3 depicts my dataset. Section 4 constructs my econometric models. Section 5 presents and discusses the main results. Section 6 performs robustness checks. Section 7 concludes.
2. DACA program
“… Dreamers. These are young people who study in our schools, they play in our neighborhoods, they’re friends with our kids, they pledge allegiance to our flag. They are Americans in their heart, in their minds, in every single way but one: on paper. They were brought to this country by their parents – sometimes even as infants – and often have no idea that they’re undocumented until they apply for a job or a driver’s license, or a college scholarship.”Footnote 7
DACA was introduced by President Obama on June 15, 2012, as a substitute for Dream Act legislation. DACA provides a solution to the long-term residence of millions of undocumented immigrants who had been brought to the US by their parents as a child. It allows recipients to remain in the country with temporary lawful status. DACA recipients may apply for work authorization to legally work in the US. In many states, DACA status additionally enables undocumented immigrants to acquire occupational licenses (Liang, Reference Liang2023). However, DACA does not provide a path to permanent residency, therefore, DACA recipients have to renew their status every 2 years.
To be eligible for DACA, an individual has to qualify for all of the following requirements: (a) they must be undocumented as of June 15, 2012; (b) they entered the US before their 16th birthday; (c) they must be under 31 as of June 15, 2012; (d) they must have constantly resided in the US since June 15, 2007; (e) they must be either enrolled in school, have obtained a high-school diploma, general education development, or be an honorably discharged veteran of the Coast Guard or Armed Forces of the United States; f) they must have no record of a felony or have significant misdemeanors.
Nonetheless, the precise estimate on the number of DACA-eligible population is challenging due to the shortage of administrative data. According to the Migration Policy Institute, there are over 1.3 million DACA-eligible individuals. This estimate does not account for some criteria that are unavailable to researchers, which are criminal records and continuous presence in the US. So, this estimate is on the high end of the range of DACA-eligible population.Footnote 8 There were over 800,000 immigrants who had ever been DACA holders, which made up around 60% of the total DACA-eligible population. Of those who did not apply for DACA, 43% of them claimed that they couldn’t afford the application fee, while 22% were missing the required paperwork and 17% were afraid that the DACA application process would expose them to authorities (Watson & Thompson, Reference Watson and Thompson2022). As of March 2024, around 528,000 individuals had active DACA status because a proportion of DACA holders either failed to renew their status or adjusted to long-term legal status.Footnote 9
During the 2016 presidential election, DACA was one of the most controversial topics between the candidates. After President Trump announced that his administration would end DACA on September 5, 2017, the Department of Homeland Security began phasing out the program, initially halting new applications and ending renewals for permits that expired after March 5, 2018. This decision faced several legal challenges during the next 2 years; however, it significantly impacted the number of new DACA applicants. On June 18, 2020, the Supreme Court ruled 5-4 that the Trump administration’s attempt to end DACA was unlawful. However, it was not until December 4, 2020, that a federal judge ordered the Department of Homeland Security to fully reinstate DACA, including accepting new applications and granting work permits. Figure 1 shows the total number of DACA recipients as well as the number of initial and renewal recipients from 2012 to 2020. The number of initial DACA recipients peaked in 2013 and began to decline in 2014, reaching almost 0 in 2019 and 2020 as a results of legal battles during the Trump administration. These legal challenges affected not only the number of new DACA applications but also had negative impacts on DACA recipients. For example, self-reported health among DACA recipients and their children worsened (Patler et al., Reference Patler, Hamilton, Meagher and Savinar2019), labor market outcomes also negatively impacted (Zaiour, Reference Zaiour2023). Upon assuming office, the Biden administration has made several attempts to codify DACA into federal regulation. However, these efforts have encountered repeated challenges. Following a court ruling that deemed their actions unlawful, the administration issued a final rule on DACA, only to face another legal challenge in June 2023.
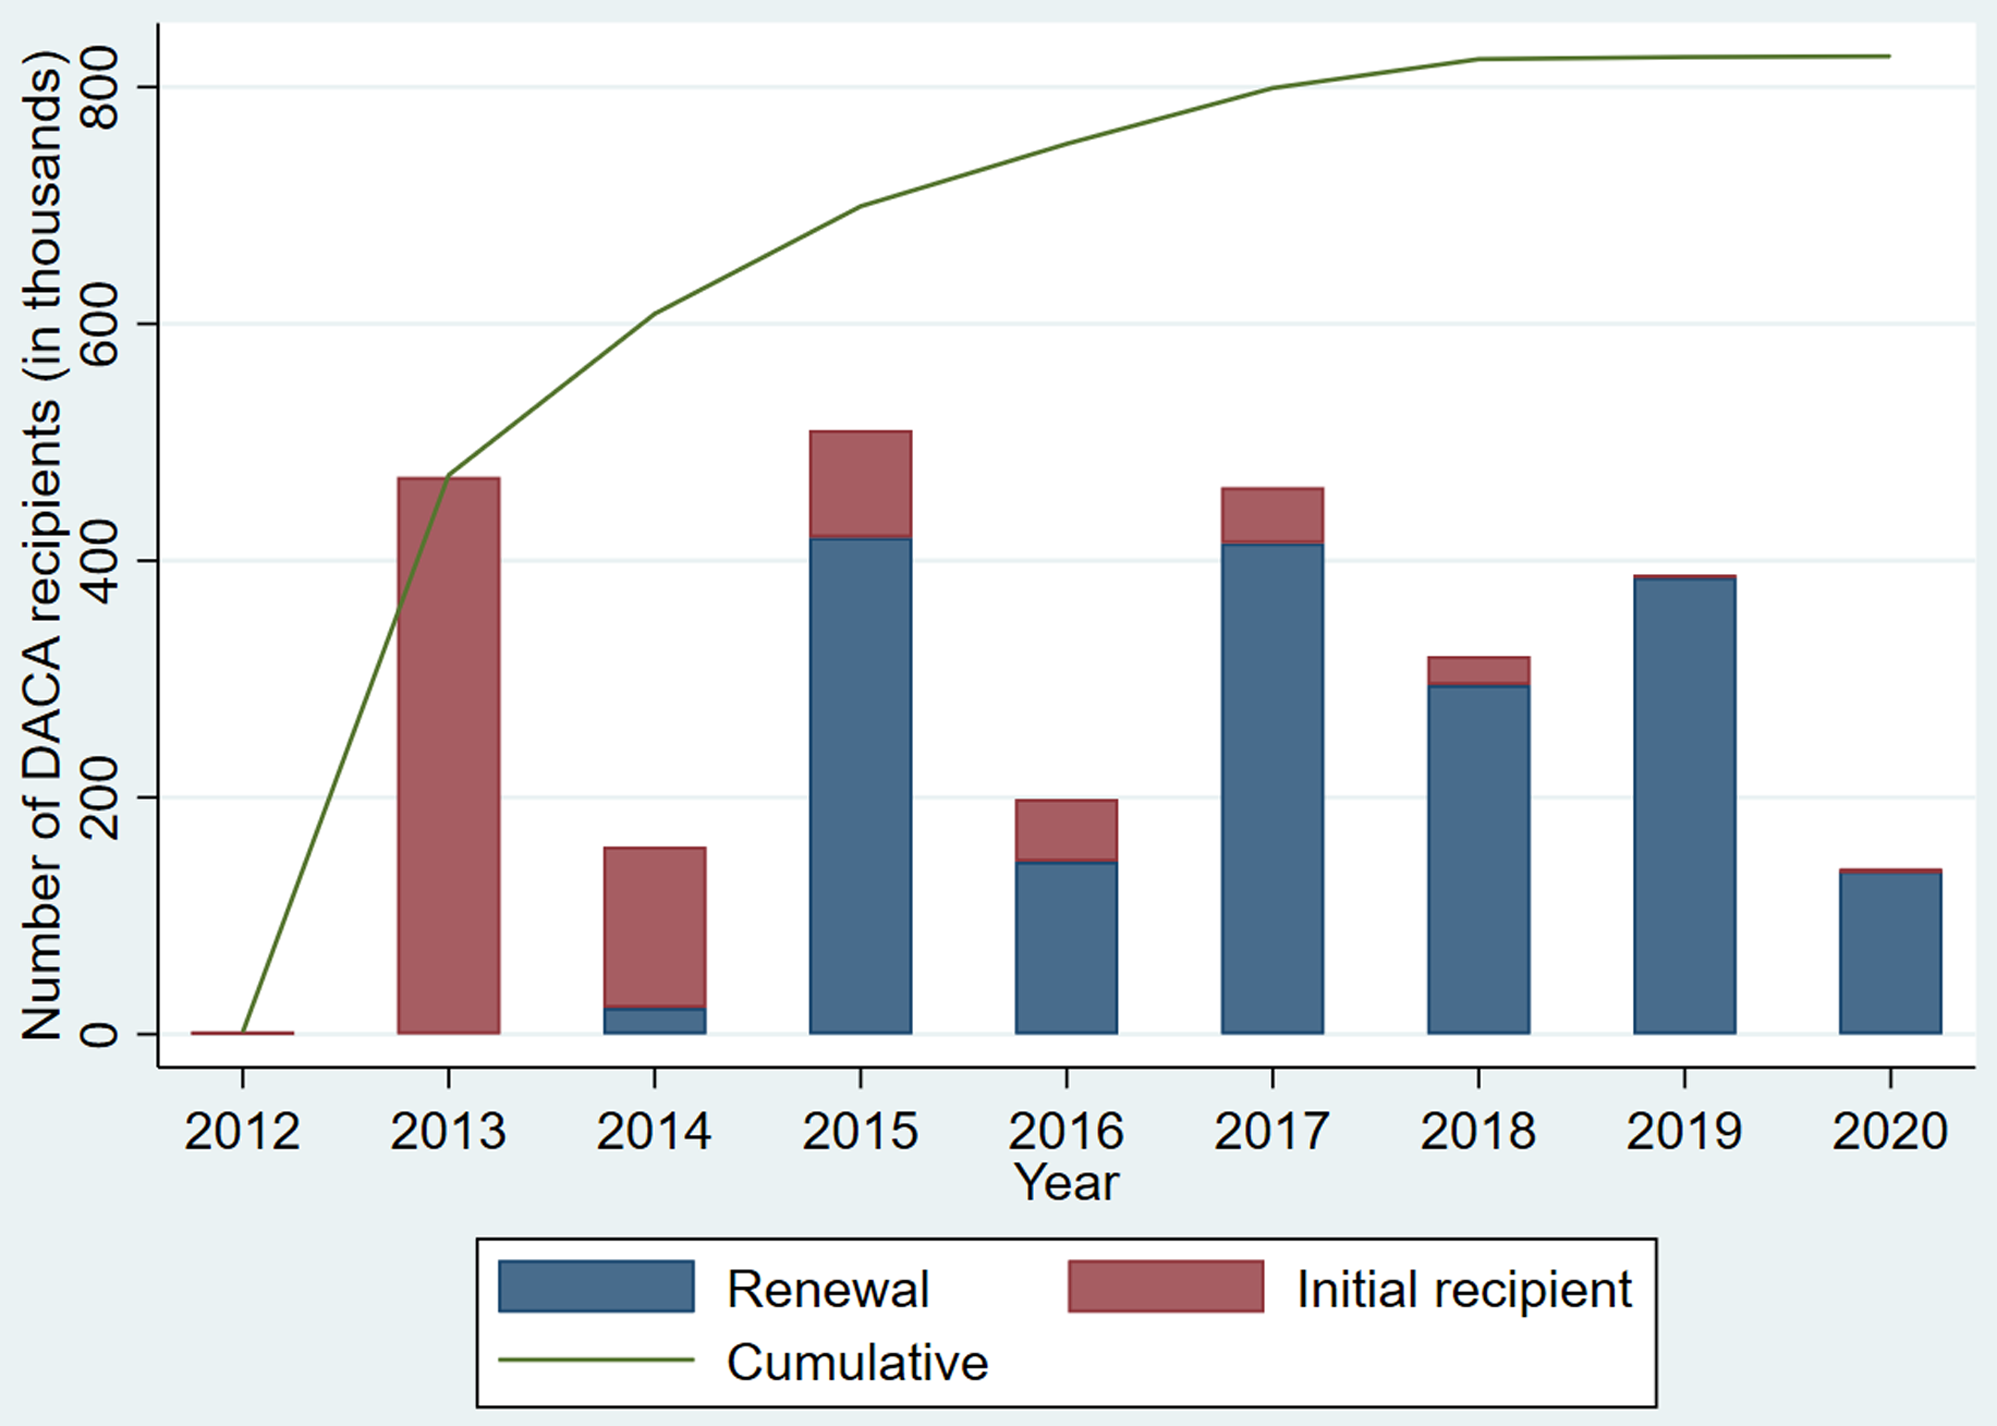
Figure 1: The number of cumulative, initial, and renewal DACA recipients.
Source: US Citizenship and Immigration Services.
DACA recipients reside in all 50 US states and the District of Columbia. Nonetheless, nearly half of them live in California and Texas. California alone made up for almost 29% of nationwide DACA recipients, while 17% of them name Texas as their home state. Figure 2 illustrates the map of DACA recipient distribution by state as of March, 2021.
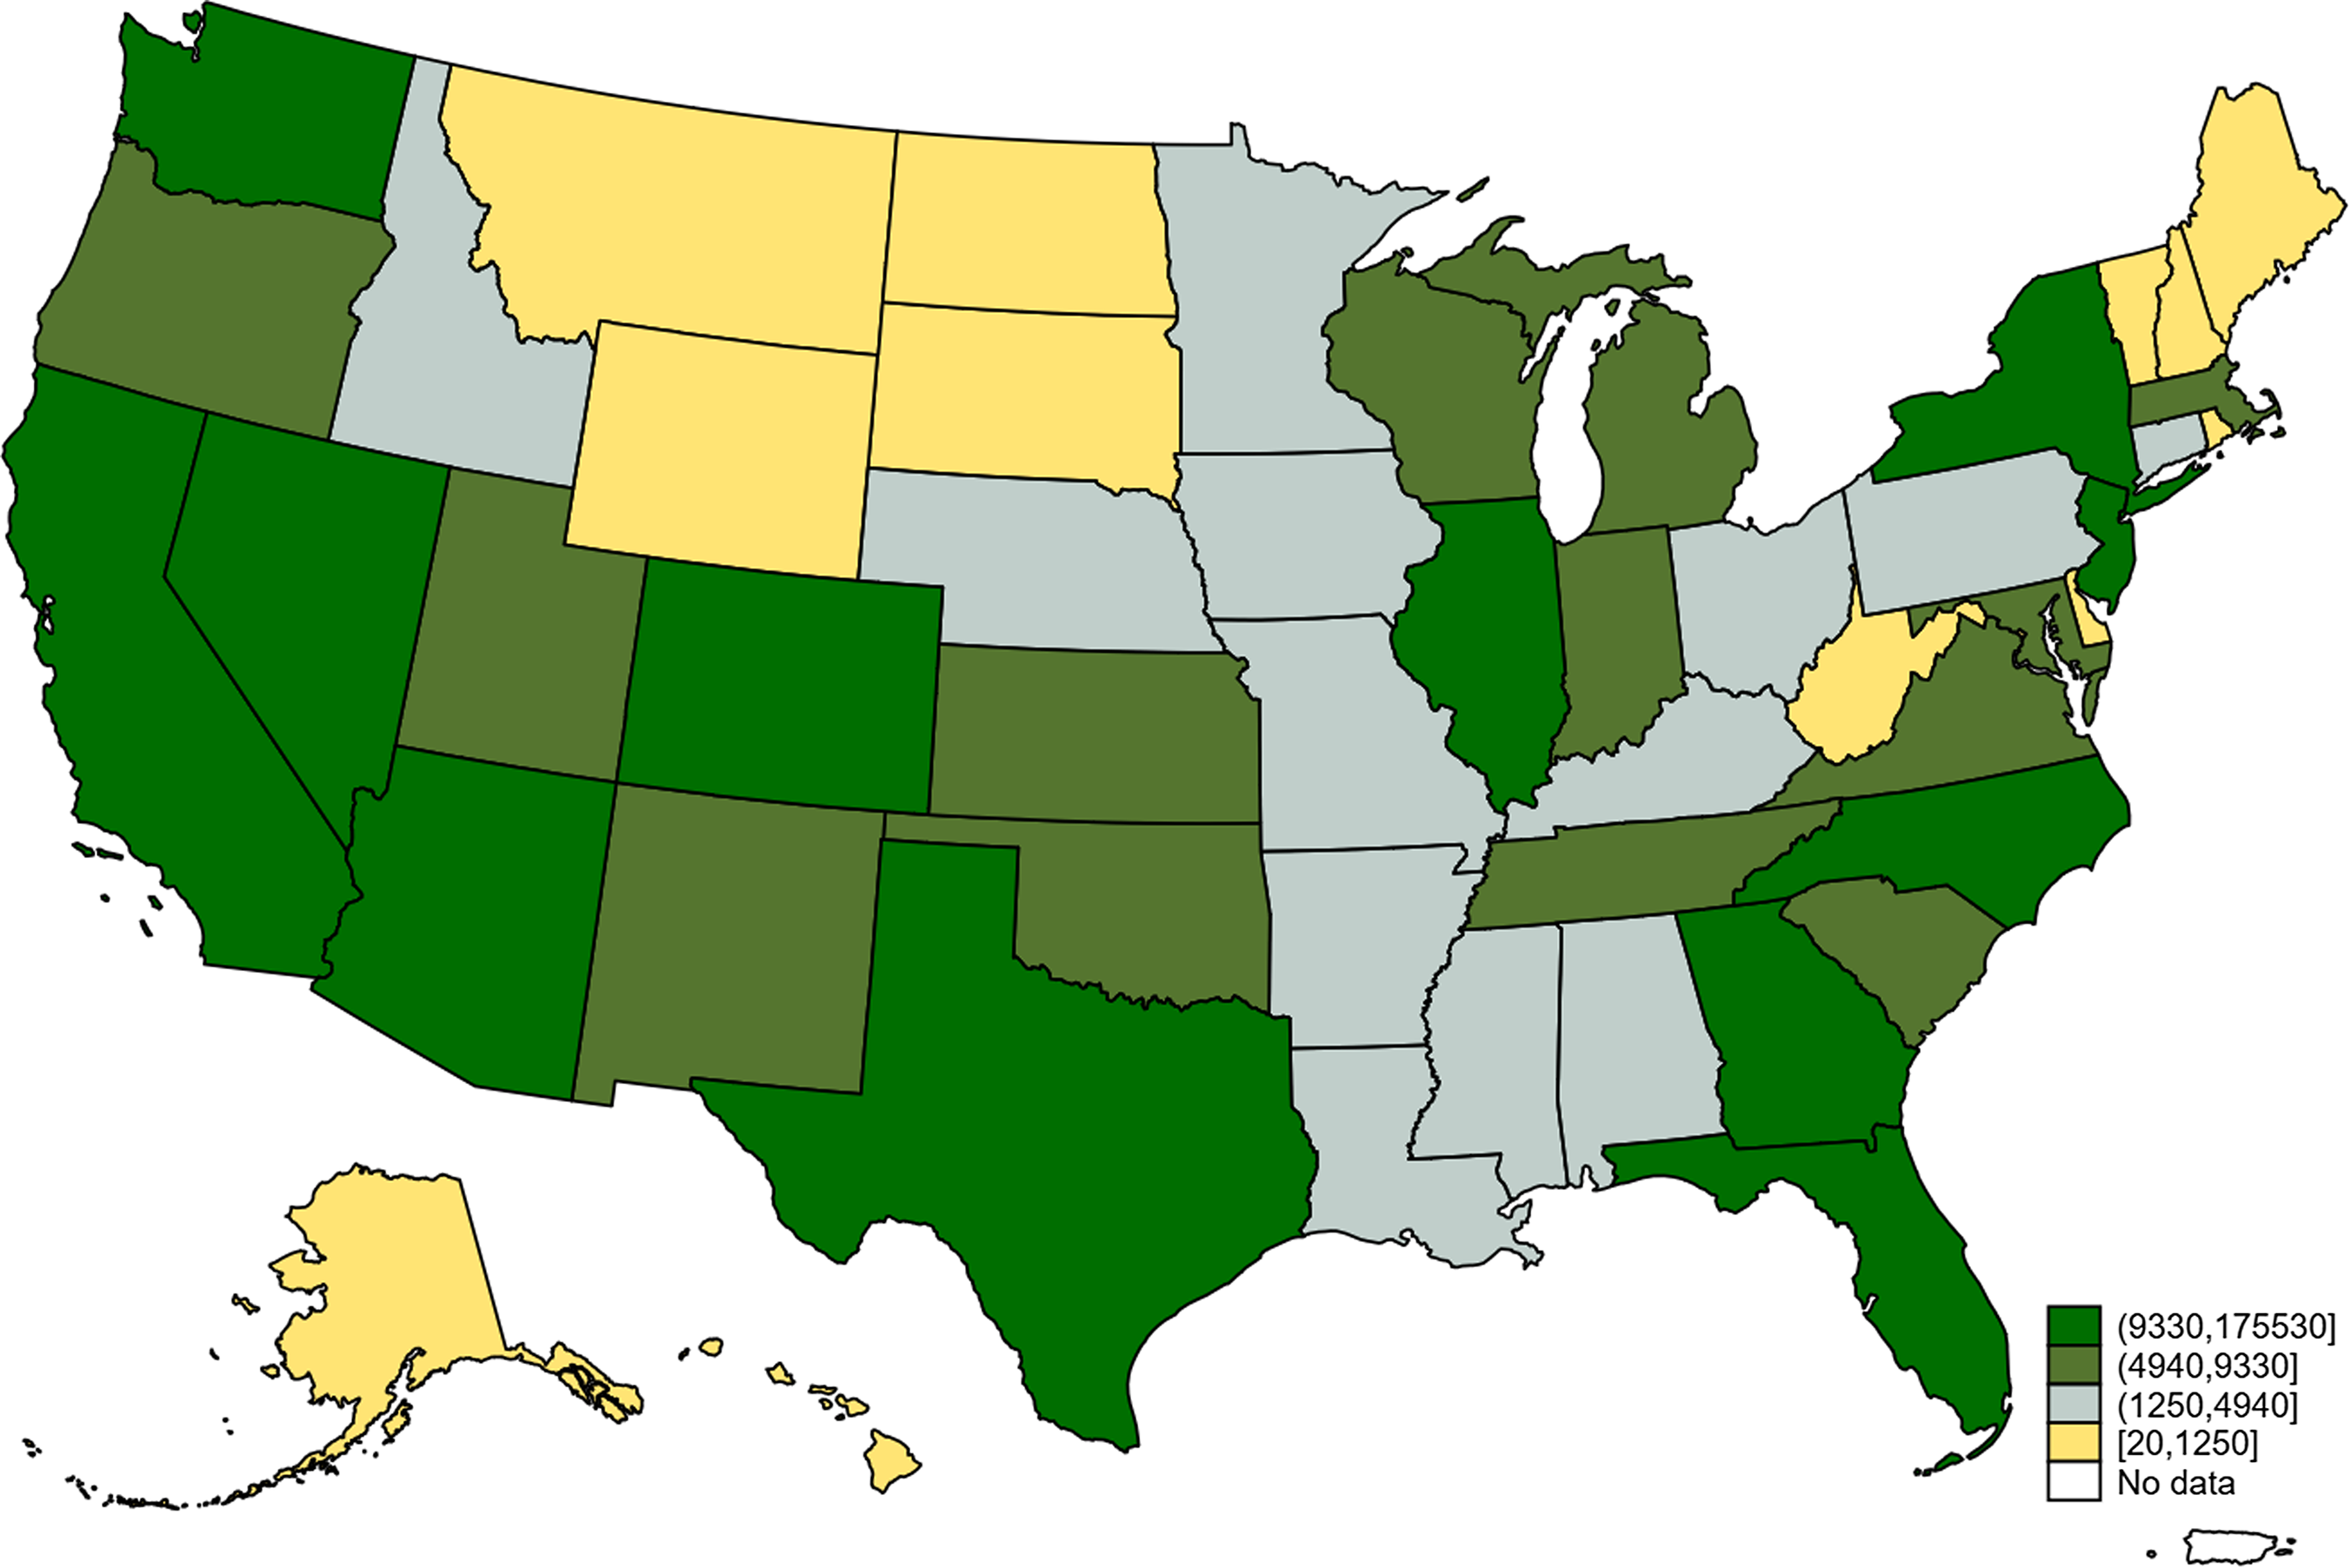
Figure 2: The number of DACA recipients by state.
Source: US Citizenship and Immigration Services.
3. Data and descriptive statistics
3.1. American community survey
In this paper, I use micro-level data drawn from the American Community Survey (ACS). American Community Survey is an annual survey conducted by the U.S. Census Bureau, which surveys both US and non-US citizens on citizenship, educational attainment, income, language proficiency, employment, and housing characteristics. The ACS selects its sample from the Master Address File and sends out mail surveys to the listed addresses at the start of each month. For individuals who do not respond to the mail survey, follow-up contact is made through phone interviews and in-person visits. From 2000 to 2019, the response rate among sampled households is around 95% on average. Importantly, the ACS interviews the resident population without regard to legal status or citizenship. It relies on a systematic sampling approach using US addresses, which means that undocumented immigrants are neither more nor less likely than documented immigrants and citizens to be included in the sample.
My ACS data is from 2013 to 2019.Footnote 10 To serve the purpose of this study, my data sample starts from 2013 because it is the first year that the effects are expected to have kicked in after the Department of Homeland Security started to accept DACA applications in late 2012. My data sample ends in 2019.
To construct my sample, I restrict my sample to only non-citizen individuals who are from 25 to 60 and satisfy all of the following requirements: a) they entered the US before their 16th birthday; b) they must have constantly resided in the US since June 15, 2007; c) they must have obtained a high-school diploma or equivalent. Then, I leverage the age in 2012 requirement to define likely DACA eligibility and likely DACA ineligibility.
ACS does not ask directly about the legal status of immigrants, so I assume all non-citizens are undocumented, following Pope (Reference Pope2016). This measure is contaminated by individuals who are permanent residents or on temporary visas.
I can directly observe non-citizen immigrants based on their places of birth and citizenship status. I use their age, year of immigration, and survey year to verify if they arrived in the US before their 16th birthday. I also assume that an individual who immigrated to the U.S. before 2007, has constantly presented in the U.S. as of June 15, 2012. Hence, I use the year of immigration to identify if an individual entered the US before 2007 in ACS. In addition, I can also observe if an individual has completed high school or equivalent and received their diploma.
After restricting my sample to individuals who met all the above requirements, I evaluate an individual’s age in 2012 from the survey year and the age when they were surveyed, which determines DACA eligibility (i.e., under 31 as of June 15, 2012). One complication in ACS data is that respondents are not asked directly about their year of birth. Data on the year of birth is inferred based on age and survey year. Moreover, ACS is surveyed year-round, which adds another layer of complication. For example, a person who was 30 in 2012 and was born in Quarter 1, was recorded as being born in 1982. However, this individual may be born in either 1981 Quarter 1 or 1982 Quarter 1. In other words, it is not reliable to use the year of birth to construct my running variable. Instead, I rely on age and quarter of birth to construct my sample and drop observations where the classification is ambiguous. I present my detailed approach on how to deal with this issue in Online Appendix A.
I examine several outcome variables using ACS data: probability of being employed, employer-sponsored health insurance, probability of working last year, and weekly working hours. I also construct a number of years of schooling required, which is the average of years of schooling across all individuals for each job.
3.2. O*NET
My second source of data is O*NET, which is developed under U.S. Department of Labor/Employment and Training Administration. O*NET is a source of occupational information, which measures skills, knowledge, and abilities, etc. on almost 1,000 occupations. To construct indices to measure job skills, I follow the paper by Mansfield & Slichter, Reference Mansfield and Slichter2021). For example, I construct the math index by taking an average of all measures from Mathematics (Skills), Mathematical Reasoning (Abilities), and Number Facility (Abilities). The details for all indices are as follows:
-
• Math: Mathematics (Skills), Mathematical Reasoning (Abilities), and Number Facility (Abilities).
-
• Creativity: Originality (Abilities) and Fluency of Ideas (Abilities).
-
• Critical thinking: Critical Thinking (Skills), Judgment and Decision-Making (Skills), Operations Analysis (Skills), Systems Analysis (Skills), Deductive Reasoning (Abilities), and Inductive Reasoning (Abilities).
-
• Science: Science (Skills), Biology (Knowledge), Chemistry (Knowledge), and Physics (Knowledge).
In O*NET data, most skills are measured by both the importance of skills and level of skills on a scale ranging from 0 to 100.Footnote 11 They are highly correlated, so I use the importance of skills as a measurement in this paper.
3.3. Crosswalks between ACS and O*NET
To assign job skill indices for each occupation, I use the occupation code as an identifier to merge O*NET data into ACS. While ACS uses Standard Occupational Code (SOC), O*NET data uses O*NET-SOC. O*NET-SOC has two levels of occupation codes: 6-digit code and 8-digit code. The 6-digit code might be divided into several 8-digit codes, depending on how specialized those occupations are. To serve the purpose of the job skill assignment, I take an average of skills of 8-digit O*NET codes that share the same first 6 digits. Then, I crosswalk between ACS and O*NET data using the 6-digit O*NET code.
3.4. Descriptive statistics
Table 1 displays the summary statistics for people who are non-citizen immigrants under 16 years old upon arrival in the US, entered the US before 2007, and have obtained a high-school diploma. I report the summary in two groups, one is DACA eligibles if individuals are under 31 years old in 2012 and ineligibles otherwise. Panel A represents people who are potentially eligible for DACA, they tend to be younger (28.97 versus 44.35 years of age); have lived in the US for a shorter time (19.94 versus 35.26 years); are less likely to be self-employed (0.07 versus 0.13) and have lower wage income (US$31,200 versus US$42,600) than people who are potentially ineligible for DACA. Panel B shows that in general, people who are potentially eligible for DACA, work in jobs that require lower job skills than people who are not.Footnote 12
Table 1. Summary statistics
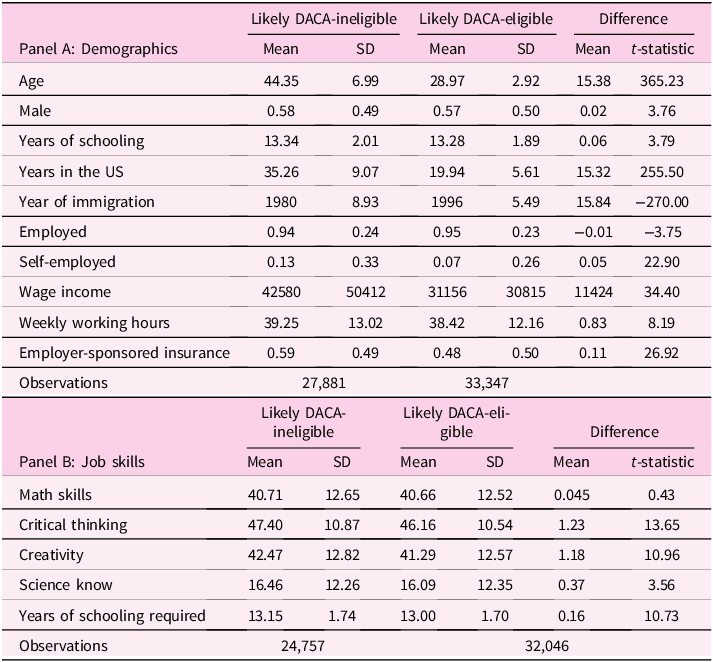
Notes: Sample in Panel A includes who arrived in the US before their 16 years old, before 2007, and have obtained high-school diploma. Sample in Panel B is conditional on being employed.
4. Econometric strategies
To identify the effects of DACA as a quasi-experiment on labor market outcomes, this paper exploits a parametric RDD. Two options that are potentially used as running variables: individuals’ age in 2012 and individuals’ age at arrival. Nonetheless, age at arrival is correlated with education (Evans & Fitzgerald, Reference Evans and Fitzgerald2017; Gonzalez, Reference Gonzalez2003) and English proficiency (Bleakley & Chin, Reference Bleakley and Chin2010). Therefore, it is correlated with labor market outcomes. Moreover, the RDD model based on age at arrival with a 16-year-old threshold faces limited support from the right side of the threshold due to another discontinuity at the age of 18. Specifically, individuals who immigrate at the age of 18 are more likely to have already completed high school and decided to move to the U.S. independently, whereas those who immigrate at younger ages may not have finished high school and typically relocate with their families. Consequently, in addition to the 16-year-old threshold, there exists a discontinuity at the age of 18, making it difficult to measure the limit from the right side of the 16-year-old threshold and estimate the RDD model. Thus, I leverage individuals’ age in 2012 as my primary running variable.
As explained in Section 3.1, I restrict my sample to only non-citizen immigrants who meet three out of four observable DACA criteria and then define a treatment group and a control group based on my running variable. Specifically, individuals who are under 31 as of June 15, 2012, are eligible and identified as a treatment group. On the other hand, individuals who are 31 or older are ineligible and classified as a control group in my setting. To simplify my notation and computation, I normalize individuals’ age in 2012. Let ${R_{it}}$
= individual’s age in 2012–31. Then,
${R_{it}}$
= individual’s age in 2012–31. Then,
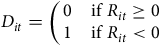 $${D_{it}} = \left( {\matrix{ 0 \hfill & {{\rm{if\;}}{R_{it}} \ge 0} \hfill \cr 1 \hfill & {{\rm{if}}\;{R_{it}} \lt 0} \hfill \cr } } \right.$$
is defined as a binary treatment variable.
The main empirical specification has the following form:
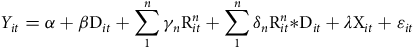 $${Y_{it}} = \alpha + \beta {{\rm{D}}_{it}} + \mathop \sum \limits_1^n {\gamma _n}{\rm{R}}_{it}^n + \mathop \sum \limits_1^n {\delta _n}{\rm{R}}_{it}^n{\rm{*}}{{\rm{D}}_{it}} + \lambda {{\rm{X}}_{it}} + {\varepsilon _{it}}$$
in which ${Y_{it}}$
refers to the outcome variables of interest of individual i at time t. In this parametric regression discontinuity,
${Y_{it}}$
refers to the outcome variables of interest of individual i at time t. In this parametric regression discontinuity, $n$
indicates the order of the polynomial function, where
$n$
indicates the order of the polynomial function, where $n = 1,2,3$
are linear, quadratic, and cubic functions respectively. The coefficient of interest
$n = 1,2,3$
are linear, quadratic, and cubic functions respectively. The coefficient of interest $\beta $
measures my RDD intention-to-treat effects.
$\beta $
measures my RDD intention-to-treat effects.
This model also includes a vector of control variables ${{\rm{X}}_{it}}$
, which controls for sex, years of education, and number of years in the US.Footnote 13
${{\rm{X}}_{it}}$
, which controls for sex, years of education, and number of years in the US.Footnote 13
In this paper, the running variable is discrete, with 42 mass points (i.e., unique values) and 64,064 observations. To use a continuity-based RDD approach with discrete running variables, one criterion is that the number of mass points must be large (Cattaneo & Titiunik, Reference Cattaneo and Titiunik2022). However, in this setup, due to the very limited number of mass points, the continuity-based RDD approach is not advisable.Footnote 14 Instead, I use a parametric RDD approach. In this approach, I have to select the functional form and the bandwidth.
Functional form. In this approach, I have to rely more on choosing a functional form to correctly identify the effect of treatment on outcome variables (Lee & Card, Reference Lee and Card2008). That being said, the uncertainty in the selection of functional form would produce specification errors. In other words, the low-order polynomials are going to introduce some biases unless I use an extremely high-order polynomials. However, if I keep increasing polynomial order, estimates will rely heavily on observations far away from the threshold. To minimize the possible bias arising from specification errors, I instead use the conditional expectation function (CEF) among natives as an approximation for the CEF among immigrants, then add additional polynomial adjustment to account for any remaining differences in the CEF between natives and immigrants. This approach is based on two fundamental assumptions. First, for natives, I have a larger sample size and can therefore estimate the CEF precisely. Then, using the estimates from those native sample to eliminate any noises can reduce the bias introduced from mis-specification. Second, this correction would only introduce unknown bias if there were a discontinuity in the labor market outcomes of natives that is unrelated to the potential counterfactual discontinuity for immigrants. In other words, we would need to assume that a discontinuity exists in the labor market outcomes of natives at the age of 31 in 2012. However, there is no empirical or theoretical evidence to support such a discontinuity. To examine these assumptions, I visualize the means of the outcome variables among a sample of natives, which show that the linear functional form fits the data on natives well and there is no discontinuity at the age of 31 among natives. I present these plots in Online Appendix K. Specifically, I follow a 2-step method as described below:
-
Step 1: I regress all outcome variables on dummy variables of individuals’ age in 2012 for natives only.
(2) $${Y_i} = \kappa + \mathop \sum \limits_{m = - 14}^{m = 28} {\nu _m}{\rm{*}}1\left( {{{\rm{R}}_i} = m} \right) + {\tau _i}$$
in which,
${Y_i}$
is the original outcome for native individual i and m is individuals’ normalized age in 2012. -
Step 2: Then, I use the estimate of
${Y_i}$
(
${\hat Y_i}$
) in Equation (2) to adjust for my original outcome variables as follows:
$${\tilde Y_{it}} \equiv {Y_{it}} - {\hat Y_i}.$$


Specifically, my three models using the parametric regression discontinuity approach are:Footnote 15
-
1.
${\tilde Y_{it}}$
=
${\alpha _0}$
+
$\beta {{\rm{D}}_{it}}$
+
${\gamma _1}{{\rm{R}}_{it}}$
+
${\delta _1}{{\rm{R}}_{it}}{{\rm{D}}_{it}}$
+
$\lambda {{\rm{X}}_{it}}$
+
${\varepsilon _{it}}$
(1a) -
2.
${\tilde Y_{it}}$
=
${\alpha _0}$
+
$\beta {{\rm{D}}_{it}}$
+
${\gamma _1}{{\rm{R}}_{it}}$
+
${\gamma _2}{\rm{R}}_{it}^2$
+
${\delta _1}{{\rm{R}}_{it}}{{\rm{D}}_{it}}$
+
${\delta _2}{\rm{R}}_{it}^2{{\rm{D}}_{it}}$
+
$\lambda {{\rm{X}}_{it}}$
+
${\varepsilon _{it}}$
(1b) -
3.
${\tilde Y_{it}}$
=
${\alpha _0}$
+
$\beta {{\rm{D}}_{it}}$
+
${\gamma _1}{{\rm{R}}_{it}}$
+
${\gamma _2}{\rm{*R}}_{it}^2$
+
${\gamma _3}{\rm{R}}_{it}^3$
+
${\delta _1}{{\rm{R}}_{it}}{{\rm{D}}_{it}}$
+
${\delta _2}{\rm{R}}_{it}^2{{\rm{D}}_{it}}$
+
${\delta _3}{\rm{R}}_{it}^3{{\rm{D}}_{it}}$
+
$\lambda {{\rm{X}}_{it}}$
+
${\varepsilon _{it}}$
(1c)


Bandwidth. One option is to choose the bandwidth based on the researcher’s judgment. The downside of this approach is its subjectivity. The other option is using the data-driven method. In this model setting, where the running variable is discrete with few mass points, it is not ideal to use the bandwidth selection methods proposed by Calonico et al. (Reference Borjas2014, Reference Borjas and Cassidy2018, Reference Calonico, Cattaneo and Farrell2019, Reference Calonico, Cattaneo and Farrell2020). Thus, I handpick a bandwidth of 6 to start. To ensure robustness and eliminate subjective judgment, I also run the model with bandwidths ranging 3 to 7.Footnote 16 As I show in specification curves in Section 6.1 (Simonsohn et al., Reference Simonsohn, Simmons and Nelson2020), this does not matter which bandwidths I am using because the estimates are all small and insignificant.
Next, the main concern for RDD is the possibility of data manipulation and discontinuity in unobservables around the threshold. In other words, the results will be misleading if people who are close to the threshold, might attempt to manipulate it and sort them into their preferred group. To address that, I perform the density test based on the non-parametric local polynomial density estimator developed by McCrary (Reference McCrary2008). The test statistic is -0.004 with s.e 0.009, which fails to reject the null hypothesis of continuity. I plot the density of the running variable in Figure 3, following McCrary (Reference McCrary2008), which visually confirms the smoothness of the density function of my running variable.
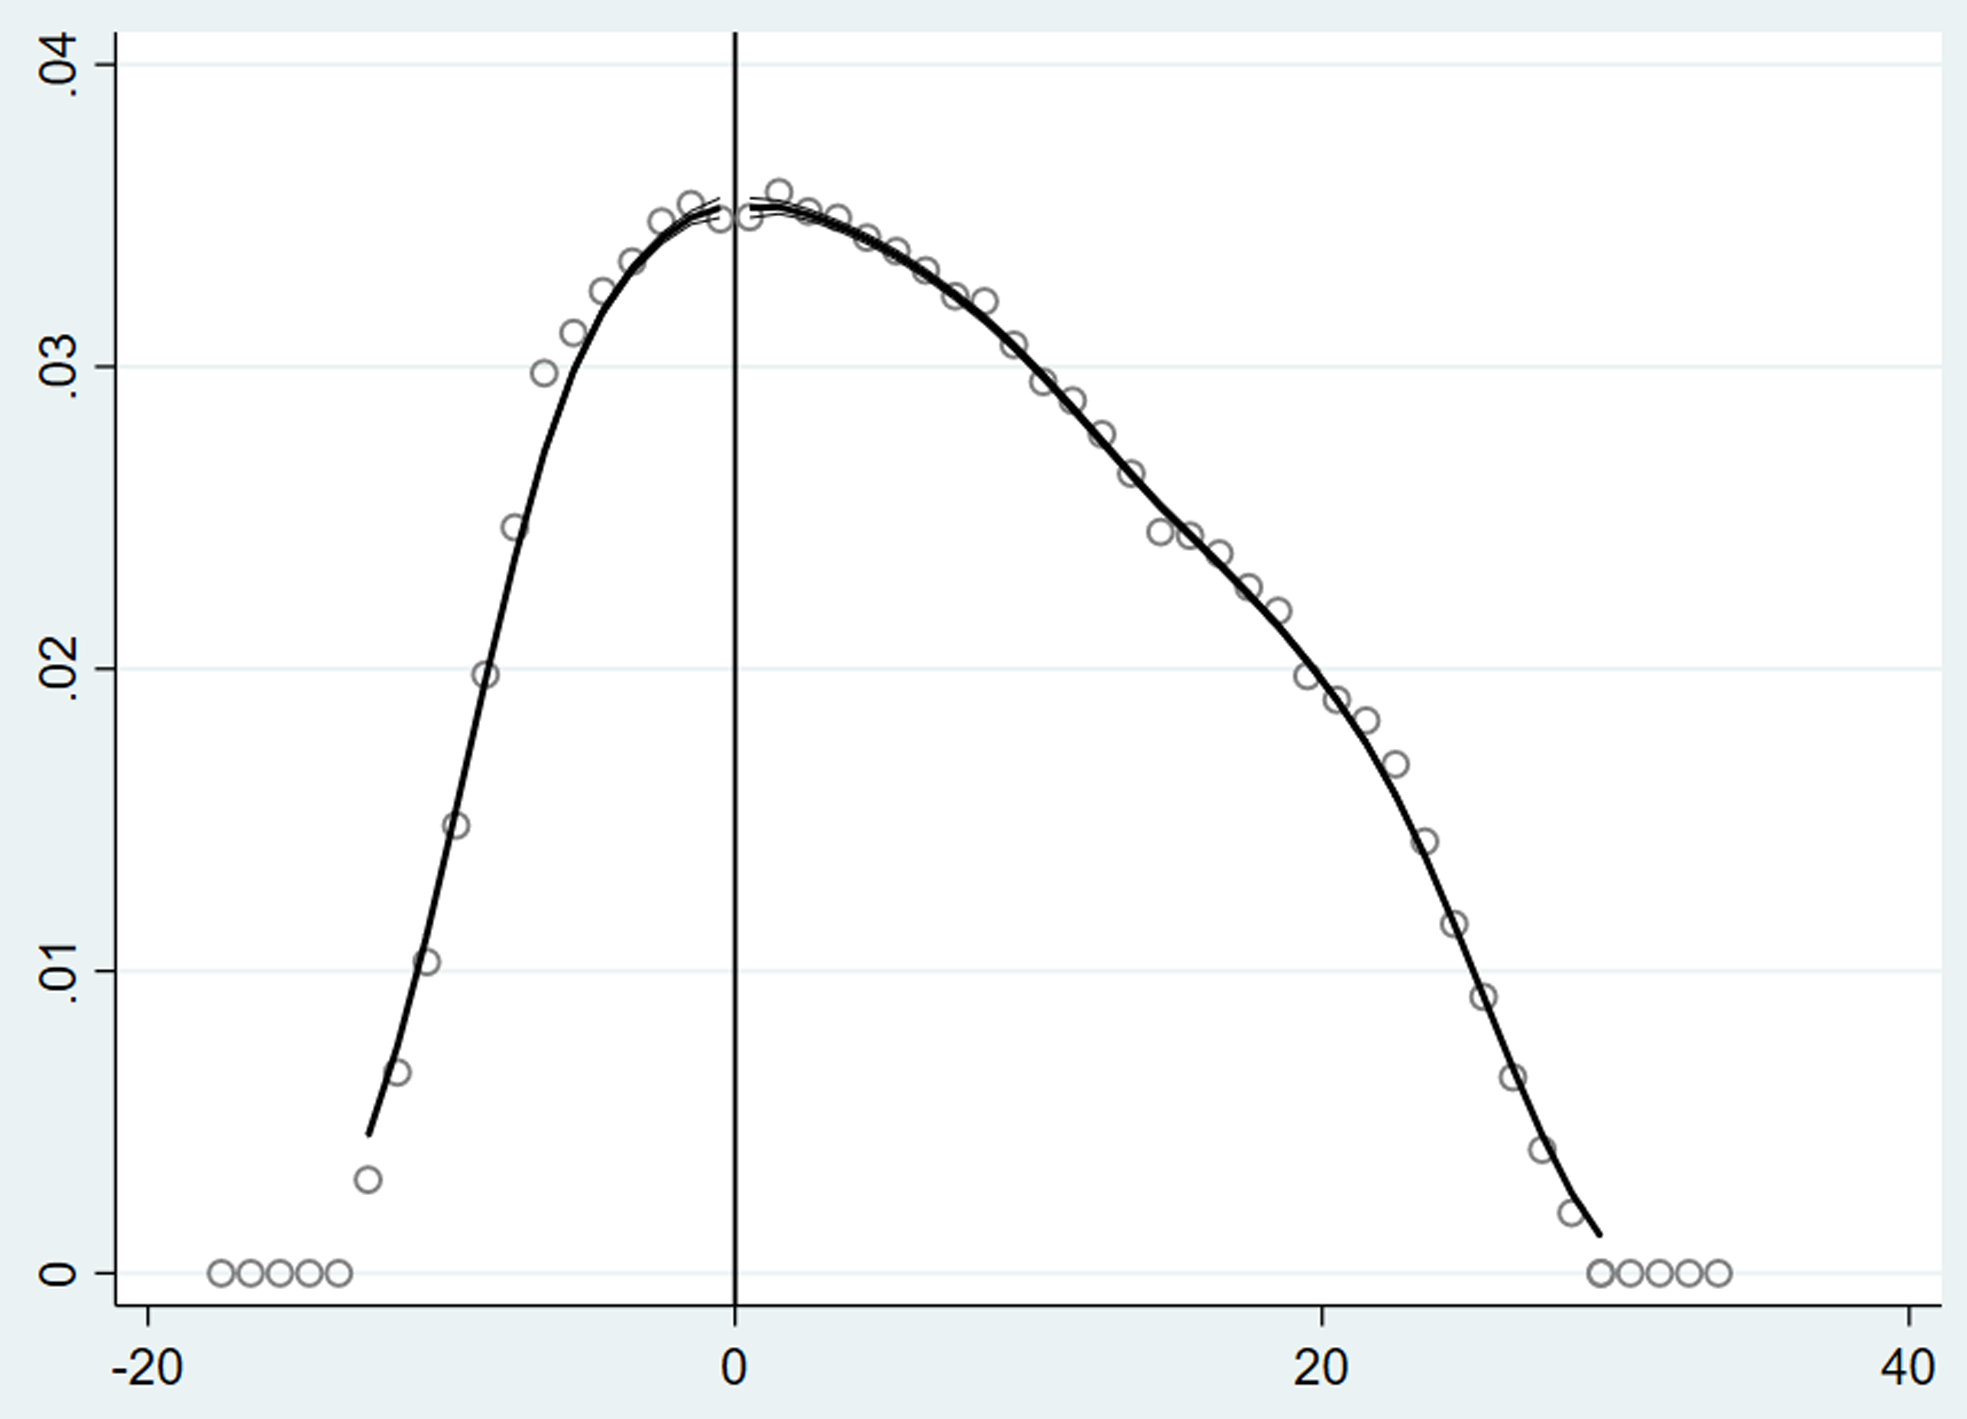
Figure 3: McCrary (Reference McCrary2008) test.
Notes: This figure shows the formal manipulation test based on a methodology proposed by McCrary (Reference McCrary2008). This supports the reliability of the RDD method that observations near the threshold are comparable and free from manipulation.
I also demonstrate in Figure 4 the graphical version of balance tests, plotting the means of variables in different brackets of age in 2012. Figure 4(a) shows the probability of qualifying for the other three DACA requirements, which are under the age of 16 at arrivals, arrivals before 2007, and high-school diploma or equivalent holder. It is evident that there is no bunching around the threshold. Similarly, Figure 4(b), (c), and (d) illustrate that all plots have smooth transitions at the threshold. Thus, individuals who are adjacent to the threshold are comparable.Footnote 17
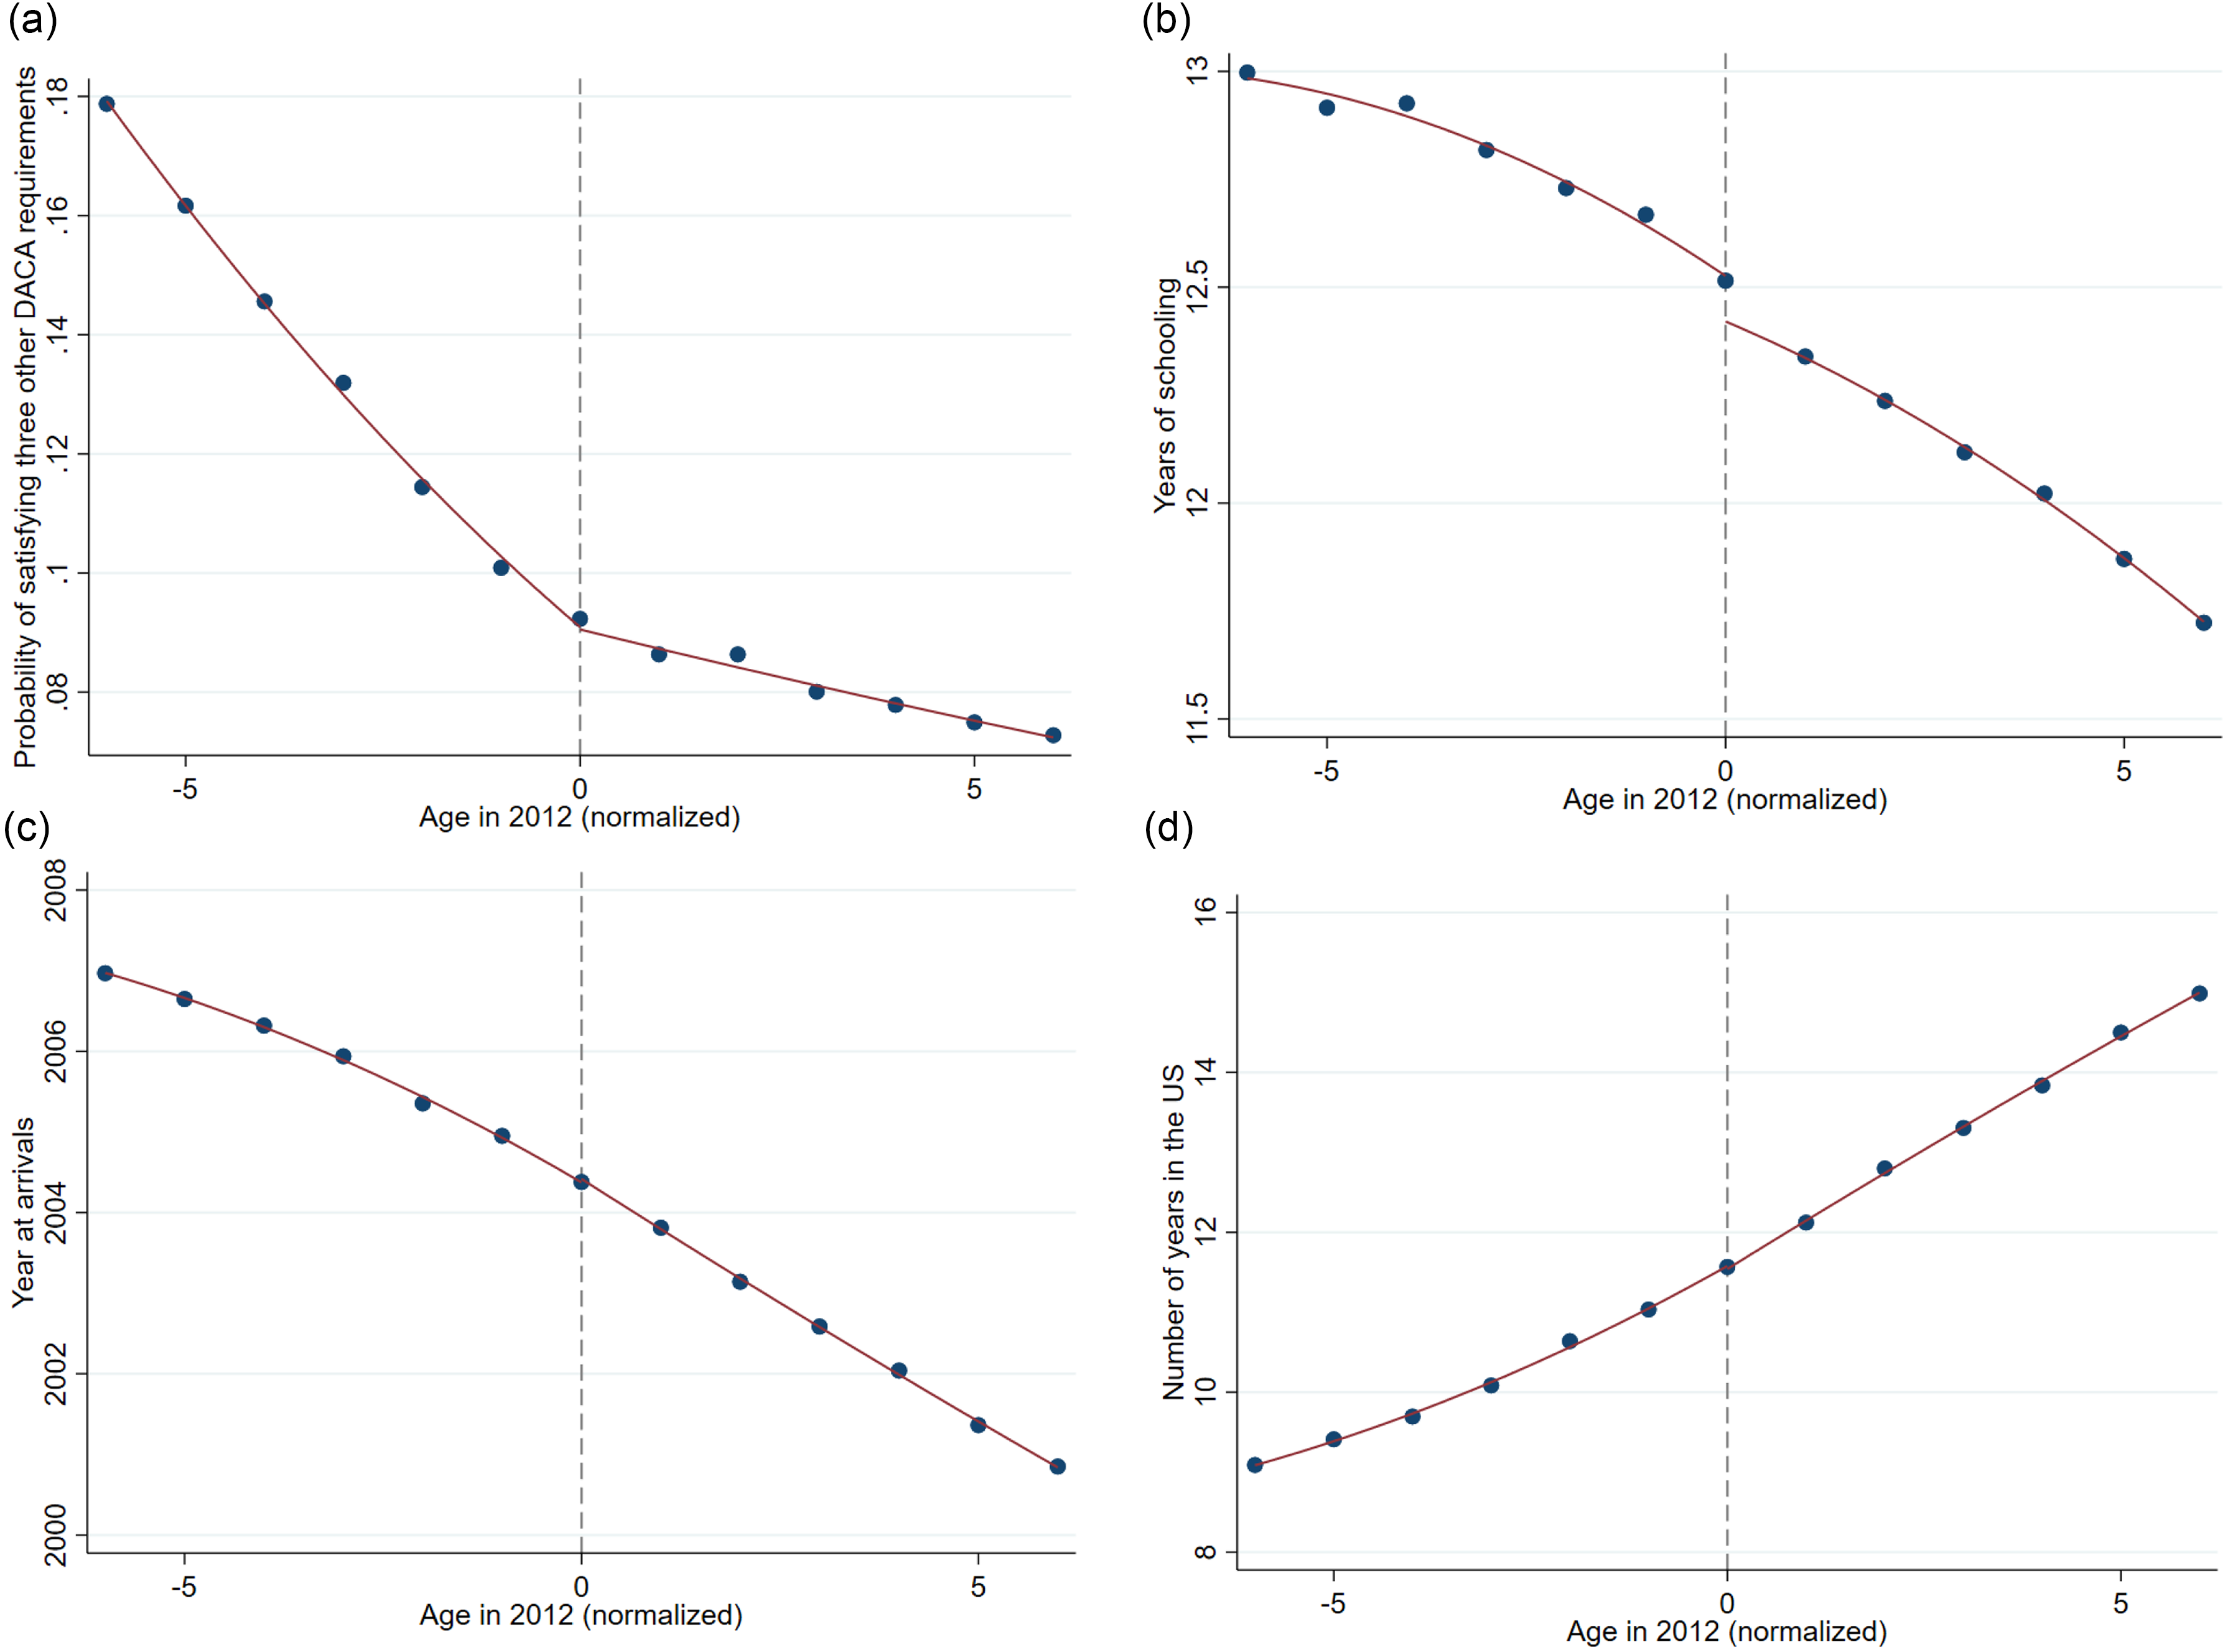
Figure 4: Balance check of covariates.
Notes: This figure shows the means of four variables to verify the continuities of those variables across the threshold. Data spans from 2013 to 2019.
5. Results
There is a concern that estimates from cubic functional form usually yield different estimates from linear and quadratic functions. Gelman and Imbens (Reference Gelman and Imbens2019) argue the global higher-order polynomial causes some major concerns. First, the weights implied by higher order can take on extreme values relative to the weights based on local linear or quadratic regressions. Additionally, the higher the order of polynomial function is, the more sensitive the causal effects are. Finally, confidence intervals reported on the higher-order function are deceptive because they fail to include zero with a substantially high probability. So, the estimates from higher-order polynomial functions are often not reliable. In this paper, my preferred specification is a linear functional form with a bandwidth of 6. However, I still report the estimates from quadratic and cubic functions in the form of specification curves in my robustness checks. Standard errors in my parametric model are conventional heteroskedasticity-robust standard errors at the state-year level, which is suggested by Kolesár and Rothe (Reference Kolesár and Rothe2018). They concluded that standard errors, which are clustered by the running variable (Lee & Card, Reference Lee and Card2008), do not resolve specification bias and may have poor coverage properties.
It is unlikely that adjusting for immigrant’s outcomes using natives’ CEF would introduce some unobserved biases as I explained in Section 4. However, in addition to my preferred specification, I also present results for two other models: (1) A regression discontinuity design without adjusting for native’s CEF; (2) A difference-in-discontinuities design (Diff-in-disc), which adjust for likely undocumented immigrants post-DACA policy using likely undocumented immigrants pre-DACA policy.Footnote 18
To comprehensively understand the labor market outcomes of DACA eligibility, I examine two sets of variables. First, to measure employment outcomes, I use 5 dependent variables from ACS data: probability of being employed, probability of getting health insurance from employers, probability of working last year, weekly working hours, and wage income. Second, to measure job movement conditional on being employed, I use math skills, creativity, critical thinking, and science as described in Section 3.2 as well as the number of years of schooling of typical people for each job.
5.1. Employment outcomes
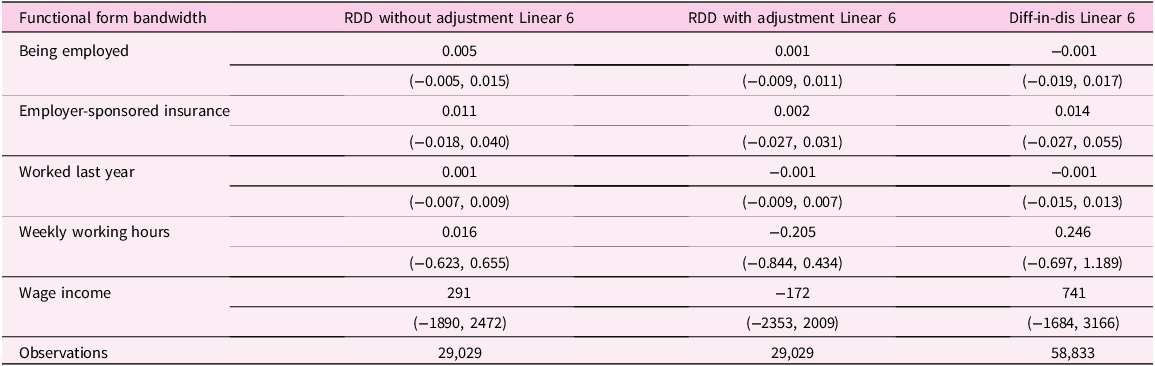
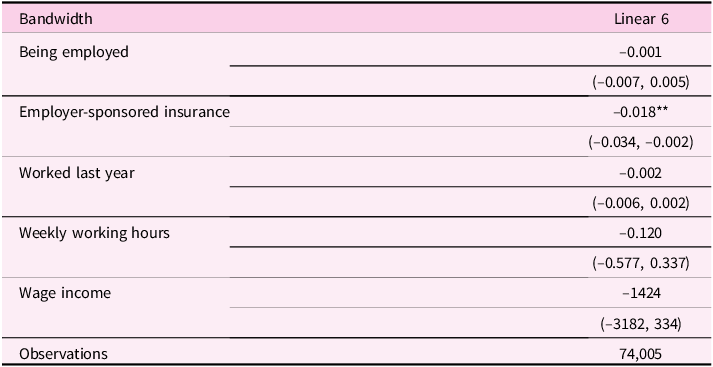
Table 2 presents the effects of DACA eligibility on employment outcomes, using three specifications with a linear functional form and a bandwidth of 6: (1) regression discontinuity without adjusting for natives’ CEF; (2) regression discontinuity with adjusting for natives’ CEF; (3) difference-in-discontinuities. I present point estimates along with their 95% confidence intervals. Across the three different specifications presented, the estimates from the diff-in-disc design are slightly larger for employer-sponsored insurance, weekly working hours, and wage income compared to the other two RDDs. The diff-in-disc design also produces the highest potential positive effects. However, overall, the effects on all outcome variables remain small and statistically insignificant across these specifications.
Table 2. Effects of DACA eligibility on employment outcomes from 2013-2019
Confidence intervals are presented in parentheses and calculated with 95% confidence. Standard errors are clustered at the state-year level.
Notes: This table shows the effects of DACA on labor market outcomes among non-citizen immigrants, employing the linear functional form with a bandwidth of 6. Sample includes those who have obtained high-school diploma, have entered the US before their 16th birthday and have immigrated to the US before 2007. The second column presents results from a regression discontinuity design without adjusting for natives’ CEF. The third column, my preferred specification, uses a regression discontinuity design with adjustments for natives’ CEF. The last column shows results from a difference-in-discontinuities design without adjusting for natives’ CEF, using data from 2005 to 2019.
* $p \lt .10$
, **
$p \lt .10$
, ** $p \lt .05$
, ***
$p \lt .05$
, *** $p \lt .01$
.
$p \lt .01$
.
Using my preferred specification (i.e., RDD adjusted for natives’ CEF), Figure 5 visualizes the mean of each employment outcome without any control variables, fits a linear line with a bandwidth of 6, and confirms my regression results.Footnote 19 Figure 5(a), (c), and (e) confirm no discontinuity in the probability of being employed, the probability of working in the last year, or wage income around the threshold. Figure 5(b) and (d) show little evidence that there are discontinuities in the probability of getting employer-sponsored insurance and weekly working hours around the threshold. However, the standard errors are large to draw any solid evidence on the effects. These figures are negatively sloped because they are adjusted for natives’ CEF, suggesting that human capital among immigrants grows at a slower rate than that of natives over the life cycle. This is consistent with the literature on human capital production (Lagakos et al., Reference Lagakos, Moll, Porzio, Qian and Schoellman2018; Polachek et al., Reference Polachek, Das and Thamma-Apiroam2015). In general, the graphs confirm what I find in the regression that DACA eligibility has no effect on all variables of interest. I also present the lines of fit with my raw data (without adjusting for native’s CEF) for pre- and post-DACA policy in Online Appendix H.
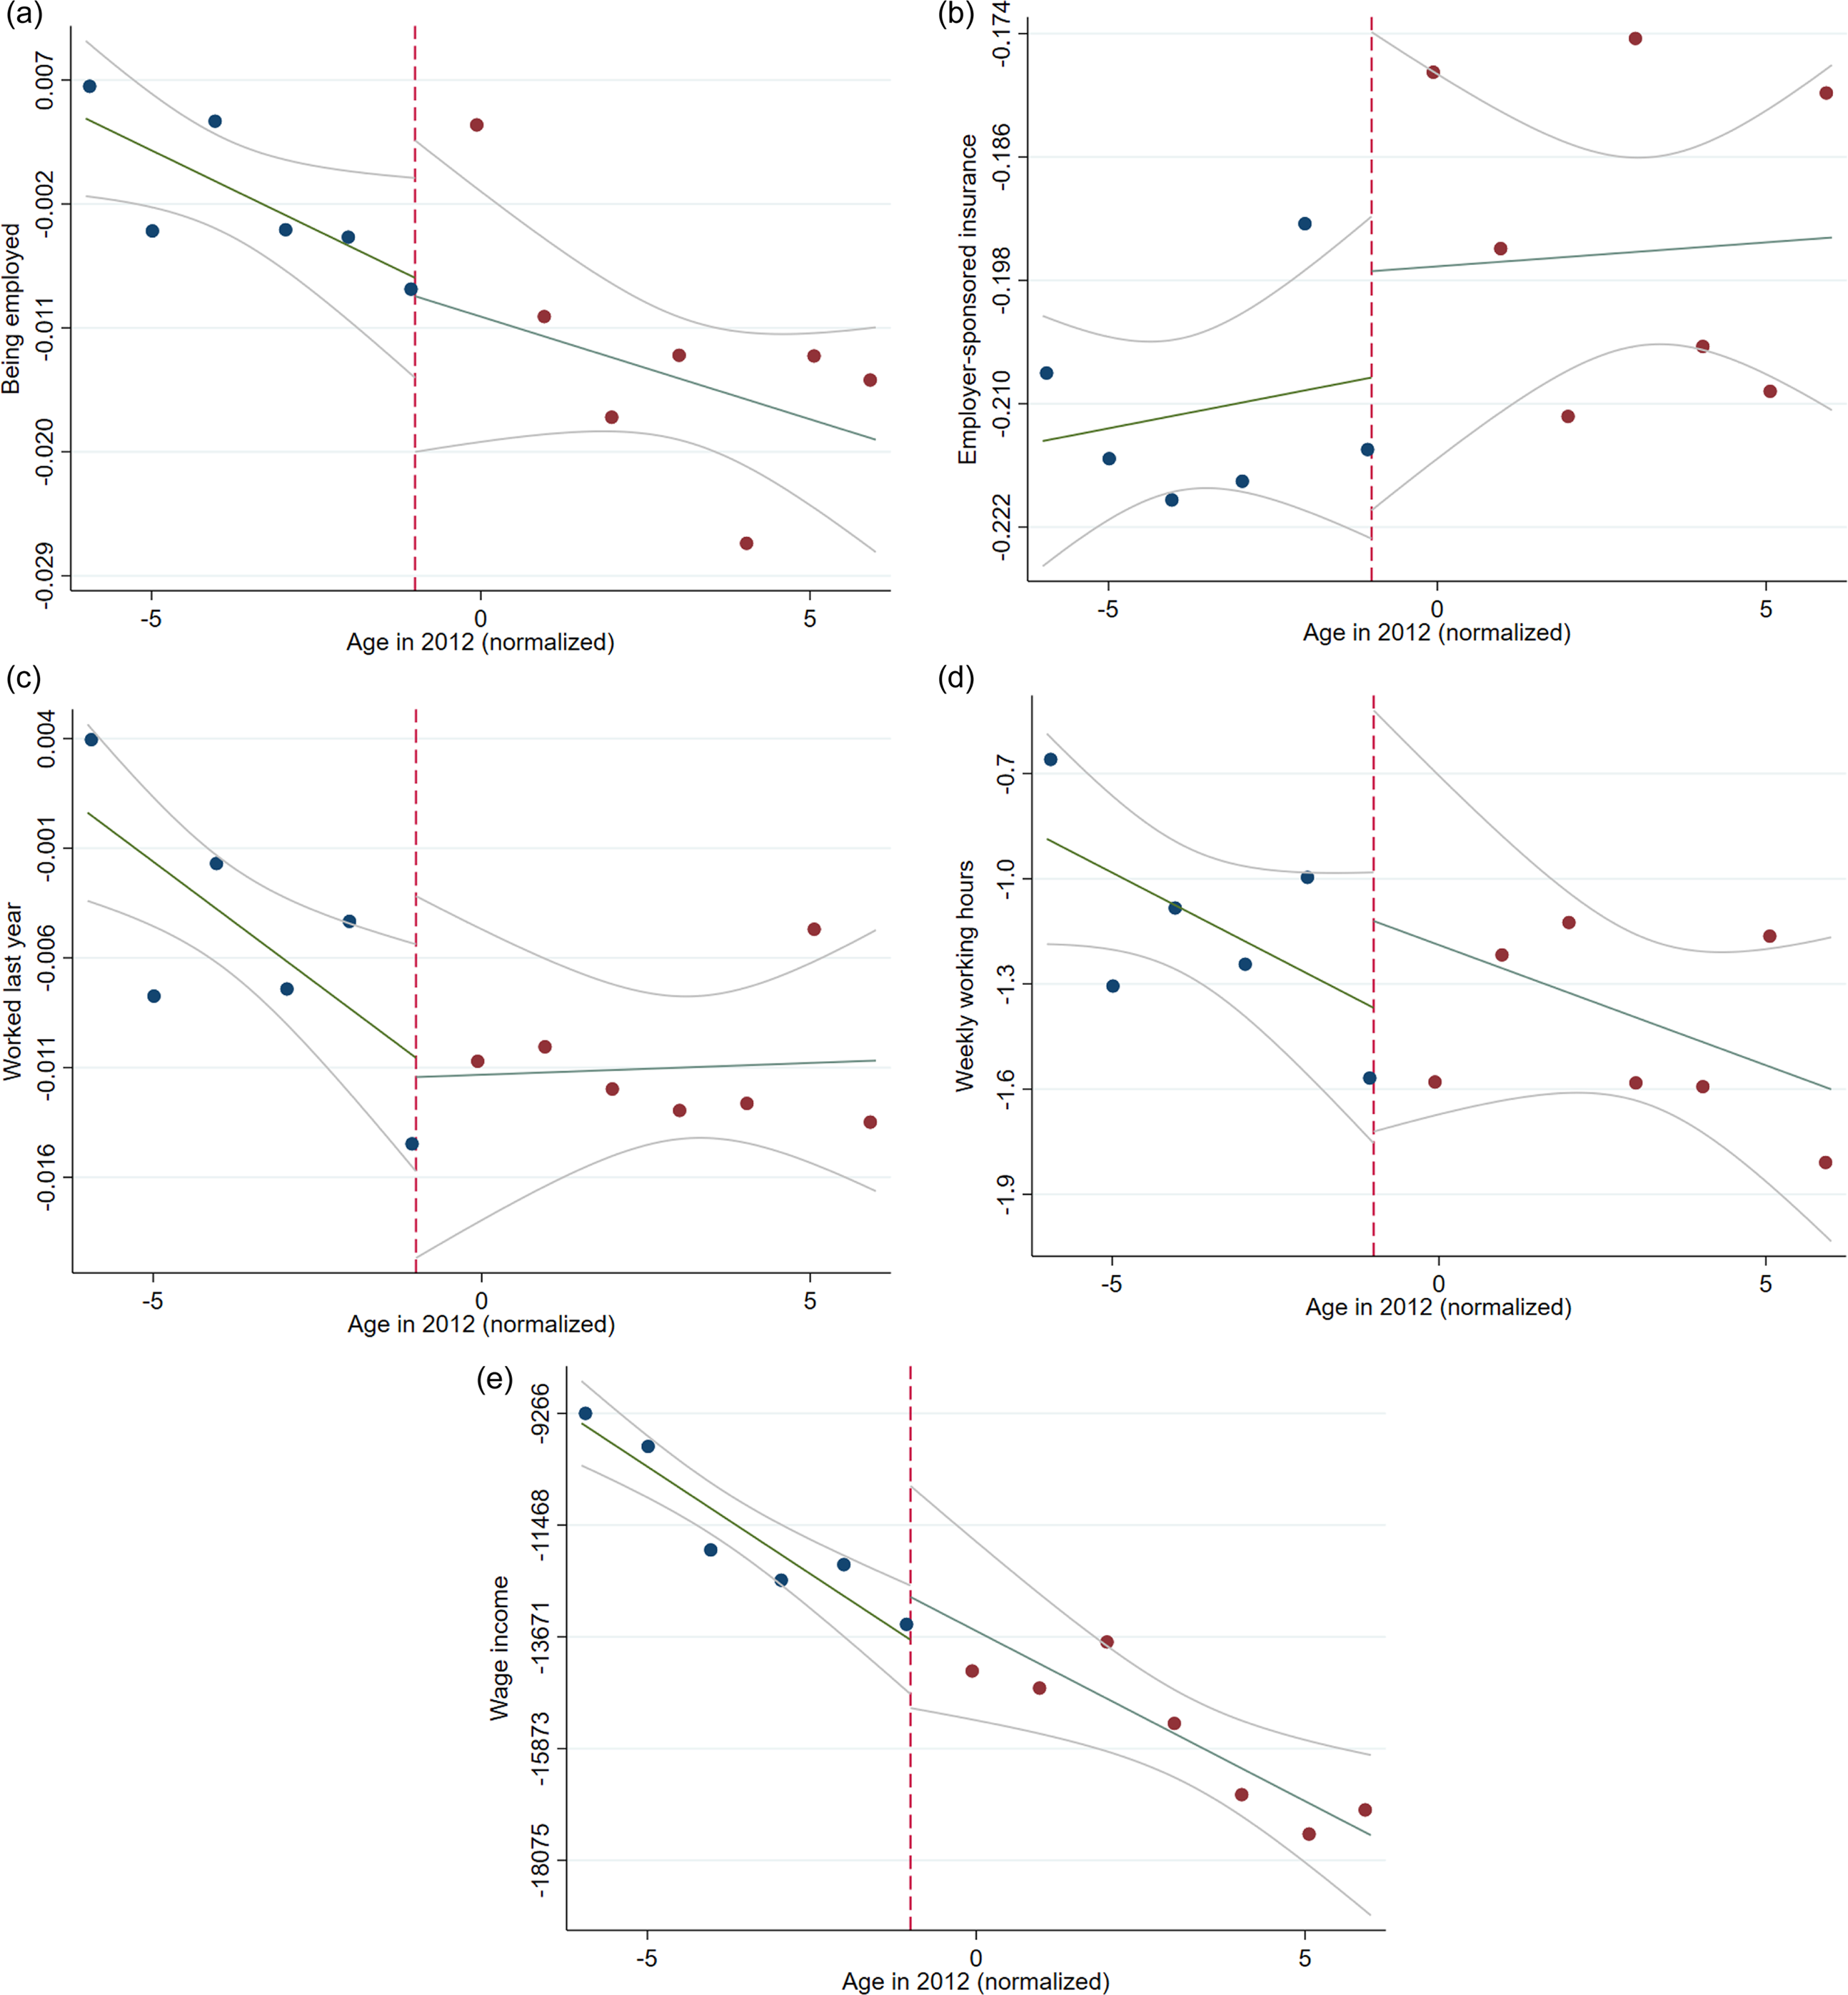
Figure 5: Employment outcomes with linear lines of fit.
Notes: This figure presents the means of all employment outcomes with linear lines of fit and 95% confidence intervals after adjusting for natives’ CEF. Observations are on the left side of the threshold are treated and observations are on the right side of the threshold are untreated.
5.2. Occupational skill usage
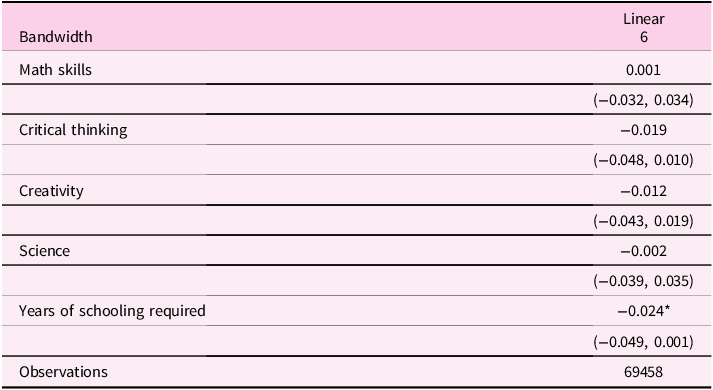
Similar to Table 2, Table 3 estimates the effects of DACA eligibility on working in high-skilled jobs, using three specifications with a linear functional form and a bandwidth of 6. Table 3 shows that the effects on occupational skills are consistent across three specifications. There is no evidence that likely DACA-eligible people move to jobs that require higher math skills, creativity thinking, creativity, science, and years of schooling.
Table 3. Effects of DACA eligibility on occupational skill usage
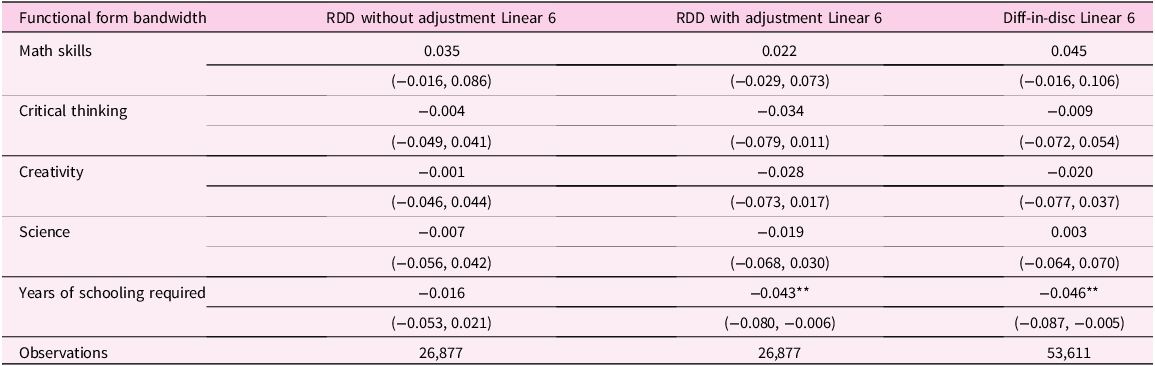
Confidence intervals are presented in parentheses and calculated with 95% confidence. Standard errors are clustered at the state-year level. Coefficients are measured in standard deviation.
Notes: This table shows the effects of DACA on the probability of choosing high-skilled jobs among immigrants, employing the linear functional form with a bandwidth of 6. Sample includes those who have obtained high-school diploma, have entered the US before their 16th birthday and have immigrated to the US before 2007. The second column presents results from a regression discontinuity design without adjusting for natives’ CEF. The third column, my preferred specification, uses a regression discontinuity design with adjustments for natives’ CEF. The last column shows results from a difference-in-discontinuities design without adjusting for natives’ CEF, using data from 2005 to 2019.
* $p \lt .10$
, **
$p \lt .10$
, ** $p \lt .05$
, ***
$p \lt .05$
, *** $p \lt .01$
Using my preferred specification (i.e., RDD adjusted for natives’ CEF), Figure 6 illustrates the mean of each occupational skill usage variable with a linear line of fit.Footnote 20 It is shown that there are no discontinuities around the threshold for all variables of interest.
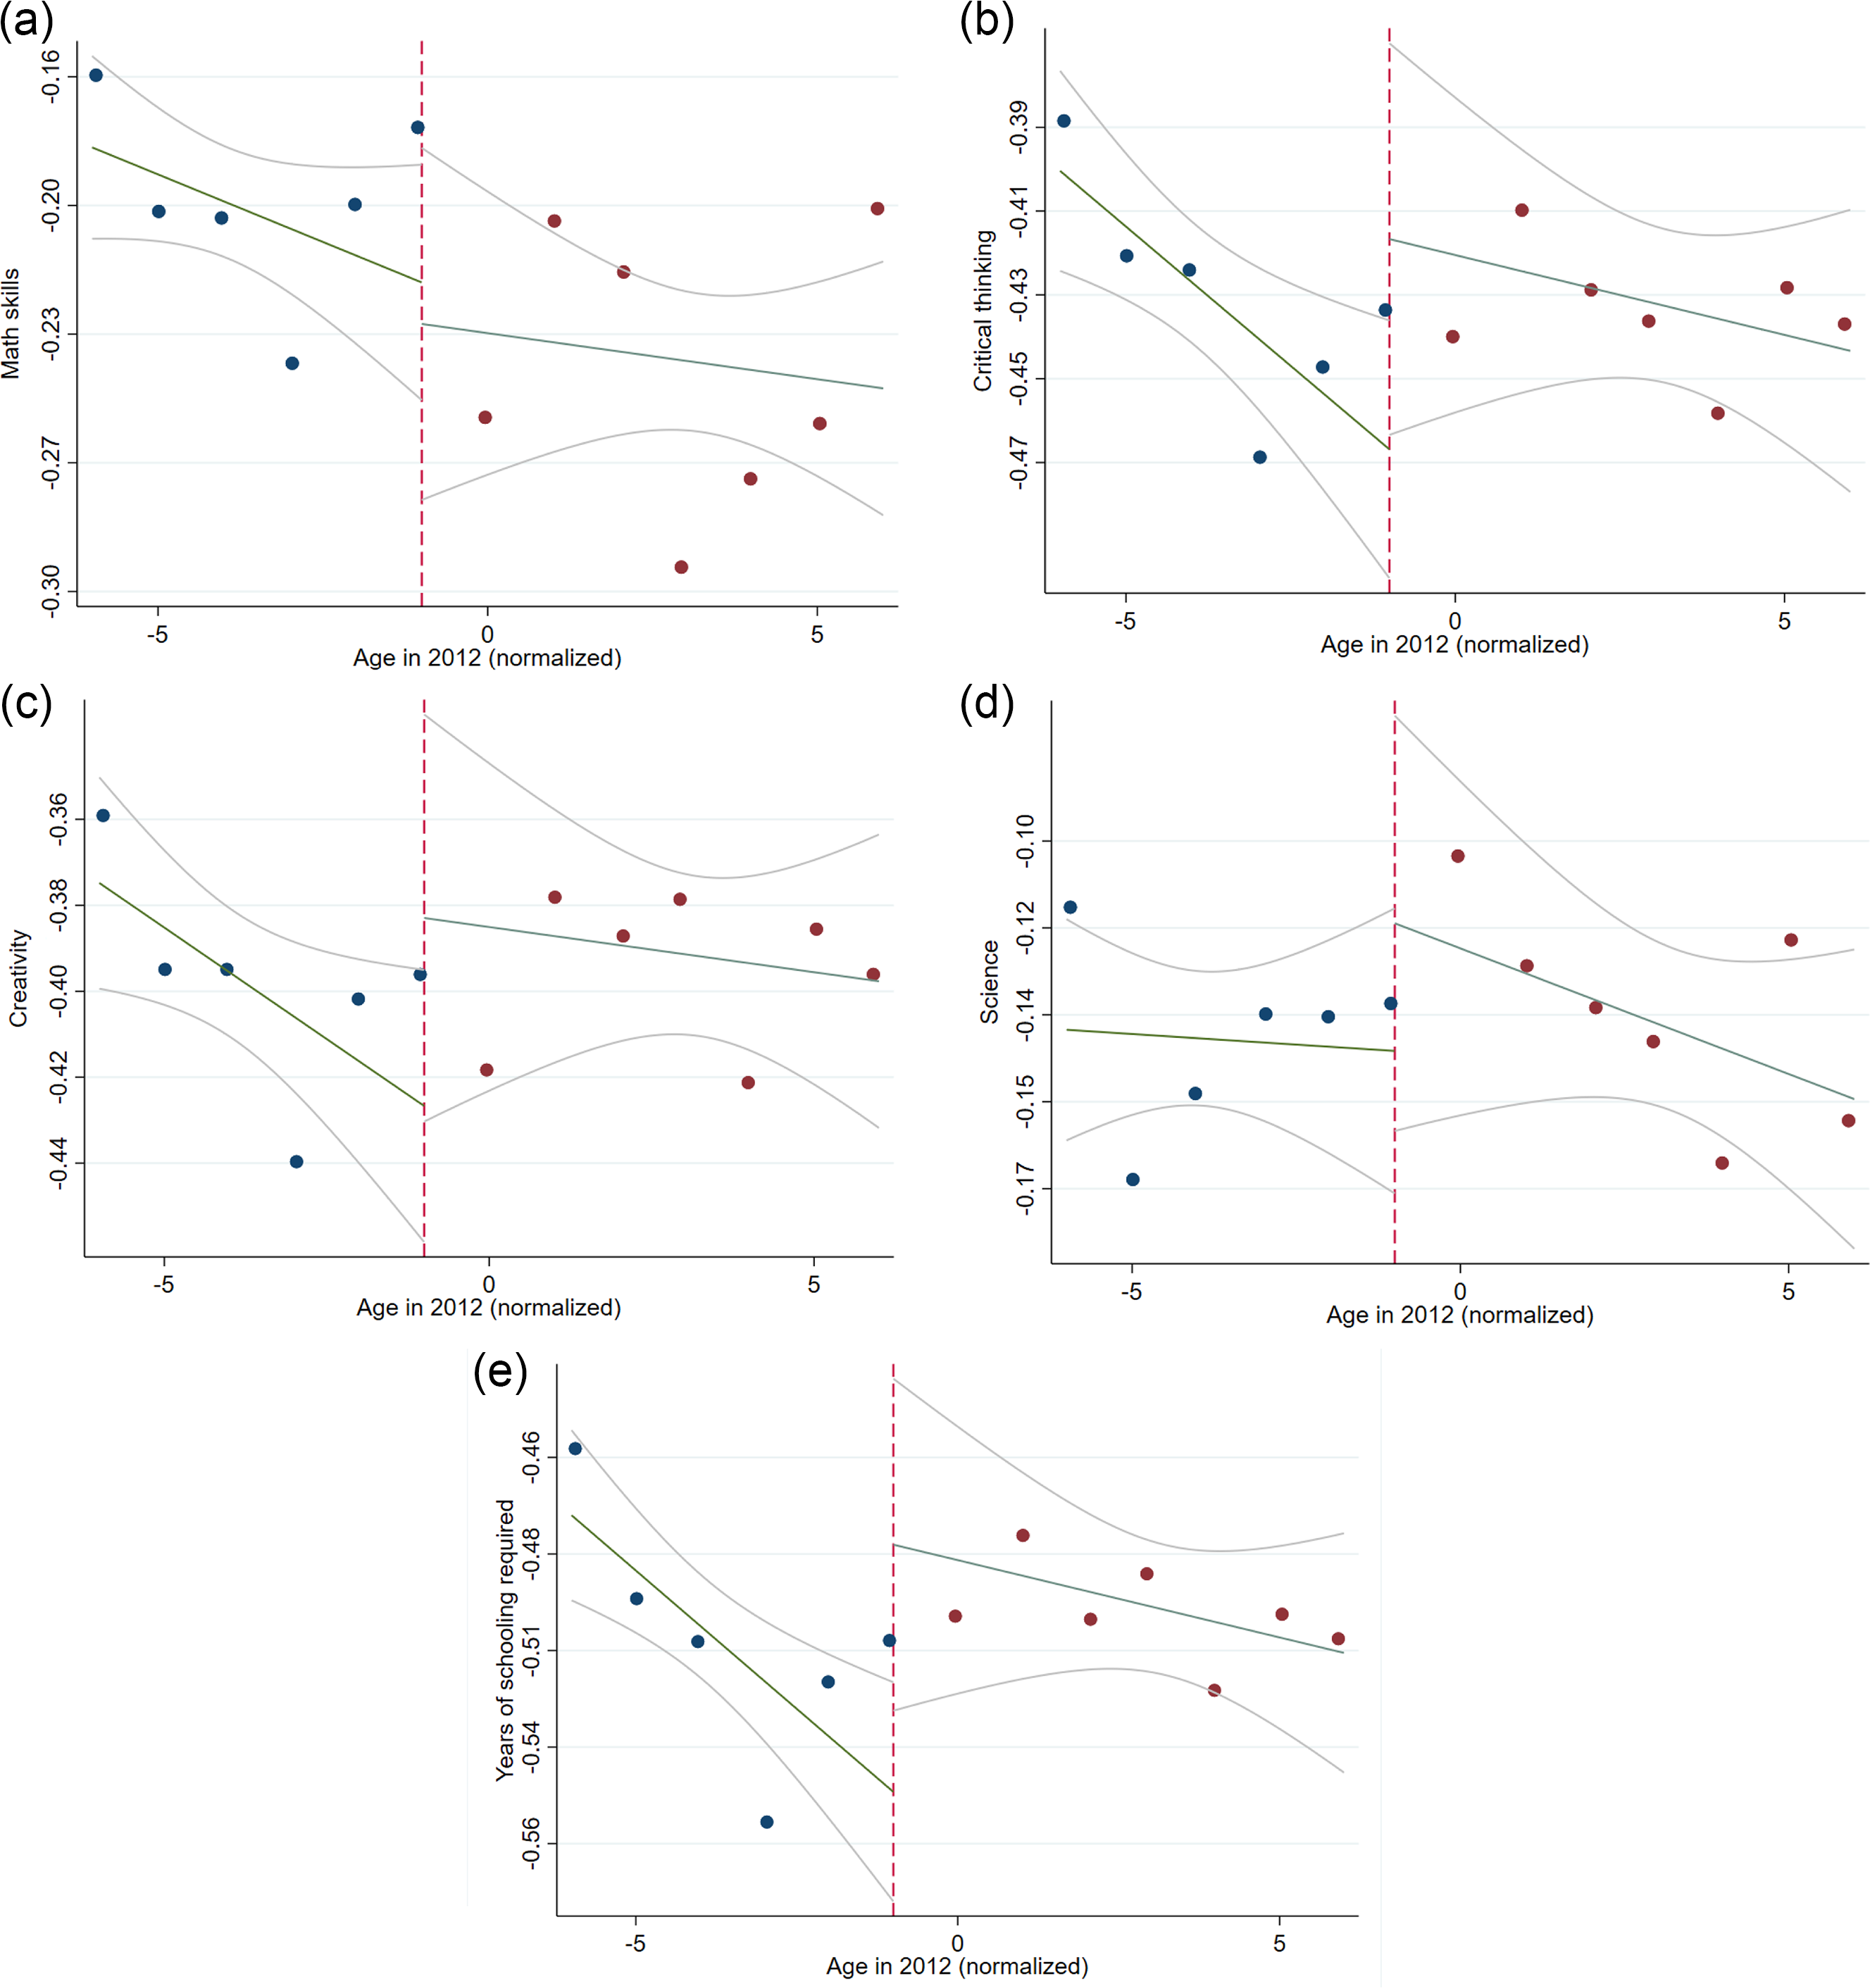
Figure 6: Occupational skill usage with linear lines of fit.
Notes: This figure presents the means of all occupational skill usage outcomes with linear lines of fit and 95% confidence intervals after adjusting for natives’ CEF. Observations are on the left side of the threshold are treated and observations are on the right side of the threshold are untreated.
5.3. Result discussion
DACA is a large immigration policy, which was expected to have a significant impact on eligible individuals. While some studies show the positive effects of DACA on labor market outcomes (Pope, Reference Pope2016) or educational attainment (Kuka et al., Reference Kuka, Shenhav and Shih2020), my results are surprising. There are three possible explanations for this divergence. First, the sample in this paper encompasses a period during which DACA encountered various legal challenges, which may dampen the effects of DACA on labor market outcomes. Second, this paper uses a regression discontinuity design, which may yield a different result than a difference-in-differences design. Third, this paper constructs a different sample, which measures a different group of DACA individuals.
Sub-period. It is possible that my findings are null due to the negative impact of the DACA program’s suspension during the Trump administration, as discussed in Section 2. To assess whether my results differ from existing literature due to the extended period covering the slowdown of DACA, I have maintained consistency in my econometric model (i.e., RDD) and sample construction. I specifically truncate the sample period to 2013 and 2014, aligning with the timeframe examined in prior literature. Table 4 illustrates the effects of DACA eligibility on employment outcomes from 2013 to 2014. The coefficient on the probability of being employed is 0.1 percentage point and statistically insignificant. Similarly, I do not see any effect on employer-sponsored health insurance. The effects of DACA eligibility on the probability of working in the last year, weekly working hours, and wage income also show the same pattern, which presents no solid evidence of the effects of DACA eligibility. This suggests that even in the early days of DACA, the effects of DACA eligibility on labor market outcomes are also limited, which are not caused by legal challenges in later years.
Table 4. Effects of DACA eligibility on employment outcomes from 2013 to 2014
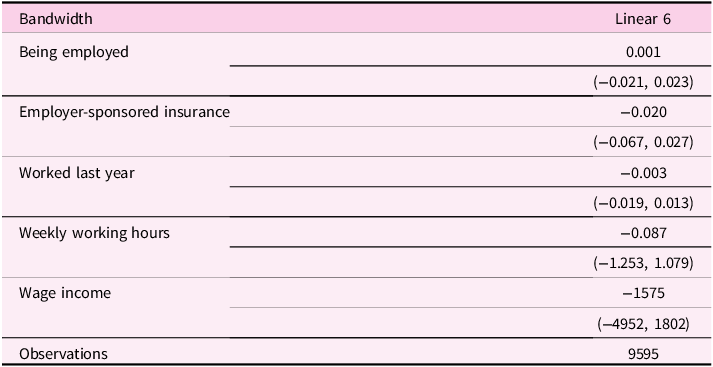
Confidence intervals are presented in parentheses and calculated with 95% confidence. Standard errors are clustered at the state-year level.
Notes: This table shows the effects of DACA on labor market outcomes among non-citizen immigrants, employing the linear functional form with a bandwidth of 6 from 2013 to 2014. Sample includes those who have obtained high-school diploma, have entered the US before their 16th birthday and have immigrated to the US before 2007.
* $p \lt .10$
, **
$p \lt .10$
, ** $p \lt .05$
, ***
$p \lt .05$
, *** $p \lt .01$
Difference-in-differences. To determine whether the difference between my null estimates and several positive estimates in the existing literature is due to my RDD approach, I now use a difference-in-differences framework. I use the ACS data from 2005 to 2014.Footnote 21 I construct the sample as same as my main econometric strategy. See Online Appendix F for details on how I design my difference-in-difference design. My results consistently confirm null effects. In Figure 7, I present event studies to show parallel trends and the effects of DACA eligibility. Most of the coefficients during the post-DACA period are indifferent from zero, which confirms the null effects of DACA eligibility. However, Figure 7(c) suggests a violation of the parallel trends assumption. This casts doubt on the suitability of a difference-in-differences framework for assessing the impact of DACA eligibility on labor market outcomes in some cases. Consequently, when evaluating existing literature, we should not entirely rely on studies that employ a difference-in-differences approach for reliable conclusions.
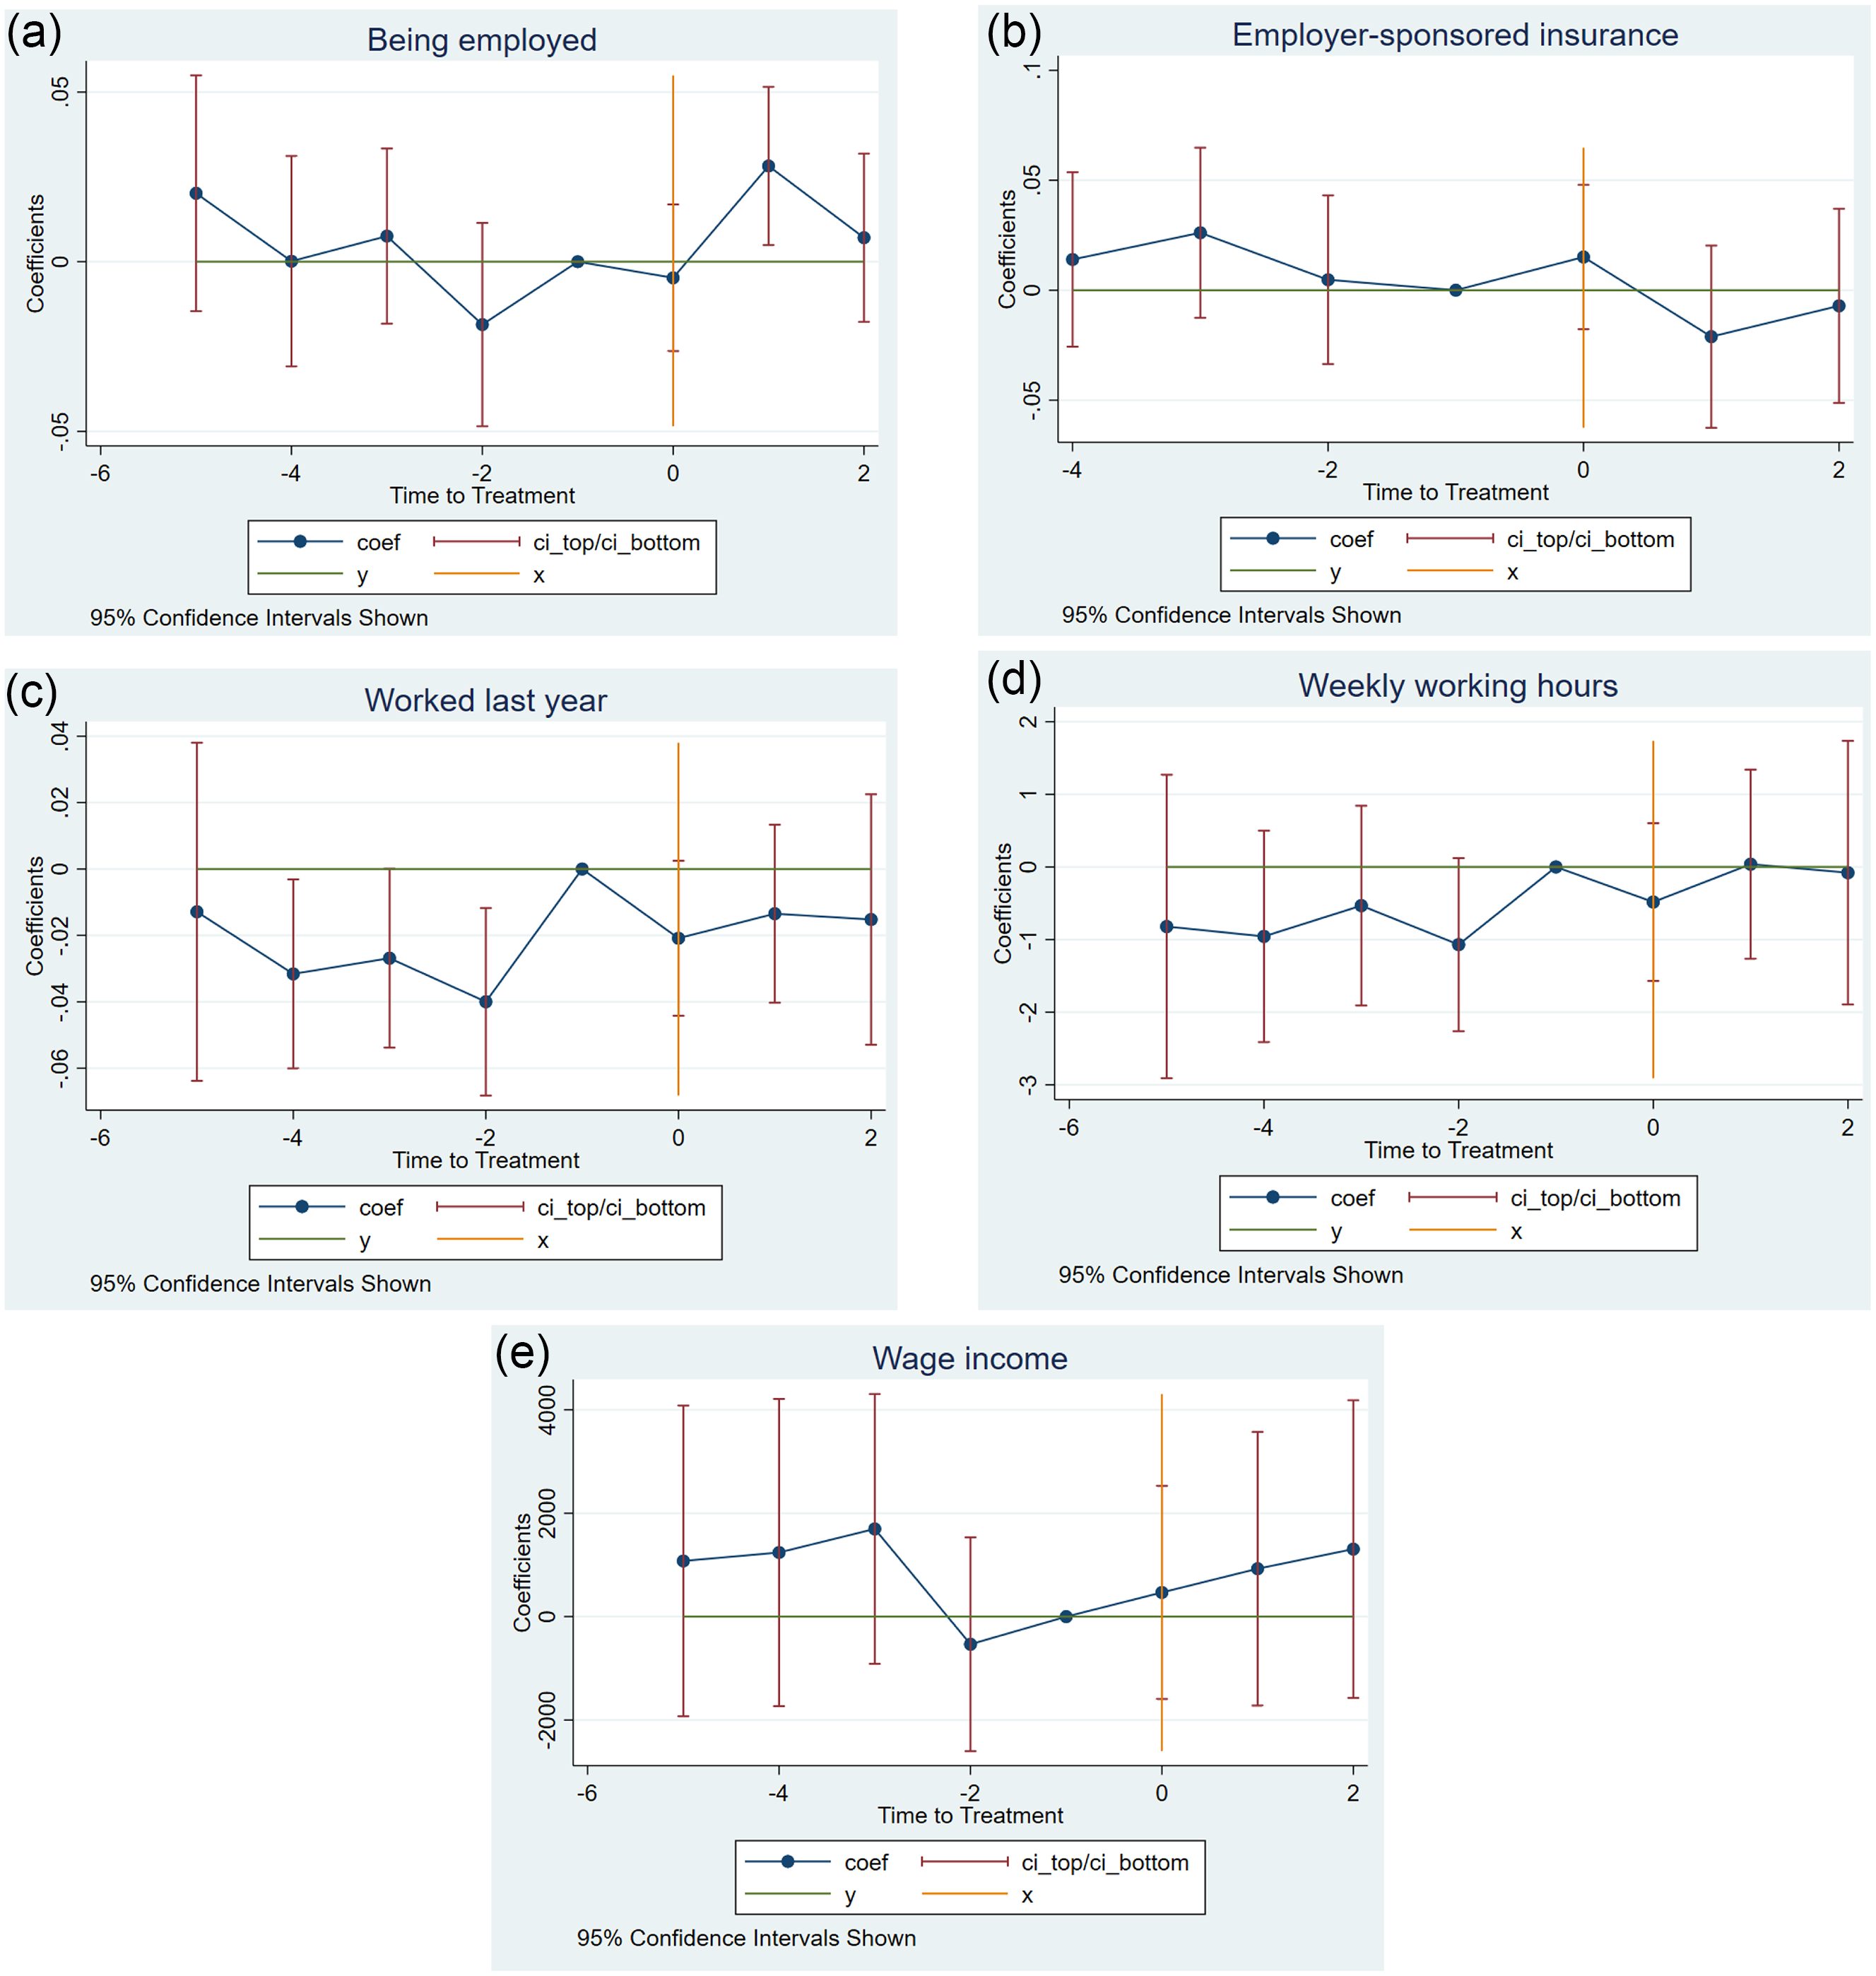
Figure 7: Event studies.
Notes: This figure presents the event studies for employment outcomes with 95% confidence intervals. Data is collected from the ACS, spanning from 2005 to 2014.
Sample construction. Regardless of the sample period and econometric models, my results still corroborate null effects, thus suggesting that the difference in my sample construction is the primary explanatory factor. My sample measures a different group of people who are likely to be older DACA individuals. In my sample, I assign treatment status based on whether an individual is under 31 in 2012 among a sample of non-citizens who have obtained a high-school degree, arrived in the US before their 16th birthday, and arrived before 2007. Pope (Reference Pope2016) defines a treatment group as non-citizens aged from 18 to 40 who meet all observable DACA requirements. This would leave all individuals who do not satisfy one, two, three, or all DACA requirements in the control group. Nonetheless, one possible issue is that the control group is not homogeneous because individuals who failed one DACA requirement are generally different from those who failed all of them. Another concern is that my sample is looking at people around 31 years old in 2012, which is similar to the sample in Panel B in Table 2 from Pope (Reference Pope2016). However, I obtained his codes and it actually restricted to people aged 27 to 34 in the current data year. I replicate his results, but I use age in 2012 instead of age in the current year while holding everything else constant. I report these results and compare with my results in Table 5. While again his sample construction is not entirely similar to mine, the results corrected for age in 2012 suggest that the effects of DACA on individuals around 31 years old are small, which is similar to my findings. Specifically, the probability of being employed and weekly working hours in the third column are positive but they are only statistically significant at the 10% level, while the other variable is statistically insignificant.
Table 5. Estimates by Pope (Reference Pope2016) and this paper
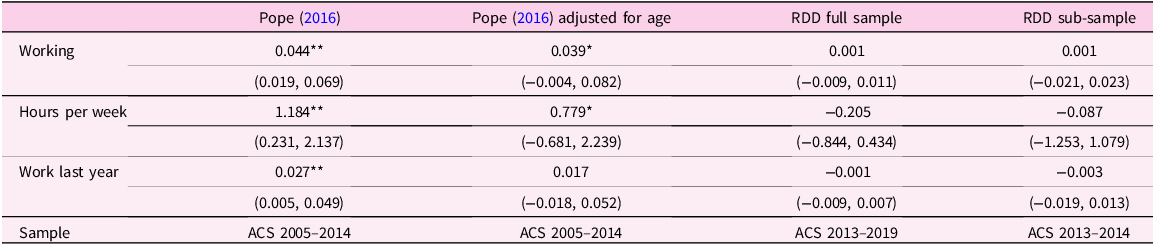
Notes: This table presents the impact of DACA on various intersecting labor market outcomes as analyzed by Pope (Reference Pope2016) and the findings of this study. The first column displays the results extracted from Panel B in Table 2 by Pope (Reference Pope2016). The second column presents the estimates after rectify a coding error by using the age in 2012 instead of the current data year, while keeping all other things constant as per Pope’s (2016) code. The third and fourth columns are estimates taken from Tables 2 and 4 in this paper, respectively.
Confidence intervals are presented in parentheses and calculated with 95% confidence.
* $p \lt .10$
, **
$p \lt .10$
, ** $p \lt .05$
, ***
$p \lt .05$
, *** $p \lt .01$
.
$p \lt .01$
.
Next, I will discuss three potential concerns related to my results.
First, one important aspect of this paper is that I cannot definitively rule out positive effects. To evaluate the largest possible treatment effects of DACA eligibility from the intention-to-treat effects, I adjust the CIs from my baseline RDD estimates by uptake rates. It is estimated that about 60% of non-citizens under 35 were undocumented in 2012 and just over 60% of DACA-eligible individuals actually applied for DACA.Footnote 22 So, I will approximate the uptake rate on one side of the threshold to be 36%. I will assume that it is 0% on the other side, as individuals older than 31 years old in 2012 were not eligible for DACA. In other words, the uptake-adjusted estimates should be 1 divided by 0.36 equals 2.7 times larger than the baseline RDD estimates. This is consistent with the finding by Mira (Reference Mira2022), which documents that the average treatment-on-the-treated effect of DACA is at least twice as large as the intention-to-treat estimates. In Online Appendix J, I present my uptake-adjusted point estimates and CIs along with estimates from Pope (Reference Pope2016). Using my preferred specification, DACA eligibility likely increases the probability of being employed at most 3 ppts, increases the probability of working last year at most 2 ppts, and increases weekly working hours by 1.2 h. These upper ends of my CIs generally overlap with the lower end of the CIs of Pope (Reference Pope2016), though my point estimates are smaller. In short, the upper bounds of my CIs fail to reject small positive effects, which overlap with the lower end of CIs in the previous literature. However, I can comfortably rule out the top end of CIs by Pope (Reference Pope2016). Lastly, obviously my estimates are more consistent with smaller parameter values than with larger ones.
Second, another concern is that the small and insignificant effects observed in my RDD design may be caused by the low take-up rate around the threshold among this group. Thus, it may not truly reflect the causality of DACA eligibility on labor market outcomes among the older group of DACA. While I cannot fully empirically address this concern, there are several possible explanations as to why it may not be a significant issue. First, the number of DACA recipients was not significantly lower among this group. In 2013, about 25% of first-time DACA applicants were between the ages of 24 and 31, while 40% were between 19 and 23. The remainder was under the age of 18.Footnote 23 So, the lower participation rate among older DACA recipients may partially explain the findings in this paper; however, it may not fully account for the results. Second, Tran (Reference Tran2024) uses a similar econometric model and finds that DACA eligibility among the older group increases their children’s Medicaid insurance, suggesting a sufficient take-up rate within this group to observe these effects. Additionally, Amuedo-Dorantes and Antman (Reference Amuedo-Dorantes and Antman2017) do not find effects on weekly working hours, hourly wages, or the likelihood of working in high-skilled occupations even when examining the younger cohort with a higher take-up rate. Therefore, a more plausible reason for these limited effects may be the lack of benefits for its recipients. Several factors could contribute to the DACA program’s limited impact on its recipients. According to the theory of discrimination by Becker (Reference Becker2010), in industries dominated by undocumented immigrants, discriminatory employers must pay significantly higher wages to documented workers, while non-discriminatory employers can hire undocumented immigrants and maintain lower production costs. So, in the long-run, it will drive discrimination against undocumented immigrants out of the market. Thus, in these industries, there is no benefits of legal status. On the other hand, in high-skilled industries, the temporary nature of the program may lead to discrimination from employers. They lack the incentive to hire individuals with short-term work permits (e.g., DACA recipients), due to high training costs or due to some legal barriers related to occupational licenses. In summary, these factors may unintentionally alter the impact of DACA on various groups of DACA recipients.
The third concern is the differential willingness to respond to ACS data among undocumented immigrants and DACA recipients. Specifically, the risk of deportation varies among undocumented immigrants, which could impact their inclination to participate in the ACS data collection. So, undocumented immigrants who respond to the ACS may be discontinuously different from those who opt not to participate, partly due to the perception of the deportation risk. However, this scenario is highly unlikely as it would trigger a violation of the continuity assumption in my McCrary test in Section 4. Similarly, Pope (Reference Pope2016) finds that there is minimal to no evidence of selection bias in willingness to complete the ACS data, and there is no indication that individuals’ willingness to fill out ACS data changes after receiving DACA status.
6. Robustness checks
6.1. Specification curves
In my preferred specification, I utilize a sample comprising non-citizens, employing the linear functional form with a bandwidth of 6. Nonetheless, to enhance the robustness of my analysis, I explore various specifications to evaluate my RDD estimates. I present all estimates in a form of specification curves (Simonsohn et al., Reference Simonsohn, Simmons and Nelson2020).
-
• Functional forms: In my specification curves, I present the estimates for the linear, quadratic, and cubic functional forms.
-
• Bandwidths: In addition to a bandwidth of 6, I also use a range of bandwidths from 2 to 7.
-
• Methods to impute legal status: To focus on potential DACA recipients, I expand the analysis to include Mexican non-citizen immigrants residing in the entire US and those in California and Texas. See Online Appendix B for details.”
-
• Quasi-experimental method: In addition to my primary econometric model, I implement a difference-in-discontinuities design following Bae (Reference Bae2020). See Online Appendix B for details.
-
• Natives’ CEF: In addition to my primary econometric model, where I use natives to adjust for my immigrant sample, I also perform my main specification without adjusting for the natives’ CEF.
-
• Sample: In Figure 8, I also present the shorter sample of 2013 to 2014 as I describe in Section 5.3. For the specification curves for occupational skill usage (Figure 9), I also use a sample excluding the lowest 2% of observations by job skills to estimate the maximum possible effects if all DACA individuals entering employment are low-skilled. See sample selection in Online Appendix B for details.
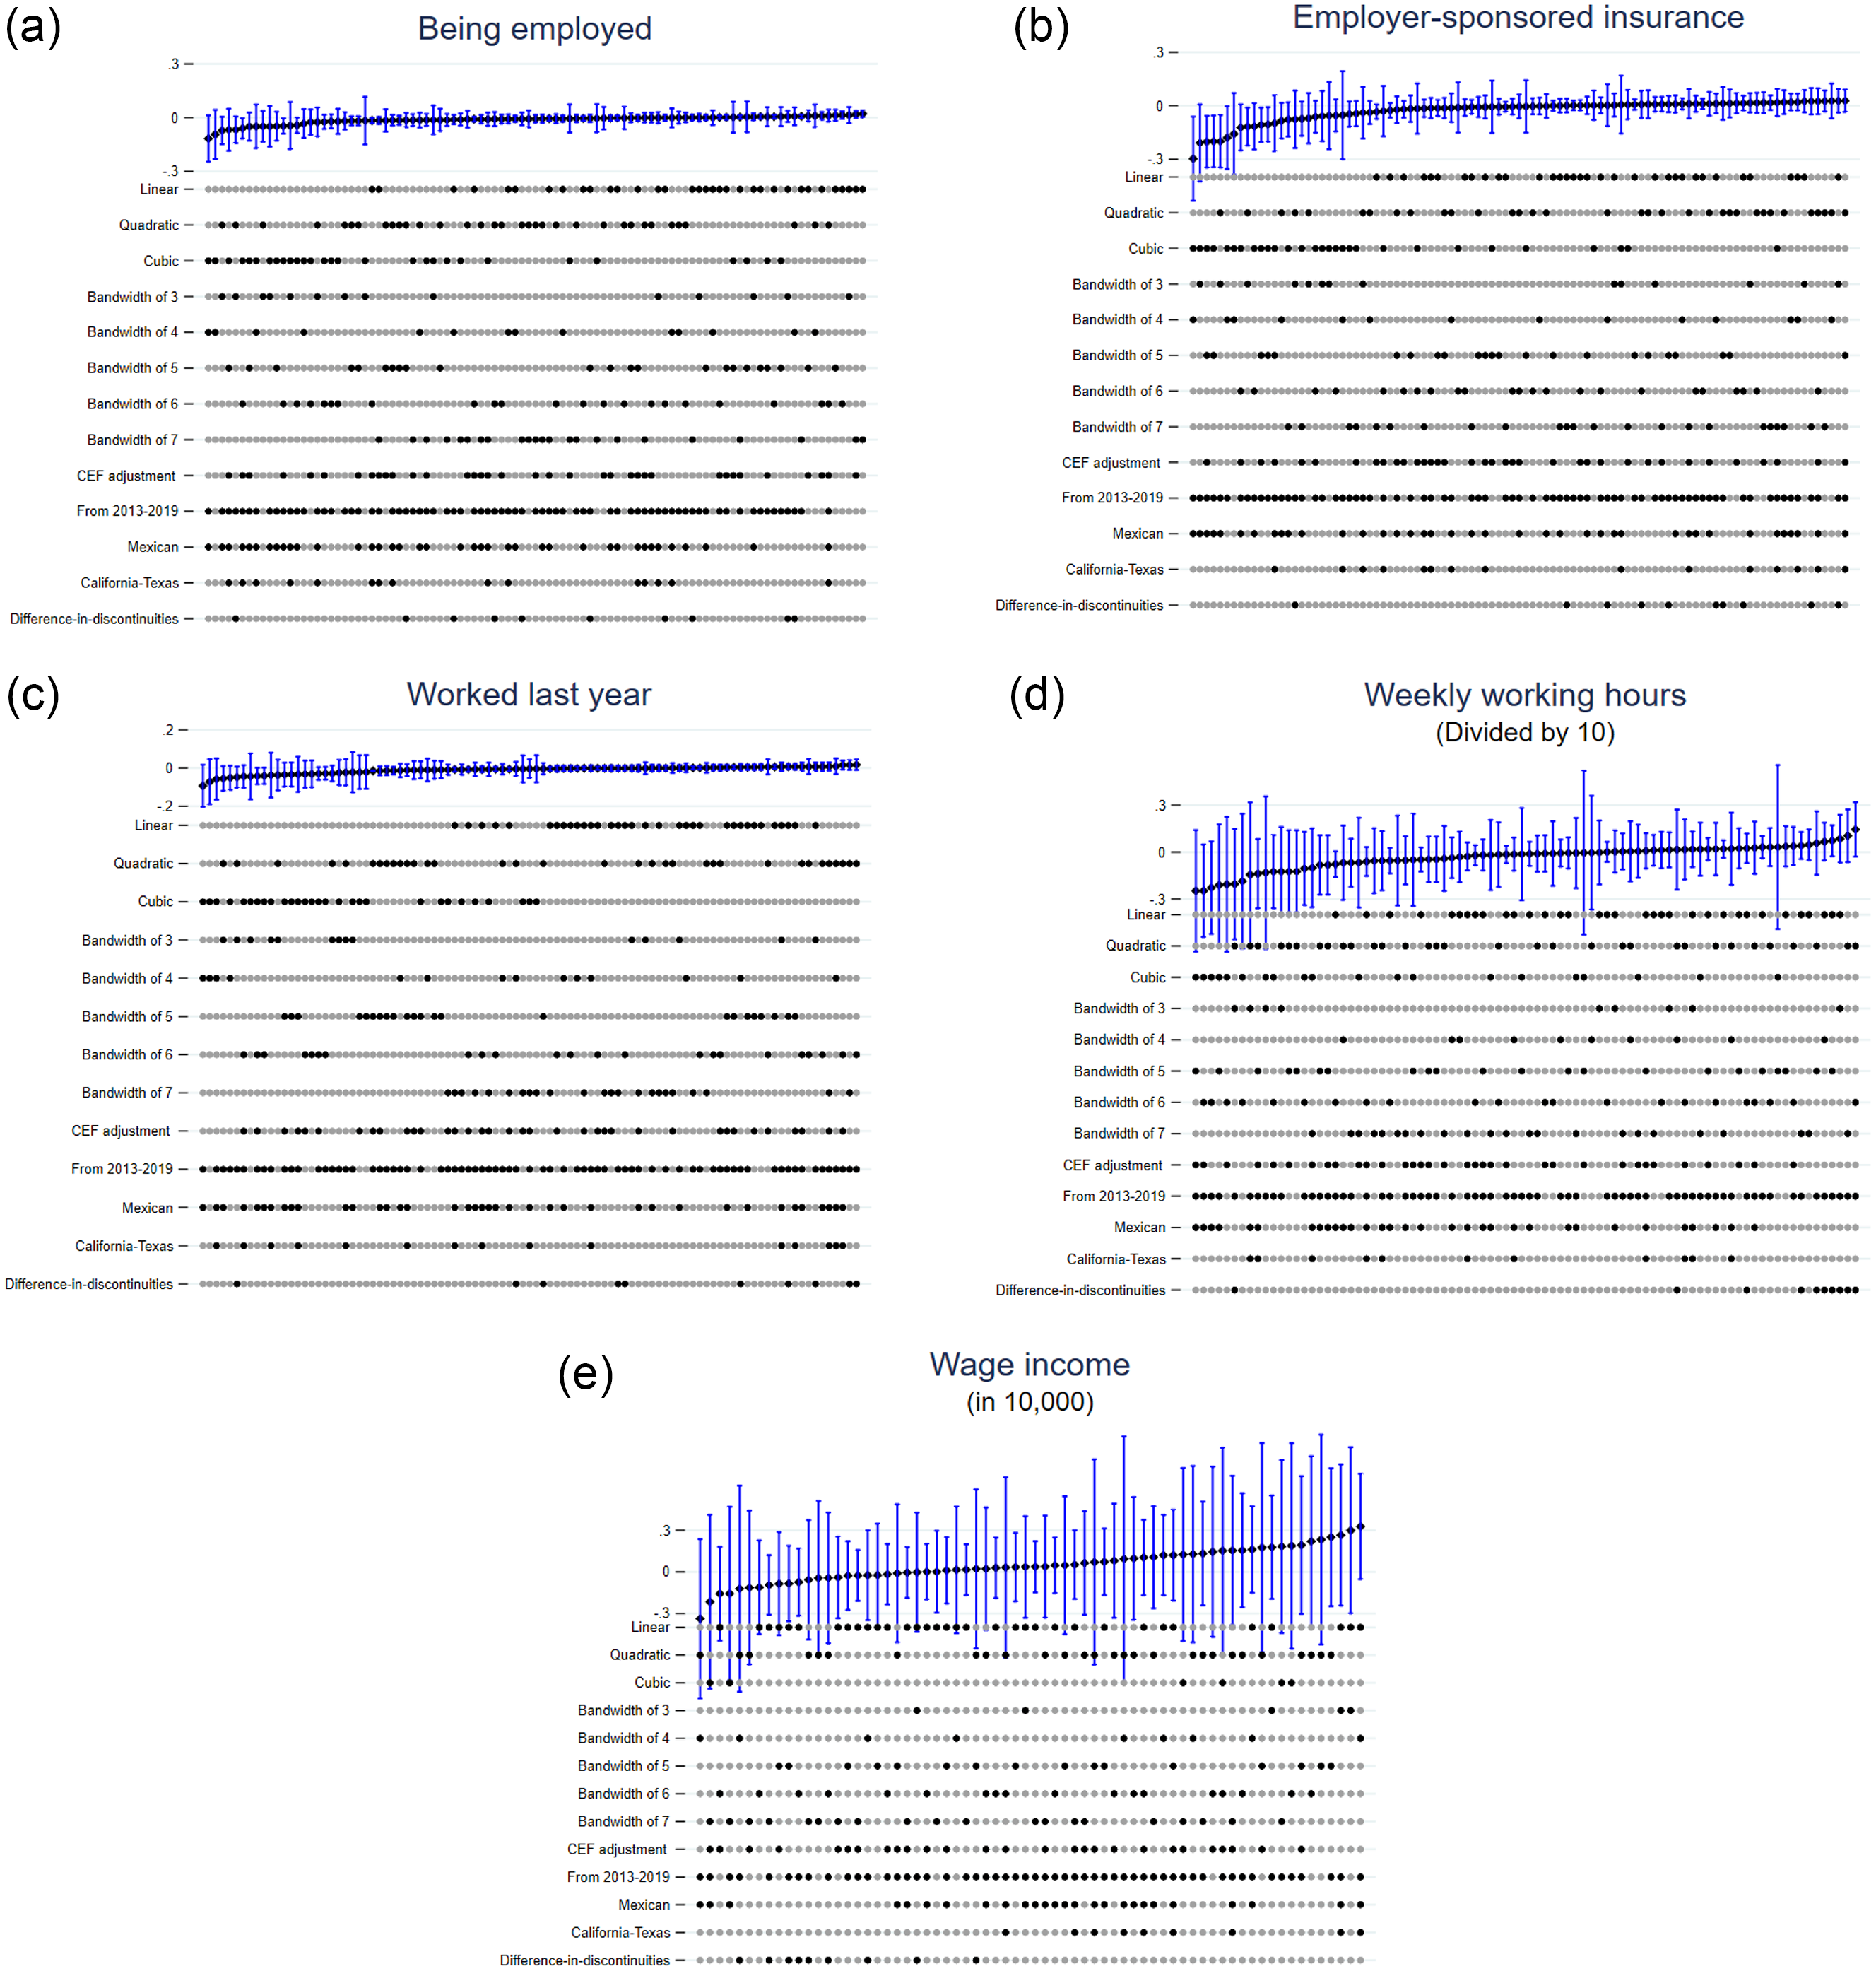
Figure 8: Specification curves on employment outcomes.
Notes: This figure presents the RDD estimates along with 95% confidence intervals for 97 different specification choices (functional forms, bandwidths, samples, and econometric models. The lower panel shows the choices made in each specification (e.g., if the dot in the linear is bold, that specific specification uses the linear functional form). The upper panel shows the RDD estimates and confidence intervals. In sub-figures d) and e), I remove several specification curves with extreme value to enhance the visibility. In sub-figure e), weekly working hours are scaled by a factor of 10. In sub-figure f), wage income is scaled by a factor of 10,000.
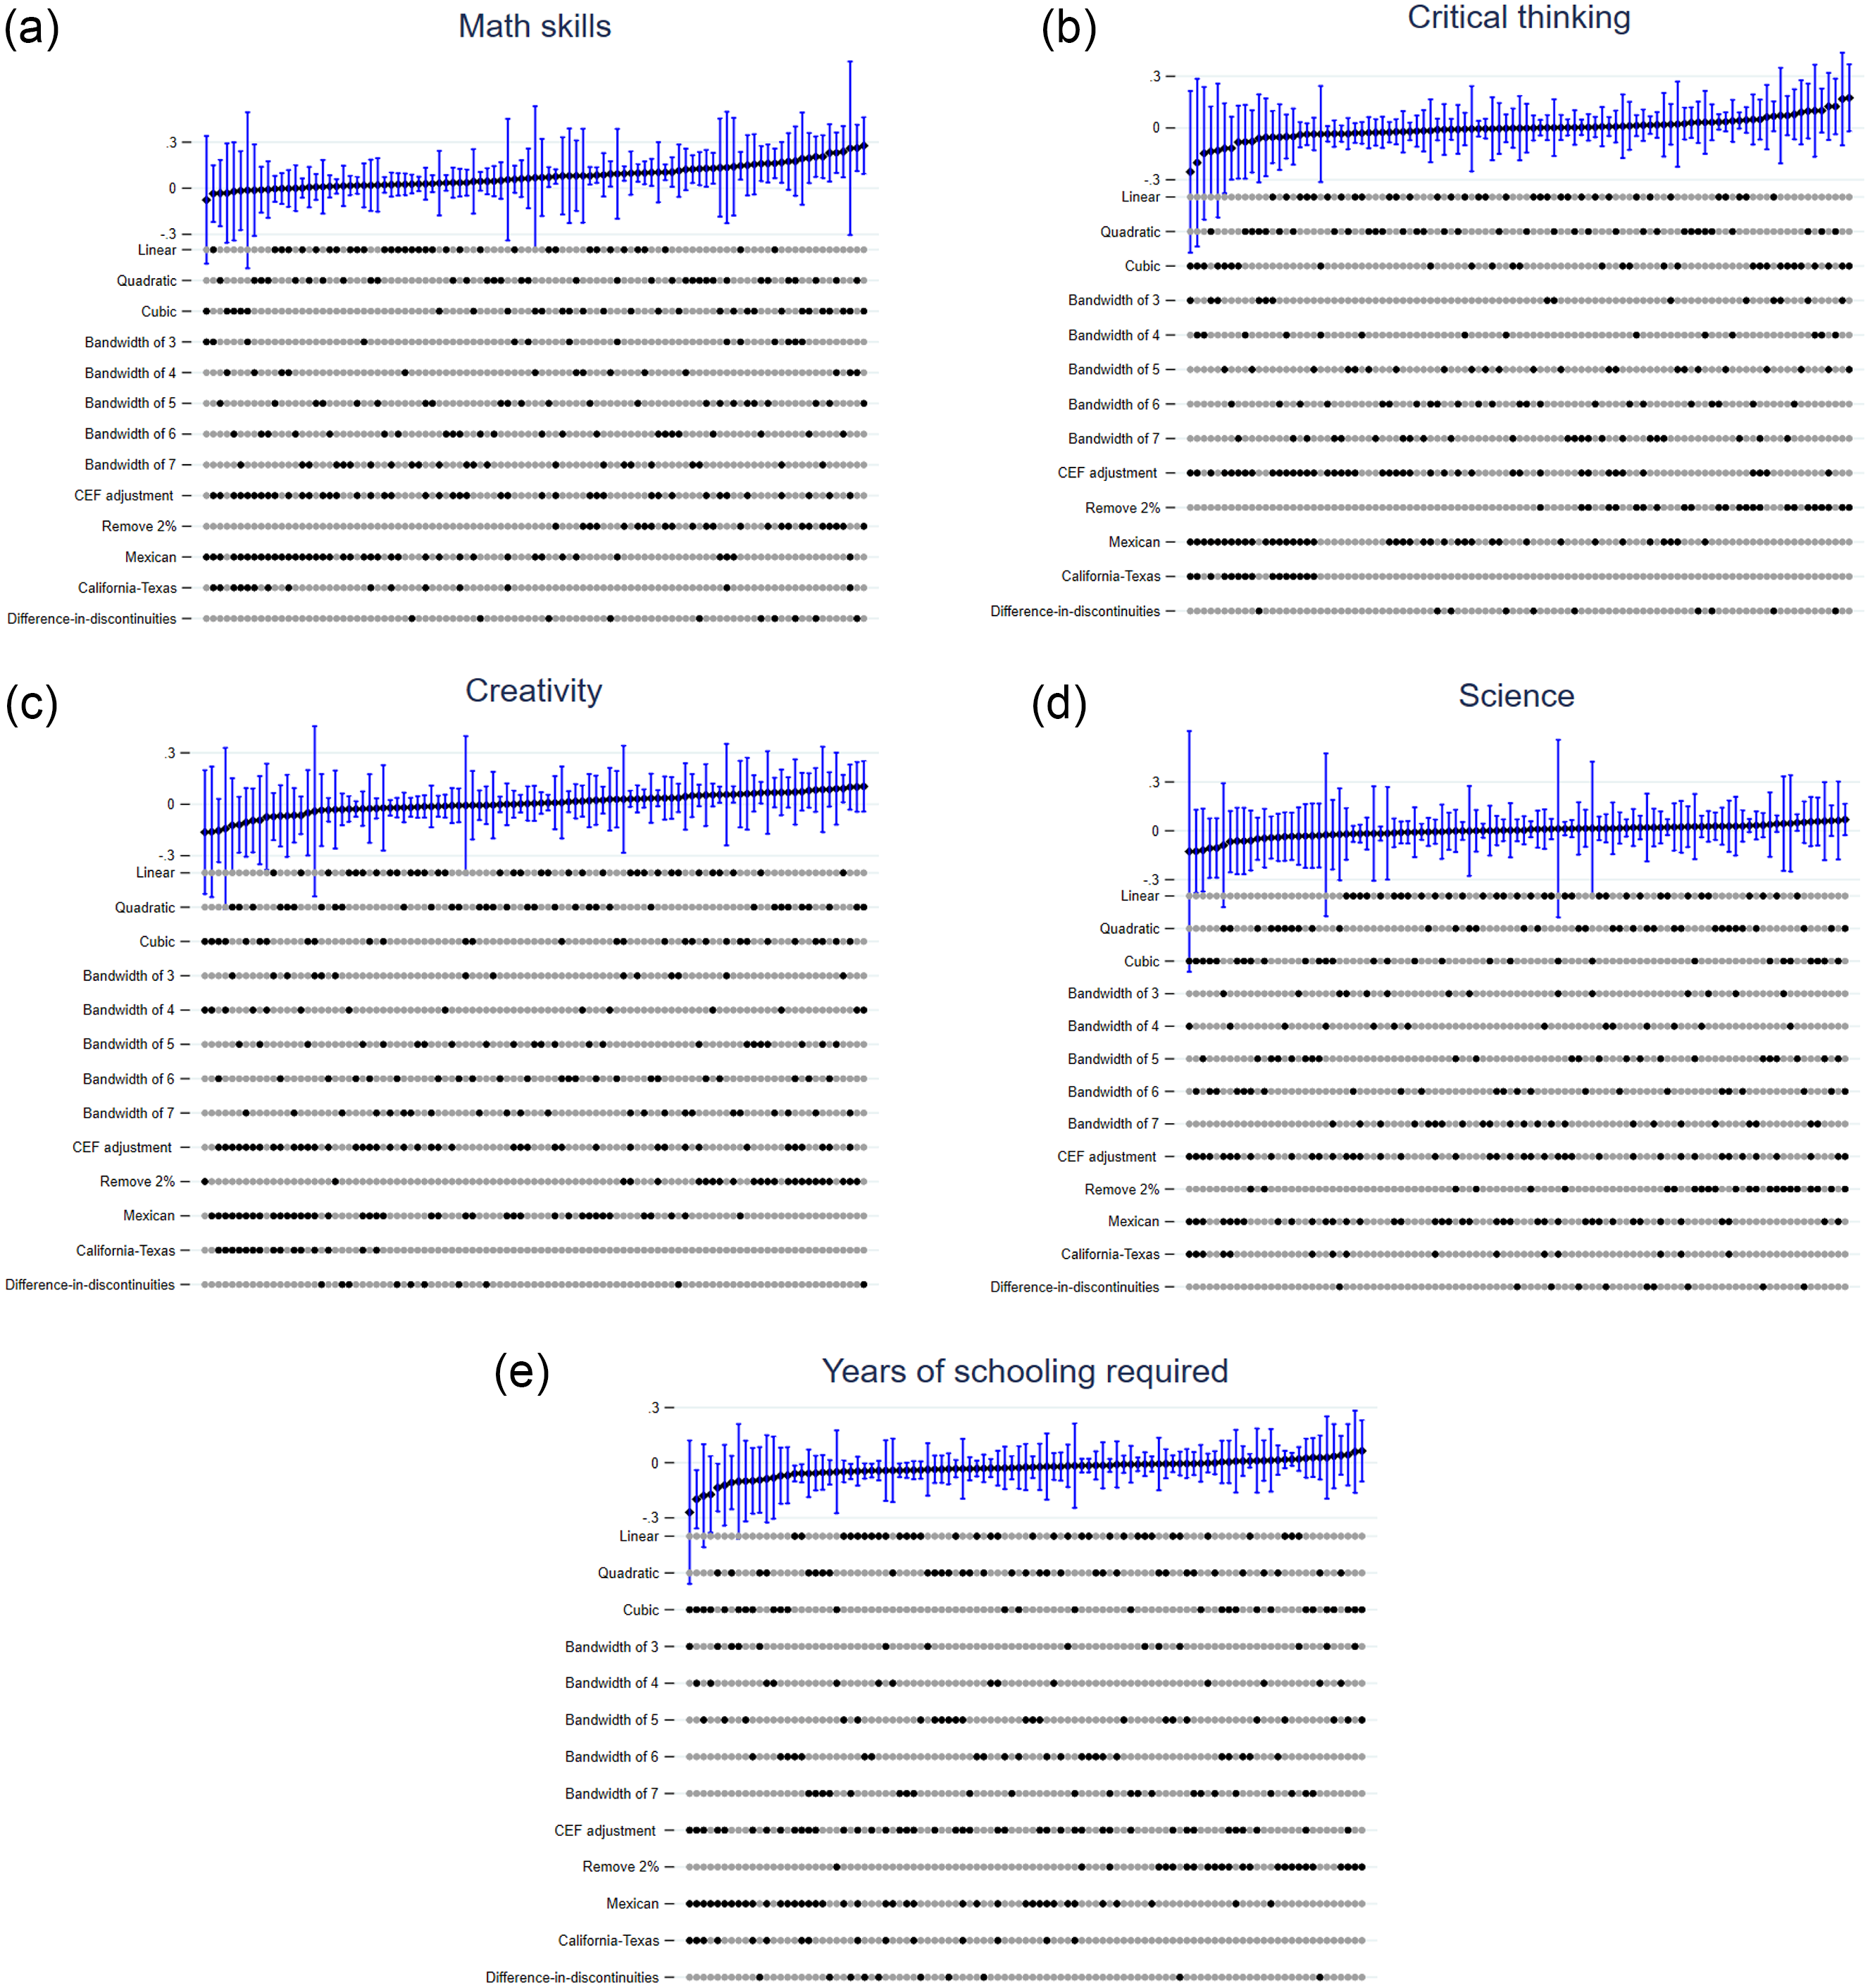
Figure 9: Specification curves on occupational skill usage.
Notes: This figure presents the RDD estimates along with 95% confidence intervals for 97 different specification choices (functional forms, bandwidths, samples, and econometric models. The lower panel shows the choices made in each specification (e.g., if the dot in the linear is bold, that specific specification uses the linear functional form). The upper panel shows the RDD estimates and confidence intervals.
The results from the specification curves show three key points. First, DACA eligibility has minimal and statistically insignificant effects on most labor market outcomes. Second, the few extreme values are associated with the cubic functional form, which are not reliable as discussed in Section 5. Third, in Figure 9, after removing the bottom 2% from each job skill distribution, the effects on occupational skill usage tend to be positive but remain small and statistically insignificant. In general, my main results are robust to a variety of specification choices, and do not heavily depend on bandwidths, methods of imputing legal status, or the choice of econometric models.
6.2. Placebo tests
If the only reason for DACA eligibility affecting labor market outcomes is a temporary legal status, then those effects should be null in samples where DACA eligibility is not relevant. In order to confirm that, I run the main specification on naturalized citizens.Footnote 24
However, one of the concerns on naturalized citizens is that individuals who had been DACA recipients and then were naturalized later on, which would contaminate my estimates. To deal with that issue, I restrict my immigrant citizens to only individuals who were naturalized before 2012.Footnote 25 Table 6 presents the results of DACA eligibility on employment outcomes. It is evident that most of coefficients are negative, but nearly 0. Table 7 presents the results of DACA eligibility on the probability of working in high-skilled jobs among immigrant citizens. Like what I find in Table 6, most of coefficients are statistically insignificant and trivial. In general, I find no evidence that DACA eligibility has impacts on employment and working in high-skilled jobs among naturalized citizens upon the launch of DACA.
Table 6: DACA eligibility and employment outcomes: Naturalized citizens
Confidence intervals are presented in parentheses and calculated with 95% confidence. Standard errors in parentheses are clustered at the state-year level.
Notes: This table shows the placebo tests effects of DACA eligibility on labor market outcomes among naturalized citizens, employing the linear functional form with a bandwidth of 6. Sample includes those who have obtained high-school diploma, have entered the US before their 16th birthday and have immigrated to the US before 2007.
* $p \lt .10$
, **
$p \lt .10$
, ** $p \lt .05$
, ***
$p \lt .05$
, *** $p \lt .01$
.
$p \lt .01$
.
Table 7: DACA eligibility and occupational skill usage: Naturalized citizens
Confidence intervals are presented in parentheses and calculated with 95% confidence. Standard errors in parentheses are clustered at the state-year level. Coefficients are measured in standard deviation.
Notes. This table shows the placebo tests effects of DACA eligibility on job-related skill indices among naturalized citizens, employing the linear functional form with a bandwidth of 6. Sample includes those who have obtained high-school diploma, have entered the US before their 16th birthday and have immigrated to the US before 2007.
* $p \lt .10$
, **
$p \lt .10$
, ** $p \lt .05$
, ***
$p \lt .05$
, *** $p \lt .01$
.
$p \lt .01$
.
In general, I find no evidence that DACA eligibility has the effects on labor market outcomes among people who are not justified by the policy.
7. Conclusion
This paper examines the labor market outcomes of DACA-eligible immigrants. There has been mixed evidence on the effects of DACA on labor market outcomes. This paper differs from the existing literature in econometric model and sample construction. Firstly, this study pioneers the use of the regression discontinuity design, providing independent evidence that does not hinge on the parallel trend assumption found in previous research. Secondly, it conducts a comparative analysis of labor market outcomes between highly comparable treatment and control groups, differing solely in their age as of 2012. This sample construction enhances the precision of the study’s findings.
This paper finds that DACA eligibility has very little effects on the probability of employment, the likelihood of working last year, weekly working hours, and wage income. This study also suggests that there is no empirical evidence that DACA-eligible immigrants advance to higher-skilled employment. The effects identified in this paper are likely localized among individuals around the age of 31 in 2012 (i.e., and older group of DACA recipients), reflecting the specific setup of my econometric model. Even though the samples are not entirely comparable, this study addresses a coding error in Pope (Reference Pope2016) and arrives at quite similar findings for the older cohort of DACA recipients. Due to data constraints, this paper cannot empirically test the underlying mechanisms behind these limited effects. However, potential explanations include employers’ preferences and the temporary nature of DACA. Additionally, although it does not threaten the empirical strategy of this paper, a lower take-up rate may partially explain these findings. This paper contributes to the broader literature on DACA by providing empirical evidence on an older group of DACA recipients, which is in their prime working age, but overlooked in existing studies. Additionally, it also extends the research exploring the heterogeneous effects of DACA, by highlighting the nuanced role of age and policy timing in shaping labor market outcomes.
One limitation of this paper is that the effects are observed locally near the threshold, making it difficult to generalize the findings to all DACA recipients. It is also important to acknowledge that is the trade-off between statistical power and empirical design. Despite this limitation, the results of this paper have significant policy implications, particularly for the undocumented population eligible for DACA in the U.S. According to FWD.us, up to 600,000 individuals were eligible for DACA in 2024 and could benefit from it but were unable to apply due to court orders.Footnote 26 This paper suggests that aging out or being too old at the time of receiving DACA status could significantly reduce the benefits available.
Supplementary material
To view supplementary material for this article, please visit https://doi.org/10.1017/dem.2025.5
Acknowledgements
I am thankful for suggestion and comments from Solomon Polachek, David Slichter, and Sulagna Mookerjee, Jonathan Scott, Ajinkya Keskar, participants in the AEA CSQIEP Virtual Seminar, participants in the US immigration policy session at the 92nd SEA annual meeting, and the labor/applied economics meeting at Binghamton University. I thank the editor, Prof. Hillel Rapoport, and two anonymous referees for their valuable comments and suggestions. All errors are mine.
Competing interests
The author declares none.


 Open access