


1. Introduction
The energy output from the Active Galactic Nucleus (AGN) can influence the evolution of the host galaxy. A small fraction of energy ( ${\sim}1\%$
) from AGN, if coupled with the surroundings, can exceed the gas binding energy in the galaxies (e.g. Fabian Reference Fabian2012; Silk & Rees Reference Silk and Rees1998; Ostriker & Ciotti Reference Ostriker and Ciotti2005). AGN feedback models are often invoked to explain the steep decline in the galaxy mass function (e.g. Bower et al. Reference Bower2006; Croton et al. Reference Croton2006), star formation (SF) quenching in massive galaxies (e.g. Schawinski et al. Reference Schawinski2007; Springel, Di Matteo, & Hernquist Reference Springel, Di Matteo and Hernquist2005), and preventing SF in cooling flows of galaxy clusters (see e.g. McNamara & Nulsen Reference McNamara and Nulsen2007, for review). Furthermore, the correlation between the black hole mass (M
${\sim}1\%$
) from AGN, if coupled with the surroundings, can exceed the gas binding energy in the galaxies (e.g. Fabian Reference Fabian2012; Silk & Rees Reference Silk and Rees1998; Ostriker & Ciotti Reference Ostriker and Ciotti2005). AGN feedback models are often invoked to explain the steep decline in the galaxy mass function (e.g. Bower et al. Reference Bower2006; Croton et al. Reference Croton2006), star formation (SF) quenching in massive galaxies (e.g. Schawinski et al. Reference Schawinski2007; Springel, Di Matteo, & Hernquist Reference Springel, Di Matteo and Hernquist2005), and preventing SF in cooling flows of galaxy clusters (see e.g. McNamara & Nulsen Reference McNamara and Nulsen2007, for review). Furthermore, the correlation between the black hole mass (M $_{BH}$
) and the galaxy bulge velocity dispersion (
$_{BH}$
) and the galaxy bulge velocity dispersion ( $\sigma_b$
; Gebhardt et al. Reference Gebhardt2000; Ferrarese & Merritt Reference Ferrarese and Merritt2000), and similar evolutionary history of black hole growth and SF (e.g. Kormendy & Ho Reference Kormendy and Ho2013, and references therein) suggests that the BH and the SF in a galaxy may co-evolve.
$\sigma_b$
; Gebhardt et al. Reference Gebhardt2000; Ferrarese & Merritt Reference Ferrarese and Merritt2000), and similar evolutionary history of black hole growth and SF (e.g. Kormendy & Ho Reference Kormendy and Ho2013, and references therein) suggests that the BH and the SF in a galaxy may co-evolve.
The energy output from the AGN can interact with a medium via winds, jets, or radiation pressure on dust/gas embedded in the galaxy (e.g. Fabian Reference Fabian2012, and references therein). The impact of radiative mode AGN feedback on SF is not well understood, neither theoretically nor observationally. It is due to a poor understanding of the physical processes responsible for the coupling of AGN radiation with the surrounding medium (Costa et al. Reference Costa, Rosdahl, Sijacki and Haehnelt2018; King & Pounds Reference King and Pounds2015). AGN radiation can interact with the environment via winds, Compton heating, or interaction with dust (Costa et al. Reference Costa, Rosdahl, Sijacki and Haehnelt2018; King & Pounds Reference King and Pounds2015; Ishibashi & Fabian Reference Ishibashi and Fabian2012).
Simulations suggest that wind mode AGN feedback can suppress SF in nuclear regions (within 100 pc) by a factor of 10, and on a large scale (a few kpc), the outflow materials may not escape the host galaxy (Hopkins et al. Reference Hopkins, Torrey, Faucher-Giguère, Quataert and Murray2016). Simulations investigating the effect of Compton heating (Hoon Kim et al. Reference Hoon Kim, Wise, Alvarez and Abel2011) suggest that the central region ( $\sim$
within 0.1–0.2 kpc) will be devoid of molecular gas, as the medium is hot and turbulent, resulting in suppressed SF. However, the outskirts of the galaxy remain unaffected. Simulations/semi-analytical models of radiation pressure-driven AGN feedback coupled with dust suggest that it can drive shells of gas to the outskirts of the galaxy, and stars can form in outflowing shells obscured by dust (Ishibashi & Fabian Reference Ishibashi and Fabian2012; Ishibashi, Fabian, & Canning Reference Ishibashi, Fabian and Canning2013; Costa et al. Reference Costa, Rosdahl, Sijacki and Haehnelt2018). Ishibashi et al. (Reference Ishibashi, Fabian and Canning2013) also suggested that a significant amount of dusty gas can spread over the entire galaxy. Simulations by Costa et al. (Reference Costa, Rosdahl, Sijacki and Haehnelt2018) indicate that the radiation pressure-driven dusty outflows will not escape the galaxy even for a high-luminous AGN.
$\sim$
within 0.1–0.2 kpc) will be devoid of molecular gas, as the medium is hot and turbulent, resulting in suppressed SF. However, the outskirts of the galaxy remain unaffected. Simulations/semi-analytical models of radiation pressure-driven AGN feedback coupled with dust suggest that it can drive shells of gas to the outskirts of the galaxy, and stars can form in outflowing shells obscured by dust (Ishibashi & Fabian Reference Ishibashi and Fabian2012; Ishibashi, Fabian, & Canning Reference Ishibashi, Fabian and Canning2013; Costa et al. Reference Costa, Rosdahl, Sijacki and Haehnelt2018). Ishibashi et al. (Reference Ishibashi, Fabian and Canning2013) also suggested that a significant amount of dusty gas can spread over the entire galaxy. Simulations by Costa et al. (Reference Costa, Rosdahl, Sijacki and Haehnelt2018) indicate that the radiation pressure-driven dusty outflows will not escape the galaxy even for a high-luminous AGN.
Radiation pressure-driven AGN feedback is considered as the possible reason for inside-out growth, typically observed in early-type galaxies at redshift ${\sim} 2$
(van Dokkum et al. Reference van Dokkum2010). The outflows observed in several galaxies (e.g. Carniani et al. Reference Carniani2015) are believed to be due to the radiative mode AGN feedback. However, evidence of its impact on the SF is limited. The studies on a sample of galaxies find contrasting results of the AGN feedback effect on the global star formation rate (SFR) (e.g. Guo et al. Reference Guo2019; Harrison & Ramos Almeida Reference Harrison and Ramos Almeida2024, and references therein). These contrasting results could be due to the relative displacement of the SF from the inner to the outer region without much change in the overall SF, as suggested in simulations (e.g. Robichaud et al. Reference Robichaud, Williamson, Martel, Kawata and Ellison2017). Therefore, studying resolved SF in the galaxies is essential in understanding the effect of AGN feedback. Most of the studies related to spatially resolved SF focus on the inner few kpc scales (Bing et al. Reference Bing2019; George et al. Reference George2018; Joseph, George, & Paul Reference Joseph, George and Paul2022), and studies extending to outer regions of the galaxy are very limited (e.g. Guo et al. Reference Guo2019; Acharya et al. Reference Acharya2024; Sánchez et al. Reference Sánchez2018). Based on H
${\sim} 2$
(van Dokkum et al. Reference van Dokkum2010). The outflows observed in several galaxies (e.g. Carniani et al. Reference Carniani2015) are believed to be due to the radiative mode AGN feedback. However, evidence of its impact on the SF is limited. The studies on a sample of galaxies find contrasting results of the AGN feedback effect on the global star formation rate (SFR) (e.g. Guo et al. Reference Guo2019; Harrison & Ramos Almeida Reference Harrison and Ramos Almeida2024, and references therein). These contrasting results could be due to the relative displacement of the SF from the inner to the outer region without much change in the overall SF, as suggested in simulations (e.g. Robichaud et al. Reference Robichaud, Williamson, Martel, Kawata and Ellison2017). Therefore, studying resolved SF in the galaxies is essential in understanding the effect of AGN feedback. Most of the studies related to spatially resolved SF focus on the inner few kpc scales (Bing et al. Reference Bing2019; George et al. Reference George2018; Joseph, George, & Paul Reference Joseph, George and Paul2022), and studies extending to outer regions of the galaxy are very limited (e.g. Guo et al. Reference Guo2019; Acharya et al. Reference Acharya2024; Sánchez et al. Reference Sánchez2018). Based on H $\alpha$
emission, Guo et al. (Reference Guo2019) suggested that AGN-host galaxies have a lower SFR surface density (
$\alpha$
emission, Guo et al. (Reference Guo2019) suggested that AGN-host galaxies have a lower SFR surface density ( $\Sigma_{\text{SFR}}$
) at all radial bins compared to non-AGN. Acharya et al. (Reference Acharya2024) and Sánchez et al. (Reference Sánchez2018) observed a similar radial profile for
$\Sigma_{\text{SFR}}$
) at all radial bins compared to non-AGN. Acharya et al. (Reference Acharya2024) and Sánchez et al. (Reference Sánchez2018) observed a similar radial profile for $\Sigma_{\text{SFR}}$
in AGN and non-AGN galaxies. The
$\Sigma_{\text{SFR}}$
in AGN and non-AGN galaxies. The $\Sigma_{\text{SFR}}$
is best derived using the individual knot areas obtained from high angular resolution observations. However, previous studies are limited by angular resolution, which restricts them to probe scales of 1 kpc or higher. The study of SF in AGN and non-AGN galaxies, probing the scale of individual stellar clusters, is still missing. Such a spatially resolved study would allow us to probe SF in galaxies unaffected by large-scale morphological features, such as spiral arms in the galaxy. Recently, Nandi et al. (Reference Nandi, Stalin, Dam and Saikia2024) carried out a study of seven Seyfert galaxies using the UltraViolet Imaging Telescope (UVIT) onboard AstroSat, and observed that the nuclear to total SFR ratio of these galaxies correlates with the Eddington ratio of the galaxies. Ananthamoorthy & Bhattacharya (Reference Ananthamoorthy, Bhattacharya, Ghosh and Rao2025) studied one of the nearby galaxies, NGC 1097, and suggested that the
$\Sigma_{\text{SFR}}$
is best derived using the individual knot areas obtained from high angular resolution observations. However, previous studies are limited by angular resolution, which restricts them to probe scales of 1 kpc or higher. The study of SF in AGN and non-AGN galaxies, probing the scale of individual stellar clusters, is still missing. Such a spatially resolved study would allow us to probe SF in galaxies unaffected by large-scale morphological features, such as spiral arms in the galaxy. Recently, Nandi et al. (Reference Nandi, Stalin, Dam and Saikia2024) carried out a study of seven Seyfert galaxies using the UltraViolet Imaging Telescope (UVIT) onboard AstroSat, and observed that the nuclear to total SFR ratio of these galaxies correlates with the Eddington ratio of the galaxies. Ananthamoorthy & Bhattacharya (Reference Ananthamoorthy, Bhattacharya, Ghosh and Rao2025) studied one of the nearby galaxies, NGC 1097, and suggested that the $\Sigma_{\text{SFR}}$
in the nuclear region of the galaxy might have been enhanced due to the AGN positive feedback. However, in these works, the large-scale effect of AGN on SF was not probed.
$\Sigma_{\text{SFR}}$
in the nuclear region of the galaxy might have been enhanced due to the AGN positive feedback. However, in these works, the large-scale effect of AGN on SF was not probed.
In this work, we used high-resolution ( $1.2-1.7^{\prime\prime}$
) UV observations from the UVIT onboard AstroSat (Kumar et al. Reference Kumar, Takahashi and Murray2012; Tandon et al. Reference Tandon2017, Reference Tandon2020) to study spatially resolved SF (scale of
$1.2-1.7^{\prime\prime}$
) UV observations from the UVIT onboard AstroSat (Kumar et al. Reference Kumar, Takahashi and Murray2012; Tandon et al. Reference Tandon2017, Reference Tandon2020) to study spatially resolved SF (scale of $\sim$
50–100 pc) of nearby barred AGN-host galaxies and compared it with a sample of non-AGN galaxies. We restricted the investigation to the outskirts (
$\sim$
50–100 pc) of nearby barred AGN-host galaxies and compared it with a sample of non-AGN galaxies. We restricted the investigation to the outskirts ( $\gt0.5R_{25}$
; R
$\gt0.5R_{25}$
; R $_{25}$
is the isophotal radius corresponding to 25 mag/arcsec
$_{25}$
is the isophotal radius corresponding to 25 mag/arcsec $^{2}$
in B band; de Vaucouleurs et al. Reference de Vaucouleurs1991) of the galaxy as other galaxy components, such as the bar, can drive the SF in the galaxy’s inner regions, which can vary significantly between galaxies. Moreover, theoretical predictions of the effect on SF by different modes of radiative AGN feedback are differentiable in the outer regions of the galaxies (Hopkins et al. Reference Hopkins, Torrey, Faucher-Giguère, Quataert and Murray2016; Hoon Kim et al. Reference Hoon Kim, Wise, Alvarez and Abel2011; Ishibashi et al. Reference Ishibashi, Fabian and Canning2013). Therefore, the study of SF properties on the outskirts of the galaxy can provide crucial insights into the operational mode of feedback in nearby galaxies.
$^{2}$
in B band; de Vaucouleurs et al. Reference de Vaucouleurs1991) of the galaxy as other galaxy components, such as the bar, can drive the SF in the galaxy’s inner regions, which can vary significantly between galaxies. Moreover, theoretical predictions of the effect on SF by different modes of radiative AGN feedback are differentiable in the outer regions of the galaxies (Hopkins et al. Reference Hopkins, Torrey, Faucher-Giguère, Quataert and Murray2016; Hoon Kim et al. Reference Hoon Kim, Wise, Alvarez and Abel2011; Ishibashi et al. Reference Ishibashi, Fabian and Canning2013). Therefore, the study of SF properties on the outskirts of the galaxy can provide crucial insights into the operational mode of feedback in nearby galaxies.
2. Sample and data
2.1 Sample
Our AGN sample is derived from the AGN catalogue of Véron-Cetty & Véron (Reference Véron-Cetty and Véron2010). Galaxies with known redshift and confirmed AGN are considered. We obtained physical properties of the galaxies, such as angular size, inclination angle (angle of line-of-sight with respect to the disk normal), and morphology, from the HyperLedaFootnote a database (Makarov et al. Reference Makarov, Prugniel, Terekhova, Courtois and Vauglin2014), NASA/IPAC Extragalactic Database (NED)Footnote b or SIMBADFootnote c database.
We considered galaxies with an angular diameter of $\gt 5^\prime$
to facilitate a spatially resolved study of the SF properties. We selected only galaxies with inclination angle
$\gt 5^\prime$
to facilitate a spatially resolved study of the SF properties. We selected only galaxies with inclination angle $\lt 60^{\circ}$
and located away from the Galactic plane (
$\lt 60^{\circ}$
and located away from the Galactic plane ( $|b|\gt10^{\circ}$
). The cutoff on inclination angle was applied to minimise the effect of attenuation of the UV emission intrinsic to the host galaxy, and the Galactic latitude limit was imposed to avoid severe extinction from our Galaxy. As elliptical galaxies have little ongoing SF and are typically UV faint, we considered only spiral galaxies for the current study. Also, the galaxies with good quality FUV observations from AstroSat-UVIT are considered for the study. The flowchart of the criteria used for AGN sample selection with the number of galaxies present at each step is provided in Figure 1. We noticed that two galaxies, NGC 4450 and NGC 4579, did not have any detected UV knots beyond 0.7 R
$|b|\gt10^{\circ}$
). The cutoff on inclination angle was applied to minimise the effect of attenuation of the UV emission intrinsic to the host galaxy, and the Galactic latitude limit was imposed to avoid severe extinction from our Galaxy. As elliptical galaxies have little ongoing SF and are typically UV faint, we considered only spiral galaxies for the current study. Also, the galaxies with good quality FUV observations from AstroSat-UVIT are considered for the study. The flowchart of the criteria used for AGN sample selection with the number of galaxies present at each step is provided in Figure 1. We noticed that two galaxies, NGC 4450 and NGC 4579, did not have any detected UV knots beyond 0.7 R $_{25}$
. As this study focuses mainly on the possible effect of AGN feedback at the outskirts of the galaxy, we excluded these galaxies from further analysis. Finally, we have six AGN-host galaxies in our sample. All the galaxies are barred and of morphological type between b and c types. As the bars can significantly impact the SF of the galaxy, a careful selection of control galaxies (also having bars) is essential. For the control sample, we searched for the galaxies in the HyperLeda, NED, and SIMBAD databases (a) classified as non-AGN based on earlier published results, (b) with angular size
$_{25}$
. As this study focuses mainly on the possible effect of AGN feedback at the outskirts of the galaxy, we excluded these galaxies from further analysis. Finally, we have six AGN-host galaxies in our sample. All the galaxies are barred and of morphological type between b and c types. As the bars can significantly impact the SF of the galaxy, a careful selection of control galaxies (also having bars) is essential. For the control sample, we searched for the galaxies in the HyperLeda, NED, and SIMBAD databases (a) classified as non-AGN based on earlier published results, (b) with angular size $\gt 5^{\prime}$
, (c) inclination angle
$\gt 5^{\prime}$
, (c) inclination angle $\lt 60^{\circ}$
, (d) having a bar, (e) morphological class similar to those of AGN galaxies, and (f) availability of UVIT observation. We could obtain four non-AGN galaxies as a control sample.
$\lt 60^{\circ}$
, (d) having a bar, (e) morphological class similar to those of AGN galaxies, and (f) availability of UVIT observation. We could obtain four non-AGN galaxies as a control sample.

Figure 1. The flowchart for the criteria used for selection of AGN sample.
In Nandi et al. (Reference Nandi, Stalin, Dam and Saikia2024), NGC 4321 was considered as an AGN-host/transition galaxy. However, using X-ray and other multiband data, González-Martín et al. (Reference González-Martn, Masegosa, Márquez, Guainazzi and Jiménez-Bailón2009) suggested that this galaxy does not show any evidence for the presence of AGN. Therefore, we have considered this galaxy in a control sample for this study. The physical properties of the AGN host and control galaxies in the sample are provided in Table 1.
Table 1. Details of the galaxy properties in our sample.

Notes: Col.(1): Name of the galaxy. Col.(2) and Col.(3): Right ascension and Declination (J2000; from NED). Col.(4): Morphology (from HyperLeda). Col.(5): Optical Radius (de Vaucouleurs et al. Reference de Vaucouleurs1991, NED) in arcsec and kpc. Col.(6): Distance (from NED). Col.(7): Position Angle of the galaxy measured from the north (de Vaucouleurs et al. Reference de Vaucouleurs1991, NED). Col.(8): Ratio of minor to major axis (de Vaucouleurs et al. Reference de Vaucouleurs1991, NED). Col.(9): BH mass. For NGC 3486, we used the M $_{BH}$
vs.
$_{BH}$
vs. $\sigma_b$
relation by Woo & Urry (Reference Woo and Urry2002) and the velocity dispersion values from Barth, Ho, & Sargent (Reference Barth, Ho and Sargent2002) to derive M
$\sigma_b$
relation by Woo & Urry (Reference Woo and Urry2002) and the velocity dispersion values from Barth, Ho, & Sargent (Reference Barth, Ho and Sargent2002) to derive M $_{BH}$
. Col.(10): Log of AGN bolometric luminosity (in ergs s
$_{BH}$
. Col.(10): Log of AGN bolometric luminosity (in ergs s $^{-1}$
). For NGC 3486 and NGC 1672, we used the relation by Spinoglio, Fernández-Ontiveros, & Malkan (Reference Spinoglio, Fernández-Ontiveros and Malkan2024) to convert the 2–10 keV X-ray luminosity to AGN bolometric luminosity (L
$^{-1}$
). For NGC 3486 and NGC 1672, we used the relation by Spinoglio, Fernández-Ontiveros, & Malkan (Reference Spinoglio, Fernández-Ontiveros and Malkan2024) to convert the 2–10 keV X-ray luminosity to AGN bolometric luminosity (L $_{bol,AGN}$
). Col.(11): AGN Type (Véron-Cetty & Véron Reference Véron-Cetty and Véron2010). S: Unclassified Seyfert; S1.5: Seyfert-1.5; S1n: narrow-line Seyfert-1 galaxy. S2: Seyfert-2; S3b: Low Ionisation Nuclear Emission Region (LINER) with broad Balmer lines. Col.(12) Reference for BH mass and AGN luminosity.
$_{bol,AGN}$
). Col.(11): AGN Type (Véron-Cetty & Véron Reference Véron-Cetty and Véron2010). S: Unclassified Seyfert; S1.5: Seyfert-1.5; S1n: narrow-line Seyfert-1 galaxy. S2: Seyfert-2; S3b: Low Ionisation Nuclear Emission Region (LINER) with broad Balmer lines. Col.(12) Reference for BH mass and AGN luminosity.
References: a: Onishi et al. (Reference Onishi, Iguchi, Sheth and Kohno2015); b: Nelson & Whittle (Reference Nelson and Whittle1995); c: Woo & Urry (Reference Woo and Urry2002); d: Combes et al. (Reference Combes2019); e: Barth et al. (Reference Barth, Ho and Sargent2002); f: Denney et al. (Reference Denney2010); g: Atkinson et al. (Reference Atkinson2005); h: Berrier et al. (Reference Berrier2013); i: Ferrarese (Reference Ferrarese2002); j: Sarzi et al. (Reference Sarzi2002); k: Spinoglio et al. (Reference Spinoglio, Fernández-Ontiveros and Malkan2024); l: Jenkins et al. (Reference Jenkins2011); m: Annuar et al. (Reference Annuar2020).
2.2 Data
2.2.1 AstroSat-UVIT
UVIT onboard AstroSat consists of two Ritchey-Chretien (RC) telescopes. One telescope operates in the Far-UV (FUV; 130–180 nm), while the other covers the Near-UV (NUV; 200–300 nm) as well as the optical (VIS) band (e.g. Kumar et al. Reference Kumar, Takahashi and Murray2012; Tandon et al. Reference Tandon2017, Reference Tandon2020). The UVIT provides a $14^{\prime}$
radius Field of View (FOV) alongside an angular resolution of
$14^{\prime}$
radius Field of View (FOV) alongside an angular resolution of ${\sim} 1.2$
–
${\sim} 1.2$
– $1.5^{\prime\prime}$
. Observations presented here are carried out in photon-counting mode, with a readout rate of
$1.5^{\prime\prime}$
. Observations presented here are carried out in photon-counting mode, with a readout rate of ${\sim} 29$
frames per second.
${\sim} 29$
frames per second.
Table 2. Details of AstroSat-UVIT and GALEX observations.

Notes: $^{\text{a}}$
Full Width at Half Maximum (FWHM) of the point sources in the FOV from UVIT observations.
$^{\text{a}}$
Full Width at Half Maximum (FWHM) of the point sources in the FOV from UVIT observations.
Level-1 data for AstroSat-UVIT are obtained from the Indian Space Science Data Center (ISSDC).Footnote
d
We used the archival observations in the FUV BaF2 (F154W; $\lambda_{mean} = 1\,541$
Å) or FUV CaF2 (F148W;
$\lambda_{mean} = 1\,541$
Å) or FUV CaF2 (F148W; $\lambda_{mean} = 1\,481 $
Å) filters of UVIT (Tandon et al. Reference Tandon2020). Table 2 provides the details of the observations used in this work. Level-1 data are processed through the CCDLAB (Postma & Leahy Reference Postma and Leahy2021) pipeline to obtain Level-2 images and exposure maps. In the case of NGC 3351, two observations are present with the F148W filter. We combined these observations using CCDLAB. The final images of these ten galaxies have a plate scale of
$\lambda_{mean} = 1\,481 $
Å) filters of UVIT (Tandon et al. Reference Tandon2020). Table 2 provides the details of the observations used in this work. Level-1 data are processed through the CCDLAB (Postma & Leahy Reference Postma and Leahy2021) pipeline to obtain Level-2 images and exposure maps. In the case of NGC 3351, two observations are present with the F148W filter. We combined these observations using CCDLAB. The final images of these ten galaxies have a plate scale of ${\sim} 0.416^{\prime\prime}$
and an angular resolution of 1.2–1.7
${\sim} 0.416^{\prime\prime}$
and an angular resolution of 1.2–1.7 $^{\prime\prime}$
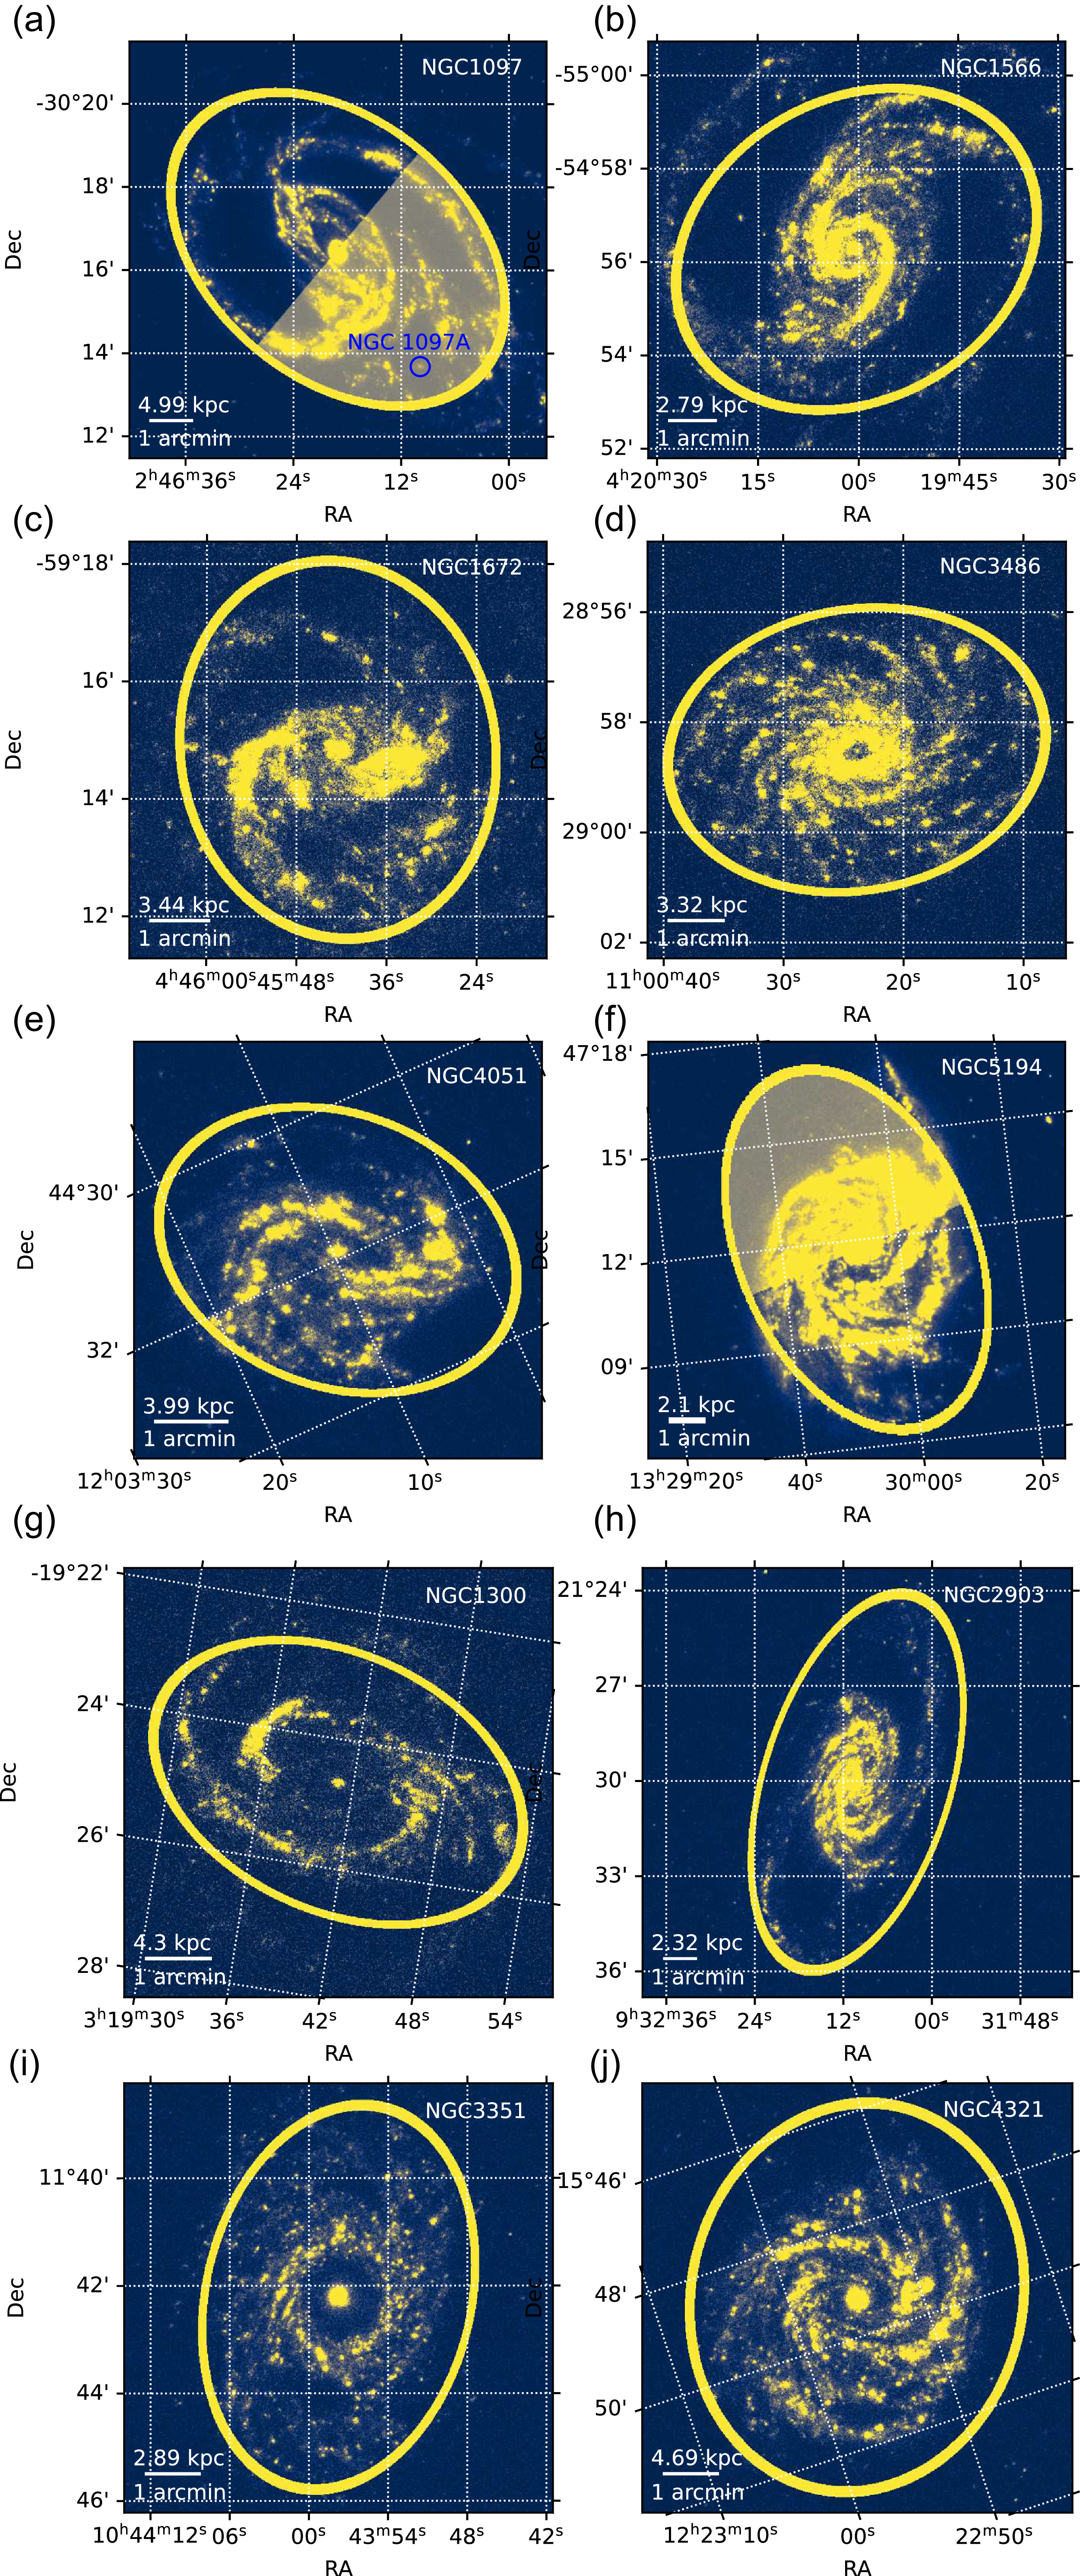
. The UVIT images of individual galaxies are provided in Figure 2.
$^{\prime\prime}$
. The UVIT images of individual galaxies are provided in Figure 2.

Figure 2. UVIT images of galaxies in the sample. The first three rows correspond to AGN-host galaxies, and the last two rows correspond to non-AGN galaxies. The ellipse in each image represents the galaxy’s optical radius (R $_{25}$
). For NGC 1097 (Panel (a)), the position of the companion galaxy, NGC 1097A, is marked in the blue circle. For NGC 1097 and NGC 5194 (Panels (a) and (f)), the shaded elliptical region corresponds to the region affected by the merger. These masked regions are excluded from the study of AGN’s impact on these galaxies (see Section-3).
$_{25}$
). For NGC 1097 (Panel (a)), the position of the companion galaxy, NGC 1097A, is marked in the blue circle. For NGC 1097 and NGC 5194 (Panels (a) and (f)), the shaded elliptical region corresponds to the region affected by the merger. These masked regions are excluded from the study of AGN’s impact on these galaxies (see Section-3).
2.3 Galaxy evolution explorer (GALEX)
GALEX has a modified RC telescope with a diameter of 50 cm observing in the FUV (1 350–1 750Å; $\lambda_{eff} = 1\,538.6\,$
Å) and NUV (1 750–2 750Å;
$\lambda_{eff} = 1\,538.6\,$
Å) and NUV (1 750–2 750Å; $\lambda_{eff} = 2\,315.7\,$
Å) bands (Martin et al. Reference Martin2005; Morrissey et al. Reference Morrissey2007). The telescope has an FOV of 1.2
$\lambda_{eff} = 2\,315.7\,$
Å) bands (Martin et al. Reference Martin2005; Morrissey et al. Reference Morrissey2007). The telescope has an FOV of 1.2 $^\circ$
diameter with an angular resolution of 4.5–5
$^\circ$
diameter with an angular resolution of 4.5–5 $^{\prime\prime}$
. Level-2 science-ready archival photometry observations from GALEX in the FUV (
$^{\prime\prime}$
. Level-2 science-ready archival photometry observations from GALEX in the FUV ( $\lambda_{eff} = 1\,538.6\,$
Å) and NUV (
$\lambda_{eff} = 1\,538.6\,$
Å) and NUV ( $\lambda_{eff} = 2\,315.7\,$
Å) bands are obtained from the Mikulski Archive for Space Telescopes (MAST) portal.Footnote
e
The calibrated intensity and effective exposure map images with an angular resolution of 4.5–5
$\lambda_{eff} = 2\,315.7\,$
Å) bands are obtained from the Mikulski Archive for Space Telescopes (MAST) portal.Footnote
e
The calibrated intensity and effective exposure map images with an angular resolution of 4.5–5 $^{\prime\prime}$
are used for the analysis (Morrissey et al. Reference Morrissey2007). We used the observation tiles having both FUV and NUV observations for a given galaxy. Details of the observation used are provided in Table 2.
$^{\prime\prime}$
are used for the analysis (Morrissey et al. Reference Morrissey2007). We used the observation tiles having both FUV and NUV observations for a given galaxy. Details of the observation used are provided in Table 2.
3. Analysis and results
3.1 Astrometry
Astrometry solutions for the UVIT observations are first attempted with CCDLAB (Postma & Leahy Reference Postma and Leahy2020, Reference Postma and Leahy2021) using the Gaia catalogue (Gaia Collaboration et al. 2018). If CCDLAB is unsuccessful, then we use SCAMP (version 2.10.0; Bertin Reference Bertin, Gabriel, Arviset, Ponz and Enrique2006) with the GALEX catalogue (provided in the GR6/7 data release) to obtain the astrometry solution. For two galaxies, NGC 4051 and NGC 1300, CCDLAB and SCAMP failed to provide correct astrometry solutions. For these galaxies, we visually identified a few sources in the FOV against GALEX observations, and an astrometry solution is obtained using ccmap and cctran tasks in the Image Reduction and Analysis Facility (IRAF).Footnote f
3.2 UV Analysis and SFR calculation
We used a publicly available software package, SExtractor (Bertin & Arnouts Reference Bertin and Arnouts1996), to identify the SF knots from UVIT images. The background and threshold are calculated using the method described in Ananthamoorthy et al. (Reference Ananthamoorthy, Bhattacharya and Sreekumar2024), which accounts for the Poisson distribution of UVIT astrophysical background. Source detection is carried out with a deblending parameter value (DB_MINCOUNT) of $5 \times 10^{-7}$
as the region is crowded (see, Bordoloi et al. Reference Bordoloi2024, for details).
$5 \times 10^{-7}$
as the region is crowded (see, Bordoloi et al. Reference Bordoloi2024, for details).
We limited the analysis to the knots detected up to the R $_{25}$
of these galaxies. Flux measurements are carried out on background-subtracted images where the background is calculated in source-free regions outside the extent of the galaxy. We used FLUX_AUTO from SExtrcator to compute the source flux, which contains
$_{25}$
of these galaxies. Flux measurements are carried out on background-subtracted images where the background is calculated in source-free regions outside the extent of the galaxy. We used FLUX_AUTO from SExtrcator to compute the source flux, which contains $\sim$
94% of the total source flux (Piridi et al. Reference Piridi, Kumar, Pandey and Pradhan2024; Bertin & Arnouts Reference Bertin and Arnouts1996). We converted the flux in counts per second (CPS) to erg cm
$\sim$
94% of the total source flux (Piridi et al. Reference Piridi, Kumar, Pandey and Pradhan2024; Bertin & Arnouts Reference Bertin and Arnouts1996). We converted the flux in counts per second (CPS) to erg cm $^{-2}$
s
$^{-2}$
s $^{-1}$
Å
$^{-1}$
Å $^{-1}$
using the unit conversion factor provided in Tandon et al. (Reference Tandon2017). Knots with high detection significance (
$^{-1}$
using the unit conversion factor provided in Tandon et al. (Reference Tandon2017). Knots with high detection significance ( $\gtrsim 5\sigma$
) are only considered for further analysis to avoid any possible spurious detection due to lower DB_MINCOUNT. To avoid contamination from the foreground stars, sources with NUV to FUV flux ratio (obtained from GALEX image as described later in this section) greater than 10 are removed (Bigiel et al. Reference Bigiel2008).
$\gtrsim 5\sigma$
) are only considered for further analysis to avoid any possible spurious detection due to lower DB_MINCOUNT. To avoid contamination from the foreground stars, sources with NUV to FUV flux ratio (obtained from GALEX image as described later in this section) greater than 10 are removed (Bigiel et al. Reference Bigiel2008).
The measured fluxes for the individual knots are corrected for the foreground Galactic extinction (Cardelli, Clayton, & Mathis Reference Cardelli, Clayton and Mathis1989) using the visual extinction values of Schlafly & Finkbeiner (Reference Schlafly and Finkbeiner2011). Further, they are corrected for internal attenuation using UV colour from GALEX observation. To derive the UV colour, GALEX FUV images are brought into NUV resolution by convolving the FUV images with the Gaussian convolution filter of $\sigma \sim 0.901$
pixels of GALEX. The background, calculated outside the region of the galaxy in the FOV, is subtracted in both FUV and NUV images. The UV flux is measured in the box of 5
$\sigma \sim 0.901$
pixels of GALEX. The background, calculated outside the region of the galaxy in the FOV, is subtracted in both FUV and NUV images. The UV flux is measured in the box of 5 $\times$
5 pixels (
$\times$
5 pixels ( $\sim$
FWHM of GALEX) centred on each knot detected from the UVIT observation. The box size is increased by another pixel in case of a negative value of CPS in either FUV or NUV images. The CPS is converted to the magnitude using the zero-point magnitudes provided in Morrissey et al. (Reference Morrissey2007).
$\sim$
FWHM of GALEX) centred on each knot detected from the UVIT observation. The box size is increased by another pixel in case of a negative value of CPS in either FUV or NUV images. The CPS is converted to the magnitude using the zero-point magnitudes provided in Morrissey et al. (Reference Morrissey2007).
The UV spectral slope ( $\beta$
) is calculated from the GALEX magnitudes using the relation,
$\beta$
) is calculated from the GALEX magnitudes using the relation, $\beta\!=\![(m_1\!-\!m_2)/(\!-2.5\log\frac{\lambda_1}{\lambda_2})] -2$
(Nordon et al. Reference Nordon2013), where
$\beta\!=\![(m_1\!-\!m_2)/(\!-2.5\log\frac{\lambda_1}{\lambda_2})] -2$
(Nordon et al. Reference Nordon2013), where $m_1$
and
$m_1$
and $m_2$
are the magnitudes in the GALEX FUV and NUV bands, respectively, and
$m_2$
are the magnitudes in the GALEX FUV and NUV bands, respectively, and $\lambda_1$
and
$\lambda_1$
and $\lambda_2$
are the corresponding wavelengths. The
$\lambda_2$
are the corresponding wavelengths. The $\beta$
is used to calculate the colour excess, E(B-V), using the relation (Reddy et al. Reference Reddy2018),
$\beta$
is used to calculate the colour excess, E(B-V), using the relation (Reddy et al. Reference Reddy2018), $\beta = -2.616+4.684\text{E(B-V)}$
. Further, the Calzetti relation (Calzetti et al. Reference Calzetti2000), as given below (where
$\beta = -2.616+4.684\text{E(B-V)}$
. Further, the Calzetti relation (Calzetti et al. Reference Calzetti2000), as given below (where $\lambda$
is expressed in
$\lambda$
is expressed in $\unicode{x03BC}$
m), is used to obtain the relative attenuation (
$\unicode{x03BC}$
m), is used to obtain the relative attenuation ( $k_{\lambda}$
) at the FUV wavelength.
$k_{\lambda}$
) at the FUV wavelength.
 \begin{align} k_{\lambda} = 2.659\left[-2.156+\frac{1.509}{\lambda}-\frac{0.198}{\lambda^2}+\frac{0.011}{\lambda^3}\right] + R^{\prime}_{V}\;,\end{align}
We considered a $R^{\prime}_V =4.05\pm0.8$
(Calzetti et al. Reference Calzetti2000). Attenuation at UVIT wavelength (A
$R^{\prime}_V =4.05\pm0.8$
(Calzetti et al. Reference Calzetti2000). Attenuation at UVIT wavelength (A $_{\text{FUV}}$
) is calculated using the relation (Calzetti et al. Reference Calzetti2000), A
$_{\text{FUV}}$
) is calculated using the relation (Calzetti et al. Reference Calzetti2000), A $_{\lambda} = (0.44\pm0.03)\text{E(B-V)}k_{\lambda}$
. A small fraction of knots (
$_{\lambda} = (0.44\pm0.03)\text{E(B-V)}k_{\lambda}$
. A small fraction of knots ( $0.27\%$
) yielded negative attenuation. For these knots, a median attenuation value of the corresponding galaxy is considered. The attenuation-corrected UV luminosity (
$0.27\%$
) yielded negative attenuation. For these knots, a median attenuation value of the corresponding galaxy is considered. The attenuation-corrected UV luminosity ( $\text{L}_{\text{FUV}}$
) is used to derive the SFR (
$\text{L}_{\text{FUV}}$
) is used to derive the SFR ( $\text{SFR}_{\text{FUV}}$
) using the following relation (Iglesias-Páramo et al. Reference Iglesias-Páramo2006; Cortese, Gavazzi, & Boselli Reference Cortese, Gavazzi and Boselli2008).
$\text{SFR}_{\text{FUV}}$
) using the following relation (Iglesias-Páramo et al. Reference Iglesias-Páramo2006; Cortese, Gavazzi, & Boselli Reference Cortese, Gavazzi and Boselli2008).
 \begin{align}\text{SFR}_{\text{FUV}}(\text{M}_\odot \text{yr}^{-1}) = \frac{\text{L}_{\text{FUV}} (\text{erg s}^{-1})}{3.83 \times 10^{33}} \times 10^{-9.51}\;\end{align}
3.3 Effect of mergers
The galaxies NGC 1097 and NGC 5194 are interacting strongly with the neighbouring galaxies NGC 1097A and NGC 5195, respectively. Simulations and observations have suggested that mergers can trigger SF in the host galaxy (e.g. Bournaud Reference Bournaud2011, and references therein). The merger-induced impact on SF could be maximum at the regions of ongoing merger due to morphological disturbances (e.g. Brandl et al. Reference Brandl2009) and in the nuclear regions due to driving of gas to the central region (e.g. Barnes & Hernquist Reference Barnes and Hernquist1991). Therefore, we calculated the $\Sigma_{\text{SFR}}$
and other SF properties away from the merger-affected regions for these galaxies. We considered the SF knots detected in the semi-elliptical region (cut along the galaxy minor axis) away from the companion galaxy, as shown in Panels (a) and (f) of Figure 2.
$\Sigma_{\text{SFR}}$
and other SF properties away from the merger-affected regions for these galaxies. We considered the SF knots detected in the semi-elliptical region (cut along the galaxy minor axis) away from the companion galaxy, as shown in Panels (a) and (f) of Figure 2.
3.4 Size of the SF region and $\Sigma_{\text{SFR}}$

The ellipse parameters, i.e. the semi-major axis and the semi-minor axis, obtained from SExtractor, are used to derive the area of the individual knots. The area is corrected for the angular resolution of the UVIT (FWHM for each observation is provided in Table 2), considering that the knots have a spatial distribution of a 2D-elliptical Gaussian function (Nandi et al. Reference Nandi, Stalin, Dam and Saikia2024). For a fraction of faint UV knots, the size along the major and/or minor axis is less than the $\sigma$
of the UVIT point spread function (PSF). It could be due to the poorer constraint on the fitted ellipse parameters in SExtractor for faint sources. For these sources,
$\sigma$
of the UVIT point spread function (PSF). It could be due to the poorer constraint on the fitted ellipse parameters in SExtractor for faint sources. For these sources, $\sigma$
of the UVIT PSF is considered as the knot size along that axis. The SFR is divided by the area for each knot to obtain the
$\sigma$
of the UVIT PSF is considered as the knot size along that axis. The SFR is divided by the area for each knot to obtain the $\Sigma_{\text{SFR}}$
of the knot in the unit of M
$\Sigma_{\text{SFR}}$
of the knot in the unit of M $_\odot$
yr
$_\odot$
yr $^{-1}$
kpc
$^{-1}$
kpc $^{-2}$
(e.g. Kennicutt & Evans Reference Kennicutt and Evans2012). The number of knots detected, median area of the knots,
$^{-2}$
(e.g. Kennicutt & Evans Reference Kennicutt and Evans2012). The number of knots detected, median area of the knots, $\Sigma_{\text{SFR}}$
, and total SFR of individual galaxies are provided in Table 3. The SFR values provided in Table 3 can differ from those available in the existing studies. One such example is that Song et al. (Reference Song2021) quoted the UV SFR value as
$\Sigma_{\text{SFR}}$
, and total SFR of individual galaxies are provided in Table 3. The SFR values provided in Table 3 can differ from those available in the existing studies. One such example is that Song et al. (Reference Song2021) quoted the UV SFR value as $0.69\pm0.03$
M
$0.69\pm0.03$
M $_\odot$
yr
$_\odot$
yr $^{-1}$
for NGC 1097 (in their Table 5) in contrast to
$^{-1}$
for NGC 1097 (in their Table 5) in contrast to $11.59\pm0.35$
M
$11.59\pm0.35$
M $_\odot$
yr
$_\odot$
yr $^{-1}$
estimated in this work. We notice that intrinsic attenuation correction is the primary factor that was responsible for this difference in the SFR.
$^{-1}$
estimated in this work. We notice that intrinsic attenuation correction is the primary factor that was responsible for this difference in the SFR.
3.5
$\Sigma_{\text{SFR}}$
and A
$_{\text{FUV}}$
in the outer regions of the galaxy


The UV SFR of knots is divided by the total area of knots in a radial bin to obtain $\Sigma_{\text{SFR}}$
as a function of the distance (relative to
$\Sigma_{\text{SFR}}$
as a function of the distance (relative to $R_{25}$
) from the galaxy centre. It is to be noted that though the derived SFR depends on the distance to the galaxy, the
$R_{25}$
) from the galaxy centre. It is to be noted that though the derived SFR depends on the distance to the galaxy, the $\Sigma_{\text{SFR}}$
is independent of the distance. In this paper, all references to the radial bin are relative to
$\Sigma_{\text{SFR}}$
is independent of the distance. In this paper, all references to the radial bin are relative to $R_{25}$
, and also knots corresponding to each radial bin are extracted in an elliptical annular region accounting for the inclination angle of the galaxy. The
$R_{25}$
, and also knots corresponding to each radial bin are extracted in an elliptical annular region accounting for the inclination angle of the galaxy. The $\Sigma_{\text{SFR}}$
at different radial bins is averaged for different galaxies (separately for AGN-host and non-AGN galaxies) to obtain the average
$\Sigma_{\text{SFR}}$
at different radial bins is averaged for different galaxies (separately for AGN-host and non-AGN galaxies) to obtain the average $\Sigma_{\text{SFR}}$
as a function of the distance from the centre. The ratio of the average
$\Sigma_{\text{SFR}}$
as a function of the distance from the centre. The ratio of the average $\Sigma_{\text{SFR}}$
for AGN-host and non-AGN galaxies is provided in the Upper Panel of Figure 3, which clearly shows the enhancement in
$\Sigma_{\text{SFR}}$
for AGN-host and non-AGN galaxies is provided in the Upper Panel of Figure 3, which clearly shows the enhancement in $\Sigma_{\text{SFR}}$
for UV SF knots at radius
$\Sigma_{\text{SFR}}$
for UV SF knots at radius $\gt0.6 R_{25}$
of AGN-host galaxies. Therefore, in comparison to the non-AGN galaxies, a significant enhancement of
$\gt0.6 R_{25}$
of AGN-host galaxies. Therefore, in comparison to the non-AGN galaxies, a significant enhancement of $\Sigma_{\text{SFR}}$
on the outskirts of the AGN-host galaxies suggests a possible positive AGN feedback.
$\Sigma_{\text{SFR}}$
on the outskirts of the AGN-host galaxies suggests a possible positive AGN feedback.
We also derive radial profiles of A $_{\text{FUV}}$
for individual galaxies using the median A
$_{\text{FUV}}$
for individual galaxies using the median A $_{\text{FUV}}$
of the knots in each radial bin. Next, we estimate the A
$_{\text{FUV}}$
of the knots in each radial bin. Next, we estimate the A $_{\text{FUV}}$
in each radial bin averaged over (a) all AGN-host and (b) all non-AGN galaxies. The ratio of A
$_{\text{FUV}}$
in each radial bin averaged over (a) all AGN-host and (b) all non-AGN galaxies. The ratio of A $_{\text{FUV}}$
averaged over all AGN-host galaxies to that of all non-AGN galaxies is provided in the Lower Panel of Figure 3. It suggests that AGN-host galaxies have higher dust in the outer region compared to non-AGN galaxies, most likely due to AGN feedback.
$_{\text{FUV}}$
averaged over all AGN-host galaxies to that of all non-AGN galaxies is provided in the Lower Panel of Figure 3. It suggests that AGN-host galaxies have higher dust in the outer region compared to non-AGN galaxies, most likely due to AGN feedback.
We further examine the rate of decrease in $\Sigma_{\text{SFR}}$
and A
$\Sigma_{\text{SFR}}$
and A $_{\text{FUV}}$
in the outer regions (
$_{\text{FUV}}$
in the outer regions ( $\gt0.5R_{25}$
) of each galaxy by fitting a linear function of the form
$\gt0.5R_{25}$
) of each galaxy by fitting a linear function of the form $X(r) = ar+b$
, where X is
$X(r) = ar+b$
, where X is $\log_{10}(\Sigma_{\text{SFR}})$
and A
$\log_{10}(\Sigma_{\text{SFR}})$
and A $_{\text{FUV}}$
respectively.
$_{\text{FUV}}$
respectively.
Table 3. Details of the global SF properties of the galaxies.

Notes: $^{\text{a}}$
Median Absolute Deviation for the distribution.
$^{\text{a}}$
Median Absolute Deviation for the distribution.
The values in the table are for the entire galaxy. The regions affected by the merger are not excluded for NGC 1097 and NGC 5194.

Figure 3. Upper Panel: Ratio of average $\Sigma_{\text{SFR}}$
of AGN-host and non-AGN galaxies as a function of distance from the centre. Lower Panel: Ratio of average A
$\Sigma_{\text{SFR}}$
of AGN-host and non-AGN galaxies as a function of distance from the centre. Lower Panel: Ratio of average A $_{\text{FUV}}$
of AGN-host and non-AGN galaxies as a function of distance from the centre.
$_{\text{FUV}}$
of AGN-host and non-AGN galaxies as a function of distance from the centre.
It is to be noted that the radial profiles for all the galaxies are not strictly linear. However, this parametric approach provides the overall radial trend in $\Sigma_{\text{SFR}}$
and A
$\Sigma_{\text{SFR}}$
and A $_{\text{FUV}}$
of a galaxy. In the case of
$_{\text{FUV}}$
of a galaxy. In the case of $\Sigma_{\text{SFR}}$
, the slopes of the individual AGN and non-AGN galaxies are provided in Figure 4(a) and (b), respectively. The average slope for AGN-host galaxies is
$\Sigma_{\text{SFR}}$
, the slopes of the individual AGN and non-AGN galaxies are provided in Figure 4(a) and (b), respectively. The average slope for AGN-host galaxies is $0.60\pm0.09$
, as shown in the shaded region on Figure 4(a) and (b). We notice that the non-AGN galaxies have relatively steeper individual slopes than the average slope observed in AGN-host galaxies. We also noticed that this trend exists without correcting the
$0.60\pm0.09$
, as shown in the shaded region on Figure 4(a) and (b). We notice that the non-AGN galaxies have relatively steeper individual slopes than the average slope observed in AGN-host galaxies. We also noticed that this trend exists without correcting the $\Sigma_{\text{SFR}}$
for intrinsic extinction correction. This effect is found to be prominent for galaxies hosting relatively lower mass central black holes. This finding suggests that
$\Sigma_{\text{SFR}}$
for intrinsic extinction correction. This effect is found to be prominent for galaxies hosting relatively lower mass central black holes. This finding suggests that $\Sigma_{\text{SFR}}$
of knots in the outskirts of AGN-host galaxies, particularly for the lower black hole mass systems, fall off less rapidly than in non-AGN galaxies. Further, for non-AGN galaxies, we notice a possible flattening of the slopes with increasing central black hole mass. However, given the small sample size (4 galaxies), the statistical significance of this trend is not strong.
$\Sigma_{\text{SFR}}$
of knots in the outskirts of AGN-host galaxies, particularly for the lower black hole mass systems, fall off less rapidly than in non-AGN galaxies. Further, for non-AGN galaxies, we notice a possible flattening of the slopes with increasing central black hole mass. However, given the small sample size (4 galaxies), the statistical significance of this trend is not strong.
The slopes of the radial profile of A $_{\text{FUV}}$
for individual AGN and non-AGN galaxies are shown in Figure 4(c) and (d), respectively. The shaded region indicates the average slope (
$_{\text{FUV}}$
for individual AGN and non-AGN galaxies are shown in Figure 4(c) and (d), respectively. The shaded region indicates the average slope ( $0.55\pm0.08$
) for the AGN-host galaxies. Similar to
$0.55\pm0.08$
) for the AGN-host galaxies. Similar to $\Sigma_{\text{SFR}}$
, A
$\Sigma_{\text{SFR}}$
, A $_{\text{FUV}}$
slopes in the AGN-host galaxies are flatter than those in the non-AGN galaxies. Here, we also noticed that the effect is primarily seen in the systems with relatively lower-mass central black holes.
$_{\text{FUV}}$
slopes in the AGN-host galaxies are flatter than those in the non-AGN galaxies. Here, we also noticed that the effect is primarily seen in the systems with relatively lower-mass central black holes.
We propose that due to the positive AGN feedback, more gas and dust were moved to the outskirts of the AGN-host galaxies than the non-AGN ones. Further, in our sample, the AGN feedback is prominent in relatively lower-mass black hole systems.

Figure 4. Panel (a): Slopes of straight lines fitted to the radial profile of $\log_{10}(\Sigma_{\text{SFR}})$
for individual AGN galaxies in the galaxy outskirts as a function of M
$\log_{10}(\Sigma_{\text{SFR}})$
for individual AGN galaxies in the galaxy outskirts as a function of M $_{BH}$
. The mean slope for AGN galaxies and the corresponding 1-
$_{BH}$
. The mean slope for AGN galaxies and the corresponding 1- $\sigma$
error (shaded region) are provided for reference. Panel (b): Same as Panel (a) but for non-AGN galaxies. The mean slope for AGN galaxies is provided for reference. Panel (c): Slopes of straight lines fitted to the radial profile of A
$\sigma$
error (shaded region) are provided for reference. Panel (b): Same as Panel (a) but for non-AGN galaxies. The mean slope for AGN galaxies is provided for reference. Panel (c): Slopes of straight lines fitted to the radial profile of A $_{\text{FUV}}$
for individual galaxies in the galaxy outskirts as a function of M
$_{\text{FUV}}$
for individual galaxies in the galaxy outskirts as a function of M $_{BH}$
. Panel (d): Same as Panel (c) but for non-AGN galaxies.
$_{BH}$
. Panel (d): Same as Panel (c) but for non-AGN galaxies.
3.6 Kolmogorov–Smirnov and Anderson-Darling test
We carried out the commonly used 2-sample Kolmogorov-Smirnov (KS) (e.g. Rizzo Reference Rizzo2007) to check if differences in slope values of $\Sigma_{\text{SFR}}$
and A
$\Sigma_{\text{SFR}}$
and A $_{\text{FUV}}$
between AGN and non-AGN are statistically significant. We used the ks_2samp routine in scipy.stats package in Python to carryout the analysis. Under the null hypothesis that the distribution for AGN and non-AGN is equal, we obtained a p-value of 0.048 for
$_{\text{FUV}}$
between AGN and non-AGN are statistically significant. We used the ks_2samp routine in scipy.stats package in Python to carryout the analysis. Under the null hypothesis that the distribution for AGN and non-AGN is equal, we obtained a p-value of 0.048 for $\Sigma_{\text{SFR}}$
slopes. The test favours the alternative hypothesis that ‘AGN have flatter slopes than non-AGN’ at a confidence level
$\Sigma_{\text{SFR}}$
slopes. The test favours the alternative hypothesis that ‘AGN have flatter slopes than non-AGN’ at a confidence level ${\sim} 95\%$
. In addition, we also used a 2-sample Anderson-Darling (AD) test (Anderson & Darling Reference Anderson and Darling1954; Pettitt Reference Pettitt1976) to compare the distributions. We used the anderson_ksamp routine in scipy.stats package for this analysis. The AD statistic also yielded a similar confidence level (
${\sim} 95\%$
. In addition, we also used a 2-sample Anderson-Darling (AD) test (Anderson & Darling Reference Anderson and Darling1954; Pettitt Reference Pettitt1976) to compare the distributions. We used the anderson_ksamp routine in scipy.stats package for this analysis. The AD statistic also yielded a similar confidence level ( ${\sim} 96\%$
), which marginally favours the alternative hypothesis. For A
${\sim} 96\%$
), which marginally favours the alternative hypothesis. For A $_{\text{FUV}}$
, the p-value is between 0.023–0.033 for both tests, which also marginally favours the alternative hypothesis.
$_{\text{FUV}}$
, the p-value is between 0.023–0.033 for both tests, which also marginally favours the alternative hypothesis.
4. Discussion and conclusions
4.1 Effect of bar and mergers
All galaxies in our sample are barred, and bar strength can have an impact on the SF of the host galaxy (Robichaud et al. Reference Robichaud, Williamson, Martel, Kawata and Ellison2017). Therefore, we obtained the bar strength parameter ( $Q_b$
) for the galaxies in our sample from the earlier works, which are provided in Table 4. Though our sample size is limited, we did not observe any significant dependence of the slope of
$Q_b$
) for the galaxies in our sample from the earlier works, which are provided in Table 4. Though our sample size is limited, we did not observe any significant dependence of the slope of $\Sigma_{\text{SFR}}$
with
$\Sigma_{\text{SFR}}$
with $Q_b$
, suggesting that the bar effect on SF of the outer regions might be minimal in our sample.
$Q_b$
, suggesting that the bar effect on SF of the outer regions might be minimal in our sample.
Table 4. Bar strength and Asymmetry parameter for the galaxies.

Notes: References: a: Cisternas et al. (Reference Cisternas2013); b: Buta et al. (Reference Buta2009); c: Laurikainen & Salo (Reference Laurikainen and Salo2002); d: Buta et al. (Reference Buta, Vasylyev, Salo and Laurikainen2005).
Mergers can also significantly impact the SF of the host galaxy. Although we excluded the region with close interaction with the nearby galaxy for NGC 1097 and NGC 5194, the merger can still influence the global SF of the galaxy (e.g. Moreno et al. Reference Moreno2021). We used the non-parametric asymmetry parameter (A; Rodriguez-Gomez et al. Reference Rodriguez-Gomez2019; Conselice, Bershady, & Jangren Reference Conselice, Bershady and Jangren2000) for the galaxies in our sample to look for a possible merger effect. Galaxies undergoing a merger are expected to have a larger asymmetry due to disturbed morphology (e.g. Conselice et al. Reference Conselice, Bershady and Jangren2000). We used STATMORPH routine (Rodriguez-Gomez et al. Reference Rodriguez-Gomez2019) in Python for deriving the asymmetry parameter using UVIT observations. As galaxies are well resolved in UV with many substructures, we noticed that the extracted asymmetry parameter could be driven to local minima (Conselice et al. Reference Conselice, Bershady and Jangren2000), yielding a higher value. To avoid such an overestimation, substantial smoothing of the image was essential. We smoothed the UVIT images with a Gaussian convolution filter of ${\sim} 3$
FWHM (9 pixels). The parameter values obtained are provided in Table 4. The values obtained are comparable with the asymmetry parameters derived in earlier studies using UV observation (Holwerda et al. Reference Holwerda2011). We did not notice any significant difference in the asymmetry parameter value for NGC 1097 and NGC 5194 (interacting systems) compared to the other galaxies. We also did not observe any significant dependence on this parameter with a slope of
${\sim} 3$
FWHM (9 pixels). The parameter values obtained are provided in Table 4. The values obtained are comparable with the asymmetry parameters derived in earlier studies using UV observation (Holwerda et al. Reference Holwerda2011). We did not notice any significant difference in the asymmetry parameter value for NGC 1097 and NGC 5194 (interacting systems) compared to the other galaxies. We also did not observe any significant dependence on this parameter with a slope of $\Sigma_{\text{SFR}}$
. Therefore, mergers may not be driving/biasing the difference in the radial profiles of AGN and non-AGN galaxies in our sample.
$\Sigma_{\text{SFR}}$
. Therefore, mergers may not be driving/biasing the difference in the radial profiles of AGN and non-AGN galaxies in our sample.
4.2 Possible mechanism for enhanced
$\Sigma_{\text{SFR}}$
in the outskirts of AGN-host galaxies

The enhanced $\Sigma_{\text{SFR}}$
for UV knots in the outskirts of AGN-host galaxies compared to non-AGN galaxies could indicate AGN-triggered SF in the outskirts of the galaxies. The observed relatively flatter slope of
$\Sigma_{\text{SFR}}$
for UV knots in the outskirts of AGN-host galaxies compared to non-AGN galaxies could indicate AGN-triggered SF in the outskirts of the galaxies. The observed relatively flatter slope of $\Sigma_{\text{SFR}}$
in individual AGN-host galaxies further supports this claim. Our analysis also shows that the outer regions of the AGN-host galaxies have higher A
$\Sigma_{\text{SFR}}$
in individual AGN-host galaxies further supports this claim. Our analysis also shows that the outer regions of the AGN-host galaxies have higher A $_{\text{FUV}}$
compared to the non-AGN galaxies, indicating that the feedback might be coupled with dust. Furthermore, the observed relatively flatter slope of A
$_{\text{FUV}}$
compared to the non-AGN galaxies, indicating that the feedback might be coupled with dust. Furthermore, the observed relatively flatter slope of A $_{\text{FUV}}$
in individual AGN-host galaxies supports this proposition. The statistical tests also marginally favour the different radial profiles for AGN and non-AGN galaxies.
$_{\text{FUV}}$
in individual AGN-host galaxies supports this proposition. The statistical tests also marginally favour the different radial profiles for AGN and non-AGN galaxies.
The enhanced specific SFR on the outskirts of AGN-host galaxies was observed by Sánchez et al. (Reference Sánchez2018) and Acharya et al. (Reference Acharya2024). Sánchez et al. (Reference Sánchez2018) also noticed the flatter gas surface density in the AGN-host galaxies. However, the gas surface density was derived from visual extinction, which is also a good tracer of dust. Therefore, this finding also indicates a higher presence of dust in the outskirts of galaxies, which is consistent with our observation.
As the AGN-host galaxies in our sample are weak-jetted, the prominent AGN feedback mechanism could be via the radiative mode. However, the L $_{bol, AGN}$
of AGN (provided in Table 1) in our sample is lower than the typical critical luminosity (
$_{bol, AGN}$
of AGN (provided in Table 1) in our sample is lower than the typical critical luminosity ( ${\sim} 10^{46}$
erg s
${\sim} 10^{46}$
erg s $^{-1}$
) for launching outflow (Costa et al. Reference Costa, Rosdahl, Sijacki and Haehnelt2018; Ishibashi & Fabian Reference Ishibashi and Fabian2012). This low luminosity suggests the current activity state may not be able to drive strong outflows in the galaxy. Therefore, if the observed effect is due to AGN feedback, then it could be by ‘fossil outflows’ as suggested by Ishibashi & Fabian (Reference Ishibashi and Fabian2018), where past powerful AGN activity/episodic events could have driven outflows. Overall results of this study are consistent with ‘the SFR enhancement correlated with fading of AGN’ scenario as suggested in simulations (Zubovas & Bourne Reference Zubovas and Bourne2017).
$^{-1}$
) for launching outflow (Costa et al. Reference Costa, Rosdahl, Sijacki and Haehnelt2018; Ishibashi & Fabian Reference Ishibashi and Fabian2012). This low luminosity suggests the current activity state may not be able to drive strong outflows in the galaxy. Therefore, if the observed effect is due to AGN feedback, then it could be by ‘fossil outflows’ as suggested by Ishibashi & Fabian (Reference Ishibashi and Fabian2018), where past powerful AGN activity/episodic events could have driven outflows. Overall results of this study are consistent with ‘the SFR enhancement correlated with fading of AGN’ scenario as suggested in simulations (Zubovas & Bourne Reference Zubovas and Bourne2017).
It should be noted that the temporal luminosity evolution of AGN is still uncertain. With simplest models like exponential decay (Ishibashi & Fabian Reference Ishibashi and Fabian2018), a decay time scale of a few Myr is essential to explain the enhanced $\Sigma_{\text{SFR}}$
with fading of AGN (assuming stellar populations have an age of a few 10 Myr; Sánchez-Gil et al. Reference Sánchez-Gil2011). This value is comparable to typically used/derived AGN activity time scales (1 Myr; Hickox et al. Reference Hickox2014; Ishibashi & Fabian Reference Ishibashi and Fabian2018; Harrison & Ramos Almeida Reference Harrison and Ramos Almeida2024). However, future multiband observations at a similar spatial scale and associated stellar populations modelling to estimate their age are essential to understand the time scales of SF to connect with the AGN activity time scale.
$\Sigma_{\text{SFR}}$
with fading of AGN (assuming stellar populations have an age of a few 10 Myr; Sánchez-Gil et al. Reference Sánchez-Gil2011). This value is comparable to typically used/derived AGN activity time scales (1 Myr; Hickox et al. Reference Hickox2014; Ishibashi & Fabian Reference Ishibashi and Fabian2018; Harrison & Ramos Almeida Reference Harrison and Ramos Almeida2024). However, future multiband observations at a similar spatial scale and associated stellar populations modelling to estimate their age are essential to understand the time scales of SF to connect with the AGN activity time scale.
The possible mode through which AGN feedback can influence the SF is via radiation-pressure-driven AGN feedback via dust or radiative wind (e.g. King & Pounds Reference King and Pounds2015; Ishibashi & Fabian Reference Ishibashi and Fabian2012). The simulations by Costa et al. (Reference Costa, Rosdahl, Sijacki and Haehnelt2018) suggest that the radiation-pressure-driven AGN feedback via dust can drive outflows. According to Ishibashi & Fabian (Reference Ishibashi and Fabian2012) and Ishibashi et al. (Reference Ishibashi, Fabian and Canning2013), the radiation pressure-driven feedback can drive the shells of dust and gas towards the outer region of a galaxy. SF can occur in the outer regions of the galaxy, obscured by dust, resulting in enhanced SF and dust in the outer regions. Even wind-mode feedback can enhance the SF on the outskirts of the galaxy. It is suggested that wind-mode feedback can remove gas from the galaxy bulge, but may trigger SF in the galaxy disk (e.g. King & Pounds Reference King and Pounds2015, and references therein).
In this work, we cannot rule out the possibility of both wind and radiation-pressure-driven via dust modes of AGN feedback. However, as radiation-pressure-driven AGN feedback via dust mode preferentially couples with the dust, the study of dust-to-gas density ratio, extending up to R $_{25}$
, can provide crucial insight into the mode of AGN feedback. However, it is to be noted that, currently, resolved molecular gas observations extending up to R
$_{25}$
, can provide crucial insight into the mode of AGN feedback. However, it is to be noted that, currently, resolved molecular gas observations extending up to R $_{25}$
are very limited for nearby galaxies.
$_{25}$
are very limited for nearby galaxies.
4.3 Possible contribution from AGN ionisation
Studies on nearby Seyfert galaxies suggest that the ionisation region from AGN can extend up to only ${\sim} 1-2$
kpc (e.g. Schmitt et al. Reference Schmitt, Donley, Antonucci, Hutchings and Kinney2003). It is to be noted that our study focuses on the regions more than 5 kpc away from the central AGN. As per our knowledge, only one of the galaxies in our sample, i.e. NGC 4051, hosts a kpc-scale AGN ionisation region (Meena et al. Reference Meena2021). This ionisation region is
${\sim} 1-2$
kpc (e.g. Schmitt et al. Reference Schmitt, Donley, Antonucci, Hutchings and Kinney2003). It is to be noted that our study focuses on the regions more than 5 kpc away from the central AGN. As per our knowledge, only one of the galaxies in our sample, i.e. NGC 4051, hosts a kpc-scale AGN ionisation region (Meena et al. Reference Meena2021). This ionisation region is ${\sim} 1$
kpc in size around the central AGN, much smaller than the region probed (5–10 kpc) in this work. Further, the extent of the ionisation region in AGN was also observed to be dependent on the AGN luminosity (e.g. Chen et al. Reference Chen2019; Husemann et al. Reference Husemann2022). We used the relation provided in equation 4 of Husemann et al. (Reference Husemann2022) to estimate the minimum AGN luminosity required for producing the ionisation region of size corresponding to the smallest distance scale (
${\sim} 1$
kpc in size around the central AGN, much smaller than the region probed (5–10 kpc) in this work. Further, the extent of the ionisation region in AGN was also observed to be dependent on the AGN luminosity (e.g. Chen et al. Reference Chen2019; Husemann et al. Reference Husemann2022). We used the relation provided in equation 4 of Husemann et al. (Reference Husemann2022) to estimate the minimum AGN luminosity required for producing the ionisation region of size corresponding to the smallest distance scale ( ${\sim}5$
kpc) probed in this study. The estimated luminosity was
${\sim}5$
kpc) probed in this study. The estimated luminosity was ${\sim} 10^{44}$
ergs s
${\sim} 10^{44}$
ergs s $^{-1}$
, which is one order higher than the maximum bolometric AGN luminosity (
$^{-1}$
, which is one order higher than the maximum bolometric AGN luminosity ( ${\sim} 6 \times 10^{42}$
ergs s
${\sim} 6 \times 10^{42}$
ergs s $^{-1}$
) of the galaxies in our sample. Therefore, we conclude that the contribution to UV emission due to AGN ionisation is expected to be negligible.
$^{-1}$
) of the galaxies in our sample. Therefore, we conclude that the contribution to UV emission due to AGN ionisation is expected to be negligible.
4.4 Summary
We carried out a detailed study of SF properties in the outer regions of ten (six AGN + four non-AGN) galaxies using AstroSat-UVIT and GALEX observations. High-resolution AstroSat-UVIT observations provided the best platform as of today for the comprehensive comparison of SF properties in nearby AGN and non-AGN galaxies extending up to $R_{25}$
with a spatial resolution of 50–100 pc. Though the number of galaxies is limited, considering the non availability of improved high-resolution UV images for the next many years, we conclude the following: The
$R_{25}$
with a spatial resolution of 50–100 pc. Though the number of galaxies is limited, considering the non availability of improved high-resolution UV images for the next many years, we conclude the following: The $\Sigma_{\text{SFR}}$
and A
$\Sigma_{\text{SFR}}$
and A $_{\text{FUV}}$
in the outer regions of the AGN-host galaxies are enhanced and falls off less rapidly compared to the non-AGN galaxies, suggesting a positive AGN feedback in the outer region of the AGN-host galaxies. We speculate that the radiation pressure on dust and/or wind-driven AGN feedback could be playing a role in enhanced
$_{\text{FUV}}$
in the outer regions of the AGN-host galaxies are enhanced and falls off less rapidly compared to the non-AGN galaxies, suggesting a positive AGN feedback in the outer region of the AGN-host galaxies. We speculate that the radiation pressure on dust and/or wind-driven AGN feedback could be playing a role in enhanced $\Sigma_{\text{SFR}}$
for AGN-host galaxies. Future deep multiband observations with the
$\Sigma_{\text{SFR}}$
for AGN-host galaxies. Future deep multiband observations with the ${\sim}1^{\prime\prime}$
resolution or better of a larger galaxy sample are required to identify the exact mode of this observed AGN feedback.
${\sim}1^{\prime\prime}$
resolution or better of a larger galaxy sample are required to identify the exact mode of this observed AGN feedback.
Acknowledgement
We thank the anonymous reviewer and the associate editor for their constructive comments and suggestions that improved the manuscript. BA acknowledges the financial support by the Department of Science and Technology, Government of India, under the DST-INSPIRE Fellowship (Application Reference Number: DST/INSPIRE/03/2018/000689; INSPIRE Code: IF190146) program. DB thanks the Indian Space Research Organisation, Department of Space, Government of India, for the financial support under the ISRO-RESPOND project (project no: RES-URSC-2023-031, sanction order number: No.DS-2B-13012(2)/10/2025-Sec.2). The research is based to a significant extent on the results obtained from the AstroSat mission of the Indian Space Research Organisation (ISRO), archived at the Indian Space Science Data Center (ISSDC). The Payload Operations Centre at IIA processed the UVIT data used here. The UVIT is built in collaboration between IIA, IUCAA, TIFR, ISRO and CSA. This research is based on observations made with the Galaxy Evolution Explorer, obtained from the MAST data archive at the Space Telescope Science Institute, which is operated by the Association of Universities for Research in Astronomy, Inc., under NASA contract NAS 5–26555. We acknowledge the usage of the HyperLeda database (http://leda.univ-lyon1.fr). This research has made use of the SIMBAD database, CDS, Strasbourg Astronomical Observatory, France; VizieR catalogue access tool, CDS, Strasbourg Astronomical Observatory, France (DOI: 10.26093/cds/vizier); NASA/IPAC Extragalactic Database (NED), which is funded by the National Aeronautics and Space Administration and operated by the California Institute of Technology. The work has made use of the following software packages: Source Extractor (Bertin & Arnouts Reference Bertin and Arnouts1996), CCDLAB (Postma & Leahy Reference Postma and Leahy2017; Postma & Leahy Reference Postma and Leahy2021), SAOImageDS9 (Joye & Mandel Reference Joye, Mandel, Payne, Jedrzejewski and Hook2003), Matplotlib (Hunter Reference Hunter2007), Astropy (Astropy Collaboration et al. Reference Collaboration2013; Astropy Collaboration et al. 2018), photutils (Bradley et al. Reference Bradley2023), IRAF (Tody Reference Tody, Hanisch, Brissenden and Barnes1993), STATMORPH (Rodriguez-Gomez et al. Reference Rodriguez-Gomez2019). Manipal Centre for Natural Sciences, Centre of Excellence, Manipal Academy of Higher Education (MAHE) is acknowledged for facilities and support.
Data availability statement
The UVIT Level-1 data used in this work are publicly available and can be obtained from https://astrobrowse.issdc.gov.in/astro_archive/archive/Home.jsp. The GALEX data described here may be obtained from the MAST archive at https://doi.org/10.17909/hhjg-px52. The other analysed data presented in this study can be made available upon reasonable request to the corresponding authors.


 Open access