


Food insecurity is defined by the United States Department of Agriculture as a household-level economic and social condition of limited or uncertain access to adequate food(1). Dimensions of food insecurity relate to the accessibility, availability, stability and utilisation of food(Reference Ashby, Kleve and McKechnie2). An estimated 13·5 % of US households are food insecure, with 8·4 % considered to have low food security and 5·1 % to have very low food security(3).
Estimates of food insecurity within the lesbian, gay, bisexual, transgender and queer (LGBTQ) population range widely based on the data source and demographic data collection practices for sex, gender identity and sexual orientation(Reference Linsenmeyer, Dalton and Hollinger4). An analysis of National Health Interview Survey data reported that 11·0 % of lesbian, gay and bisexual participants were food insecure(Reference Masa, Shangani and Baruah5), while the Behavioral Risk Factor Surveillance System (BRFSS) data revealed that 18 % of lesbian, gay, bisexual and transgender (LGBT) adults experienced food insecurity in the past year compared with 14 % of non-LGBTQ adults(Reference Sears, Flores and Harbeck6). Based on Gallup Daily Tracking data, as high as 26·7 % of the LGBTQ population was food insecure(Reference Wilson and Conron7).
Within the LGBTQ population, food insecurity disproportionately impacts the transgender and gender diverse (TGD) population in the USA(Reference Linsenmeyer, Dalton and Hollinger4,Reference Conron and O’Neill8–Reference Carpenter, Lee and Nettuno10) . TGD adults were almost 2·5 times more likely than cisgender adults to face food insufficiency (i.e. having an insufficient amount to eat over the past week) in 2021; TGD people of colour (POC) were nearly five times more likely than white cisgender adults to be impacted(Reference Conron and O’Neill8). Estimates of food insecurity prevalence range from 20 % of the general adult TGD population up to 79 % of the adult TGD population residing in the Southeastern USA(Reference Conron and O’Neill8–Reference Poteat, Reisner and Miller12). TGD youth and young adults may be particularly vulnerable to food insecurity(Reference Arikawa, Ross and Wright13). Among TGD university students in Minnesota, over 40 % screened positive for food insecurity(Reference Laska, Lenk and Lust14). Approximately half of TGD college students at a Midwestern university reported eating less, reducing meal size or skipping meals or not eating due to lack of money for food(Reference Kirby and Linde15). More than one in five TGD youth and young adults screened positive for food insecurity at a Midwestern gender clinic(Reference Linsenmeyer, Katz and Reed16).
Drivers of food insecurity include unemployment, poverty and homelessness. Based on the US Transgender Survey (USTS), the largest survey of TGD adults in the country, participants were three times more likely to be unemployed and over two times more likely to experience poverty than the general US population – with nearly one-third of TGD adults experiencing homelessness at some point in their lifetime(Reference James, Herman and Rankin17). Racially minoritised groups experienced even starker disparities. TGD POC were more than three times as likely to be living in poverty and four times more likely to be unemployed than the general US population(Reference James, Herman and Rankin17). TGD individuals racialised as Black were more likely to be on Medicaid and the Supplemental Nutrition Assistance Program (SNAP) and were more likely to report food insecurity than TGD white peers(Reference Carpenter, Lee and Nettuno10).
In addition to unemployment, poverty and homelessness, TGD individuals face identity-related barriers to accessing food assistance resources. Barriers include discrimination for being TGD at faith-based food pantries or government offices, competing finances when saving for gender-affirming healthcare expenses, lack of safety when travelling to access resources, competing health concerns and social isolation(Reference Conron and O’Neill8,Reference Gibb, Williams and Mikelsteins18–Reference Trout, Ayyagari and Grube22) . Notably, nearly one in five (17 %) TGD adults were denied equal treatment or service or were verbally harassed when attempting to access a public assistance or government benefits office(Reference James, Herman and Rankin17). As a result of these structural and interpersonal barriers, TGD populations may be under-enrolled or underutilising food assistance programmes such as SNAP or the Special Supplemental Nutrition Program for Women, Infants and Children (WIC), though robust baseline data have yet to be reported.
Objective and aims
The objective of this study was to evaluate eligibility and/or participation in nutrition assistance programmes (SNAP, WIC) among TGD adults in the USA and to capture their experiences when accessing the food benefits, observing the intersections of race and gender(Reference Crenshaw23,Reference Patterson, Russomanno and Teferra24) . The aims were to (1) compare the number of TGD adults who are utilising nutrition assistance programmes (SNAP, WIC) in the USA to those who qualify for the benefits, (2) describe the experience of TGD adults when visiting a public assistance office and (3) determine whether racial differences exist in nutrition assistance programme participation, eligibility and experiences.
Methods
Study design and participants
This cross-sectional survey study relied on the USTS dataset. Data were collected during a 34-day period in the summer of 2015 from 27 715 TGD adults across the country. The survey was administered electronically via web-enabled devices in English and Spanish. Topics addressed in the survey included experiences with education, housing, employment and health, among others. A detailed description of the data collection and description of the study sample has been previously published(Reference James, Herman and Rankin17).
Outcome variables
Outcome variables included participation in SNAP and WIC. This was based on the USTS survey question that directly asked, ‘Do you currently receive food stamps (SNAP) or WIC?’ Outcomes also included SNAP eligibility; this was estimated based on reported income level, the number of adults and children living in the household, gross income in 2014 and US citizenship status (aim 1)(25,26) . Because the household income variable is categorised into ranges, SNAP eligibility could not able to be determined for 1561 (5·6 %) participants. WIC eligibility could not able to be assessed as the dataset does not collect the age of children living in the home.
Exposure variables
Exposure variables included various negative experiences when visiting a public assistance office. These were based on the question, ‘In the past year, have you visited or used services in any of these places?’ with the option for ‘Public assistance/government benefits office (such as SNAP, WIC)’ and questions pertaining to whether the participant avoided the office because they thought they would be mistreated, were identified as TGD and whether they were denied equal treatment or service, verbally harassed or physically attacked (aims 2 and 3). Being identified as TGD was based on the question, ‘In the past year, when you visited or used services at these places, do you think the staff or employees knew or thought you were trans?’
Covariates
Covariates included demographic data collected through the USTS, including age, education level, relationship status, census region and race/ethnicity. Race/ethnicity was captured with a single question, ‘Although the choices listed below may not represent your full identity or use the language you prefer, for this survey, please select the choice that most accurately describes your racial/ethnic identity’. Though ‘Hispanic’ is often considered an ethnicity separate from that of one’s race, this was treated as a racial category given the nature of the original question.
Statistical analysis
Chi-square tests were used to test the bivariate association between relevant study characteristics using P < 0·05 significance. This test was chosen because of the categorical nature of the characteristics tested. The null hypothesis for each test was that no association existed between study characteristics.
Multivariate logistic regression models were utilised to determine the impact of age, education level, relationship status and census region on the likelihood of participating in SNAP while controlling for the other characteristics. Binary logistic regression models for this multivariate analysis were used because the outcome of SNAP participation was dichotomous. Model fit was assessed using tolerance and variance inflation factor (VIF). Any tolerance value lower than 0·1 or VIF greater than 10 would indicate poor model fit. None of the model values indicated a poor fit. These models were limited to participants eligible for SNAP and were performed separately for the racial groups with sufficient numbers of participants (white, Black, Asian, Hispanic, Multiracial). Because of the small number of Asian participants, empty cells resulted when relationship status and census region were included as covariates; these two variables were removed from the logistic regression model for Asian participants.
All analyses were performed using SAS v 9.4 and accounted for the weighted nature of the data source. Relevant sample characteristics were summarised as weighted percentages and unweighted counts. This approach utilises the sample weights to accurately present percentages as intended by the original data collectors while also allowing readers to see the number of observations contained in a particular cell.
Results
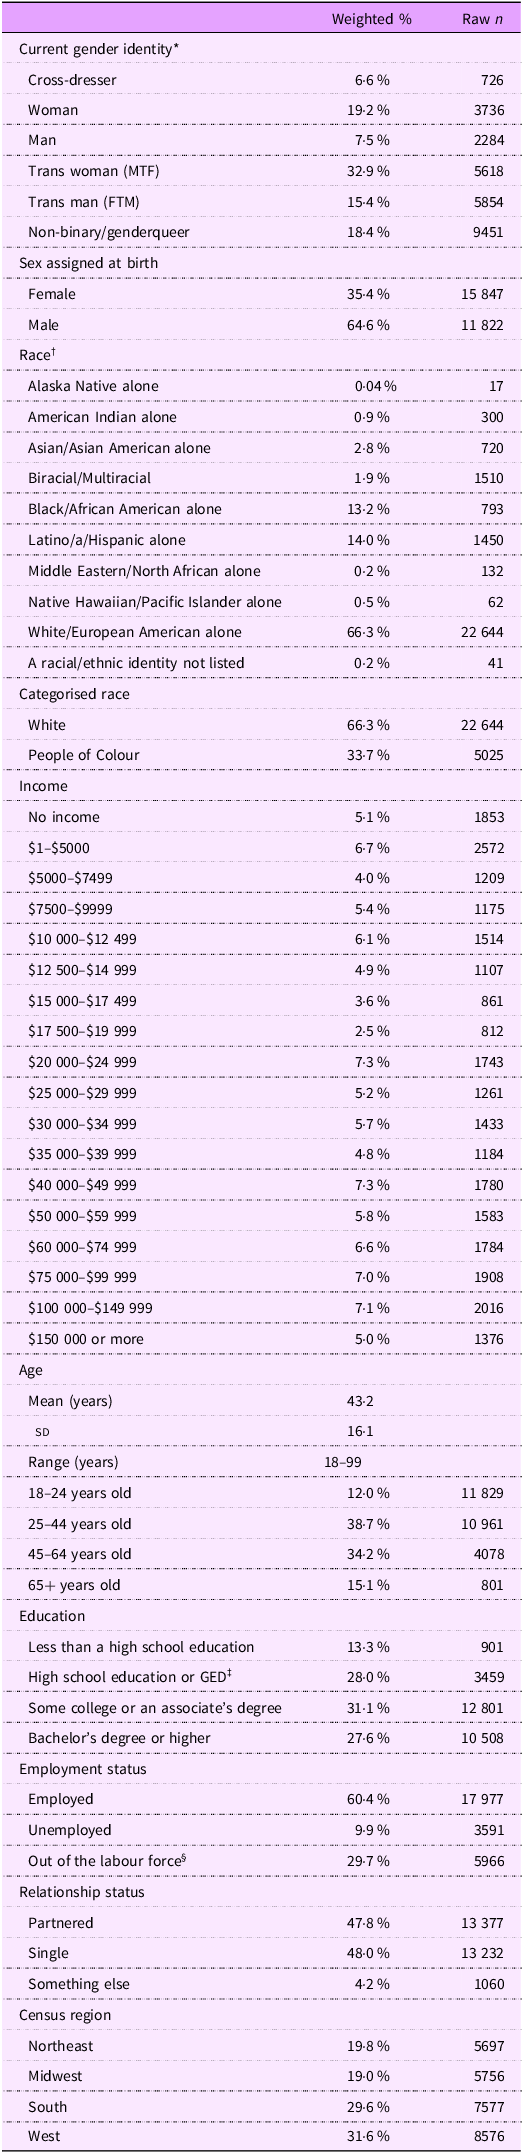
The demographic data of the study sample are reported in Table 1. The weighted sample was predominantly assigned male at birth (64·6 %), and overall, participants identified as a transgender woman (32·9 %), woman (19·2 %), transgender man (15·4 %), man (7·5 %) or as non-binary/queer (18·4 %). The largest proportion was white (66·3 %), and over half (50·8 %) reported annual household income under $30 000. Larger proportions were 25–44 years old (38·7 %) or 45–64 years old (34·2 %), had some college or an associate’s degree (31·1 %) or high school or a General Education Development (GED) (28·0 %) and were employed (60·4 %). Most were either single (48·0 %) or partnered (47·8 %) and lived throughout the Western (31·6 %) and Southern (29·6 %) US census regions.
Table 1. Demographic data of the US Transgender Survey sample

*These terms reflect the gender identity categories used for analysis in the US Transgender Survey. Current recommendations for querying sex, gender and gender identity in research, clinical and administrative settings are provided by the National Academies of Sciences, Engineering and Medicine;(Reference Crenshaw23) †These groups reflect the racial categories in the US Transgender Survey. Participants were asked to select the choice that most accurately described their racial/ethnic identity; ‡GED, General Educational Development; §The US Transgender Survey classifies this as being unemployed but not looking for work. FTM, female-to-male; MTF, male to female.
To further explore differences in eligibility, participation and experiences when visiting the public assistance office, racial categories were collapsed into white v. POC (‘Alaska Native alone’, ‘American Indian alone’, ‘Asian/Asian American alone’, ‘Biracial/Multiracial’, ‘Black/African American alone’, ‘Latino/a/Hispanic alone’, ‘Middle Eastern/North African alone’, ‘Native Hawaiian/Pacific Islander alone’, ‘A racial/ethnic identity not listed’). This was done given that the sample was predominantly white (62·2 %) and the very small proportion of various racially minoritised groups for which analysis would be limited; limitations to this approach are addressed in the discussion section. Additionally, because of the small number of Asian participants, empty cells resulted when relationship status and census region were included as covariates; thus, these two variables were removed from the logistic regression model for Asian participants.
Supplemental Nutrition Assistance Program/Women, Infants and Children eligibility and participation
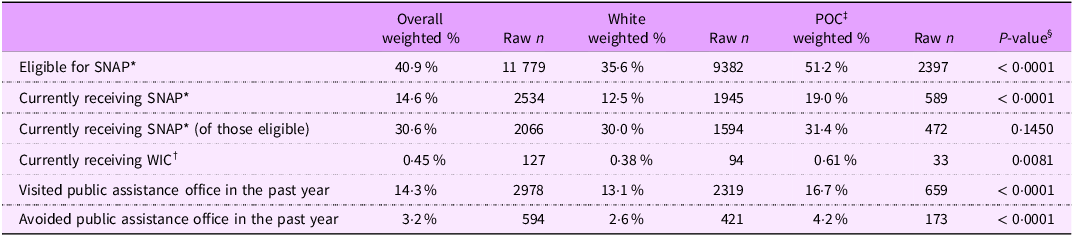
More than two out of five individuals (40·9 %) of the overall sample were eligible for SNAP, but fewer than one in three (30·6 %) of those eligible were currently receiving SNAP benefits. A small proportion (0·45 %) was currently receiving WIC benefits (Table 2).
Table 2. SNAP/WIC*,† eligibility and usage among transgender and gender diverse adults in the USA

*SNAP, Supplemental Nutrition Assistance Program; †WIC, Special Supplemental Nutrition Program for Women, Infants and Children; ‡POC, People of Colour; §Reflects analysis between white and POC samples using P < 0·05 significance.
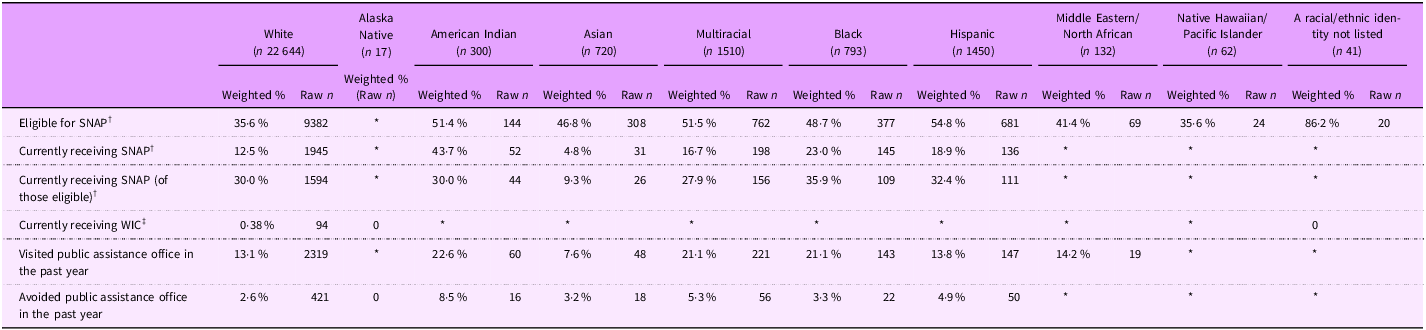
Among the racial groups captured in the dataset, SNAP eligibility ranged from 35·6 % to 86·2 % (Table 3). The proportions of those receiving SNAP ranged from 4·8 % to 43·7 %, while the proportions of SNAP recipients among those eligible ranged from 9·3 % to 35·9 %. The greatest gap was among participants racialised as Asian, where 46·8 % were eligible for SNAP, yet only 9·3 % of those eligible were receiving the benefit (Table 3). POC were more likely than white participants to be eligible for SNAP (51·2 % v. 35·6 %, P = < 0·0001) and report currently receiving the benefit (19·0 % v. 12·5 %, P = < 0·0001). Among those who were SNAP eligible, POC were not more likely than white participants to report receiving the benefit (31·4 % v. 30·0 %, P = 0·1450). POC were more likely than white participants to report receiving WIC benefits (0·61 % v. 0·38 %, P = 0·0081) (Table 2).
Table 3. SNAP/WIC†,‡ eligibility and usage among transgender and gender diverse adults in the USA

*Data suppressed due to counts less than 16; †SNAP, Supplemental Nutrition Assistance Program; ‡WIC, Special Supplemental Nutrition Program for Women, Infants and Children.
Among the total sample, 14·3 % visited the public assistance office in the past year, while 3·2 % reported avoiding the office because they feared being mistreated (Table 2). Among racial groups, the proportions of those who visited the public assistance office in the past year ranged from 7·6 % to 22·6 %, while the proportions of those who avoided the public assistance office ranged from 0 % to 8·5 % (Table 3). POC were more likely to visit the public assistance office (16·7 % v. 13·1 %, P = < 0·001). However, POC were also more likely to report avoiding the public assistance office (4·2 % v. 2·6 %, P = < 0·001) (Table 2).
Contribution of demographic variables to the likelihood of participating in the Supplemental Nutrition Assistance Program
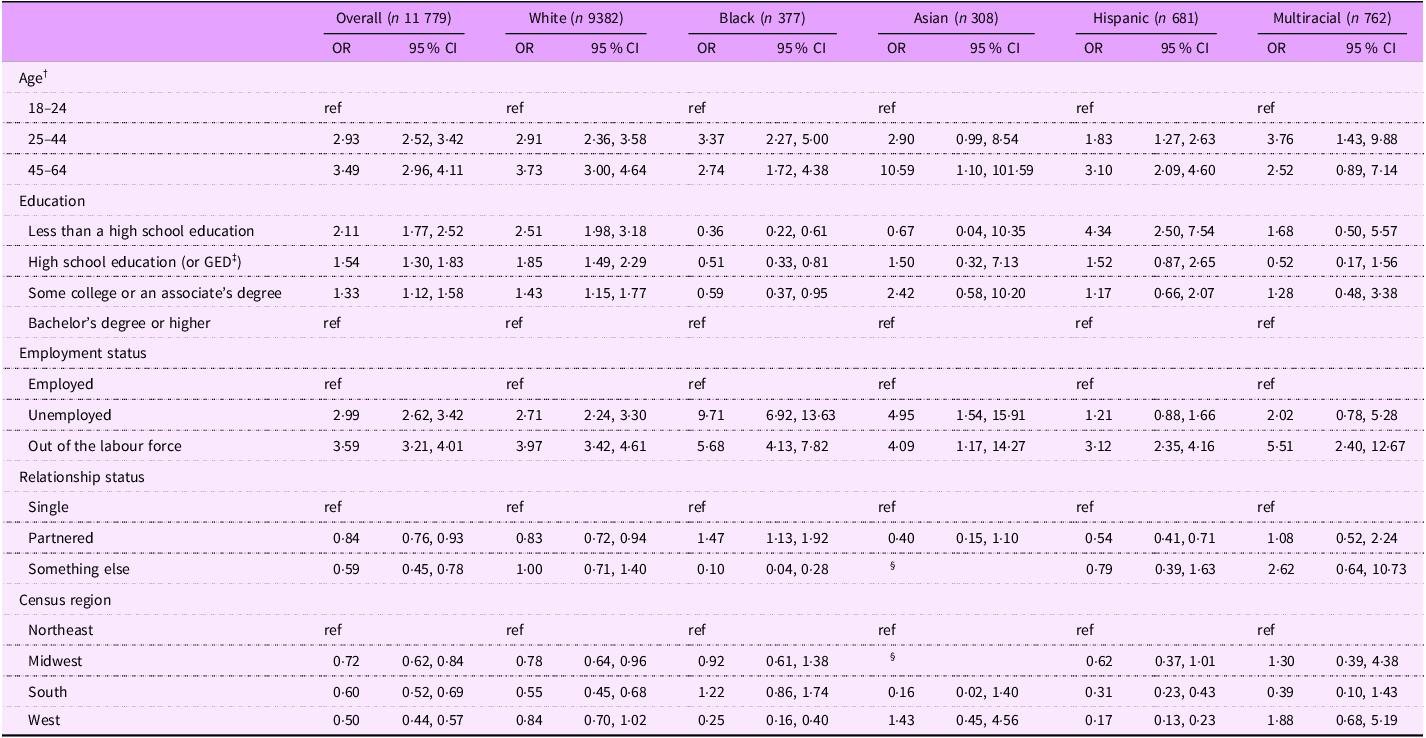
The stratified analysis conducted to examine different racial groups revealed additional insights (Table 4). After adjusting for demographic factors in the overall sample, those in middle to older adulthood (ages 45–64) were 3·49 times more likely to participate in SNAP than young adults (ages 18–24) (95 % CI: 2·96, 4·11), while those in young to middle adulthood (ages 25–44) were 2·93 times more likely to participate in SNAP than young adults (95 % CI: 2·52, 3·42). Results varied among racial groups; for example, among participants racialised as Black, those in young to middle adulthood were 3·37 times more likely to participate in SNAP than young adults (95 % CI: 2·27, 5·00).
Table 4. Impact of age, education, employment, relationship status and census region on receiving SNAP* within racial groups

*SNAP, Supplemental Nutrition Assistance Program; †A small number of participants were 65 years old or more and therefore were omitted from the multivariate model; ‡General Educational Development; §Zero participants reported a relationship as ‘something else’ or a census region as the Midwest and therefore were not included in the multivariate model for these covariates.
The impact of education level was highly variable in the adjusted models. Within the overall sample, those with less than a high school education were 2·11 times more likely to participate in SNAP than those with a bachelor’s degree or higher (95 % CI: 1·77, 2·52). Those with a high school education or a GED were 1·54 times more likely to participate in SNAP than those with a bachelor’s degree or higher (95 % CI: 1·30, 1·83). Among white participants, those with less than high school education were 2·51 times more likely to participate SNAP compared with those with a bachelor’s degree or higher (95 % CI: 1·98, 3·18), yet the reverse was true for participants racialised as Black who had 0·36 odds of participating in SNAP with less than a high school education (95 % CI: 0·22, 0·61).
Regarding employment status, after adjustment in the overall sample, unemployed participants were 2·99 times more likely to participate in SNAP compared with those who were employed (95 % CI: 2·62, 3·42), while those out of the labour force were 3·59 times more likely to participate in SNAP compared with those who were employed (95 % CI: 3·21, 4·01). Results varied among racial groups; for example, among those racialised as Black, unemployed participants were 9·71 times more likely to participate in SNAP (95 % CI: 6·92, 13·63), while those out of the labour force were 5·68 times more likely to participate in SNAP than those who were employed (95 % CI: 4·13, 7·82).
The impact of relationship status was also highly variable. After adjustment in the overall sample, those captured as ‘something else’ (aromantic/not active/platonic, open relationship or poly) had 0·59 odds of participating in SNAP compared with those who were partnered (95 % CI: 0·45, 0·78). Among participants racialised as Black, those who were partnered were 1·47 times more likely to participate in SNAP compared with those who were single (95 % CI: 1·13, 1·92), while those captured as ‘something else’ had 0·10 odds of participating in SNAP (95 % CI: 0·04, 0·28).
Lastly, within the four census regions in the overall adjusted sample, those in the West had 0·50 odds of participating in SNAP compared with those in the Northeast (95 % CI: 0·44, 0·57). Those residing in the South had 0·45 odds of participating in SNAP compared with those in the North (95 % CI: 0·52, 0·69), while those in the Midwest had 0·72 odds of participating in SNAP compared with those in the Northeast (95 % CI: 0·62, 0·84). Similarly, among participants racialised as white, those residing in the South were 0·55 times more likely to be participating in SNAP than those in the Northeast (95 % CI: 0·45, 0·68), while those residing in the Midwest had 0·78 odds of participating in SNAP compared with those in the Northeast (95 % CI: 0·64, 0·96).
Experiences of transgender and gender diverse adults visiting a public assistance office
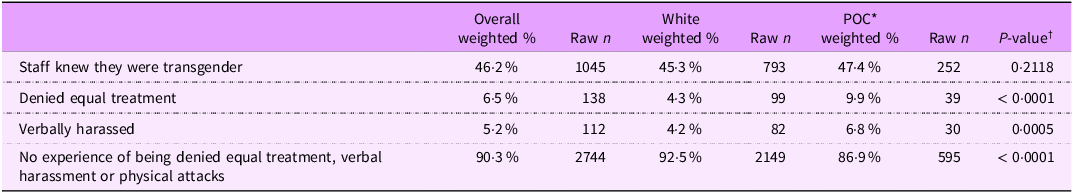
Among those who visited the public assistance office in the past year, nearly half (46·2 %) reported that the staff knew they were transgender, 6·5 % were denied equal treatment, 5·2 % were verbally harassed and 0 % were physically attacked. The majority (90·3 %) reported they did not experience the aforementioned issues (Table 5).
Table 5. Experiences at the public assistance office among transgender and gender diverse adults in the USA who visited in the past year

*POC, People of Colour; †Reflects analysis between white and POC samples using P < 0·05 significance.
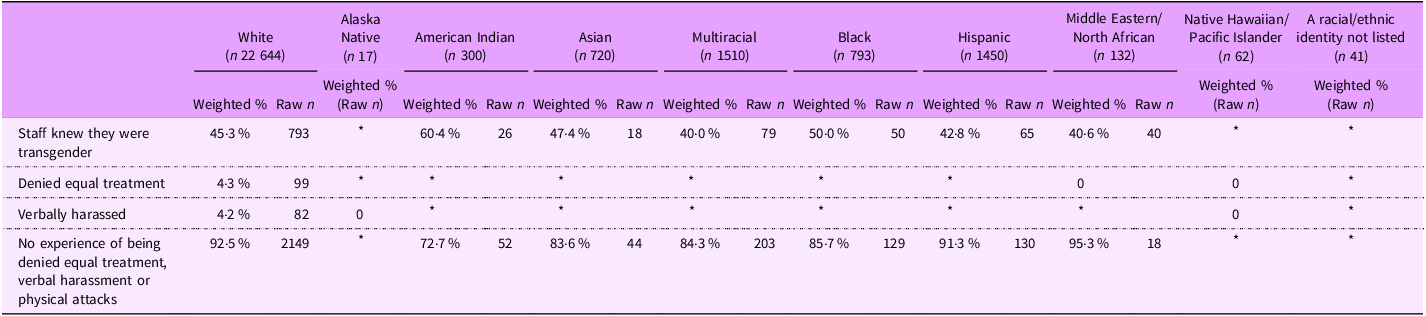
Among the racial groups explored, the proportions of those who reported the staff knew they were transgender ranged from 40·0 % to 60·4 %. The experience of being denied equal treatment ranged from 0 % to 4·3 %, while the experience of being verbally harassed ranged from 0 % to 4·2 %. The proportions of those who did not experience the aforementioned issues ranged from 72·7 % to 95·3 % (Table 6). In the overall study sample, POC were more than twice as likely to report being denied equal treatment (9·9 % v. 4·3 %, P = < 0·001) and being harassed (6·8 % v. 4·2 %, P = 0·0005); white participants were more likely to report not experiencing any of those issues (92·5 % v. 86·9 %, P = < 0·0001) (Table 5).
Table 6. Experiences at the public assistance office among transgender and gender diverse adults in the USA who visited in the past year

* Data suppressed due to counts less than 16.
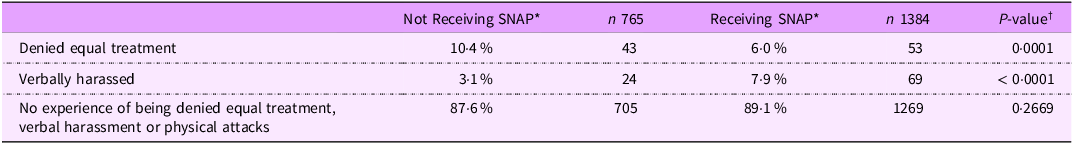
Among those eligible for SNAP and who had visited a public assistance office in the past year, those not receiving the benefit were more likely to be denied equal treatment than those receiving SNAP (10·4 % v. 6·0 %, P = 0·001). Conversely, those receiving SNAP benefits were more than twice as likely to be verbally harassed as those who were eligible and yet not receiving the benefit (7·9 % v. 3·1 %, P = < 0·0001) (Table 7).
Table 7. Experiences at the public assistance office among transgender and gender diverse adults in the USA who were SNAP* eligible and visited a public assistance office

*SNAP, Supplemental Nutrition Assistance Program; †Reflects analysis between those receiving and not receiving SNAP using P < 0·05 significance.
Discussion
Eligibility and participation compared with the lesbian, gay, bisexual, transgender and queer and general US population
A greater proportion of TGD adults were eligible for SNAP (40·9 %) compared with estimates of the general US population (17·2 %)(27,28) . Among those eligible, the proportion of those receiving SNAP benefits in this study (30·6 %) was dramatically lower than the general US population (83·0 %) in 2015 when the USTS data were collected(28). This finding aligned with the report from the Williams Institute that TGD adults were almost 2·5 times more likely than cisgender adults to face food insufficiency during 2021 and that TGD POC were even more likely(Reference Conron and O’Neill8). Smaller proportions of TGD adults than cisgender adults used food assistance programmes, including SNAP (14·6 % v. 12·0 %) and charitable sources such as groceries from food banks (8·1 % v. 5·9 %)(Reference Conron and O’Neill8).
This suggests a twofold problem: Far more TGD adults need food assistance, yet fewer are receiving the benefit compared with the general population. This problem was compounded for TGD POC, who were more likely to qualify for SNAP, yet also more likely to avoid going to the public assistance office. This may be explained by the finding that POC were more likely to have negative experiences when visiting the public assistance office, such as being denied equal treatment or verbally harassed. Among the racial groups explored, wide variability was reported in the eligibility and participation in nutrition assistance programmes, as well as their experiences at a public assistance office.
Existing research has elucidated food insecurity disparities at the intersections of race, ethnicity, sexual orientation and gender identity(Reference Linsenmeyer, Dalton and Hollinger4–Reference Kirby and Linde15,Reference Singh, Lee and Azuine29–Reference Testa and Jackson32) . A pooled analysis of 2021 and 2023 BRFSS data revealed that white LGBT adults experienced lower levels of food insecurity (15 %) compared with minoritised racial and ethnic groups within the LGBT population, including Black (27 %), AIAN (25 %), Latinx (24 %) and ‘other’ racial or ethnic identities(Reference Sears, Flores and Harbeck6). An analysis of National Health and Nutrition Examination Survey (NHANES) data from 2003 to 2016 revealed that bisexual, lesbian and gay participants experienced higher levels of severe food insecurity than heterosexual participants(Reference Gibb, Shokoohi and Salway30). An analysis of National Survey of Family Growth data from 2011 to 2019 revealed that gay and bisexual men had higher odds of experiencing food insecurity than heterosexual men, though the odds of participating in SNAP did not differ significantly based on sexual orientation(Reference Han and Hernandez31). Bisexual women were likely to experience food insecurity than heterosexual women, and lesbian women had lower odds of participating in SNAP, while bisexual women had higher odds of participating in SNAP when compared to heterosexual women(Reference Han and Hernandez31). In an analysis of the National Health Interview Survey and NHANES, women racialised as Black with a minoritised sexual orientation experienced food insecurity at greater rates than heterosexual white women(Reference Patterson, Russomanno and Teferra24). During the COVID-19 pandemic, transgender adults experienced the highest levels of food insecurity (25·6 %) compared with lesbian or gay adults (11·6 %), bisexual adults (13·5 %) and heterosexual adults (7·8 %)(Reference Singh, Lee and Azuine29).
Thus, the intersectionality of gender, sexual orientation and race suggests the compounding effect of structural and interpersonal racism, cisgenderism and heteronormativity(Reference Crenshaw23). Additional layers of oppression stem from class, having a disability, immigrant status and body size, among others. These intersecting identities can produce a cumulative disadvantage and compound the risk for food insecurity and heighten the challenges to accessing food assistance resources. For example, in the pooled analysis of 2021 and 2023 BRFSS data, 69 % of LGBT adults who received SNAP had household incomes of up $35 000, and 66 % were living with a disability(Reference Sears, Flores and Harbeck6).
An intersectional framework also recognises that the interplay of multiple minoritised identities shapes a unique experience in society(Reference Patterson, Russomanno and Teferra24). In this study, the impact of the covariates captured was inversely related among racial groups (e.g. participants racialised as Black with lower levels of education were less likely to participate in SNAP, while the reverse was true for participants racialised as white). The variation in experiences of participants among racial groups underpins the impact of intersectional discrimination for minoritised groups and, in turn, the need for nuanced and culturally informed interventions.
Low participation rates may be partially explained by past experiences of being denied treatment or harassed due to racism and cisgenderism. Among those SNAP eligible, those not receiving the benefit were more likely to be denied equal treatment than those receiving the benefit, suggesting mistreatment as a potential contributor to differences in SNAP participation. At the same time, those SNAP eligible and receiving the benefit were more likely to be verbally harassed than those not receiving the benefit, suggesting problematic practices at public assistance offices that oversee SNAP benefits. Anticipated discrimination may dissuade eligible individuals from enrolling and participating. While the USTS does not inquire about this, there are legal barriers to acquiring legal documentation that aligns with one’s gender expression, which may further contribute to low participation(Reference Restar, Jin and Breslow33). In addition, internalised transphobia fosters a sense of ‘unworthiness’, leading some individuals to believe they do not ‘deserve’ access to necessary services commonly thought to be ‘needed more by others’(Reference Russomanno, Patterson and Jabson19). Stigma has been cited as a common barrier to participating in food assistance programmes, irrespective of gender(34). Those facing stigma, such as transphobia, may avoid additional layers of oppression or shame by abstaining from social safety net programmes like SNAP and WIC(Reference Russomanno, Patterson and Jabson19,34) .
Implications and recommendations
The sociopolitical landscape has rapidly shifted since the USTS data collection period in 2015. The One Big Beautiful Bill Act was signed into law on 4 July 2025, which is anticipated to reduce or eliminate SNAP benefits for 4 million people monthly by reducing the federal government’s contributions to states, expanding work requirements, reducing benefit sizes and further restricting immigration status requirements(35,Reference Bergh and Rosenbaum36) . Families with children, older adults, people with disabilities and veterans are anticipated to be impacted the most(Reference Bergh and Rosenbaum36).
Additionally, anti-transgender rhetoric, policies and legislation have rapidly propagated across the USA in recent years(Reference Barbee, Deal and Gonzales37). President Trump signed a Presidential Action on 20 January 2025, attempting to obscure scientific definitions of sex and gender, reinforce a binary notion of sex and dissolve existing executive orders that sought to protect the rights of TGD individuals(38). A recent report by the Williams Institute revealed that, in anticipation of Trump’s presidency, 93 % of TGD adults were worried about their access to gender-affirming care, 80 % planned to downplay their TGD identity and 33 % were socially isolating and avoiding public places and activities(Reference Goldberg and Sears39).
Thus, attention to the root causes of food insecurity, including poverty, homelessness and joblessness that disproportionately impact the TGD population(Reference James, Herman and Rankin17), will need to be contextualised within the current sociopolitical landscape. This will require broad policies and programming across multiple levels of society, including housing, education, employment and healthcare sectors, yet may result in the greatest magnitude of progress towards improving food security(34). Given the federal government’s overt antagonism towards TGD communities(Reference Barbee, Deal and Gonzales37,38) , state- and community-led efforts are increasingly critical. For example, certain states are becoming ‘refuge’ or ‘sanctuary’ states by passing laws that protect TGD individuals and prevent interference from out-of-state laws related to healthcare, such as Minnesota, California and Illinois(40,41) . TGD-led, community-based organisations are also developing their own food assistance resources in the form of food pantries, grocery delivery and support with SNAP applications. For example, the Metro Trans Umbrella Group offers a food pantry and grocery delivery service to TGD residents in the St. Louis, Missouri region(42), while GLO provides a food pantry alongside housing and legal resources for residents in rural Missouri(43).
Culturally informed interventions to increase enrolment in SNAP among TGD adults are also needed. An intersectional approach that considers the impact of racism, ethnocentrism and cisgenderism is warranted(Reference Crenshaw23). Though little is known about the factors that can effectively increase food assistance in TGD communities, personal pride in one’s TGD identity and community resilience have been associated with food pantry usage among TGD adults in the Southeastern USA. Thus, interventions can leverage these factors to improve participation(Reference Russomanno and Jabson Tree11). Potential solutions include educating staff at public assistance offices to reduce or eliminate experiences of race- and gender-based discrimination; enforcing policies that prohibit discrimination on the basis of race, ethnicity and gender identity; and effectively marketing the programmes in partnership with community-based organisations. Gender centres (healthcare settings that primarily provide gender-affirming medicine) should screen for food insecurity and refer patients to case managers or social workers for support in enrolling in SNAP or WIC, as well as referral to local food pantries that have been vetted as safe and affirming(Reference Linsenmeyer, Katz and Reed16).
Strengths, limitations and future research directions
To our knowledge, this is among the first studies to estimate SNAP and WIC eligibility and participation among TGD adults in the USA. However, this study was limited by estimations of SNAP eligibility based on household income, size and US citizenship status; exact eligibility requirements vary slightly by state. Household income was reported as a category in the dataset instead of a numerical value, which is how it would be treated when determining an individual’s eligibility. As a result, SNAP eligibility could not be assessed for 1561 participants. The precise effect on the study findings, or whether the eligibility figure was an over- or underestimation, cannot be determined. However, given that the poverty rates of the USTS sample (29 %) are over twice that of the general US population (12 %)(Reference James, Herman and Rankin17), it is more likely that this was an underestimation. Next, given that the USTS dataset doesn’t include data needed to determine WIC eligibility (i.e. age of children), we were not able to make this estimate and were limited to reporting participation; future research may explore WIC participation and eligibility among TGD adults, especially given the gendered terminology in the programme name and criteria (‘Women, Infants and Children’).
Another limitation was the collapse of all POC into one group in certain analyses. This was done given the very small proportions of certain racially minoritised groups represented in the sample (e.g. 0·2 % identified as Middle Eastern/North African). Racially minoritised groups may have very different experiences when accessing food assistance resources; collapsing these groups obscures any disparities and overly simplifies the comparison to a racial majority(Reference Chaiyachati, Peña and Montoya-Williams44). Future research may analyse the dataset with narrower race definitions to more accurately capture the experiences of Alaska Native, American Indian, Asian, Black/African American, Latino/a/Hispanic, Middle Eastern/North African, Native Hawaiian/Pacific Islander and Biracial/Multiracial populations. Culturally informed policy and practices can then more accurately capture the distinct experiences, needs and challenges of a community. Future research can also explore relationships between other variables captured in the USTS dataset including age, gender identity and expression, disability status, citizenship and immigration status and religious or spiritual identity, among others.
Future research can track SNAP and WIC eligibility and participation among TGD populations over time, especially using future USTS datasets. Given that the dataset only captured a handful of reasons why people may not be using SNAP or WIC, future research may address the breadth of possible barriers using qualitative methods. Lastly, future studies may explore the efficacy of policy changes and interventions aimed to ameliorate the disproportionate impact of food insecurity among TGD populations.
Conclusion
Far more TGD adults need food assistance, yet fewer are receiving the benefit compared with the general population – a problem compounded for TGD POC. TGD adults had negative experiences when visiting a public assistance office, such as being verbally harassed, and in turn avoided visiting altogether. Interventions are needed to improve food security, increase SNAP enrolment and address the negative experiences faced by TGD adults when accessing food assistance benefits.
Financial support
This work was supported by the National Institutes of Health Clinical and Translational Science Award Program, Grant #UL1 TR002345 (Linsenmeyer), and discretionary intramural funds of the senior author (Athena Sherman).
Conflict of interest
There are no conflicts of interest.
Authorship
W.L. and T.C. conceptualised the design and methods. W.L. and T.C. acquired the resources to complete the study. T.C. completed the data analysis. W.L. and T.C. wrote the original draft. W.L., T.C., R.H. and H.S. reviewed and commented on subsequent drafts of the manuscript.
Ethics of human subject participation
This study was conducted according to the guidelines laid down in the Declaration of Helsinki, and all procedures involving research study participants were approved by the Saint Louis University Institutional Review Board, which deemed this study did not constitute human subjects research as it involved secondary data analysis of a dataset with limited identifiers only.

 Open access