Cuzán and Heggen’s (Reference Cuzán and Heggen2023a) “cruise and crash” model of the cost of ruling is missing an important feature of long-term incumbencies: the bump in the vote that generally occurs in the incumbent party’s first reelection. (For the sake of variety, I use “ruling party,” “party in government,” and simply “government” interchangeably throughout.) With a larger and more diverse set of countries, this article demonstrates that in a successful bid for a second term, depending on the level and type of government, the ruling party’s vote rises between 4% and 8% relative to what it obtained in the inaugural election—the one that initially elevated it to control of the administrative arm of the government. The “bonus” survives with little erosion through subsequent reelections—that is, the “cruise” phase of their model. At the ousting election, the party’s vote crashes, “sometimes spectacularly,”Footnote 1 shrinking around 20% relative to its inaugural vote. This loss is independent of the length of the party’s spell in office as well as institutional and other characteristics that vary across the countries included. The completed model suggests that a general pattern shaped like an inverted asymmetrical letter U or W describes the path of long-term incumbencies.
…in a successful bid for a second term…the ruling party’s vote increases between 4% and 8% relative to what it obtained in the inaugural election….At the ousting election, the party vote crashes, shrinking around 20% relative to its inaugural vote.
The completed model suggests that a general pattern shaped like an inverted asymmetrical letter U or W describes the path of long-term incumbencies.
TERMINOLOGY AND METHOD
I use Cuzán and Heggen’s (Reference Cuzán and Heggen2023b) election data posted on the Harvard Dataverse and follow their level of analysis, method, and nomenclature. In addition to the five federal countries they studied (i.e., Australia, Canada, Germany, India, and the United States), I selected 33 parliamentary countries with a long history of uninterrupted national elections that included at least one spell of three terms—that is, those countries that include an original election followed by two consecutive reelections. Developed democracies contribute most of the data but parliamentary elections from mini-Caribbean states, post-communist European countries, and one from Africa (i.e., Botswana) also are included. Among the developed democracies, in most countries the first spell dates from immediately after World War II; however, in a few cases (i.e., Australia, Canada, New Zealand, Sweden, and the United States), it dates from an earlier era. The series of most Caribbean states commences in the 1960s and those of the post-communist countries in the 1990s. The appendix includes a complete list of countries and the first year of their respective spells (Cuzán Reference Cuzán2025).
Elections are organized into closed spells—that is, those that end in the defeat of the incumbents. The variable of interest is the vote of the party of the head of government, however titled, obtained in elections at the national or state level. In parliamentary or “cabinet” democracies, it is customary for the leader of the party that wins a majority or plurality of the vote (or the number of seats; the two variables are highly correlated) to have the first shot at attempting to form a government: either a one-party government with or without the support of other parties in parliament or, more typically, a coalition government of two or more parties. However, it is not the vote of the coalition but rather of the party of the prime minister or chancellor that is entered.Footnote 2 In the United States, an independently elected “executive” type of government, the corresponding measure is the vote for the candidate of the party whose member occupies the office of president or governor at the time of the election.
A spell consists of a series of consecutive terms by the party in government. Generally, a term consists of a period between elections. In the United States, this is fixed at four years for both the presidency and the governorship in all but two states (New Hampshire and Vermont), and most states impose some form of term limits. Term limits are rare in parliamentary democracies; none of the countries chosen for this study imposes them. Moreover, elections are on a more flexible schedule. There is a legal or constitutional limit to the term of office, but elections may take place at any time in response to several contingencies, including the breakup of a coalition, a loss in an important parliamentary vote, and the government’s call for a snap election when its leadership believes (sometimes in error, as in the case of the UK Prime Minister Theresa May in 2017) that the outcome would be more favorable to the party than waiting until the end of the mandate.
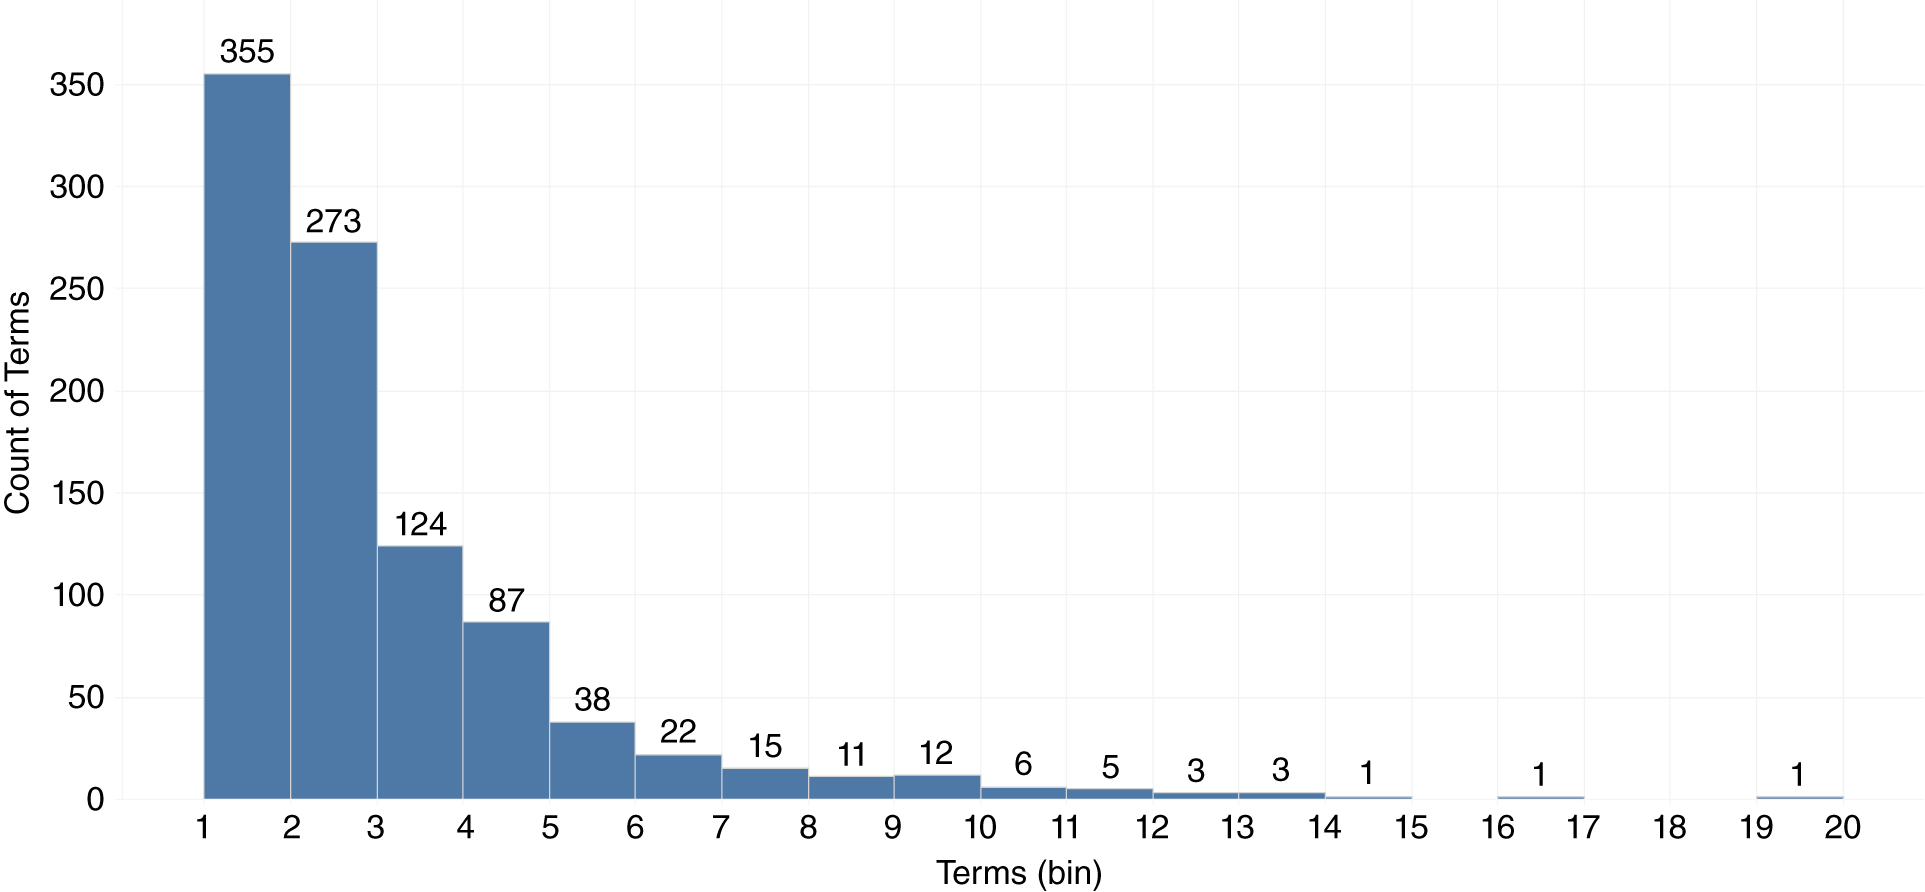
Spells range in length from a single term to 12 or more. A spell begins at an inaugural election, E0, that brings a previous opposition party to office. This party becomes the incumbent, the government or the administration. It will seek to stay in office by winning reelections. Every such attempt—from E1 at the conclusion of the party’s first term through E n, their last term—results in an outcome, scored as 1 if successful and 0 otherwise. A large stochastic component is involved in every outcome.Footnote 3 At En, two votes are recorded: that of the ousted party and that of the victorious opposition. The latter’s vote is reentered as the incumbent vote at E0 in the following spell. Through this duplication, the number of votes appears but is not greater than the number of outcomes. Because every new spell begins at E0 and ends at En, at which point the number of terms is added, the counts of these three variables are the same and equal to the number of spells. As it happens, the most frequent outcome is defeat at E1; that is, the mode is a one-term spell. In those cases, E1=En (figure 1).

Figure 1 Frequency Distribution of Terms, Types and Levels Combined
DESCRIPTIVES
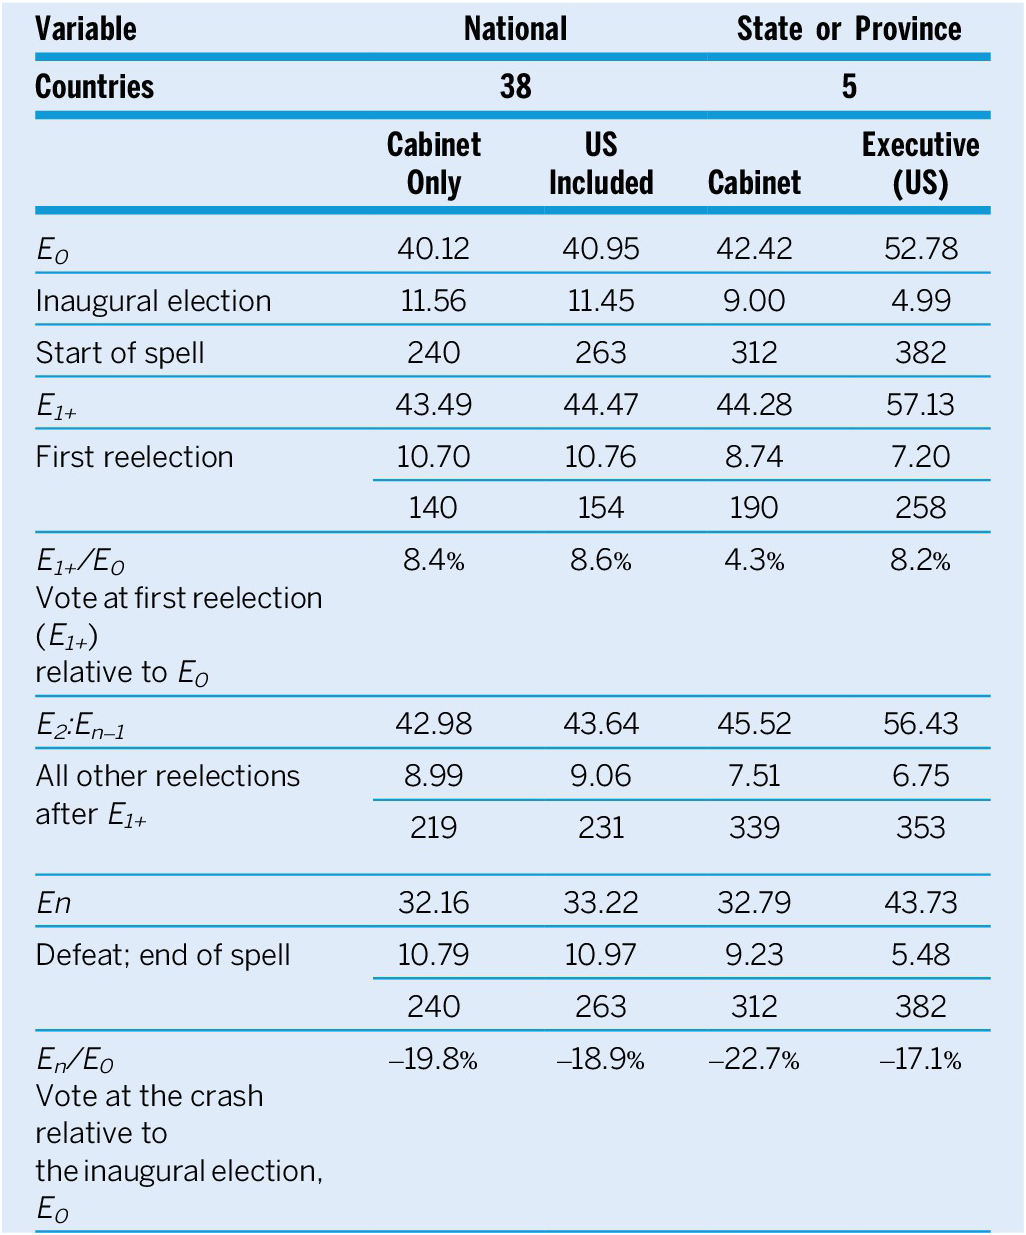
The data consist of 2,482 elections distributed across 957 spells—of which 648 are at the national level: 599 are in cabinet countries, 49 in the United States, and 1,834 at the state or provincial level in five federal countries. Of the latter, Australia, Canada, Germany, and India—all parliamentary or cabinet countries—contribute 841 observations; and the United States, 993. Because the US elections comprise more than 50% of the total at this level, I treat it separately—especially considering that at this level, the difference in the mean vote between the United States and the others is substantial (i.e., approximately 10 percentage points). Not so at the national level, where the US effect on the average is trivial, which is readily discerned by comparing the values in columns 2 and 3 of table 1. Similarly, as shown in columns 3 and 4, the size of the bump—that is, of the difference between the mean vote at E0 and at reelection at E1+ at the subnational level—is more than twice in the United States than in its parliamentary counterparts (i.e., 4.35 versus 1.84 percentage points). However, the difference at the national level is minimal (i.e., 3.37 versus 4.0 percentage points). Thus, it is the size of the subnational parliamentary bump that is “out of step,” so to speak, with the rest. Finally, the relative reduction of the vote at the crash, from E0 to En, ranges from -17% to -23%, approximately -20% overall—about the same as the estimate in Cuzán and Heggen (Reference Cuzán and Heggen2023a).
Table 1 Descriptive Statistics by Level and Type of Government

Note: Stacked: Mean, S.D., N.
THE PATH OF INCUMBENCY
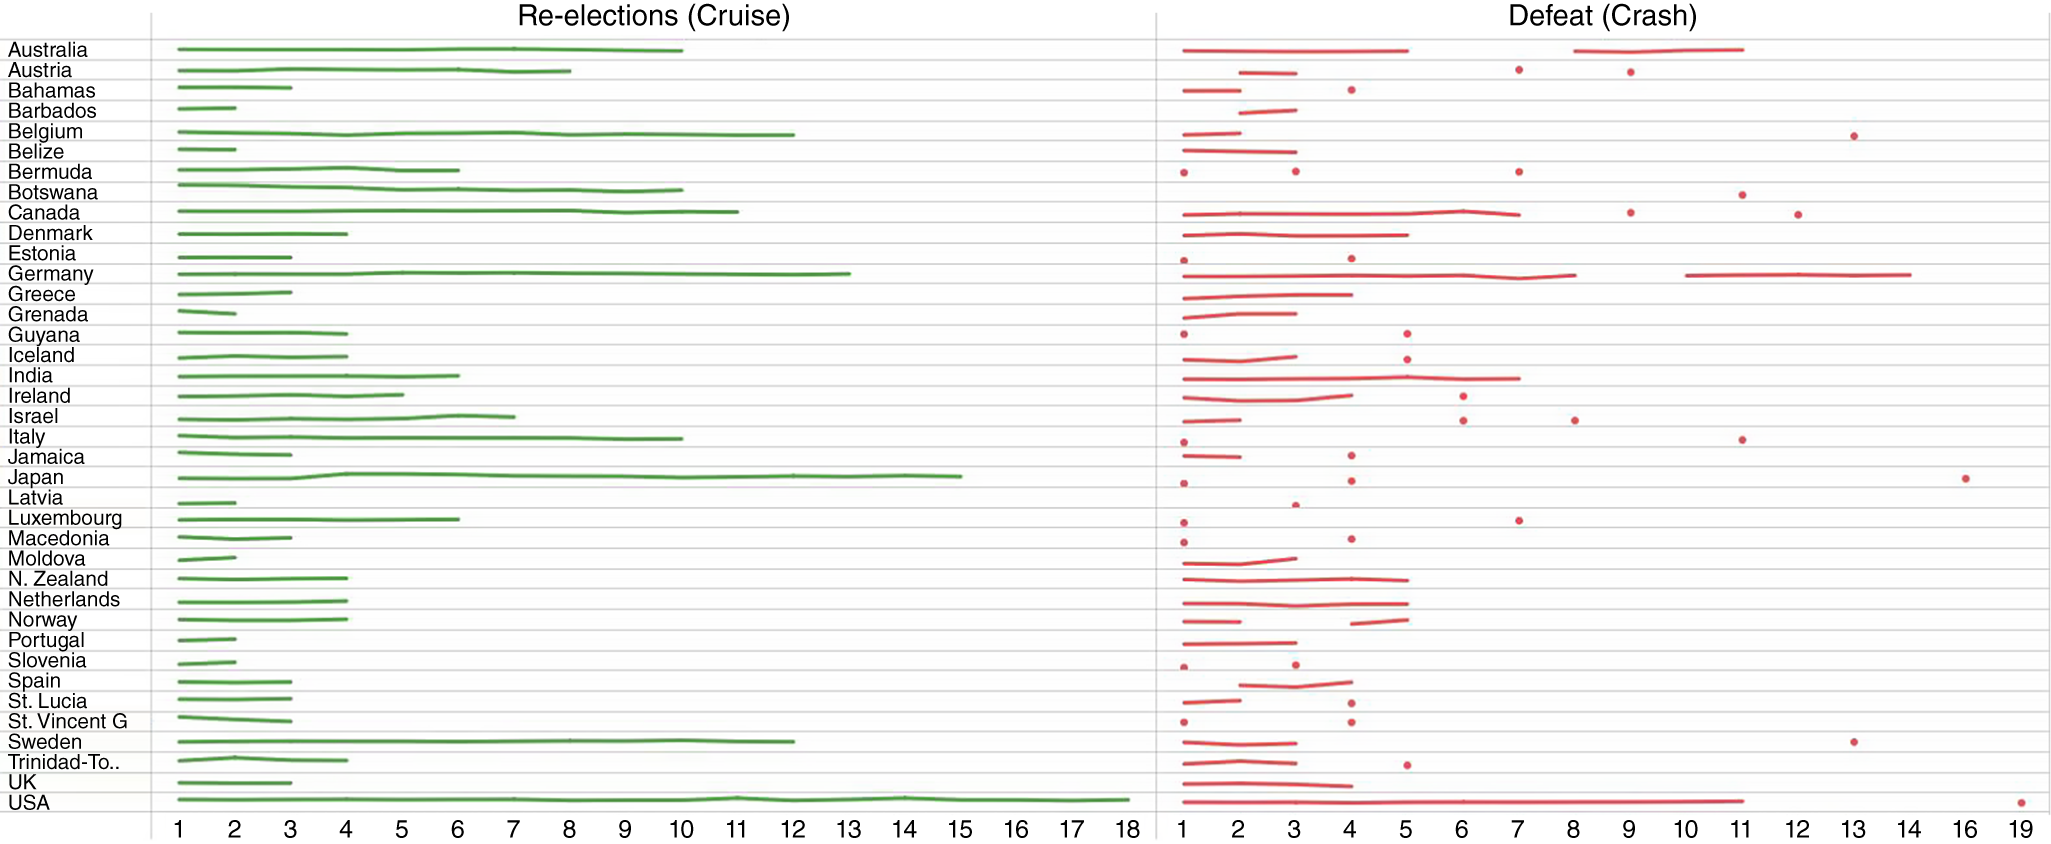
To trace the path of incumbency, I begin with a telling statistic. Recall that figure 1 shows that the most frequent spell consists in a one-term government. Of those, the vast majority—80% at the national level and 90% at the subnational level—lost votes between their inaugural election and their failed attempt at reelection. At both levels, both types combined, the reduction was about 10 percentage points from the inaugural vote.Footnote 4 By contrast, more than 50% of the time, the parties that returned to office at the conclusion of their first term did so with a vote that was from 4% to 8% higher, on average, than their inaugural vote. Moreover, of the parties that survived four reelections, approximately 66% experienced a bump at E1+, with their vote holding steady reelection after reelection. That the cruise vote is trendless is easily verified in table 1 by comparing the mean votes in the first reelection at E1+ and that of all subsequent reelections, E2:En-1 (figure 2).

Figure 2 Cruise and Crash, National and Subnational Spells Combined, by Election
Note: The figure shows the mean incumbent party vote by country in reelection and defeat across spells and elections, national and subnational elections combined.
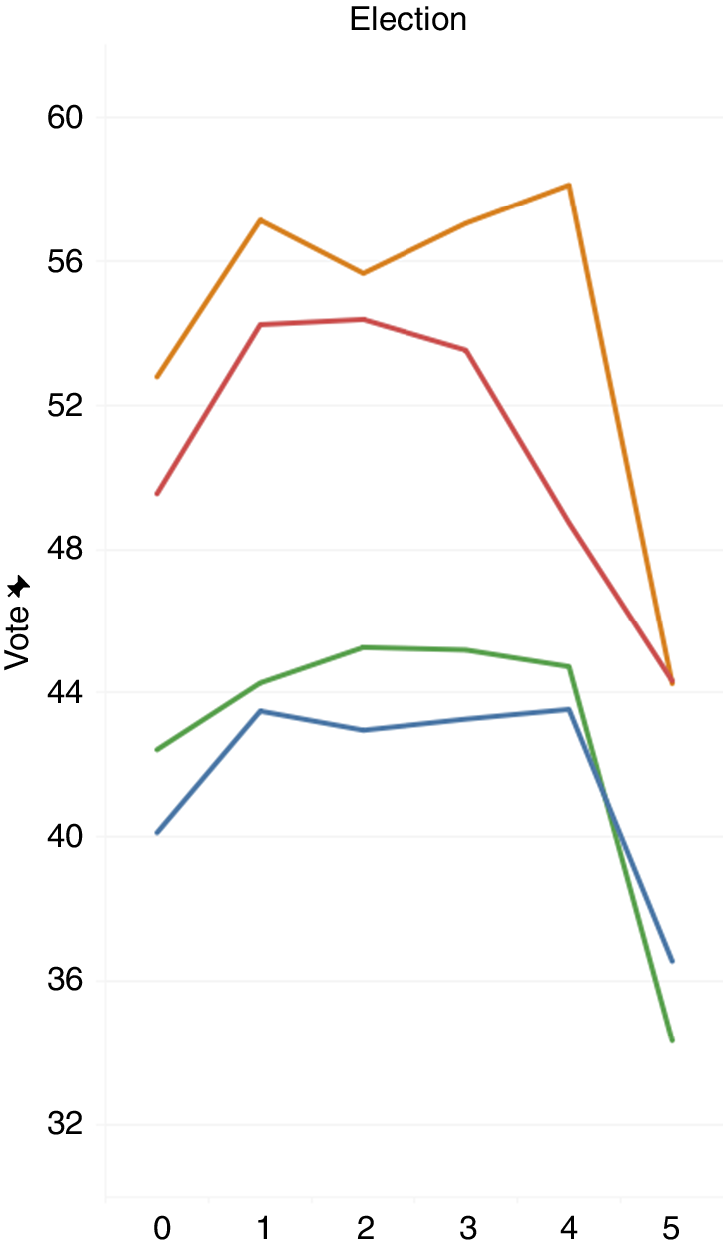
Figure 3 displays the actual path of the mean vote by level and type from E0 to E n, through five terms, one set each of two levels of government: one for the cabinet countries and another for the United States. Starting at an inaugural vote of 40% and 50%, respectively, at the ruling party’s first reelection its vote increases by 10%—to 44% and 55%, respectively—then bobs up and down slightly in subsequent reelections until the crash, at which point the party’s vote is about 20% lower than it was at E0.. The path is shaped like an asymmetrical inverted letter U or W.

Figure 3 Path of Incumbency, by Type and Level
Note: The upper panel displays the U.S. and the lower, the cabinet countries; the higher path in each pair, the state or provincial level; through five terms.
An obvious question to ask is: Why was the bump from E 0 to E1 not included in the original cruise and crash model? This likely was because the intent of the authors (Cuzán and Heggen Reference Cuzán and Heggen2023a) was to demonstrate four important but unrelated factors: (1) the exponential decay that characterizes the distribution of incumbent reelections and defeats (Heggen and Cuzán Reference Heggen and Cuzán2022a); (2) a pattern of incumbent vote showing that the cost of ruling measured on a per-term basis, as other authors have done (Budge Reference Budge2019; Cuzán Reference Cuzán2015; Nannestad and Paldam Reference Nannestad and Paldam1999), obscures the fact that almost all of the loss happens at the ousting election, in a crash; (3) this cost is more meaningfully measured in relative terms; and (4) the magnitude of the cost is independent of the length of the spell. A contributing factor is that most of the parliamentary elections Heggen and Cuzán analyzed were at the subnational level in four countries where, as shown in table 1, the first reelection boost is relatively small. Given their focus on other questions, it was understandable that the uptick went largely unremarked. I say “largely” because they had reported evidence for an increment in US gubernatorial elections in a previous conference paper (Heggen and Cuzán Reference Heggen and Cuzán2022b, 6, 12). However, that observation went unmentioned in the discussion and conclusion because it was not a new finding (see, e.g., Ansolabehere and Snyder Reference Ansolabehere and Snyder2002), and the emphasis was on points (2) and (3).
CONCLUSION
This analysis completes a path of incumbency traced by Cuzán and Heggen’s (Reference Cuzán and Heggen2023a) cruise and crash model of elections. Cutting across levels and types of government and country characteristics, the inverted asymmetrical U- or W-shaped pattern possibly reflects an underlying quality of the political system that future research may yet uncover.
…the…pattern possibly reflects an underlying quality of the political system that future research may yet uncover.
SUPPLEMENTARY MATERIAL
To view supplementary material for this article, please visit http://doi.org/10.1017/S1049096525101182.
ACKNOWLEDGMENTS
Many thanks to the editors of this journal and the anonymous reviewers whose critiques and suggestions did much to improve this article. Thanks also to several cohorts of graduate assistants at UWF who have added or proofread data in an ever-growing elections file: Michelle Adams, Daniel Dorman, Carter Edwards, Erin Jackson, Matthew Leight, John Link, Megan Morrison, Caleb Paul, Yamisle Roca, Brian Rosebrock, and Grace Wheeler. Last but not least, I thank Richard J. Heggen—my friend and coauthor of the sources listed in the references that serve as the basis of this article—for his encouragement and suggestions.
DATA AVAILABILITY STATEMENT
Research documentation and data that support the findings of this study are openly available at the PS: Political Science & Politics Harvard Dataverse at https://doi.org/10.7910/DVN/EVUCBL.
CONFLICTS OF INTEREST
The author declares that there are no ethical issues or conflicts of interest in this research.