


Introduction
Animal welfare can be assessed using a number of measurement frameworks (Browning, Reference Browning2022). There is also significant variation in the animal welfare standards for certification used by private assurance schemes (More et al., Reference More, Hanlon, Marchewka and Boyle2017). However, most of the available methods focus on assessing resource-based indicators rather than collecting welfare information at the individual animal level (Stygar et al., Reference Stygar, Krampe, Llonch and Niemi2022). With the increasing amount of sensor data in dairy production, there is an upward trend towards new methods capable of assessing animal welfare at the individual level (Stygar et al., Reference Stygar, Gómez, Berteselli, Dalla, Canali, JK, Llonch and Pastell2021). Recently, attempts have been made to replace human assessment of animal welfare with artificial intelligence (Stygar et al., Reference Stygar, Frondelius, Berteselli, Gómez, Canali, JK, Llonch and Pastell2023). However, new methods for objective welfare assessment are needed for successful implementation and testing of algorithms (Vesel et al., Reference Vesel, Pavič, Ježek, Snoj and Starič2020).
Measuring levels of the stress hormone cortisol as an indicator of welfare is common, but its use is still under scrutiny (Tamminen et al., Reference Tamminen, Keeling, Svensson, Briot and Emanuelson2021). Cortisol has been widely used as a biomarker of stress in several species (Hellhammer et al., Reference Hellhammer, Wüst and Kudielka2009). Traditionally, serum has been the main matrix used to measure cortisol concentrations (Mormède et al., Reference Mormède, Andanson, Aupérin, Beerda, Guémené, Malmkvist, Manteca, Manteuffel, Prunet, CG and Richard2007). As an invasive method, blood sampling itself is stressful and increases cortisol levels. In addition, serum cortisol concentration has a circadian rhythm, which should be taken into account when using an episodic sample matrix. Hair is a non-invasive and easily collected alternative matrix that allows assessment of long-term stress as cortisol accumulates in hair (Koren et al., Reference Koren, Mokady, Karaskov, Klein, Koren and Geffen2002; Prims et al., Reference Prims, Vanden Hole, Van Cruchten, Van Ginneken, Van Ostade and Casteleyn2019) and is not affected by diurnal fluctuations (González-de-la-Vara et al., Reference Del Rosario, RA, Lemus-Ramirez, J C, Villa-Godoy and Romano2011). In dairy cattle, hair cortisol concentration (HCC) has been measured in several studies to assess chronic stress (Comin et al., Reference Comin, Peric, Corazzin, Veronesi, Meloni, Zufferli, Cornacchia and Prandi2013; Burnett et al., Reference Burnett, Madureira, Silper, Tahmasbi, Nadalin, Veira and Cerri2015; Braun et al., Reference Braun, Clavadetscher, Baumgartner, Riond and Binz2017a). For example, HCC was associated with certain clinical disorders (Burnett et al., Reference Burnett, Madureira, Silper, Tahmasbi, Nadalin, Veira and Cerri2015). However, no correlation was found between overall dairy cow welfare scores and hair cortisol levels (van Eerdenburg et al., Reference FJ, Hof, Doeve, Ravesloot, EC, RE and FJ2021).
HCC in cattle has traditionally been measured by non-automated assays such as enzyme-linked immunosorbent assay (ELISA) (Moya et al., Reference Moya, Schwartzkopf-Genswein and Veira2013; Tallo-Parra et al., Reference Tallo-Parra, Manteca, Sabes-Alsina, Carbajal and Lopez-Bejar2014; Grelet et al., Reference Grelet, Vanden Dries, Leblois, Wavreille, Mirabito, Soyeurt, Franceschini, Gengler, Brostaux, Dehareng and Consortium2022) or liquid chromatography tandem mass spectrometry (LC-MS/MS) (Braun et al., Reference Braun, Wiest, Lutz, Riond, Hilbe, Baumgartner and Binz2019a, Reference Braun, Wiest, Lutz, Riond, Stirn, Hilbe, Baumgartner and Binz2019b). An automated assay for cortisol determination is a laboratory technique that has been used in other species and matrices, such as porcine saliva, and has several advantages, such as ease of use, high throughput analysis, and an integrated nature that allows for the complete capture of all reagents, samples, and wash solutions on the instrument itself (Escribano et al., Reference Escribano, Fuentes-Rubio and Cerón2012). An automated method has been used to determine cortisol levels in human hair, with higher values obtained in individuals under stressful conditions (Gonzalez et al., Reference Gonzalez, Jacobsen, Ibar, Pavan, Monti, Fernandez, Balbi, Fritzler, Jamardo, E M and Berg2019). However, to the authors’ knowledge, automated assays have not been used to measure HCC in cattle.
The aim of this study was to evaluate the usefulness of measuring HCC for the welfare assessment of dairy cattle. Firstly, the use of an automated chemiluminescent immunoassay analyzer to measure cortisol in bovine hair was analytically validated. Secondly, the relationships between HCC and welfare were assessed.
Materials and methods
Animals and herds
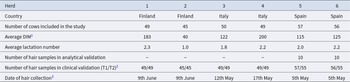
The study was conducted between 03 February 2021 and 09 June 2021 in a total of 6 herds and 290 cows in Finland, Spain and Italy. Sampling was carried out in three different countries, since the trial was performed as an activity of the ClearFarm project, in which institutions from these three countries collaborated. ClearFarm aimed to co-design, develop and validate a software platform using smart farming technology to provide animal welfare information. Hair cortisol was one of several welfare indicators tested in the project. Sampling protocol was discussed and agreed prior to experiment to assure that samples were collected consistently in all countries. General information on the study herds and sample collection is presented in Table 1. The cows were of the breeds Holstein and Nordic Red. All cows were fed a total mixed ration and had ad libitum access to water.
Table 1. Overview of herds and animals participating in the study

1 DIM – days in milk.
2 T1- represents days 0-45 and T2- represents days 46-90 of the study period.
3 all samples were collected in year 2021.
Data collection
The study lasted 90 days. Data collection was divided into two study periods, T1 and T2, each lasting 45 days.
Data relevant to animal welfare (animal-based assessment according to the Welfare Quality (WQ®) protocol, veterinary treatments, meteorological data) were collected during the study period. A detailed methodology of animal welfare data collection is presented in Stygar et al. (Reference Stygar, Frondelius, Berteselli, Gómez, Canali, JK, Llonch and Pastell2023). Here, the methods are briefly presented to allow the reader to understand how the average welfare class was calculated for all cows participating in the study.
Trained scorers visited the farms three times during the study period, on days 0, 45 and 90. The assessments were carried out by the same assessor in each country. During these visits, on-farm animal welfare data were collected according to WQ® (Welfare Quality®, 2009) guidelines. Only animal-related measures that could be assessed at an individual level were included. These measures covered three of the four WQ® principles: good nutrition (body condition score), good housing (udder, leg, hind quarter cleanliness) and good health (skin changes, locomotion score, mastitis, nasal discharge, eye discharge, vulvar discharge, diarrhea). The WQ® measures were supplemented with a daily temperature-humidity index to account for heat stress (detailed methodology in (Stygar et al., Reference Stygar, Frondelius, Berteselli, Gómez, Canali, JK, Llonch and Pastell2023). To account for any health problems that might develop between farm visits, farm records of animal health were used to complement the data from the on-farm welfare assessment. Each farmer provided farm records of disease diagnosis and treatment (including clinical mastitis, dystocia, respiratory disease, reproductive disease and metabolic disease) for all animals enrolled in the study for the duration of the study. The summary of veterinary treatment records is presented by Stygar et al. (Reference Stygar, Frondelius, Berteselli, Gómez, Canali, JK, Llonch and Pastell2023, Supplementary material).
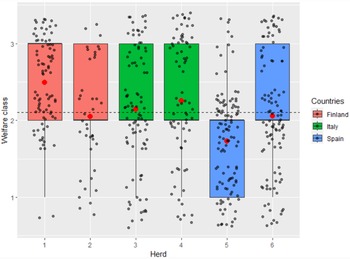
A daily welfare index was created by combining the on-farm welfare measures, the on-farm veterinary records and the meteorological data. The severity (0 = none, 1 = mild to moderate and 2 = severe) and duration (from 1 to 45 days) of the different welfare problems were estimated by the expert judgement of the authors and based on the relevant scientific literature. For example, if a cow suffered from clinical mastitis, it was assigned a severity score of 2 for 21 days from the day of treatment. Conversely, if a cow had a moderate lameness problem, it was assigned a severity score of 1 for 45 days from the date of assessment. The final welfare index for each cow was obtained by summing the severity scores on a daily basis. A cow could receive a daily welfare index ranging from a minimum of 0 to a maximum of 23. For each cow, an average welfare index was calculated for each 45-day study period (T1 and T2). Based on these 45-day average indices, each cow was classified into one of three welfare classes for both T1 and T2: class 1 (if welfare index < 2), class 2 (with index > 2 but ≤ 3), class 3 (index > 3), representing animals with good, medium and poor welfare, respectively. The mean and distribution of welfare classes for each farm are shown in Fig. 1.

Figure 1. Boxplot representing the distribution of an individual welfare class obtained in six herds during the study period. Dashed line represents mean value calculated from all herds, red dots represent mean value of a welfare class in each herd.
Hair sampling
Hair samples were collected between May and June 2021, depending on the herd (Table 1). For sample collection, a segment of approximately 10 × 5 cm of hair was shaved from the dorsal region at the initial segment of the tail switch, adjacent to the skin, using electric clippers and/or scissors. This sampling area was chosen because hair growth is faster than at other sites and therefore sensitive enough to capture changes in cortisol over short intervals (Burnett et al., Reference Burnett, Madureira, Silper, Nadalin, Tahmasbi, DM and RL2014). Hair samples were collected on day 104 of the study (14 days to allow for hair growth + first 45-day period + second 45-day period). The waiting period of 14 days for hair to appear on the upper skin surface was based on the available literature (Meyer and Novak, Reference Meyer and Novak2012; Russell et al., Reference Russell, Koren, Rieder and Van Uum2012; Vesel et al., Reference Vesel, Pavič, Ježek, Snoj and Starič2020). When collecting hair samples, excessively contaminated hair was avoided as much as possible and the base of the hair was marked with a coloured elastic band to facilitate identification of the direction of hair growth during sample processing. Collected hair samples were identified with a unique cow and farm identification number and dried at room temperature (RT) for 24 hours.
Given that the growth rate of a tail switch hair was estimated to be 0.51 ± 0.05 mm/day (Burnett et al., Reference Burnett, Madureira, Silper, Nadalin, Tahmasbi, DM and RL2014), it was assumed that a length of 21 mm represented the cumulative cortisol concentrations over a 45-day period. Hair samples of individual cows were therefore cut into two separate samples representing two distinct study periods, namely 0-45 days (sample T1 – cut between 22 mm and 43 mm from the skin surface) and 46-90 days (sample T2 – cut between 0 and 21 mm from the skin surface). Subsequently, each period sample (T1 and T2) was placed separately in small sealable plastic bags. An animal and a sample identification number were attached to the bag and sent to the laboratory of the Faculty of Veterinary Medicine of the University of Murcia (30,001 Espinardo, Murcia, Spain), where they were stored at RT until further analysis.
Hair cortisol extraction
Hair cortisol extraction was performed according to the protocol of Davenport et al. (Reference Davenport, Tiefenbacher and Lutz2006) modified by López-Arjona et al. (Reference López-Arjona, Tecles, Mateo, Contreras-Aguilar, Martínez-Miró, Cerón and Martínez-Subiela2020a).
From each hair sample, 250 mg was weighed and placed in a standard round bottomed polystyrene microcentrifuge tube (12 × 75 mm) covered with 2.5 mL of isopropanol (isopropyl alcohol, Macron Fine Chemicals, Avantor Performance Materials, Center Valley, PA, USA). After shaking for 3 min (100 rpm, VXR basic VIBRAX, IKA, Staufen, Germany), the tube was centrifuged at 1,500 g × 1 min at RT, and the isopropanol was discarded. This washing procedure was repeated twice. The hair sample was then left at RT for at least 2 h until completely dry. Next, 60 mg of each hair sample was cut into small pieces and placed in tubes with balls (Precellys Lysing kit, hard tissue grinding MK28, Precellys Bertin Technologies, France) and then pulverized (6,800 rpm × 20 sg, 3 cycles, twice) into a fine powder using a homogenizer (Precellys Tissue homogenizer, Bertin Technologies, France). Once pulverized, the hair was incubated with 1 mL methanol (Methanol 361,091, ITW Reagents, Monza, Italy) for 18 h at RT with continuous gentle agitation (100 rpm, VXR basic VIBRAX, IKA, Staufen, Germany) for steroid extraction. The samples were centrifuged (2,000 g × 5 min) and 0.6 mL of each methanol extract was aliquoted into a new Eppendorf tube. The liquid portion of the samples was evaporated using a Speed Vac Concentrator (Centrifugal Vacuum Concentrator 5301, Eppendorf, Hamburg, Germany). The dry extracts were reconstituted with 0.1 mL phosphate buffer saline (PBS) and stored at − 80ºC until cortisol analysis.
Analytical validation of automated assays for cortisol measurement
A sub-sample of hairs collected during the project was used for analytical validation. The analytical validation was performed on samples collected from two Spanish herds, from 20 randomly selected animals and independent of the hair segment (T1 or T2). The samples were first analysed independently and after which they were mixed in order to make pools of different concentrations.
The precision of the method was evaluated by the intra- and inter-assay coefficient of variation (CV) as described by López-Martínez et al. (Reference López-Martínez, Escribano, Martínez-Miró, Ramis, Manzanilla, Tecles, Martínez-Subiela and Cerón2022). For intra-assay precision, two pools of hair extracts with high and low cortisol concentrations (9.2 and 4.4 pg/mg, respectively) were measured 5 times in a single analysis. Inter-assay precision was assessed by analysing the same samples as in the intra-assay test on 5 different days over a period of 15 days. To avoid freeze-thaw cycles that could interfere with the results, separate hair samples were aliquoted and stored at − 80°C so that they were only thawed once for analysis. To determine the sensitivity of the method the limit of detection (LOD) and the lower limit of quantification (LLQ) were determined. LOD was understood as the lowest cortisol concentration that the method can distinguish from the zero value. It was obtained by calculating the mean of 5 replicate measurements of the zero standard (phosphate buffered saline) plus two standard deviations. The lowest cortisol concentration that was measured with a precision of less than 20% was adopted as LLQ (López-Arjona et al., Reference López-Arjona, Mateo, Manteca, Escribano, Cerón and Martínez-Subiela2020b). To calculate it, five replicates of a pool of hair extract, serially diluted with assay buffer, were measured in the same run.
To test the accuracy of the method, a recovery test and a linearity after dilution assay were performed. To assess the linearity of the assay, two hair extracts with high and low cortisol concentrations (13.2 and 4.45 pg/mg) were serially diluted from 1:2 to 1:64 with the assay buffer as described by Escribano et al. (Reference Escribano, Fuentes-Rubio and Cerón2012). Each dilution was assayed in duplicate. The measured HCC was then plotted against the expected HCC. The average of the two initial measurements (1:2 dilution) was used to calculate the expected value for each dilution. For the recovery test, a high cortisol sample was mixed with a low cortisol sample at different dilutions. The high cortisol sample was diluted to 50%, 25% and 10% and the low cortisol sample was diluted to 50%, 75% and 90%. In addition, the low cortisol sample was diluted to 25% with a high cortisol sample at 75%. The resulting curve represents the measured HCC versus the expected HCC.
To determine the stability of the sample at −20ºC and −80ºC, two pools of hair extracts with different concentrations (9.05 and 6.6 pg/mg) were measured immediately after processing, before first freezing, and 30 days, 90 days and 1 year after freezing. In addition, aliquots were taken and refrigerated at 4°C and measured after 5, 10 and 30 days. Cross-reactivity was assessed by performing a linearity of corticosterone and cortisone.
HCC measurement
HCC was measured on samples from individual cows for both study periods, T1 and T2 separately, to investigate the relationship between HCC and welfare class. A solid-phase competitive chemiluminescent enzyme immunoassay (Immulite/Immulite 1000 cortisol, Siemens Medical Solutions Diagnostics, Los Angeles, CA) was used for HCC determination. The immunoassay uses a rabbit polyclonal anti-cortisol in addition to cortisol-conjugated alkaline phosphatase as a single reagent. According to the manufacturer, the cross-reactivity with prednisolone is 49% and the detection limit of the assay is 0.05 μg/dl. HCC results are expressed as pg/mg hair.
Associations between HCC and level of animal welfare
A linear mixed model was fitted to explore the associations between HCC (response variable) and welfare class, study period and cow factors (explanatory variables). HCC was log-transformed to obtain a normal distribution. The effect of the explanatory variables on HCC was modelled as follows:
 \begin{align*}{Y_{i,j}} =& \,{\beta _0} + {\beta _1}Parity + {\beta _2}DIM + {\beta _3}T + {\beta _4}WelfareClass \\&+ {\beta _5}Herd + { }{A_{ij}} + {\varepsilon _{ij}}\end{align*}
 where  ${Y_{i,j}}$ was log transformed cortisol measurement for cow i = 1,…,n in time j = 1,2, ${\beta _0}$ is overall mean of log cortisol, ${\beta _1},\,{\beta _{\,2}},\,{\beta _3},\,{\beta _4}$ are regression coefficients of parity (continuous), DIM (continuous), study period (T1 and T2), welfare class (three categories: 1,2 and 3) and herd (six categories: 1,2,3,4,5 and 6), respectively. ${A_{ij}}$ was a random effect of a cow, ${\varepsilon _{ij}}$ is a measurement error assumed to follow a multivariate normal distribution with zero mean. Observations were collected from animals in six herds and observations from cows in the same herd were correlated. Due to the small number of herds observed, herd was considered as a fixed effect (rather than a random effect). HCC originated from the same animals and therefore samples T1 and T2 collected within a cow were also correlated. This was accounted for in the model as a random effect of cow. Hair color was not included as an explanatory variable due to the small sample size of non-white hair. Model control was performed using graphical and numerical summaries (Q-Q plot, residual vs. fitted plot) as recommended by Pinheiro and Bates (Reference Pinheiro and Bates2014). A significance level of α = 0.05 was used for all tests. The proportion of variance in HCC explained by the models was expressed by the marginal and conditional coefficients of determination (R2M and R2C, respectively), as defined by Nakagawa and Schielzeth (Reference Nakagawa and Schielzeth2013).
Statistical analyses and plots were performed using spreadsheets Excel (2019, Microsoft) and R (2021) with the following packages: nlme (Pinheiro et al., Reference Bates, Douglas and Pinheiro, Jose2014), MuMIn (Barton, Reference Bartoń2016) and ggplot2 (Wickham, Reference Wickham2016).
Results
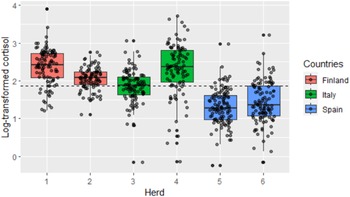
HCC in all 6 flocks ranged from 0.78 to 49.50 pg/mg with a median of 6.63 and a mean of 7.09 pg/mg. The log-transformed results of HCC in the different herds are shown in Fig. 2. The highest mean logHCC was observed in herd 1, while the lowest mean logHCC was observed in herd 5 (2.38 and 1.30 log pg/mg, respectively). The highest (0.69) and lowest (0.30) variation in logHCC was observed in herds 4 and 2, respectively.

Figure 2. Box-plot representing average log-transformed HCC and its distribution for each study herd in three countries. Dashed line represents mean value calculated from all the samples.
Analytical validation
Intra-assay precision showed a mean CV of 14.4% and inter-assay precision of 8.8% (Supplementary Table S1), being both below the recommended 20% (Escribano et al., Reference Escribano, Fuentes-Rubio and Cerón2012). The LOD for the assay was 0.083 pg/mg and the LLQ was set at 2.27 pg/mg.
For the linear regression equations fitted to the dilutions of two pools of hair samples (Supplementary Figure S1), the results showed that r was 0.96 and 0.98 for high and low concentration samples, respectively. In addition, recovery results to determine the accuracy of the method are presented in Supplementary Table S2.
The stability test showed that the reconstituted hair extract was stable for up to 10 days at 4 °C, 30 days at − 20 °C and 1 year at − 80 °C. After addition of 20 μg/dl corticosterone and 100 μg/dl cortisone, the cross-reactivity was 1.37% and 3.98% respectively.
Associations between HCC and level of animal welfare and cow-related factors
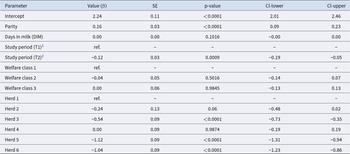
The results of the model fitting describing the association between HCC and animal welfare and cow-related factors are presented in Table 2. The R2M and R2C were 0.46 and 0.80 respectively. Therefore, the fixed and random effects together explained about 80% of the variance in the outcome, while the fixed effects alone explained about 46% of the variation in HCC level. Parity had a significant association with HCC level, with older cows having higher HCC compared to younger cows (p < 0.0001). Study period was also a significant parameter describing HCC, with T2 samples having significantly lower HCC compared to T1 samples. DIM and welfare classes were not significantly associated with HCC levels. Finally, there were significant differences in HCC between the herds studied, with herd 1 and herd 4 having the highest cortisol levels and herds 5 and 6 having the lowest (p < 0.0001).
Table 2. Linear mixed effect model describing the hair cortisol concentration with regression coefficient (β), standard error (SE), significance, and lower and upper confidence limits (CL)

1 distal cut of a hair sample obtained in days 46-90 of the study.
2 proximal cut of a hair sample obtained in days 0-45b of the study. Abbreviations: ref.- reference variable.
Discussion
The aim of this study was to evaluate the precision, accuracy, sensitivity and stability of an automated assay for the determination of HCC and to assess the usefulness of measuring HCC for the welfare assessment of dairy cattle.
Analytical validation of the cortisol measurement
Analytical validation showed that the automated assay has a high sensitivity, as demonstrated by the low LOD and LLQ obtained in this study (0.083 pg/mg and 2.27 pg/mg, respectively). The precision of the method was demonstrated by low CVs of repeated sample measurements and the assay showed linearity after serial sample dilution with a correlation coefficient close to 1, allowing cortisol concentrations to be measured in a linear fashion. The inter- and intra-assay precision of the method was found to be less than 20%, which is within acceptable limits for the assay (Aronhime et al., Reference Aronhime, Calcagno, Jajamovich, Dyvorne, Robson, Dieterich, Isabel Fiel, Martel‐Laferriere, Chatterji, Rusinek and Taouli2014; Tecles et al., Reference Tecles, Fuentes, Subiela, Parra, Muñoz and Cerón2007) and is comparable to the precision obtained with a similar chemiluminescent immunoassay method for pig saliva and human hair (Escribano et al., Reference Escribano, Fuentes-Rubio and Cerón2012; Gonzalez et al., Reference Gonzalez, Jacobsen, Ibar, Pavan, Monti, Fernandez, Balbi, Fritzler, Jamardo, E M and Berg2019) and for bovine hair using a different type of immunoassay (precision 4-10%, Tallo-Parra et al., Reference Tallo-Parra, Manteca, Sabes-Alsina, Carbajal and Lopez-Bejar2014). In addition, the method is highly specific due to low cross-reactivity with other glucocorticoids (3.98% for cortisone and 1.37% for corticosterone), which is consistent with the information provided in the product manual (Cortisol For Use on the IMMULITE ® and IMMULITE ® 1000 Systems, n.d.). The stability of the hair extract at 4°C and − 20°C is also consistent with that reported in other studies (Gonzalez et al., Reference Gonzalez, Jacobsen, Ibar, Pavan, Monti, Fernandez, Balbi, Fritzler, Jamardo, E M and Berg2019), as well as up to 1 year at −80°C.
In this study, the mean HCC value of the samples used in this study was 7.81 pg/mg. Some reports describe similar values for HCC (e.g. Wiechers et al., Reference Wiechers, Brunner, Herbrandt, Kemper and Fels2021; González-Solé et al., Reference González-Solé, Solà-Oriol, Villagómez-Estrada, Melo-Durán, López, Villarroel, López-Arjona and Pérez2022). However, the mean value of HCC varies widely in the literature, with some studies reporting HCC as high as 80 pg/mg (e.g. Prims et al., Reference Prims, Vanden Hole, Van Cruchten, Van Ginneken, Van Ostade and Casteleyn2019; Otten et al., Reference Otten, Heimbürge, Tuchscherer and Kanitz2022), while other studies reported values even below 1 pg/mg (e.g. Braun et al., Reference Braun, Michel, Baumgartner, Hässig and Binz2017b; Sharma et al., Reference Sharma, Umapathy, Kumar and Phillips2019; Tekin et al., Reference Tekin, Câmara, Binz, RM, Bollwein and Wagener2023). It should be pointed out that the HCC values obtained in different studies are not directly comparable due to the different sampling protocols or analytical techniques used, as there are no standardized protocols for HCC measurements.
Associations between HCC and level of animal welfare
Our results showed that HCC levels were dependent on parity, period and herd, whereas welfare class and DIM were not significant factors explaining HCC levels in individual animals. Regarding the study period, the results indicated that HCC was higher in T1(distal segment) than in T2 (proximal segment). However, the effect on HCC is most likely due to the distance of the segment from the skin and not the actual time period. The finding of increased HCC for the distal hair samples (T1) may be surprising, but has also been reported in previous studies (e.g. Heimbürge et al., Reference Heimbürge, Kanitz, Tuchscherer and Otten2020; Otten et al., Reference Otten, Heimbürge, Tuchscherer and Kanitz2020a). As discussed by Otten et al. (Reference Otten, Heimbürge, Tuchscherer and Kanitz2020a), the reason may be due to the damaged surface structure of the hair, which allows a higher susceptibility to external contamination by cortisol-containing fluids, e.g. sweat, urine.
The analyses also showed that HCC increased with parity. This was previously confirmed by Burnett et al. (Reference Burnett, Madureira, Silper, Tahmasbi, Nadalin, Veira and Cerri2015), Bacci et al. (Reference Bacci, Nannoni, Govoni, Scorrano, Zannoni, Forni, Martelli and Sardi2014), Endo et al. (Reference Endo, Kitamura, Okubo and Tanaka2019) and Sharma et al. (Reference Sharma, Umapathy, Kumar and Phillips2019). On the other hand, our analyses showed that DIM was not significantly associated with HCC. Previous studies have described different patterns of HCC over the lactation period. For instance, Otten et al. (Reference Otten, Heimbürge, Tuchscherer and Kanitz2023) and Bacci et al. (2015) demonstrated that HCC increased during lactation up to 200 days postpartum. Conversely, Burnett et al. (Reference Burnett, Madureira, Silper, Nadalin, Tahmasbi, DM and RL2014) and Fukasawa et al. (Reference Fukasawa, Tsukada, Kosako and Yamada2008) reported elevated levels of HCC around calving and early lactation. Although further studies should be undertaken to elucidate the reasons for these divergences, these could be influenced by the heatlh status as Endo et al. (Reference Endo, Kitamura, Okubo and Tanaka2019) observed peak concentration of cortisol at calving and early lacation for healthy cows, but for cows with impaired fertility this peak was delayed to later lactation. In the study by Tallo-Parra et al. (Reference Tallo-Parra, Carbajal, Monclús, Manteca and Lopez-Bejar2018), no correlation was found between HCC and DIM. Our results indicate that there is no consistent pattern across herds regarding the association between DIM and HCC. Similar observations were also found in a study where milk cortisol was measured in four herds (Sgorlon et al., Reference Sgorlon, Fanzago, Guiatti, Gabai, Stradaioli and Stefanon2015).
Herd level variability in HCC was expected, as in this study we collected samples from herds located in different climatic conditions (Spain, Italy and Finland), which differed in terms of herd management, dairy cow breeds, housing conditions, diet and access to pasture. Indeed, the results obtained confirmed that the herd parameter was a significant predictor of HCC. Tamminen et al. (Reference Tamminen, Keeling, Svensson, Briot and Emanuelson2021) also pointed out that there was an association between HCC levels in calves from different herds.
The results of our analyses indicated that HCC was not associated with welfare class at the individual animal level. Similar conclusions were previously presented by van Eerdenburg et al. (Reference FJ, Hof, Doeve, Ravesloot, EC, RE and FJ2021), who found no association between various welfare parameters from nine welfare assessment protocols and HCC. Vesel et al. (Reference Vesel, Pavič, Ježek, Snoj and Starič2020) also reported a lack of evidence for an association between the Welfare Quality protocol and HCC. On the other hand, there are several studies showing an association between increased HCC and individual welfare indicators that were also assessed as part of the welfare class in this study. For example, increased HCC was associated with cow dirtiness (Sharma et al., Reference Sharma, Umapathy, Kumar and Phillips2019), hock lesions (Endo et al., Sharma et al., Reference Sharma, Umapathy, Kumar and Phillips2019), lower body condition score (Endo et al., Reference Endo, Kitamura, Okubo and Tanaka2019; Tekin et al., Reference Tekin, Câmara, Binz, RM, Bollwein and Wagener2023) and clinical disease (Burnett et al., Reference Burnett, Madureira, Silper, Tahmasbi, Nadalin, Veira and Cerri2015). Fischer-Tenhagen et al. (Reference Fischer-Tenhagen, Ladwig-Wiegard, Heuwieser and Thöne-Reineke2018) reported no association between HCC and chronic lameness. However, when considering multiple welfare indicators, there may be confounding effects (one welfare indicator may offset the effects of another), making it difficult to determine the dependency between HCC and overall welfare status. For example, Tamminen et al. (Reference Tamminen, Keeling, Svensson, Briot and Emanuelson2021) showed that the associations between different welfare indicators and HCC can be complex, which may be related to different coping styles of the animals, as well as indicators of poor welfare being associated with both increased and decreased hair cortisol levels. It is worth remembering that activation of the adrenocortical axis is an intrinsic part of biological functioning, and Mormede and Terenina (Reference Mormede and Terenina2012) argued that higher activation may even be associated with better animal robustness. Interestingly, herd 1 and 5, which had the highest and lowest mean HCC, were also the herds with the worst and best overall welfare, respectively. A similar relationship between herd level welfare and hair cortisol metabolite concentrations has been shown in beef cattle under different housing conditions (Tarantola et al., Reference Tarantola, Biasato, Biasibetti, Biagini, Capra, Guarda, Leporati, Malfatto, Cavallarin, Miniscalco and Mioletti2020). However, both the results of the current study and the study by Tarantola et al. (Reference Tarantola, Biasato, Biasibetti, Biagini, Capra, Guarda, Leporati, Malfatto, Cavallarin, Miniscalco and Mioletti2020) must be interpreted with caution due to the small sample size of the herd. The results obtained highlight the need for further studies aimed at collecting cortisol samples from a larger number of farms and correlating HCC results with specific farm parameters (e.g. number of pasture days, geographical locations, breeds, specific welfare parameters).
The cortisol measurement in hair offers certain advantages over other samples, such as plasma, due to its non-invasive nature. Additionally, cortisol in hair is regarded as a biomarker of chronic stress, whereas cortisol in plasma, milk, urine or saliva is more indicative of short-term and acute stress (Kovács et al., Reference Kovács, Kézér, Bodó, Ruff, Palme and Szenci2021; Verspeek et al., Reference Verspeek, Behringer, Laméris, Murtagh, Salas, Staes, Deschner and Stevens2021; Ataallahi et al., Reference Ataallahi, Cheon, Park, Nugrahaeningtyas, Jeon and Park2023). Consequently, the measurement of cortisol in hair not only can serve as a retrospective marker for herd welfare assessment but also has the potential to be utilized for the assessment of prospective cow welfare improvement. For instance, it could be employed as a metric to evaluate the impact of farm management changes on the improvement of individual animals over time.
Limitations of the study
The relationship between HCC and welfare can be a complex challenge, reminiscent of a ‘chicken and egg’ problem. The validity of HCC as a welfare indicator depends on the reliability of cortisol as a stress marker and the appropriateness of its application to assess the welfare of dairy cattle (Heimbürge et al., Reference Heimbürge, Kanitz and Otten2019). On the other hand, the validity of a welfare protocol depends on the comprehensiveness of its criteria, its alignment with scientific understanding and its ability to accurately reflect the overall welfare of dairy cattle (Main et al., Reference Main, Mullan, Atkinson, Cooper, Wrathall and Blokhuis2014).
Although several methods for measuring HCC have been validated, there are no standardized protocols for sample collection and HCC analysis (Vesel et al., Reference Vesel, Pavič, Ježek, Snoj and Starič2020), which may affect the reliability of HCC results. Furthermore, the measurement of HCC in farm animals may present other challenges, e.g. external contamination with cortisol-containing fluids such as urine may affect the validity of hair cortisol as a long-term indicator of stress in cattle (Otten et al., Reference Otten, Heimbürge, Kanitz and Tuchscherer2020b). In addition to the reliability of analytical methods, HCC may not be the best indicator of stress and poor welfare (Broom, Reference Broom2017). As mentioned above, activation of the adrenocortical axis has a complex relationship with stress, welfare and robustness in animals, and individual differences are evident (Mormede and Terenina, Reference Mormede and Terenina2012). Indeed, it has been suggested that the ratio of glucocorticoids to the ‘glucocorticoid antagonist’ dehydroepiandrosterone (DHEA) may be a better measure of welfare than measuring cortisol concentrations (Whitham et al., Reference Whitham, Bryant and Miller2020).
In this study we investigated HCC in relation to the overall welfare of dairy cattle. However, the validity of the chosen welfare assessment method at the individual animal level could be questioned. For example, the WQ® protocol has been validated for welfare assessment at herd level, whereas there is a general lack of validated methods for welfare assessment at individual animal level. In addition, the reliability of veterinary treatment databases used to calculate the overall welfare class could be questioned. For example, data loss is common in veterinary treatment records, the completeness of the records depends on the disease (Espetvedt et al., Reference Espetvedt, Wolff, Rintakoski, Lind and Østerås2012; Lind et al., Reference Lind, Thomsen, Ersbøll, MN, Wolff, Rintakoski and Houe2012), and in addition, these databases only include medically treated animals instead of all sick animals (Lind et al., Reference Lind, Thomsen, Ersbøll, MN, Wolff, Rintakoski and Houe2012). Furthermore, the method used in this study did not include behavioral indicators, as these are not measured at the individual level in the WQ® protocol. Considering all the above weaknesses, it is possible that the welfare classification used in this study did not adequately describe the welfare status of the animals in the experiment. However, welfare assessed with the same method showed an association with sensor-based measures of dairy cow behavior in a previous study (Stygar et al., Reference Stygar, Frondelius, Berteselli, Gómez, Canali, JK, Llonch and Pastell2023).
It remains an open question whether the welfare assessment method used, or the HCC measurement is the cause of the inability to accurately reflect the welfare status of the animals. To overcome this challenge, greater collaboration between animal welfare and physiology experts is needed to understand the physiological implications of poor welfare events and vice versa. Standardized protocols for hair sampling and cortisol analysis should be established and more controlled studies comparing HCC and dairy cattle welfare indicators are needed to provide a comprehensive understanding of the interactions between animal welfare and HCC.
Conclusion
Hair cortisol concentrations in cows can be measured accurately and reliably using the automated method validated in this study. However, we found no evidence of an association between the level of individual animal welfare and HCC. Further studies are needed to clarify the potential applications of hair cortisol as a stress marker in dairy cows.
Supplementary material
The supplementary material for this article can be found at https://doi.org/10.1017/S0022029925101039.
Acknowledgements
We would like to acknowledge six anonymous farmers who provided us access to the data collected on their farms and supported the collection of welfare assessment data during the study period. Additionally, we would like to thank technical staff of Natural Resources Institute Finland for sample collection and preparing in Finland.
Funding statement
M.B. was funded by the Seneca Foundation (21789/FPI/22). P.L received financial support from the Ramón y Cajal programme (RYC2020-029067-I) funded by the Spanish Ministry of Science and Innovation. This study was conducted within the ClearFarm Project aiming to co-design, develop, and validate a software platform powered by PLF Technologies to provide animal welfare information. This project has received funding from the European Union's Horizon 2020 research and innovation program under grant agreement no. 862919.
Ethical statement
The study was approved by the Animal Welfare Committee of the University of Milan (approval n. OPBA_90_2020; December 4, 2020). According to interior assessment at the Autonomous University of Barcelona and Natural Resources Institute Finland the project authorization was not needed as the experiment did not caused animals a level of pain, suffering, distress or lasting harm equivalent to, or higher than, that caused by the introduction of needle (2010/63/EU).


 Open access