

1. Introduction
In the aftermath of the COVID-19 outbreak, most demographers and social scientists anticipated a “large, lasting baby bust” in developed countries (Kearney and Levine, Reference Kearney and Levine2020). This pessimistic view, supported by Google searches for fertility-related words (Wilde, Chen, and Lohmann, Reference Wilde, Chen and Lohmann2020) and early aggregate data from vital statistics (Aassve et al., Reference Aassve2021; Sobotka et al., Reference Sobotka2021; Caracciolo, Lo Bello, and Pellegrino, Reference Caracciolo, Bello and Pellegrino2021), was grounded in at least two key arguments. First, the public health emergency immediately led to severe economic consequences in terms of higher unemployment and lower income, which were expected to lead to fewer births, given the procyclicality of fertility (see e.g. Sobotka, Skirbekk, and Philipov, Reference Sobotka, Skirbekk and Philipov2011; Schaller, Fishback, and Marquardt, Reference Schaller, Fishback and Marquardt2020).Footnote 1 Second, the COVID-19 shock dramatically heightened uncertainty about the future, undermining a key factor in couples’ fertility decisions (Guetto, Bazzani, and Vignoli, Reference Guetto, Bazzani and Vignoli2022).Footnote 2
However, as more data became available, these predictions were revised upward, and new evidence revealed that after a substantial drop in births in late 2020, fertility rebounded in 2021 across several high-income countries (Sobotka et al., Reference Sobotka2024; Kearney and Levine, Reference Kearney and Levine2023). Using administrative microdata on the universe of births in the US and in Spain, respectively, Bailey, Currie, and Schwandt (Reference Bailey, Currie and Schwandt2023) and González and Trommlerová (Reference González and Trommlerová2024) document heterogeneity in fertility patterns across different groups of mothers. In both countries, while births to foreign women plummeted and did not fully recover afterward, natives experienced an overall net increase in fertility relative to the pre-pandemic trend. Additionally, the largest positive deviations among US-born mothers were observed for first births, women with a college education, and those in the 20–24 and 30–34 age groups. Whether this trend reversal is a temporary phenomenon remains an open question.
In addition to changes in fertility behavior, the pandemic was also expected to lead to more risks for newborn health, given the established association between maternal stress and preterm births (Dole et al., Reference Dole2003) or low birthweight (Diego et al., Reference Diego2006). Empirical results from population-level studies are conflicting. In a paper closely related to ours, Silverio-Murillo et al. (Reference Silverio-Murillo2024) show a sharp deterioration of infant health at birth in Mexico following the COVID-19 outbreak. On the other hand, Been et al. (Reference Been2020) find that the implementation of mitigation measures in the Netherlands was associated with a substantial reduction in preterm births, while Shah et al. (Reference Shah2021) report no unusual change in Canada. The existing evidence from hospital-based studies is similarly mixed (see, e.g., Khalil et al., Reference Khalil2020; Kim et al., Reference Kim2021). Newborn health is a relevant outcome not only per se, but also because of its well-established lifelong consequences (see, e.g., Almond, Reference Almond2006; Case and Paxson, Reference Case and Paxson2009; Currie, Reference Currie2009; Hoynes, Schanzenbach, and Almond, Reference Hoynes, Schanzenbach and Almond2016; Bhalotra, Karlsson, and Nilsson, Reference Bhalotra, Karlsson and Nilsson2017; Hjort, Sølvsten, and Wüst, Reference Hjort, Sølvsten and Wüst2017; Bütikofer, Løken, and Salvanes, Reference Bütikofer, Løken and Salvanes2019).
In this paper, we examine the evolution of fertility and newborn health in Tuscany, a region representative of Italy, which was one of the first countries to be severely hit by the COVID-19 pandemic.Footnote 3 Using newly available and very rich administrative data on the universe of birth certificates collected by the Tuscan Regional Health Agency through December 2022, we analyze fertility behavior across various sociodemographic groups, defined according to parents’ citizenship, education, employment, age, and maternal childbearing history. In particular, this study makes three key contributions to the literature. First, to the best of our knowledge, it is the first time that not only mothers’ but also fathers’ characteristics are examined, allowing us to assess potential gender differences in fertility responses to the pandemic shock.Footnote 4 Second, compared to both Bailey, Currie, and Schwandt (Reference Bailey, Currie and Schwandt2023) and González and Trommlerová (Reference González and Trommlerová2024), our data enable us to differentiate between employed and non-employed parents and explore the intersection of occupational status and education, offering insights into the mechanisms driving the observed heterogeneity. Third, beyond fertility outcomes, and in connection with the literature focusing on the effect of economic conditions at birth on immediate health outcomes (e.g. Dehejia and Lleras-Muney, Reference Dehejia and Lleras-Muney2004), we investigate newborn health during the pandemic, looking specifically at preterm and underweight births. Relative to what has been done by Silverio-Murillo et al. (Reference Silverio-Murillo2024), we also assess how these indicators evolved across different sociodemographic groups and we focus on a country much more similar to the OECD average in terms of public spending on healthcare.Footnote 5
We adopt the methodology of Bailey, Currie, and Schwandt (Reference Bailey, Currie and Schwandt2023) by comparing observed outcomes to a counterfactual based on pre-pandemic trends. Our findings show that the overall number of births fell below the pre-pandemic trend in late 2020 and early 2021, i.e., approximately nine to twelve months after the beginning of the pandemic, but rebounded in the rest of 2021 and in 2022. Conceptions generally dipped below the counterfactual around the major pandemic waves but were offset by positive deviations between these waves, resulting in a cumulative net increase in births relative to the pre-pandemic trend. This aggregate “baby bump” masks significant heterogeneity across sociodemographic groups.Footnote 6 Births exceeded the trend only among mothers who were Italian, held at least a high school degree, were employed, and aged 30 to 39. In contrast, foreigners, less educated, unemployed women, and those at the younger and older extremes of reproductive age experienced a “baby bust” during the pandemic. The pattern is almost identical when analyzed by fathers’ characteristics, an aspect that has not been highlighted in previous literature. These findings suggest that the positive fertility response to the pandemic was concentrated among individuals in relatively favorable economic conditions, with stable jobs, more likely to already be in a couple, and able to benefit from new arrangements, such as remote work, which became widespread after 2020.
In addition, the data from birth certificates allow us to examine whether newborn health was differentially affected during the pandemic. Using two widely recognized indicators of infant health (preterm and underweight births), we find no evidence of deterioration, contrary to the findings shown in a different context by Silverio-Murillo et al. (Reference Silverio-Murillo2024). If anything, both indicators slightly improved, possibly reflecting (i) a shift in births from groups more exposed to health risks to those less exposed or (ii) a general reduction in maternal stress among certain pregnant women. Our heterogeneity analysis supports both hypotheses (in line with previous literature on newborn health during recessions; see, e.g., Dehejia and Lleras-Muney, Reference Dehejia and Lleras-Muney2004). On the former, we observe that the increase in the number of births is concentrated in groups potentially less exposed to preterm and underweight births, such as mothers in the median age range for their first delivery (Restrepo-Méndez et al., Reference Restrepo-Méndez2015). Supporting the latter hypothesis, we observe that the improvement in newborn health was more pronounced among native, educated, and employed parents, that is, once again, among groups in better economic conditions and more likely to benefit from remote working opportunities.
The rest of the paper is structured as follows. Section 2 summarizes the key features of the pandemic in Italy. Section 3 presents the administrative data and the methodology employed to assess the dynamics of fertility and newborn health during the pandemic. Section 4 shows and discusses the results of our analysis. Section 5 concludes.
2. Background
Italy was one of the first Western countries to experience severe impacts from the spread of COVID-19. The pandemic first emerged in late February 2020, when the country reported its initial confirmed cases in the northern region of Lombardy. By early March, Italy became the epicenter of the pandemic in Europe, witnessing a rapid escalation in infections and deaths. The Italian government responded swiftly, imposing a nationwide lockdown on March 9, 2020, which included stringent travel restrictions, the closure of non-essential businesses and schools, and social distancing measures. Cultural and social activities were disallowed, and sports facilities remained closed. Italy’s healthcare system was overwhelmed as hospitals faced shortages of medical supplies and intensive-care unit (ICU) beds. Starting from September 2020, Italy implemented different measures to prevent additional full-scale lockdowns. According to the diffusion and severity of the COVID-19 infections, regions (NUTS-2 level) were given statuses of white (lowest concern), yellow, orange, or red (highest concern).Footnote 7 Each color corresponded to increasing limitations on activities, shop openings, and school days taught in school and at home (which were further differentiated by grade).
Since testing tools became available, the government implemented widespread testing, contact tracing, and phased reopening strategies to curb the virus’s spread, but Italy experienced multiple waves of infection throughout 2020, 2021, and into early 2022. In particular, four major pandemic waves have been identified based on the number of ICU patients. The first one, from February to May 2020, coincided with the initial state of emergency declared by the Italian Ministry of Health.Footnote 8 The second, third, and fourth wave followed in October–December 2020, March–May 2021, and January–February 2022, respectively.
From the beginning of the pandemic to the end of January 2022, the Italian National Bureau of Statistics (Istat) certified an excess mortality of about 178,000 deaths compared to the 2015–2019 average. In 2020, the total number of deaths was the highest ever recorded in Italy since the Second World War (746,146 deaths, 100,526 more than the 2015–2019 average, i.e. a 15.6% increase). In 2021 the total number of deaths decreased compared to the previous year, although it remained at very high levels.Footnote 9 Much of the excess mortality in 2021 was observed in the first quarter when vaccination coverage was still very low.
The pandemic led to increased uncertainty and perceived risks among the entire population. Prospective parents were no exception and, if anything, may have perceived even higher risks associated with childbearing, especially during the early waves of the pandemic, when the implications of the illness were still mostly unknown. For example, the disease itself was certainly a primary source of risk, both for parents and for pregnancy; additionally, there was an increased perception of contagion risk when accessing healthcare facilities (e.g., for routine medical screenings), which were overwhelmed by the pandemic response. Finally, there was uncertainty related to the vaccination process and its unknown effects on in utero development, at least until September 2021, when the Italian National Institute of Health strongly supported COVID-19 vaccination for future mothers in the second and third quarters of pregnancy.Footnote 10
In the short term, the pandemic also determined remarkable changes in the labor market. Because of specific government interventions, layoffs and quits increased only at the beginning of the pandemic, while declining over 2021 and 2022. The lifting of the first overall lockdown triggered a slow recovery of labor market flows (Casarico and Lattanzio, Reference Casarico and Lattanzio2022). The pandemic disproportionately affected females and, among them, more severely those living in large households in the North and Center of Italy (where Tuscany, the focus of our work, is located), plausibly because of the presence of young children, which imposed strong constraints to the female labor force participation (Fiaschi and Tealdi, Reference Fiaschi and Tealdi2022).
In our analysis, we use novel administrative data from birth certificates (Certificati di Assistenza al Parto, henceforth CAP) collected by the Tuscan Regional Health Agency, which are not available at the national level. For this reason, we focus our study on Tuscany, a region that remains representative of broader Italian dynamics across various domains.Footnote 11 Both its population (3.7 million) and nominal GDP (115 billion euros) weigh around 6% of Italy’s totals, with a per-capita GDP very close to the national average (31,200 and 30,100 euros, respectively). Similarly, demographic indicators such as mean age (47.7 years), birth rate (5.9 per 1000), and total fertility rate (1.16) are comparable to their national counterparts (46.2, 6.7, and 1.24, respectively). Life expectancy at birth is slightly higher than the Italian average (83.1 vs. 82.5 years, respectively). This is also a reflection of a regional healthcare system among the best in the country: in 2019 (the year immediately preceding the outbreak of the pandemic), the Tuscan healthcare system ranked second among Italian regions (CREA, 2019). In terms of public spending, the average per-capita public healthcare expenditure in Tuscany between 2000 and 2018 was €1834, against €1844 for Italy as a whole. The severity of the pandemic was also almost identical in the two areas: the proportion of the population infected at least once was 45.2% in Tuscany, compared to 45.3% nationally, while the respective COVID-19 death rates were 341 and 333 per 100,000 inhabitants.
3. Data and methodology
Our dataset covers the universe of births that took place in public or private hospitals in Tuscany between 2002 and 2022. The CAP is filled in by a birth attendant (a doctor or a midwife) or the physician responsible for the delivery unit, no later than ten days after birth. This record provides detailed information on the pregnancy, newborn characteristics, parental demographics, and several indicators of infant health at birth, which are not available in national vital statistics. We had access to an aggregate version of the CAP dataset,Footnote 12 which contains the monthly number of live births for different sociodemographic groups categorized by parents’ citizenship (Italian or foreign), age (under 30, 30–34, 35–39, or 40 and above), education level (with or without a high school degree), occupational status (employed or not), and the mother’s childbearing history (first-time mother or at least one prior delivery). Additionally, the dataset provides information on preterm and underweight births, two widely recognized indicators of infant health, disaggregated by the sociodemographic groups defined above. Preterm births are classified as those occurring before 37 weeks of gestation, while underweight births refer to infants weighing less than 2500 grams at birth.Footnote 13 To the best of our knowledge, this is the first time that all these pieces of information can be combined so to provide a comprehensive analysis of the heterogeneous effects of the pandemic on both fertility and newborn health. For example, no prior research has examined fathers’ characteristics alongside those of mothers or jointly considered both parents’ employment status and education.
Our main outcome variables are the monthly birth count, the monthly share of preterm births, and the monthly share of underweight births. To examine the evolution of these outcomes during the COVID-19 pandemic, we follow the methodology outlined in Bailey, Currie, and Schwandt (Reference Bailey, Currie and Schwandt2023). First, we seasonally adjust the raw outcome ( ${Y_{mt}}$
) by regressing it on calendar month fixed effects (
${Y_{mt}}$
) by regressing it on calendar month fixed effects ( ${\gamma _m}$
), using only observations from the pre-pandemic period (2015–2019) to avoid taking into account any effect of the pandemic:
${\gamma _m}$
), using only observations from the pre-pandemic period (2015–2019) to avoid taking into account any effect of the pandemic:
 $${Y_{mt}} = \alpha + {\gamma _m} + {\varepsilon _{mt}}{\rm{\;\;\;\;\;\;\;\;\;\;\;\;\;\;\;\;\;\;}}t \in \left[ {2015,\;\!\!2019} \right]$$
We then predict the residuals of this regression ( ${Y_{mt}} - {\hat Y_{mt}}$
) for the entire period (2015–2022) and add them to the pre-pandemic mean of the outcome (
${Y_{mt}} - {\hat Y_{mt}}$
) for the entire period (2015–2022) and add them to the pre-pandemic mean of the outcome ( ${\bar Y_{2015 - 19}}$
) to get our seasonally-adjusted monthly outcome (
${\bar Y_{2015 - 19}}$
) to get our seasonally-adjusted monthly outcome ( $Y_{mt}^{adj}$
):
$Y_{mt}^{adj}$
):
 $$Y_{mt}^{adj}: = \left( {{Y_{mt}} - {{\hat Y}_{mt}}} \right) + {\bar Y_{2015 - 19}}{\rm{\;\;\;\;\;\;\;\;\;\;\;\;\;\;\;\;\;\;}}t \in \left[ {2015,\;\!\!2022} \right]$$
Second, we estimate an outcome-specific pre-pandemic trend ( $Y_{mt}^{trend}$
) by regressing the seasonally adjusted outcome on a linear trend with observations from January 2015 to December 2019 and then predicting the fitted values (and their confidence intervals):
$Y_{mt}^{trend}$
) by regressing the seasonally adjusted outcome on a linear trend with observations from January 2015 to December 2019 and then predicting the fitted values (and their confidence intervals):
 $$Y_{mt}^{adj} = \delta + \beta \cdot mt + {\nu _{mt}}{\rm{\;\;\;\;\;\;\;\;\;\;\;\;\;\;\;\;\;\;}}t \in \left[ {2015,\;\!\!2019} \right]$$
 $$Y_{mt}^{trend}: = \hat Y_{mt}^{adj}{\rm{\;\;\;\;\;\;\;\;\;\;\;\;\;\;\;\;\;\;}}t \in \left[ {2015,\,\!\!2022} \right]$$
Finally, we calculate the absolute or percent deviations from the pre-pandemic trend’s extrapolated values in 2020–2022, which correspond to our counterfactual scenario during the pandemic:Footnote 14
 $${\rm{\Delta }}{Y_{mt}}: = Y_{mt}^{adj} - Y_{mt}^{trend}{\rm{\;\;\;\;\;\;\;\;\;\;\;\;\;\;\;\;\;\;}}t \in \left[ {2020,\;\!\!2022} \right]$$
 $$\Delta \% {Y_{mt}}: = {{Y_{mt}^{adj} - Y_{mt}^{trend}} \over {Y_{mt}^{trend}}} \times 100\;\;\;\;\;\;\;\;\;\;\;\;\;\;\;\;\;\;t \in \left[ {2020,\;\!\!2022} \right]$$
This procedure follows the approach of Bailey, Currie, and Schwandt (Reference Bailey, Currie and Schwandt2023) for the U.S., but in Section 4.4, we will also check for the robustness of our findings to alternative pre-pandemic trend specifications.
4. Results
4.1 Birth count
We first look at the aggregate birth count. Figure 1 plots the seasonally adjusted birth count from January 2015 to December 2022, alongside the pre-pandemic linear downward trend (solid blue line) and its 95% confidence interval (dashed blue lines). The shaded gray areas correspond to the four major pandemic waves (February–May 2020, October–December 2020, March–May 2021, January–February 2022), each shifted forward by nine months to reflect the typical gestation period. Since we only have monthly data on deliveries, we assume that births in month $m$
correspond to conceptions in month
$m$
correspond to conceptions in month $m - 9$
. In late 2020 and early 2021, i.e. approximately nine months after the first wave and lockdown, the observed number of births fell significantly below the pre-pandemic trend, reaching the lowest point in November 2020, the earliest month in which a behavioral response to the pandemic could be expected.Footnote
15
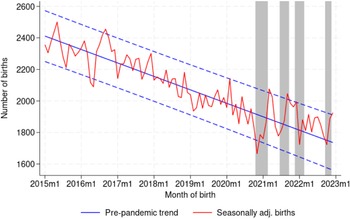
However, from March 2021 onwards, birth counts rebounded quickly and remained above the trend line for most of the period of analysis, with some months even exceeding the upper bound of the confidence interval. Notable exceptions occurred in mid-2021, late 2021, and late 2022, where the number of births again dipped below the trend, likely due to missed conceptions around the second, third, and fourth waves, respectively. As reported in Table 1, we estimate a 2.0% drop in total births in 2020 relative to the counterfactual trend, more than compensated by positive deviations of 3.1% in 2021 and 3.7% in 2022. Overall, the cumulative absolute deviation during the three-year pandemic period amounts to just over 1000 excess births, representing an increase of 2.2%.
$m - 9$
. In late 2020 and early 2021, i.e. approximately nine months after the first wave and lockdown, the observed number of births fell significantly below the pre-pandemic trend, reaching the lowest point in November 2020, the earliest month in which a behavioral response to the pandemic could be expected.Footnote
15
However, from March 2021 onwards, birth counts rebounded quickly and remained above the trend line for most of the period of analysis, with some months even exceeding the upper bound of the confidence interval. Notable exceptions occurred in mid-2021, late 2021, and late 2022, where the number of births again dipped below the trend, likely due to missed conceptions around the second, third, and fourth waves, respectively. As reported in Table 1, we estimate a 2.0% drop in total births in 2020 relative to the counterfactual trend, more than compensated by positive deviations of 3.1% in 2021 and 3.7% in 2022. Overall, the cumulative absolute deviation during the three-year pandemic period amounts to just over 1000 excess births, representing an increase of 2.2%.

Figure 1. Birth count.
Notes: Authors’ calculations on aggregate birth certificates (Certificati di Assistenza al Parto, CAP) provided by the Tuscan Regional Health Agency. The number of births is seasonally adjusted. The solid blue line is the outcome-specific linear pre-pandemic trend estimated for the period between January 2015 and December 2019. The dashed blue lines are the upper and lower bound of a 95% confidence interval around the trend. The shaded gray areas correspond to the four major pandemic waves (February–May 2020, October–December 2020, March–May 2021, January–February 2022), moved forward by nine months.
Table 1. Births and deviations from trend by parents’ characteristics
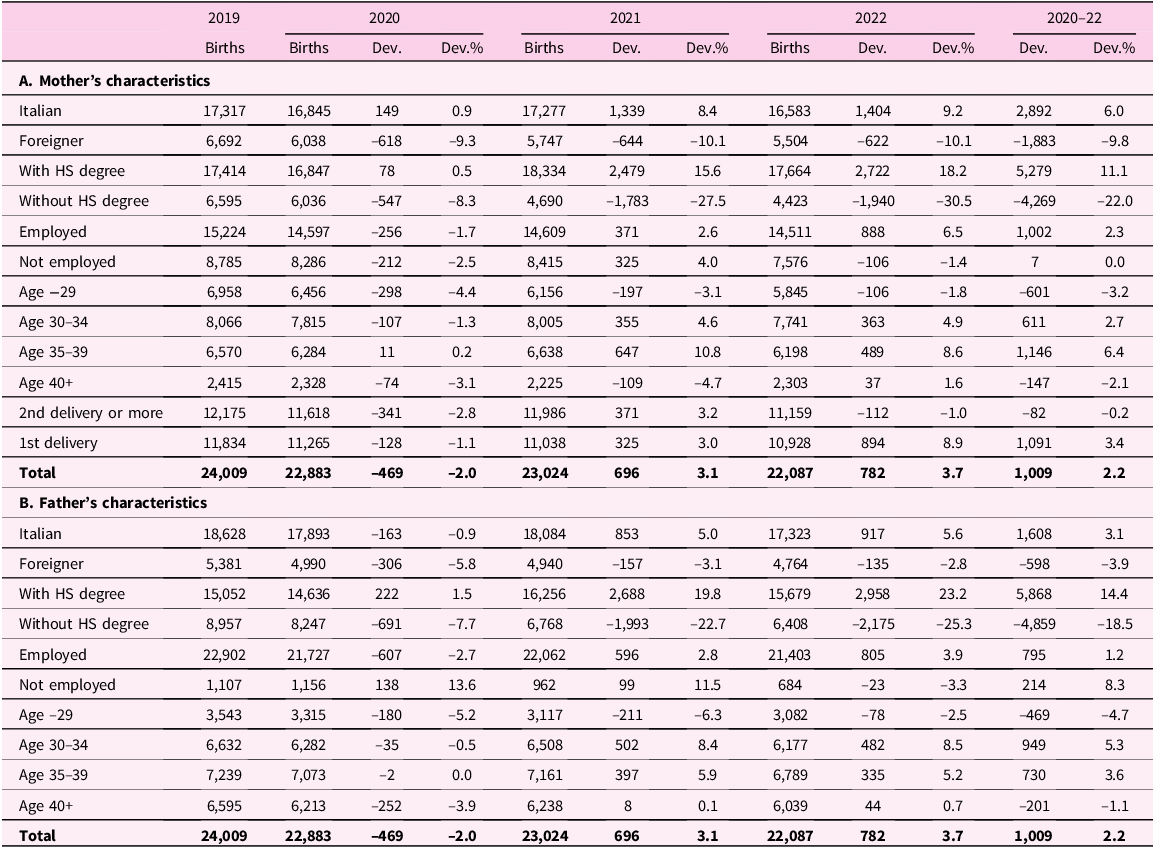
Notes: Authors’ calculations on aggregate birth certificates (Certificati di Assistenza al Parto, CAP) provided by the Tuscan Regional Health Agency. All outcomes are seasonally adjusted. For each year between 2020 and 2022 and each sociodemographic group, we report the number of births (column “Births”), the difference between the actual number of births and the predicted number based on the pre-pandemic linear trend (column “Dev.”), and the same difference expressed as a percentage (column “Dev.%”). The last two columns show the cumulative net difference between the actual and the predicted number of births based on the pre-pandemic linear trend for the period 2020–2022. “HS” stands for high school.
Using aggregate data from the Italian National Bureau of Statistics (Istat), we can replicate the same exercise for Italy as a whole. As shown in Figure A1, the results closely mirror those for Tuscany, with a negative deviation from the pre-pandemic birth trend in late 2020, followed by substantial rebounds in 2021 and 2022. This similarity reinforces the notion that Tuscany is representative of the national average also in this domain, as discussed in Section 2. Given that national-level data do not allow us to perform any heterogeneity analysis, for the remainder of the paper, we will focus exclusively on Tuscany, leveraging the richness of the data provided by the Regional Health Agency.
4.2 Heterogeneity in fertility by parents’ characteristics
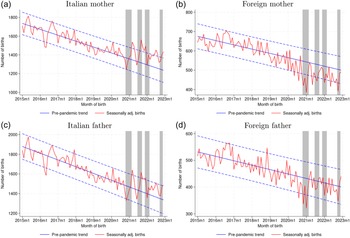
The aggregate fertility dynamics mask a substantial heterogeneity across sociodemographic groups. First, the overall positive deviation from the trend during the pandemic is driven entirely by Italian mothers and fathers, as illustrated in Figure 2. In contrast, births to foreign parents exhibited strongly negative deviations each year, with foreign mothers experiencing declines between 9% and 10% and foreign fathers between 3% and 6% (Table 1). In particular, births to foreign mothers sharply fell below the pre-pandemic trend in the first half of 2020, dipping below the confidence interval as early as April, well before any behavioral response to the COVID-19 outbreak could have been anticipated. This early decline in births among foreign mothers likely reflects a reduced inflow of pregnant women arriving in Italy following the declaration of a health emergency, driven by either international travel restrictions or concerns for safety in leaving their home countries. For foreign women already residing in Tuscany prior to the pandemic, behavioral changes may have emerged in late 2020. This is evident in Figure 2b, which shows that the number of births significantly lagged behind the trend from November 2020 to February 2021, with monthly negative deviations exceeding 20%. Furthermore, births to foreign mothers remained consistently below the trend line for the subsequent two years.

Figure 2. Birth count by parents’ citizenship.
Notes: Authors’ calculations on aggregate birth certificates (Certificati di Assistenza al Parto, CAP) provided by the Tuscan Regional Health Agency. The number of births is seasonally adjusted. The solid blue line is the outcome-specific linear pre-pandemic trend estimated for the period between January 2015 and December 2019. The dashed blue lines are the upper and lower bound of a 95% confidence interval around the trend. The shaded gray areas correspond to the four major pandemic waves (February–May 2020, October–December 2020, March–May 2021, January–February 2022), moved forward by nine months.
The pattern of births to Italian mothers is quite the opposite (Figure 2a). Despite experiencing sharp declines associated with missed conceptions around the first three waves of the pandemic, the birth count for Italian mothers never fell below the lower bound of the confidence interval. In several instances, particularly in the spring and fall of 2021 as well as mid and late 2022, the birth count significantly exceeded the upper bound. Notably, positive deviations from the trend were particularly pronounced after the first and second waves, reaching 13% in March 2021 and 19% in September 2021. Overall, between 2020 and 2022, Italian women had approximately 2900 more births than predicted by the pre-pandemic trend, effectively compensating for the 1900 fewer births recorded among foreign mothers. The Italian-foreign divide is also evident when considering fathers instead of mothers (Figures 2c and 2d), although with lower deviations in absolute value. In addition to the mechanical effect resulting from fewer foreign individuals arriving in Italy after the pandemic’s onset, these opposing trends likely reflect the adverse economic conditions that disproportionately affected foreigners.Footnote 16
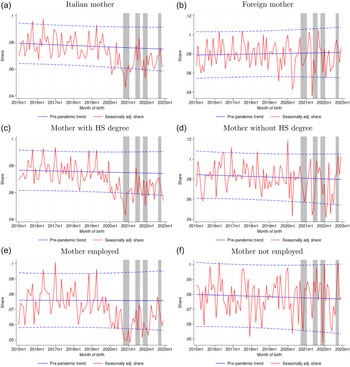
Differences in fertility behaviors during the pandemic become even more pronounced when examining the heterogeneity by parents’ education, as illustrated in Figure 3. Births to mothers and fathers with at least a high school degree consistently exceeded the upper bound of the confidence interval surrounding the pre-pandemic trend, with percent deviations even larger than 25% in certain months. The cumulative number of additional births from 2020 to 2022 compared to the counterfactual trend amounts to 5300 for educated mothers and 5900 for educated fathers, indicating a significant baby bump among these groups following the COVID-19 outbreak. In stark contrast, parents without a high school diploma experienced a sharp decline in birth counts starting in late 2020, consistently falling below the lower bound of the confidence interval without any subsequent recovery. The annual percent deviations from the trend reached −28% in 2021 and −30% in 2022 for non-educated mothers, and −23% and −25% for non-educated fathers. Since foreign parents are typically less educated than their Italian counterparts residing in Tuscany, one might argue that this educational disparity may merely reflect the Italian-foreign divide observed earlier. However, Figure A2 shows that the pronounced difference between individuals with and without a high school degree persists even when considering only births to Italian parents.

Figure 3. Birth count by parents’ education.
Notes: Authors’ calculations on aggregate birth certificates (Certificati di Assistenza al Parto, CAP) provided by the Tuscan Regional Health Agency. The number of births is seasonally adjusted. The solid blue line is the outcome-specific linear pre-pandemic trend estimated for the period between January 2015 and December 2019. The dashed blue lines are the upper and lower bound of a 95% confidence interval around the trend. The shaded gray areas correspond to the four major pandemic waves (February–May 2020, October–December 2020, March–May 2021, January–February 2022), moved forward by nine months. “HS” stands for high school.
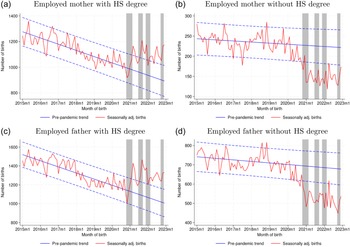
Similarly, between 2020 and 2022, the cumulative net increase in births above the trend was more pronounced for employed mothers and fathers (Figure A3 and Table 1), particularly among those who were both employed and more educated (Figure A4). This group likely benefited from higher average incomes, more stable employment, and improved work-life balance, largely due to the widespread adoption of remote working arrangements during the pandemic, especially among individuals with higher education levels.
The fertility response to the pandemic also varied substantially across different age groups of parents. As shown in Figure A5 and Table 1, mothers aged 30 to 39 experienced minimal deviation in birth counts during 2020, followed by a substantial increase compared to the pre-pandemic trend in 2021 and 2022, resulting in a cumulative birth count exceeding the counterfactual by more than 1700. In contrast, both younger and older women faced a baby bust during the same period. The underlying reasons for these trends likely differ between the two groups. Women under 30, who were less likely to cohabit and to be in stable relationships, may have been particularly affected by the restrictions on social interactions implemented during the pandemic.Footnote 17 Additionally, their fertility intentions might have been constrained by less stable economic conditions. Conversely, the decline in births among women aged 40 and above may be attributed to increased challenges in accessing assisted reproductive technologies (ART), as many fertility clinics were closed for several months to mitigate the spread of the virus.Footnote 18 On the other hand, the positive deviation in birth counts among the 30–39 age group may reflect a higher prevalence of established couples with more stable employment. The pattern for fathers mirrors that of mothers (Figure A6).
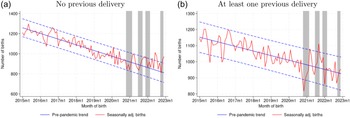
Finally, we observe notable heterogeneity based on the mother’s childbearing history (Figure A8).Footnote 19 Women with no previous deliveries experienced a negative deviation in birth counts only in 2020, followed by a substantial recovery in the subsequent two years; their monthly births consistently exceeded the trend line, except for a few months around the first two pandemic waves. This pattern aligns with the fact that these women did not have to care for other children during a period marked by frequent school closures in Tuscany.Footnote 20 The absence of parental responsibilities during such a challenging time may have contributed to lower stress levels and an increased willingness to have a baby.Footnote 21 In contrast, mothers with at least one previous delivery did not see their cumulative birth count exceed the pre-pandemic trend.
4.3 Newborn health
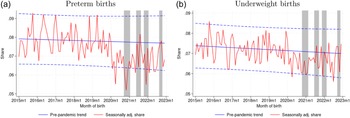
Despite concerns regarding a potential decline in newborn health during the pandemic, stemming from increased maternal stress and restricted access to healthcare facilities, our indicators of health at birth do not reflect any significant deterioration.Footnote 22 In fact, both preterm and underweight births became less frequent following the COVID-19 outbreak (Figure 4). The monthly share of preterm births consistently hovered around 8% throughout the pre-pandemic period; however, from early 2020 onwards, it was almost always below the linear trend, reaching record lows of 5.2% in November 2020 and 5.5% in December 2021 (Figure 4a). The mean deviation from the trend for the 2020–22 period is approximately −1.0 percentage points, equating to a 13% decline. For underweight births, deviations were less pronounced, with their share generally remaining between the trend line and the lower bound of the confidence interval during the pandemic (Figure 4b). On average, the share of underweight births was 0.4 percentage points (6%) lower than the trend during the 2020–22 period.

Figure 4. Share of preterm and underweight births.
Notes: Authors’ calculations on aggregate birth certificates (Certificati di Assistenza al Parto, CAP) provided by the Tuscan Regional Health Agency. The number of births is seasonally adjusted. The solid blue line is the outcome-specific linear pre-pandemic trend estimated for the period between January 2015 and December 2019. The dashed blue lines are the upper and lower bound of a 95% confidence interval around the trend. The shaded gray areas correspond to the four major pandemic waves (February–May 2020, October–December 2020, March–May 2021, January–February 2022), moved forward by eight months in panel a (to take into account the shorter distance between conception and delivery for preterm births) and by nine months in panel b.
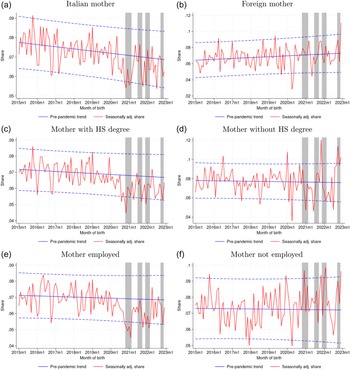
This puzzling result contrasts with the findings reported by Silverio-Murillo et al. (Reference Silverio-Murillo2024) for Mexico, where indicators of newborn health deteriorated. In addition to differences in the institutional context previously recalled, two factors may provide partial explanations for this discrepancy. First, there may have been a shift in births from groups that were, on average, more vulnerable to health risks at birth to those that were less vulnerable. For instance, pregnancies are typically considered riskier for newborn health when the mother is either very young or very old (Restrepo-Méndez et al., Reference Restrepo-Méndez2015). As discussed in Section 4.2, both of these age groups experienced a significant decline in births beginning in 2020, whereas births to mothers of median maternal age, a group generally associated with lower risks, increased sharply relative to the trend during the same period. Second, the widespread adoption of remote work during the pandemic might have alleviated maternal stress for those pregnant women able to take advantage of this work arrangement, potentially leading to improvements in newborn health rather than deterioration. While we cannot directly test these hypotheses with the available data, we can look at the heterogeneity of infant health at birth by parents’ characteristics. Figures A9 and A10 show that the improvement in newborn health was much more pronounced for native, educated, and employed mothers, that is, once again, for groups in better economic conditions and more likely to benefit from remote working opportunities.Footnote 23 For instance, the mean deviation from the trend in preterm births between 2020 and 2022 was −15% for Italian compared to −5% for foreign mothers; even larger gaps emerge between educated and non-educated (−18% vs. −5%) and between employed and non-employed mothers (−19% vs. +1.0%).Footnote 24 This evidence suggests that the aggregate dynamic of newborn health observed in our data is probably due not only to a selection effect (i.e. a change in the type of mothers who conceived during the pandemic) but also to improvements in health behavior for some groups of women, in line with findings in the literature on health at birth in recession times (see e.g. Dehejia and Lleras-Muney, Reference Dehejia and Lleras-Muney2004).
4.4 Robustness to alternative trends
In our main analysis, we estimate the pre-pandemic trend using a linear model based on data from January 2015 to December 2019, as in Bailey, Currie, and Schwandt (Reference Bailey, Currie and Schwandt2023). To check the robustness of our findings to alternative trend specifications, we leverage the extensive time span of the CAP data by estimating 32 different models. These models vary in the length of the pre-pandemic period and the functional form of the long-term trend. Specifically, we set the starting point of the models between January 2002 and 2017, with 16 models using a linear trend and 16 using a quadratic trend. Following González and Trommlerová (Reference González and Trommlerová2024), we assess model performance by training them through December 2018 and then predicting outcomes for the period from January to December 2019. We evaluate prediction accuracy using three metrics: mean squared error, mean absolute error, and mean percent error. Each of the 32 models is ranked independently based on these criteria, and a final ranking is derived from the average of the three. Table A1 presents the estimated cumulative deviation in total births and mean deviation in the share of preterm and underweight births for 2020–22 across the different models. In particular, it compares the results of our preferred model (using a linear pre-pandemic trend starting in January 2015) with the mean estimates from all 32 models, the top 10 models in each outcome-specific ranking, and the top 5 models. If anything, for each outcome, our baseline model provides conservative estimates (in absolute terms) of the deviations from the pre-pandemic trend, regardless of the comparison group.
5. Concluding remarks
In this paper, we exploit new administrative data to study the evolution of fertility and newborn health during the pandemic in Tuscany, a representative region of Italy, which was one of the first countries to experience the COVID-19 outbreak and its severe consequences. We document that the long-standing downward trend in births was at least temporarily reversed from mid-2021 onward, resulting in a notable “baby bump” during the pandemic period. While the 2.0% negative deviation from the pre-pandemic trend in 2020 is in line with the result shown by Bailey, Currie, and Schwandt (Reference Bailey, Currie and Schwandt2023) for the US and by González and Trommlerová (Reference González and Trommlerová2024) for Spain (−2.0% and −2.3%, respectively), we estimate a stronger rebound in 2021 (3.1%, compared to 1.0% in the US and 1.4% in Spain), which in our data continued into 2022 (with a 3.7% deviation). The aggregate result conceals significant heterogeneity across sociodemographic groups. The net increase in births was driven entirely by parents who were Italian, held a high school diploma, were employed, and aged between 30 and 39, as well as mothers experiencing their first delivery. As discussed in Section 4, these individuals likely benefited from more favorable economic conditions and the ability to leverage new arrangements, such as remote working, that emerged after 2020. Given the cross-country differences in healthcare infrastructure, economic resilience, and social safety nets, one could expect to observe different outcomes in Italy compared to Spain or the US. However, our evidence mostly aligns with the results in those countries, where larger deviations from the trend have been shown among native, college-educated, and first-time mothers.Footnote 25 In addition, our findings highlight the importance of employment status and its intersection with educational level in determining the fertility response to the pandemic, while suggesting no substantial differences between mothers and fathers in the observed heterogeneity. As for newborn health, contrary to the findings of Silverio-Murillo et al. (Reference Silverio-Murillo2024) for Mexico, we observe no deterioration as measured by preterm or underweight births. In fact, both indicators showed slight improvements, particularly among native, educated, and employed parents. We connect these differences to the institutional settings and health care systems in the two countries.
Whether the dynamics observed in this paper will persist remains uncertain, as our dataset ends in December 2022. Some of the new arrangements that emerged during the pandemic, particularly the expansion of remote working, could represent a structural shift that facilitates childbearing and improves work-life balance for segments of the population. If this is the case, the reversal of the pre-pandemic decline in fertility may prove stronger and more enduring than initially anticipated. However, it is also possible that the scope and duration of this fertility rebound will be too limited to significantly influence long-term demographic trends. Future research should address this critical question as new data become available.
Acknowledgments
We would like to thank the Tuscan Regional Health Agency, and in particular Fabio Voller, Martina Pacifici, and Monia Puglia, for sharing with us aggregate data on birth certificates. We also thank Luca Casolaro, Federico Cingano, Andrea Cintolesi, Thomas Crossley, Paolo Del Giovane, Silvia Del Prete, Elena Gennari, Libertad Gonzalez, Andrea Ichino, Giulio Papini, participants at the BSE Labor Summer School 2024, the SIEP Annual Conference 2024, and the EUI working groups, and two anonymous referees for their insightful comments. The views expressed in the paper are those of the authors and do not necessarily reflect those of the Bank of Italy.
Competing interests
The authors have no competing interests to disclose.
Appendix A Additional tables and figures
Table A1. Robustness to alternative pre-pandemic trends
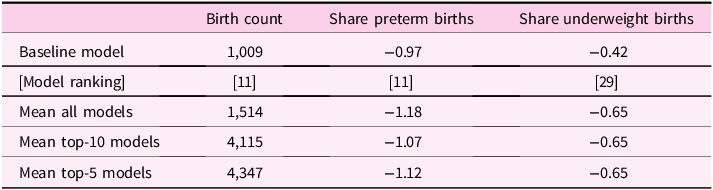
Notes: Authors’ calculations on aggregate birth certificates (Certificati di Assistenza al Parto, CAP) provided by the Tuscan Regional Health Agency. For the birth count, the table reports the estimates of the cumulative deviation from the trend in 2020–22. For the share of preterm and underweight births, it reports the estimates of the mean deviation (in percentage points) from the trend in 2020–22. The first row shows the estimate using our preferred model (linear pre-pandemic trend, starting in 2015) and the model ranking (in brackets). The second row shows the mean estimate of the 32 models (16 linear and 16 quadratic pre-pandemic trends, with starting year ranging from 2002 to 2017), the third row the mean estimate of the top-10 models in the ranking, and the last row the mean estimate of the top-5 models in the ranking. Rankings are computed as the average of three separate rankings based on the mean squared error, the mean absolute error, and the mean percent error of the outcome predictions from January to December 2019.

Figure A1. Birth count in Italy.
Notes: Authors’ calculations on Istat aggregate data. The number of births is seasonally adjusted. The solid blue line is the outcome-specific linear pre-pandemic trend estimated for the period between January 2015 and December 2019. The dashed blue lines are the upper and lower bound of a 95% confidence interval around the trend. The shaded gray areas correspond to the four major pandemic waves (February–May 2020, October–December 2020, March–May 2021, January–February 2022), moved forward by nine months.

Figure A2. Birth count by parents’ education – Only Italian parents.
Notes: Authors’ calculations on aggregate birth certificates (Certificati di Assistenza al Parto, CAP) provided by the Tuscan Regional Health Agency. All outcomes are seasonally adjusted. The solid blue line is the outcome-specific linear pre-pandemic trend estimated for the period between January 2015 and December 2019. The dashed blue lines are the upper and lower bound of a 95% confidence interval around the trend. The shaded gray areas correspond to the four major pandemic waves (February–May 2020, October–December 2020, March–May 2021, January–February 2022), moved forward by nine months. “HS” stands for high school.

Figure A3. Birth count by parents’ occupational status.
Notes: Authors’ calculations on aggregate birth certificates (Certificati di Assistenza al Parto, CAP) provided by the Tuscan Regional Health Agency. All outcomes are seasonally adjusted. The solid blue line is the outcome-specific linear pre-pandemic trend estimated for the period between January 2015 and December 2019. The dashed blue lines are the upper and lower bound of a 95% confidence interval around the trend. The shaded gray areas correspond to the four major pandemic waves (February–May 2020, October–December 2020, March–May 2021, January–February 2022), moved forward by nine months.

Figure A4. Birth count by parents’ education – Only employed parents.
Notes: Authors’ calculations on aggregate birth certificates (Certificati di Assistenza al Parto, CAP) provided by the Tuscan Regional Health Agency. All outcomes are seasonally adjusted. The solid blue line is the outcome-specific linear pre-pandemic trend estimated for the period between January 2015 and December 2019. The dashed blue lines are the upper and lower bound of a 95% confidence interval around the trend. The shaded gray areas correspond to the four major pandemic waves (February–May 2020, October–December 2020, March–May 2021, January–February 2022), moved forward by nine months. “HS” stands for high school.

Figure A5. Birth count by mother’s age.
Notes: Authors’ calculations on aggregate birth certificates (Certificati di Assistenza al Parto, CAP) provided by the Tuscan Regional Health Agency. All outcomes are seasonally adjusted. The solid blue line is the outcome-specific linear pre-pandemic trend estimated for the period between January 2015 and December 2019. The dashed blue lines are the upper and lower bound of a 95% confidence interval around the trend. The shaded gray areas correspond to the four major pandemic waves (February–May 2020, October–December 2020, March–May 2021, January–February 2022), moved forward by nine months.

Figure A6. Birth count by father’s age.
Notes: Authors’ calculations on aggregate birth certificates (Certificati di Assistenza al Parto, CAP) provided by the Tuscan Regional Health Agency. All outcomes are seasonally adjusted. The solid blue line is the outcome-specific linear pre-pandemic trend estimated for the period between January 2015 and December 2019. The dashed blue lines are the upper and lower bound of a 95% confidence interval around the trend. The shaded gray areas correspond to the four major pandemic waves (February–May 2020, October–December 2020, March–May 2021, January–February 2022), moved forward by nine months.

Figure A7. Share of births supported by assisted reproductive technologies.
Notes: Authors’ calculations on aggregate birth certificates (Certificati di Assistenza al Parto, CAP) provided by the Tuscan Regional Health Agency. All outcomes are seasonally adjusted. The solid blue line is the outcome-specific linear pre-pandemic trend estimated for the period between January 2015 and December 2019. The dashed blue lines are the upper and lower bound of a 95% confidence interval around the trend. The shaded gray areas correspond to the four major pandemic waves (February–May 2020, October–December 2020, March–May 2021, January–February 2022), moved forward by nine months.

Figure A8. Birth count by mother’s childbearing history.
Notes: Authors’ calculations on aggregate birth certificates (Certificati di Assistenza al Parto, CAP) provided by the Tuscan Regional Health Agency. All outcomes are seasonally adjusted. The solid blue line is the outcome-specific linear pre-pandemic trend estimated for the period between January 2015 and December 2019. The dashed blue lines are the upper and lower bound of a 95% confidence interval around the trend. The shaded gray areas correspond to the four major pandemic waves (February–May 2020, October–December 2020, March–May 2021, January–February 2022), moved forward by nine months.

Figure A9. Share of preterm births by mother’s characteristics.
Notes: Authors’ calculations on aggregate birth certificates (Certificati di Assistenza al Parto, CAP) provided by the Tuscan Regional Health Agency. All outcomes are seasonally adjusted. The solid blue line is the outcome-specific linear pre-pandemic trend estimated for the period between January 2015 and December 2019. The dashed blue lines are the upper and lower bound of a 95% confidence interval around the trend. The shaded gray areas correspond to the four major pandemic waves (February–May 2020, October–December 2020, March–May 2021, January–February 2022), moved forward by eight months (to take into account the shorter distance between conception and delivery for preterm births). “HS” stands for high school.

Figure A10. Share of underweight births by mother’s characteristics.
Notes: Authors’ calculations on aggregate birth certificates (Certificati di Assistenza al Parto, CAP) provided by the Tuscan Regional Health Agency. All outcomes are seasonally adjusted. The solid blue line is the outcome-specific linear pre-pandemic trend estimated for the period between January 2015 and December 2019. The dashed blue lines are the upper and lower bound of a 95% confidence interval around the trend. The shaded gray areas correspond to the four major pandemic waves (February–May 2020, October–December 2020, March–May 2021, January–February 2022), moved forward by nine months. “HS” stands for high school.


 Open access