


Mental illness, behavioural disorders and self-harm account for about 8.5% of all disability adjusted life-years (DALYs) worldwide. Reference DALYs, Collaborators, Murray, Barber, Foreman and Abbasoglu Ozgoren1 The World Mental Health Report outlines the seriousness of the issue, the gaps in knowledge and available resources to manage mental disorders. 2 The National Mental Health Survey estimated that about 10% of adult Indians suffer from depression, anxiety and substance use disorders in their lifetime, and 150 million need treatment. Reference Gururaj, Varghese, Benegal, Rao, Pathak and Singh3 The Global Burden of Disease Study estimated that in India close to 200 million people were affected by a mental disorder. 4
Natural remission in depression
Natural remission from depression is conceptualised as a below-threshold score on a standardised symptom severity measure or a rescinded diagnosis in untreated cases of depression. Reference Whiteford, Harris, McKeon, Baxter, Pennell and Barendregt5 The natural remission rate for major depression over 3, 6 and 12 months in primary care settings is 23%, 32% and 53%, respectively. Reference Whiteford, Harris, McKeon, Baxter, Pennell and Barendregt5 However, the above review included data only from high-income countries. Given the prevalence of depression and anxiety and their impact on the individual, community and health system globally, it is important to generate data from low- and middle-income countries (LMICs) too, to get more generalisable estimates. Given the large number of individuals affected globally with depression Reference Herrman, Patel, Kieling, Berk, Buchweitz and Cuijpers6 it is important to know rates for natural remission, especially from LMICs where the treatment gap is huge, there are few trained mental health professionals and no data on natural remission for common conditions like depression exists. Reference Baxter, Patton, Scott, Degenhardt and Whiteford7 Globally, understanding about the factors that affect natural remission are lacking. Policy makers and service providers can use such information to allocate the limited mental health resources more efficiently.
Different study designs can provide data about natural remission for depression and anxiety Reference Whiteford, Harris, McKeon, Baxter, Pennell and Barendregt5 : cohort studies of other health conditions where depression is identified but is not treated as part of the protocol; prospective cohort studies where depression and treatment outcomes are tracked prospectively over time; and randomised controlled trials with a waitlisted control arm (or a control arm where no intervention is provided) that receives treatment after a waiting period, thus allowing natural remission to occur. However, no design can ethically prevent individuals seeking care outside the protocol.
SMART Mental Health
The Systematic Medical Appraisal, Referral and Treatment (SMART) Mental Health Project is a cluster randomised controlled trial in which primary health centres (PHCs) receive a multifaceted digital health intervention to reduce depression among individuals at high risk of these conditions. PHCs under the control arm receive usual care. Eligible adults in the communities were initially screened to identify those at risk of depression and suicide. This took time to get the desired sample size and COVID-19 also led to stoppages. The initial screen-positive individuals were re-screened before randomisation to identify the final high-risk cohort to be included in the trial. This created a quasi-prospective cohort with two assessment points and provided an opportunity to understand variation in remission rates across PHCs, over time.
This paper reports the natural remission rates observed in our study across two rural communities in north and south India, and identifies individual-, village- and PHC-level determinants for remission.
Method
The SMART Mental Health Project was conducted across two states in India (Andhra Pradesh and Haryana). It includes 44 clusters (each cluster being one PHC and two to five villages serviced by that PHC) in West Godavari district (Andhra Pradesh) and Palwal and Faridabad districts (Haryana). Reference Daniel, Maulik, Kallakuri, Kaur, Devarapalli and Mukherjee8 Initial geographic mapping helped locate the PHCs (located within 60 km radius of our field offices in each district, and catering to rural populations). Since the study cohort was part of a larger trial, while selecting the villages it was ensured that the villages belonging to different PHC clusters were sufficiently separated from each other geographically so that chance of subsequent contamination was minimal. Administrative maps and local field staff with a good knowledge about the area helped us to select the villages and used their knowledge about common meeting places in the community where people could interact, such as health facilities and local markets, as some parameters to judge chances of contamination. This was followed by our research staff physically visiting each of the PHCs. During the visits to the PHCs the research staff apprised the PHC doctors and accredited social health activists (ASHAs) of the study, and informed them that permission had already been sought from the state and district health departments, which helped in getting their unanimous support. Among identified villages, the specific villages serviced by each PHC to be included in the study were randomly selected, to get a total population of about 6300 per cluster. After an initial population census (which was done by our field staff), a list of all adults (≥18 years) in the selected villages was identified. This list was shared with the ASHAs. ASHAs are lay village health workers and were trained by the research team to screen for depression and increased suicide risk using the Patient Health Questionnaire-9 Item (PHQ9) and Generalised Anxiety Disorder-7 Item (GAD7) questionnaire. ASHAs visited each household and interviewed every eligible adult in each household who consented to the screening. Screening in Andhra Pradesh started on 9 December 2019 and ended on 13 September 2020, while in Haryana screening commenced on 15 July 2019 and concluded on 13 January 2020. A study among women in primary care using the PHQ-9 to screen for depression reported a positive predictive value of 73.4% (95% CI, 62.4–84.4%) and negative predictive value of 93.9% (95% CI, 90.2–97.6%) at a cut-off value of ≥9 scored by health workers. Reference Indu, Anilkumar, Vijayakumar, Kumar, Sarma and Remadevi9 A meta-analysis to examine the accuracy of the PHQ-9 for screening depression was reported assuming prevalence values of 5–25% at a cut-off score of ≥10, in which positive predictive values ranged from 22% to 69% and negative predictive values ranged from 88% to 99%. Reference Negeri, Levis, Sun, He, Krishnan and Wu10 Both these tools are validated in India and have been used by us in our earlier research. Reference Maulik, Devarapalli, Kallakuri, Bhattacharya, Peiris and Patel11 People scoring ≥10 on either the PHQ9 or GAD7 questionnaire and/or scoring ≥2 on the self-harm-related question in the PHQ9 were considered as ‘screen positive’ for depression or increased suicide as per study criteria. Since anxiety and depression often occur as comorbid conditions and are difficult to consider separately, we included both conditions in our assessment of those at high risk of depression. Screening took place for between 6 and 9 months and was delayed by the first wave of COVID-19 that affected India during March–June 2020. Subsequently, all ‘screened positive’ individuals were re-screened using the same tools to identify the final cohort of high-risk individuals to be included in the trial. Re-screening in Andhra Pradesh commenced on 7 September 2020 and concluded on 5 October 2020, and in Haryana re-screening started on 18 February 2020 and ended on 13 March 2020. The study is approved by the George Institute for Global Health, New Delhi, India (Ref. no. 009/2018) and the All India Institute of Medical Sciences, New Delhi, India (Ref. no. IEC-315/01.06.2018) institutional ethics committees, which covers both the Andhra Pradesh and Haryana sites. The study received approval from the Health Ministry’s Screening Committee (HMSC), the Indian Council of Medical Research (ICMR) and the Ministry of Health, Andhra Pradesh and Haryana state governments. Written informed consent was obtained from all study participants by ASHAs before screening and re-screening, and a participant information sheet (PIS) was explained and provided to study participants. In addition, data on background characteristics of participants were collected as part of the study; data on village socioeconomic and demographic status were collated from administrative sources 12,13 ; and data on PHC-level factors, such as availability of healthcare resources and types of healthcare services (including mental health services), were collected from each PHC. 14
Remission was defined as a composite score where the PHQ9 and GAD7 scores were both <5 and the self-harm-related score was <2. Reference Daniel, Maulik, Kallakuri, Kaur, Devarapalli and Mukherjee8 For both the PHQ9 and GAD7 questionnaire, scores below 5 are considered clinically as not being depressed or anxious, respectively. 15–17
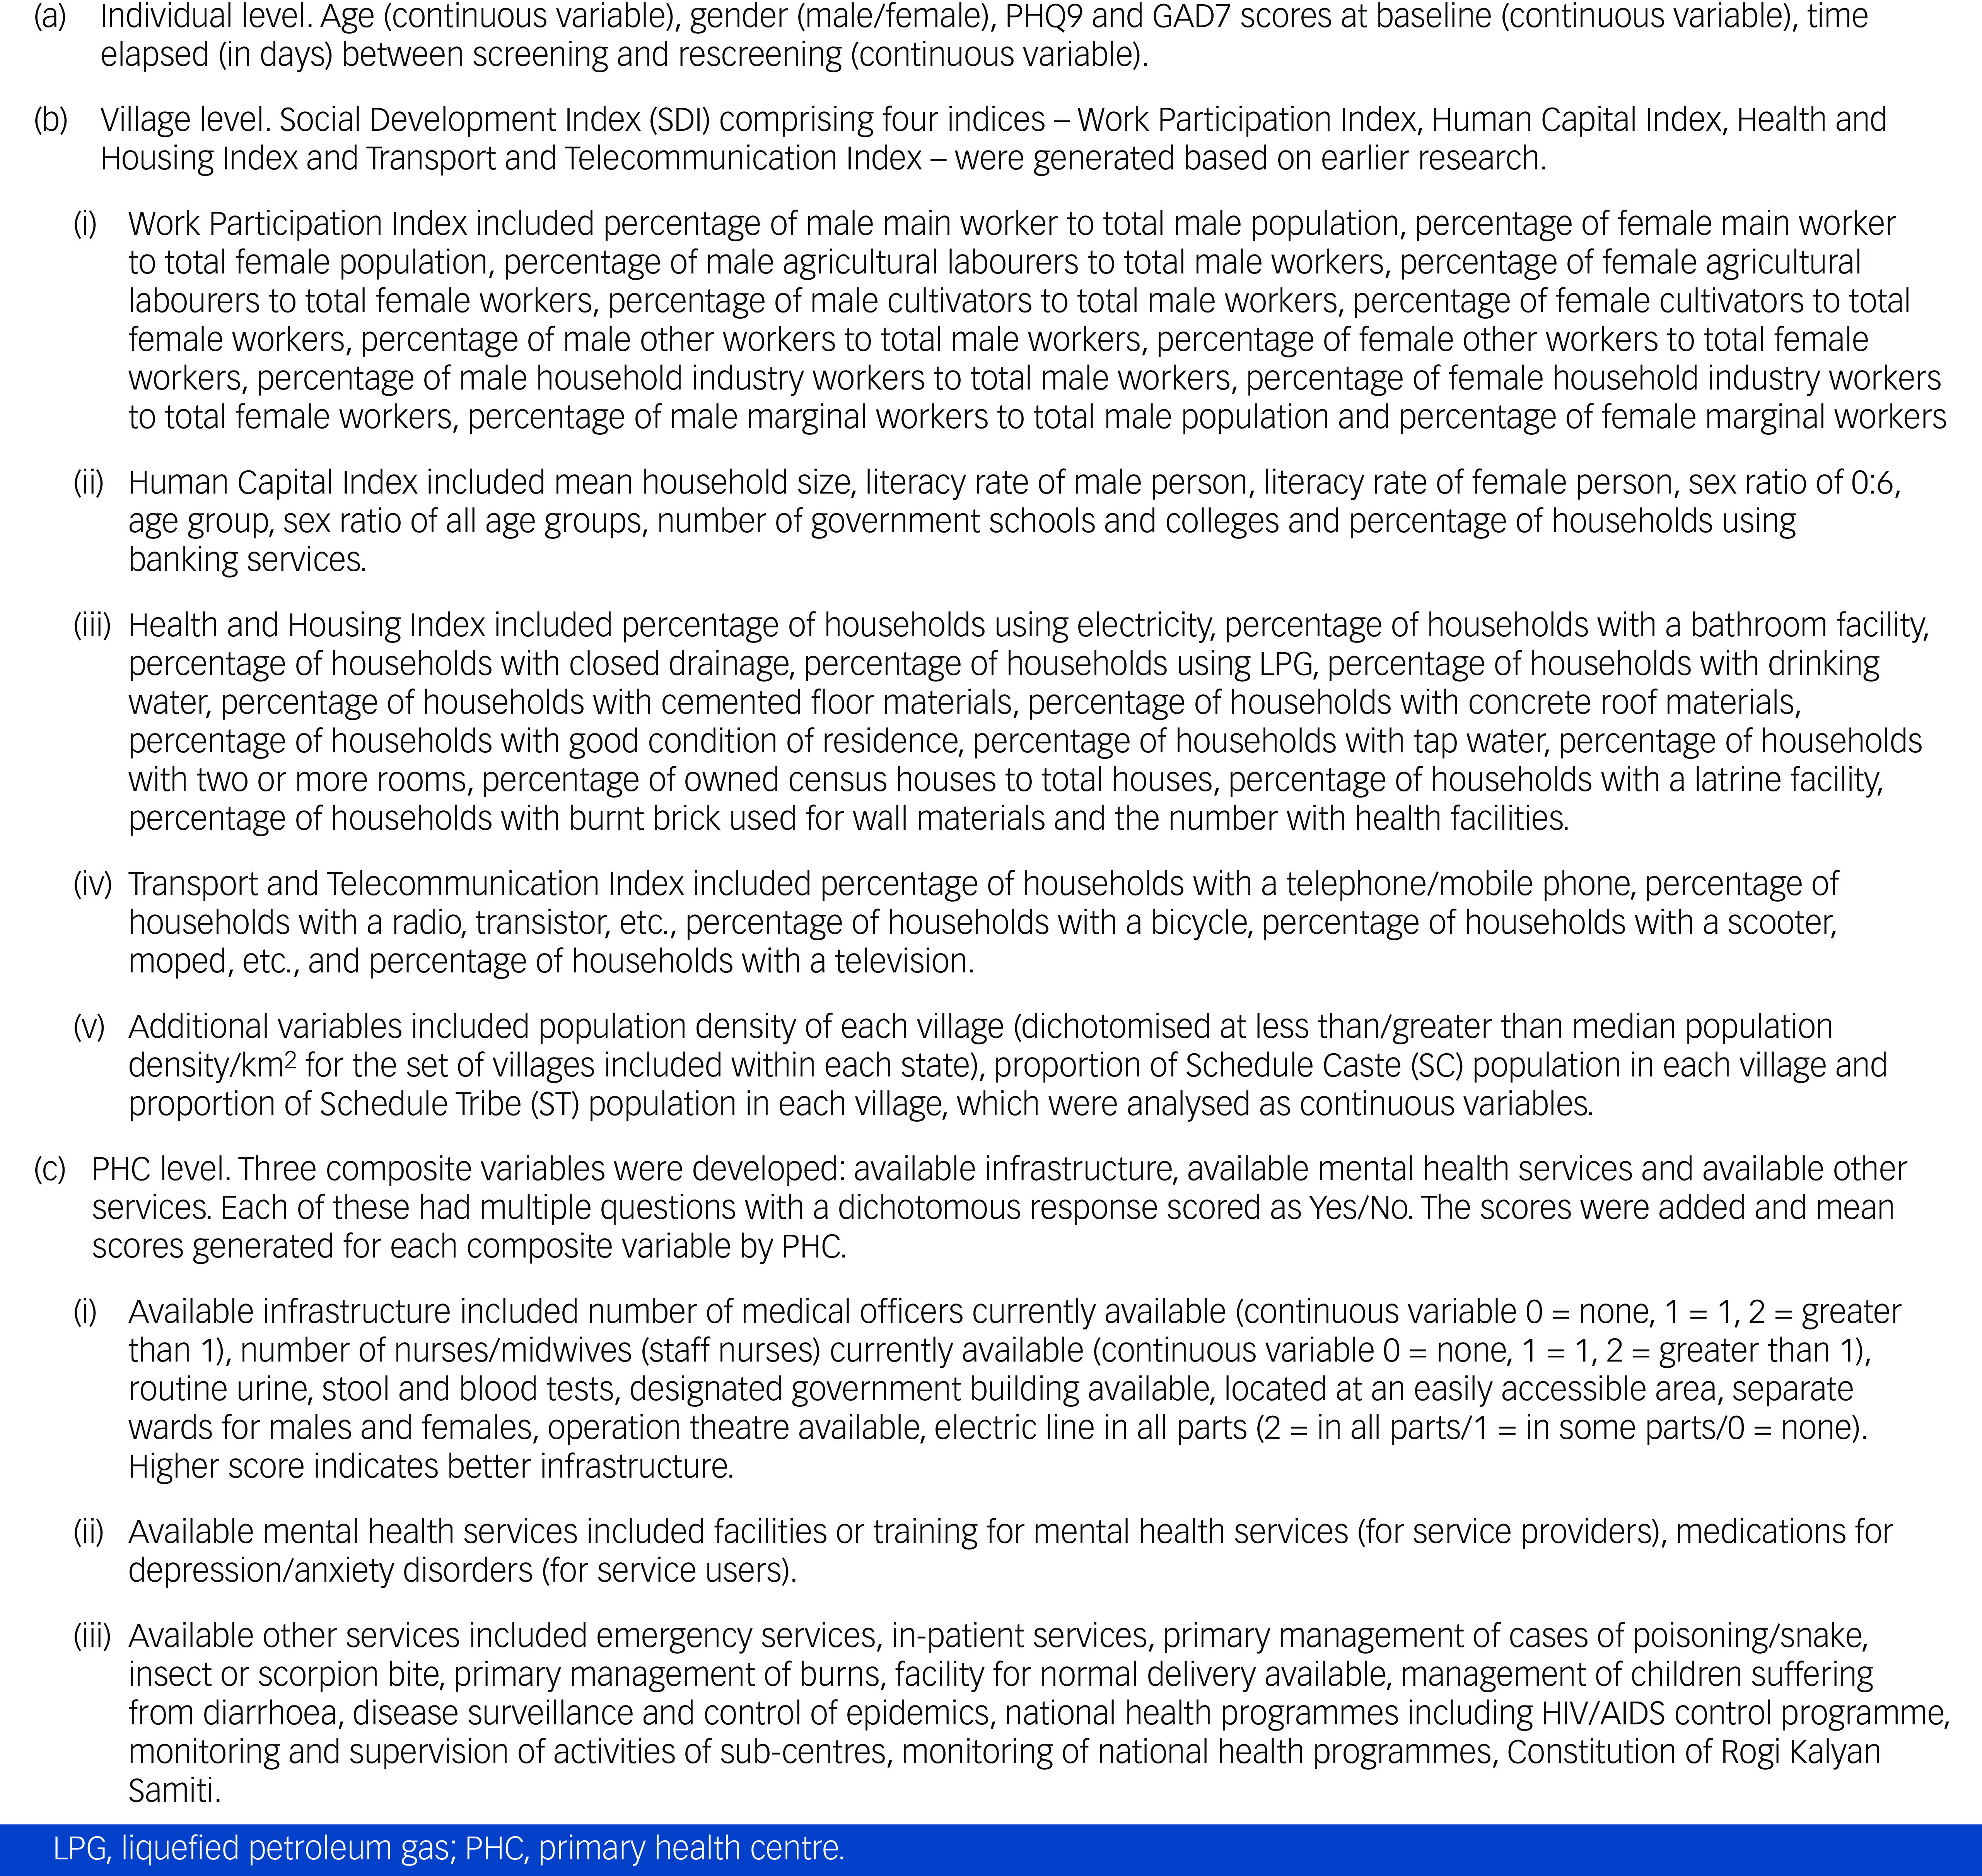
The key covariates are outlined under Box 1. They were as follows.
-
(a) Individual level: age, gender, PHQ9 and GAD7 scores at baseline.
-
(b) Village level: social development index (SDI) comprising four indices – the Work Participation Index, Human Capital Index, Health and Housing Index and Transport and Telecommunication Index – was generated based on earlier research. Reference Ghosh18
-
(c) PHC level: three composite variables were developed – available infrastructure, available mental health services and available other services.
Box 1 Description of variables
Statistical analysis
For the PHC-level composite variables – available infrastructure (eight questions), available mental health services (two questions) and available other services (11 questions) – mean scores were derived by summing up responses of these indicator (yes/no), respectively, and then dividing these by the number of questions. Descriptive analyses were performed for all variables using mean, median, standard deviation, quartiles and range for continuous variables and counts and frequencies for categorical variables.
Multilevel Poisson regression models were fit separately for Andhra Pradesh and Haryana with the binary remission variable (yes/no) as the outcome. The time between screening and re-screening was used to defined exposure, using log(exposure) as an offset in the Poisson regression. First, univariable regressions were fit to examine associations between proposed factors and remission. Second, multivariable regressions were fit to test the independent effect of each factor after adjusting for other factors. In the multivariable model, some variables were dropped because of model convergence issues. The models included as fixed effects the following: (a) individual-level variables – gender (male/female), age in years, anxiety and depression scores at screening; (b) village-level variables – population density, percentage of population belonging to a Scheduled Caste, percentage of population belonging to a Scheduled Tribe (only for Andhra Pradesh), village-level social development indices; and (c) PHC-level variables, which included availability of mental health services, availability of other services and PHC infrastructure. The variables age, anxiety and depression scores at screening, population density of village, percentage of Scheduled Caste and Scheduled Tribe (who are specific marginalised population groups identified by the Constitution of India), village-level indices, PHC infrastructure score and availability of services were entered as continuous variables and a linear relationship with outcome was assumed. All multilevel models included village- and PHC-level random effects. Incidence rate ratios indicated measures of association between remission and the studied factors and were presented along with 95% confidence intervals. As a measure of heterogeneity, the median rate ratio (MRR) was calculated. Reference Austin, Stryhn, Leckie and Merlo19 The magnitude of between-PHC and between-village variation in remission rates can be assessed by comparing the PHC-level and village-level MRRs with the incidence rate ratios for the individual-, village- and PHC-level characteristics.
Results
Initial screening involved 100 013 people in Andhra Pradesh and 69 807 people in Haryana. In Andhra Pradesh, 117 567 people were approached for screening and 17 554 (14.9%) screenings were not completed. In Haryana, 77 000 were approached and 7193 (9.3%) screenings were not completed. The reasons for attrition were death, chronic physical and mental illness, seasonal migration, relocated residence and refusal. In Andhra Pradesh and Haryana, 2426 (2.4%) and 4949 (7.1%) screened positive, respectively. At re-screening some individuals were lost to follow-up for multiple reasons (Fig. 1). In Andhra Pradesh the number lost was 207 (females 60.4%, mean age 49.5 years (s.d. = 15.3)), and in Haryana it was 541 (females 59.1%, mean age 42.1 years (s.d. = 18.5)). Eventually, 2219 (91.5%) individuals in Andhra Pradesh and 4408 (89.1%) in Haryana were re-screened and 863 (38.9 %) and 2537 (53.5%), in Andhra Pradesh and Haryana, respectively, were ‘re-screen positive’. At re-screening, the remission rate in Andhra Pradesh was 82.3% (95% CI 77.5–87.4%) and that in Haryana was 59.4% (95% CI 55.7–63.3%). Fig. 2 shows the remission rates per 100 person-years across the PHCs in the two states.
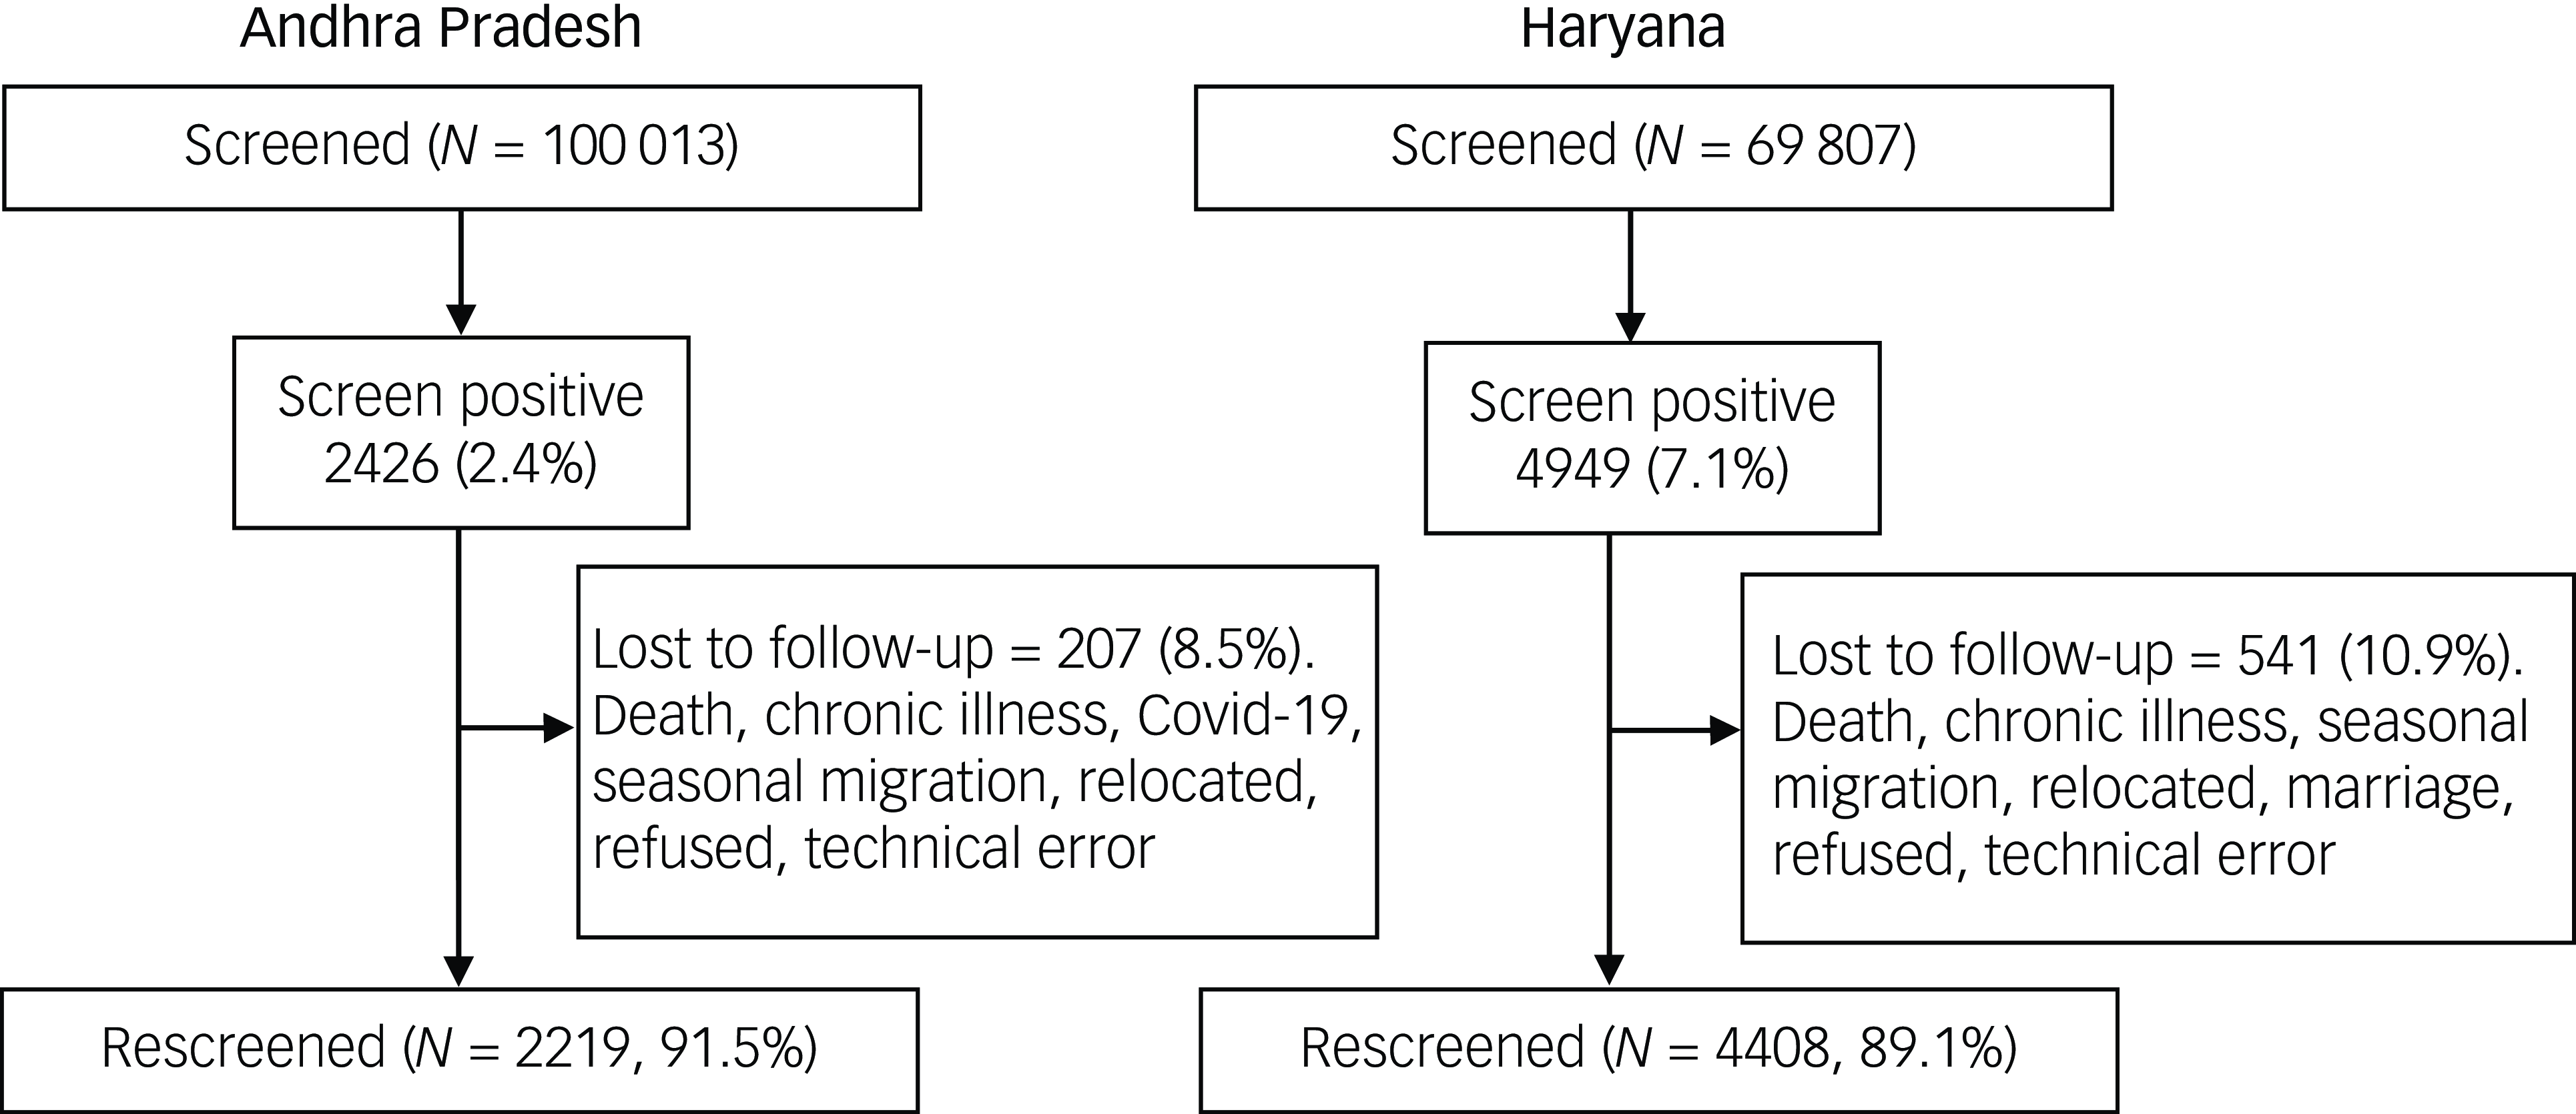
Fig. 1 Screening and re-screening samples in Andhra Pradesh and Haryana.
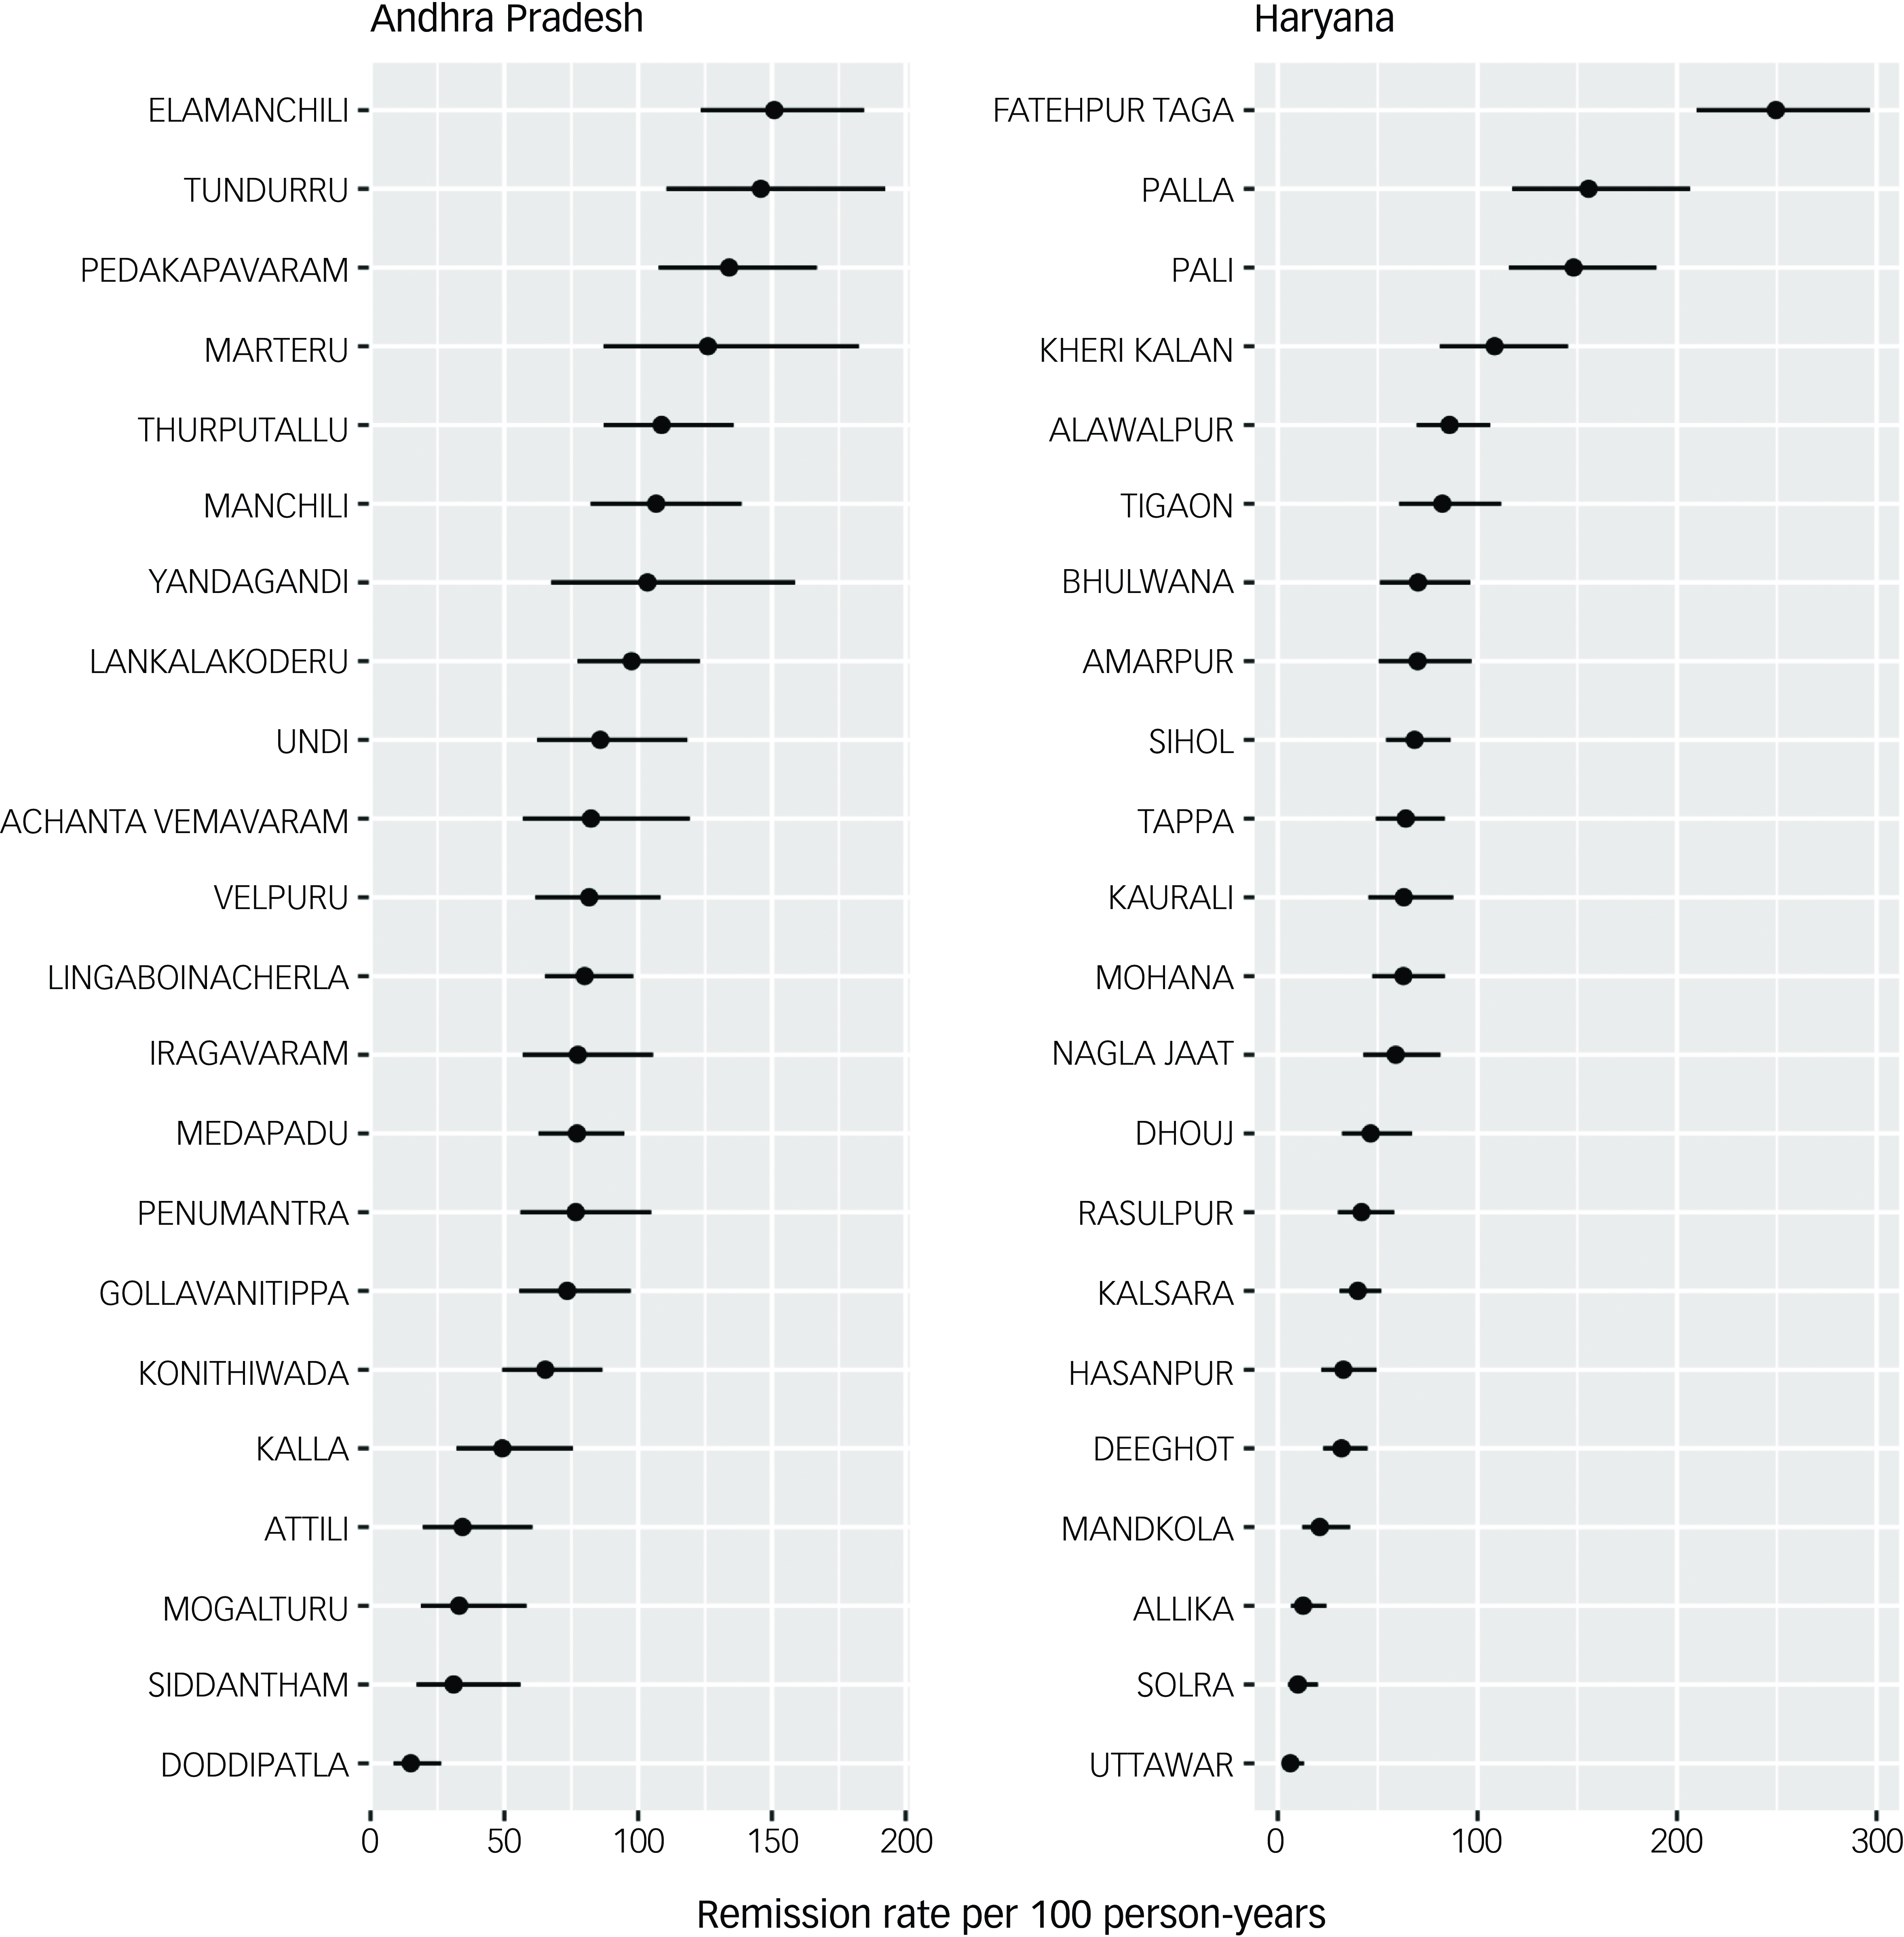
Fig. 2 Remission rates in primary health centres in Andhra Pradesh and Haryana.
All subsequent analyses were limited to the population who were available for both screening and re-screening. Table 1 provides descriptive statistics of individual-, village- and PHC-level data. Among individual characteristics, women were about two-thirds of the population in both states. Of the high-risk individuals, in Andhra Pradesh and Haryana, 35.1% and 24.5% had scores of ≥2 on the self-harm/suicide question, respectively. The median time between screening and re-screening in Andhra Pradesh was 203 days and in Haryana it was 131 days. Among village-level variables, Haryana had a higher population density than Andhra Pradesh. Haryana does not have any officially identified Scheduled Tribe populations. The median scores were slightly higher in Andhra Pradesh for the Health and Housing Index and Work and Participation Index compared to Haryana. Among PHC-level variables, compared to Andhra Pradesh, PHCs in Haryana had slightly higher mean scores on mental health services, but lower mean scores on PHC infrastructures and availability of other primary healthcare services. Of those who were re-screen positive, only 75/863 (8.7%) in Andhra Pradesh and 41/2537 (1.6%) in Haryana had sought treatment for their mental health problem in the period between screening and re-screening.
Table 1 Baseline characteristics of study participants
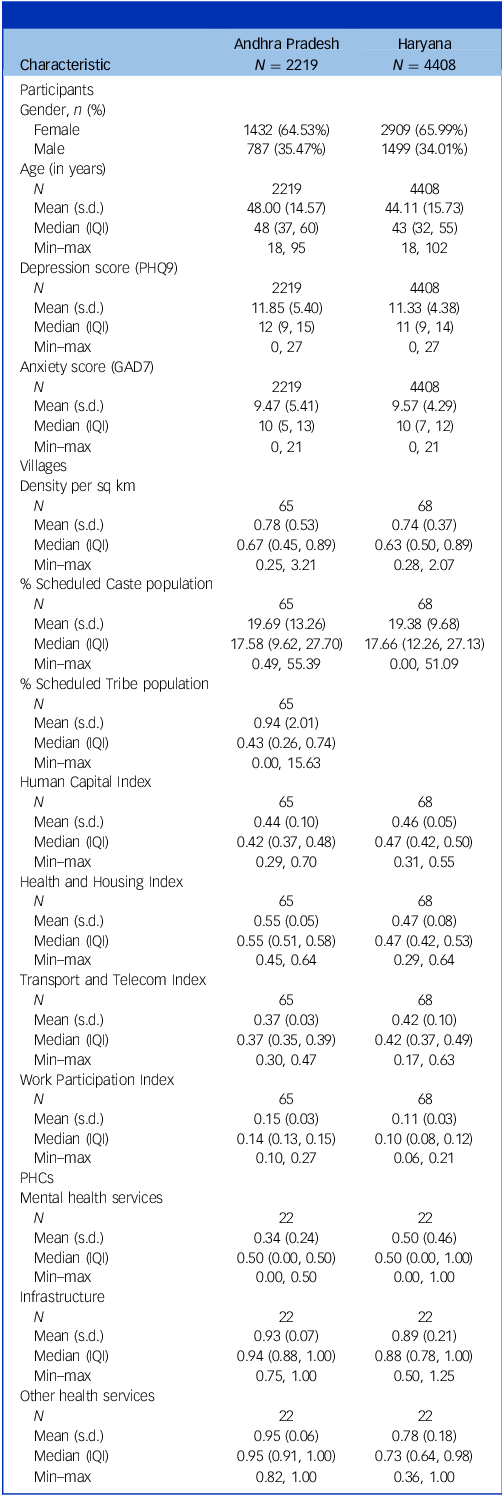
PHQ9, Patient Health Questionnaire-9 Item; GAD7, Generalised Anxiety Disorder-7 Item; PHCs, primary health centres; IQI, interquartile interval (difference between third and first quartile).
Table 2 presents results from univariable Poisson regression models. Three individual-level factors in Andhra Pradesh – being female, higher mean scores for depression (on the PHQ9) and higher mean scores for anxiety (on the GAD7 questionnaire) – were found to be associated with lower remission rates. For Haryana, in addition to the above three factors, increasing age was also associated with reduced remission rate. Among village-level factors, increasing proportion of Scheduled Tribe population was associated with greater remission in Andhra Pradesh, and increasing Health and Housing Index score was associated with increased remission rates in Haryana. None of the PHC-level factors were significant in either state.
Table 2 Incidence rate ratios (IRRs) from multilevel Poisson regression models – univariable analyses
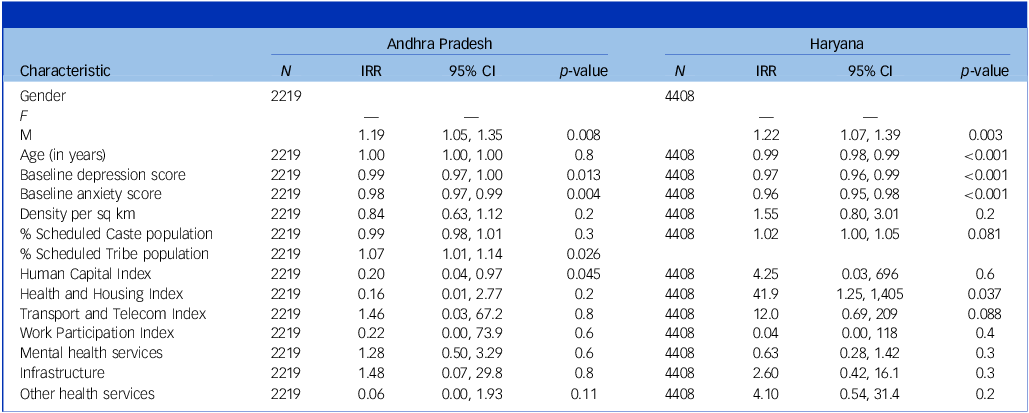
IRR, incidence rate ratio.
Table 3 presents results from multivariable Poisson regression models. Because of convergence issues, the village-level indices were combined into a common development index by summing over the different indicators of development, and it was used as a covariate in the regression. Of the three PHC-level factors, only availability of mental health services could be used. The PHC-level variables – infrastructure and availability of services other than mental health – were dropped as we faced convergence issues upon including them. Also, in the univariable analyses, these were not found to be associated with remission rate. The individual factors that were found to be significantly associated with remission rate continued to be significant in the multivariable regression. None of the considered village- and PHC-level factors were found to be associated with remission rate.
Table 3 Multilevel Poisson regression – multivariable analysis
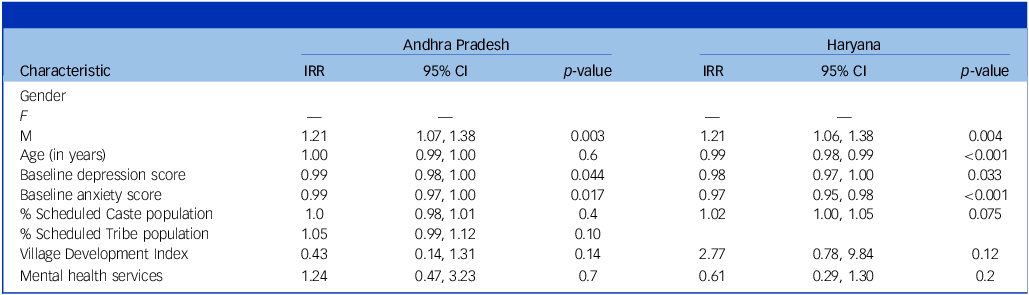
IRR, incidence rate ratio.
The MRRs presented in Supplementary Table 1 suggest that there exist substantial contextual effect and heterogeneity in remission rates across PHCs and villages. The MRRs from the full model were higher in magnitude, varying between 1.27 and 1.98, than the incidence rate ratios for the individual-level factors that were found to be significantly associated with remission rate, suggesting that substantial heterogeneity remained even after adjusting for several factors.
Discussion
This study of over 100 000 people screened for depression and anxiety in two Indian states found a large variation in remission rates for people identified at high risk of common mental disorders (CMDs). Remission rates and inter-PHC variation was greater in Andhra Pradesh than in Haryana. Although follow-up time to re-screening varied greatly, this was not associated with a variation in remission rates in either state. Andhra Pradesh and Haryana are not only in two distinct geographical locations, but also they have different cultures, languages and health systems. Several individual- and village-level factors, but not PHC-levels factors, were associated with remission rates. Globally, this study is unique because of the systematic approach taken to assess remission rates using a large sample size from two geographically distinct regions. The findings suggest that caution should be exercised when attempting to quantify global estimates of remission rates as they may fail to capture substantial regional and individual variation. Given the exploratory nature of this study we recommend further study of these associations be explored in more detail using appropriate study designs.
When compared with Haryana, Andhra Pradesh had higher median scores for the Health and Housing Index and Work and Participation Index but lower scores for the Human Capital Index and Transport and Telecommunication Index. Given the number of individual variables in each composite index and the marginal differences in median scores when comparing each site-specific score, it is difficult to comment on the implications of these differences. Overall, West Godavari in Andhra Pradesh is more affluent than Faridabad and Palwal districts in Haryana. Being a predominantly fertile area with both farming and pisciculture in abundance, villagers in West Godavari tend to have greater employment opportunities. However, the districts in Haryana included in this study were closer to larger towns and cities, including the national capital of New Delhi, hence, transportation and telecommunication infrastructure are markedly better than in West Godavari.
Multilevel analyses were conducted for each state with random effects accounting for differences in remission rates between villages and PHCs. MRRs from the full model measuring heterogeneity in remission rates after adjusting for individual characteristics, proportion of marginalised population in village, village-level development and mental health services availability in the PHC suggest that variation exists in remission rates. In terms of mental health services in the two regions, PHCs in Andhra Pradesh had higher scores in infrastructure and availability of general services but had lower scores on available mental health services compared with Haryana. Mental health care is integrated with primary care to varying degrees in the two states – the District Mental Health Programme (DMHP) has been recently implemented in Andhra Pradesh, but in Haryana the programme has not been substantively implemented to date. Conversely, antidepressant medication was present in a greater proportion of PHCs surveyed by us in Haryana compared with those in Andhra Pradesh. This complex mix of service availability and mental health programme support may partially explain why there were no clear PHC-level associations observed in this study. However, it could simply be the case that remission occurs somewhat independently of PHC service provision. Again, further research is warranted to understand the association, if any, between service provision and remission rates in more detail.
At the village level, a positive association was noted with Scheduled Tribe communities in the univariable regression. However, it was no longer significant when other variables were adjusted for. Being a more closed community based on similar cultural identities, there may be stronger social support systems that may explain the higher remission rates. However, this was only applicable in Andhra Pradesh, as Haryana has no designated Scheduled Tribe communities. There is limited research on mental health of Scheduled Tribe communities in India, and to the best of our knowledge, no data are available that explore social capital within Scheduled Tribe communities and how that affects mental health. Reference Devarapalli, Kallakuri, Salam and Maulik20 Future research needs to explore these associations. A positive association with the Health and Housing Index was also noted in Haryana in the univariable regression. In the multivariable regression, a positive association between the village-level development index and remission rate was found in Haryana but it was not significant.
At the individual level in Andhra Pradesh, being female and having higher mean scores for depression and anxiety were associated with lower remission rates. In Haryana, being female, having higher mean scores for depression and anxiety and older age were associated with lower remission rates. A recent systematic review observed that there were no data that provided sociodemographic or other correlated factors associated with natural remission. Reference Mekonen, Ford, Chan, Hides, Connor and Leung21 It found that over a 12-week period, natural remission for depression was observed for 12.5% of the pooled sample. However, others have found it to be 23% over the same period. Reference Whiteford, Harris, McKeon, Baxter, Pennell and Barendregt5 Whiteford et al Reference Whiteford, Harris, McKeon, Baxter, Pennell and Barendregt5 reported lower remission for older adults compared with younger adults, similar to the overall trend in Haryana in this study. This could be explained by the presence of comorbid psychiatric and medical conditions that reduce remission in old age. Reference Azar, Chopra, Cho, Coakley and Rudolph22 Current treatments for depression often focus on emotional symptoms and not the physical and anxiety symptoms. However, the physical and anxiety symptoms of depression can be more pronounced than the emotional symptoms of depression among women. Reference Burt23 Anxiety and physical symptoms of depression tend to be worse in women Reference Burt23 and could explain the lower remission among females. Lower remission among those with more severe depression, in this study, has also been reported earlier. Reference Whiteford, Harris, McKeon, Baxter, Pennell and Barendregt5 This is understandable, as individuals with more severe depression are more likely to have additional stressors and may have fewer coping strategies. Better living conditions have been reported by other researchers to be associated with higher remission rates. Reference Hoare, Jacka and Berk24 Women suffer more from depression than men and some biological and psychosocial risk factors have been suggested for such differences between genders, which may also affect remission rates. Reference Piccinelli and Wilkinson25 The PRIME MD-1000 study Reference Williams, Spitzer and Linzer26 also reported that women compared to men tend to report poorer satisfaction with their health related to depression, and this may also be a reason for longer duration of self-reported depression among women.
Baxter et al Reference Baxter, Patton, Scott, Degenhardt and Whiteford7 reviewed more than 77 000 data sources and found that remission data on any mental disorder is limited. Whatever exists is from high-income countries, mainly from North America and Western Europe. The reviewers identified only one good-quality study from India focused on obsessive–compulsive disorder among adolescents. Reference Reddy, Srinath, Prakash, Girimaji, Sheshadri and Khanna27 The review identified a lack of consistent definitions and standardised measures of mental disorders, lack of national surveys using appropriate sampling strategies that support generalisation and absence of high-quality longitudinal data, especially from LMICs, as key reasons for limited knowledge globally on this topic.
A strength of our study was the use of uniform definitions of depression and remission using standardised tools and a systematic approach to data collection. Screening and re-screening across both sites were done by ASHAs and, in most cases, an individual was assessed by the same ASHA. We used standard operating procedures while training ASHAs across both sites and ensured that they achieved high competency scores post-training. Study limitations include the following: first, the screening and re-screening process was affected by the COVID-19 pandemic, which itself had large health and socioeconomic effects and this could have influenced mental health outcomes. Reference Kola, Kohrt, Hanlon, Naslund, Sikander and Balaji28 However, the overall remission rate was similar to the 3- and 6-month remission rates we have reported in previous pre-pandemic research with similar follow-up time periods. Reference Whiteford, Harris, McKeon, Baxter, Pennell and Barendregt5 Second, we lack comprehensive data on mental health service use by those who went into remission, although we expect that only a minority of re-screened individuals would have sought care given the lack of services available in both regions. Third, the administrative data used for developing the village-level composite indices were from 2011 census data, and this could influence the inferences. Fourth, individual-level socioeconomic variables, such as Scheduled Caste/Scheduled Tribe, poverty, debt, unemployment or financial shocks/strain, family conflict, alcohol use, COVID-19 infection and other health conditions, were not collected or included in the analysis, and this could lead to residual confounding. Finally, the PHQ9 and GAD7 questionnaire are screening tools and other questionnaires can be used for diagnosis. However, we used the PHQ9 and GAD7 questionnaire here as they were linked to the electronic decision support system used in the larger trial, Reference Daniel, Maulik, Kallakuri, Kaur, Devarapalli and Mukherjee8 and primary care doctors were trained to use the mhGAP, 29 which is based on ICD-10 criteria, 30 to clinically diagnose patients.
This large study provides detailed data from a large sample in two Indian regions and highlights the highly variable nature of remission and its potential influence by a multitude of factors that vary across regions, villages and individuals. Research needs to be directed towards understanding these associations in more detail. It also has implications for intervention research and highlights the importance of re-screening individuals to better quantify remission rates before commencement of an intervention. Policy makers should be aware of the implications of village- and PHC-level indicators on individuals’ health and incorporate appropriate health monitoring systems to capture mental health outcomes routinely to generate more robust population estimates. Such data can then facilitate a more comprehensive health system response to provide care for people with depression and anxiety.
Supplementary material
The supplementary material can be found at https://doi.org/10.1192/bjp.2025.68
Data availability
Any data required to support the study findings can be supplied on request. Data collected for the study, including individual participant data that underlie the results reported in this article, after de-identification (text, tables, figures and appendices) are available from the corresponding author, P.K.M., on reasonable request.
Acknowledgements
Dr Lokender Prashad provided support in developing the village-level indices. Amritendu Bhattacharya helped with an earlier version of the data analysis.
Author contributions
The study was conceptualised by P.K.M. and D.P. in discussion with all authors. P.K.M., D.P., L.B. and A.P. designed the study. M.D. and P.K.M. did the literature review. P.K.M., M.D., S.D., S.K. and A.K. implemented the study and were involved in study administration and data collection. Data analysis and data interpretation were done by A.G. and L.B. The data reported was verified by P.K.M. and D.P. P.K.M. wrote the original draft, which was reviewed and edited by D.P., A.G., L.B. and M.D. All authors, including R.S., G.T., S.S. and A.P., commented on a pre-final version of the manuscript and approved the final manuscript.
Funding
This research is supported by an Australian National Health and Medical Research Council (NHMRC) Global Alliances for Chronic Disease Grant (APP1143911). There was no role of the funding body in the design of the study or the conceptualisation and writing of the manuscript.
Declaration of interest
P.K.M. is partially supported through a NHMRC/Global Alliance for Chronic Diseases (GACD) grant (SMART Mental Health-APP1143911) and UK Research and Innovation (UKRI)/Medical Research Council (MRC) grant MR/S023224/1 – Adolescents’ Resilience and Treatment nEeds for Mental health in Indian Slums (ARTEMIS). M.D., S.D., S.K., A.K., L.B. are partially or wholly supported through the SMART Mental Health NHMRC/GACD grant. A.K. is partially supported by an Indigo Partnership (MR/R023697/1) award. A.G. is partially or wholly supported through ‘Identifying multimorbidity patterns in Indian adults using population-based surveys, hospital records, and patient cohorts’, funded by a Wellcome Trust/Department of Biotechnology Intermediate Fellowship (2023–2027); and ‘Digoxin in patients with rheumatic heart disease – a randomised placebo-controlled trial’, funded by the ICMR (2020–2024). G.T. is supported by the National Institute for Health and Care Research (NIHR) Applied Research Collaboration South London (NIHR ARC South London) at King’s College Hospital National Health Service (NHS) Foundation Trust. The views expressed are those of the author(s) and not necessarily those of the NIHR or the Department of Health and Social Care. G.T. is also supported by UK Research and Innovation (UKRI) in relation to the Emilia (MR/S001255/1) and Indigo Partnership (MR/R023697/1) awards. A.P. is supported by a NHMRC/GACD grant (SMART Mental Health – APP1143911) and an Australian NHMRC Investigator Grant (APP2016801). R.S., S.S. and D.P. have no funding to declare. The George Institute has a part-owned social enterprise, George Health Enterprises, which has commercial relationships involving digital health innovations.


 Open access
eLetters
No eLetters have been published for this article.