


Management Implications
Management programs for aquatic invasive plants can benefit from an in-depth understanding of the risk of invader spread from initial infestations, their impacts on native species, and seasonal patterns in growth and reproduction of the target species. If the species is represented by multiple distinct genotypes, then it may be necessary to tailor control strategies to each, particularly if phenology or susceptibility to management differs among them. We conducted an outdoor mesocosm experiment over 3 yr, monitoring growth, spread, and reproduction of four genotypes (two cytotypes: diploid, triploid) of the wetland and aquatic invasive plant Butomus umbellatus (flowering rush). We also applied imazamox or triclopyr to a portion of plants in year 2 (plants received one application, then were harvested the same year), and a further subset of those in year 3 (plants received herbicide treatment once annually for 2 yr before final harvest) to investigate whether genotypes differed in management susceptibility. Phenology was similar among genotypes. For all genotypes, flowering occurred by late May and continued through October during the first year but was reduced in years 2 and 3. Triploid genotype GT1 allocated greater biomass to rhizomes but did not produce axillary buds (i.e., bulbils), whereas diploid plants produced up to 15,000 bulbils over the course of the study. As has been suggested previously, management should target vegetative reproductive structures in all genotypes. Peak leaf abundance occurs for all genotypes by July to August, thus chemical control activities should occur at this time, when leaf surface area is high and development of vegetative reproduction structures minimal.
Introduction
Invasive species are harmful to natural and man-made habitats, at an estimated annual global economic impact of more than US$400 billion (IPBES 2023). Although invasive species spending is largely focused on improving food security and agriculture, freshwater habitats are especially at risk from the impacts of invasive species that include increased turbidity and organic input, elevated nutrient levels, and reduced abundance and diversity of other aquatic species (Gallardo et al. Reference Gallardo, Clavero, Sánchez and Vilà2016). Invasive plants are well known for their impacts in aquatic systems, which include high water use in arid environments, impeding water access, altering habitat quality and outcompeting other species, and reducing recreational and commercial uses (Macêdo et al. Reference Macêdo, Haubrock, Klippel, Fernandez, Leroy, Angulo, Carneiro, Musseau, Rocha and Cuthbert2024; Stiers et al. Reference Stiers, Crohain, Josens and Triest2011; Wainger et al. Reference Wainger, Harms, Magen, Liang, Nesslage, McMurray and Cofrancesco2018).
Management of aquatic invasive plants can include cultural methods, mechanical harvesting or cutting, herbicide application, or the introduction of biological control agents (Hussner et al. Reference Hussner, Stiers, Verhofstad, Bakker, Grutters, Haury, van Valkenburg, Brundu, Newman, Clayton, Anderson and Hofstra2017), but has historically not focused on the role of genetic variation in invasive populations for its influence on management efficacy (but see Thum Reference Thum2018). There is now an increasing understanding that, for many introduced species, invasive populations may result from multiple introductions from different source areas or post-introduction evolution, which generates distinct genetic variants, or genotypes. The presence of such variation may lead to meaningful differences in the risk of establishment, types and magnitude of economic and ecological impacts, and the suite of control tools that are able to successfully manage genotypes (Boughton and Pemberton Reference Boughton and Pemberton2011; Harms Reference Harms2020; Harms et al. Reference Harms, Williams and Grodowitz2014; Thum et al. Reference Thum, Heilman, Hausler, Huberty, Tyning, Wcisel, Zuellig, Berger, Glomski and Netherland2012; Ward et al. Reference Ward, Gaskin and Wilson2008). For example, genetic identity of hydrilla (Hydrilla verticillata L. f. Royle) populations dictate which control methods should be used and how (Harms et al. Reference Harms, Williams and Purcell2021b). Genetic variation in Myriophyllum spp. has similarly led to differences in susceptibility to herbicides in some populations, both due to natural variation within invasive populations and/or hybridization between native and invasive populations and between invasive genotypes (Larue et al. Reference Larue, Zuellig, Netherland, Heilman and Thum2013; Thum Reference Thum2018).
The Eurasian wetland invader flowering rush (Butomus umbellatus L., Butomaceae) has been introduced into North America multiple times, with the first record more than a century ago (Anderson et al. Reference Anderson, Zeis and Alam1974; Knowlton Reference Knowlton1923). There are now multiple genotypes within at least two cytotypes established on the continent (Gaskin et al. Reference Gaskin, Andreas, Grewell, Haefliger and Harms2021). These include diploid and triploid populations that differ in their reproductive and ecological traits (Brown and Eckert Reference Brown and Eckert2005; Eckert et al. Reference Eckert, Massonnet and Thomas2000; Harms Reference Harms2020; Harms and Walter Reference Harms and Walter2021). Triploid plants reproduce clonally through extensive lateral rhizome branching and dislodging of rhizome buds, whereas diploid plants produce less rhizome biomass and a greater number of clonal axillary buds (hereafter “bulbils”) at the base of the leaf axils, and sometimes reproduce sexually via seed or inflorescence bulbil production (Lui et al. Reference Lui, Thompson and Eckert2005). Dense B. umbellatus infestations negatively impact water delivery by slowing water flow and clogging pump inlets, decrease recreational access to water bodies (Boutwell Reference Boutwell1990; Rice and Dupuis Reference Rice and Dupuis2009), compete with native species for space and nutrients, and colonize previously unvegetated habitats that support native fish (Jacobs et al. Reference Jacobs, Mangold, Parkinson, Dupuis and Rice2011; Parkinson et al. Reference Parkinson, Mangold, Dupuis and Rice2010). Evidence of genetic-based differences between B. umbellatus populations in their competitive strength, growth rates and reproduction, and susceptibility to herbivory and disease has emerged from greenhouse and laboratory studies (Harms Reference Harms2020; Harms and Walter Reference Harms and Walter2021; Harms et al., Reference Harms, Shearer, Cronin and Gaskin2020b; Lui et al. Reference Lui, Thompson and Eckert2005). However, a direct comparison of the response of different B. umbellatus genotypes to management actions (e.g., herbicide application) is still lacking.
We undertook a multiyear common garden mesocosm study to investigate differences in phenology, growth, and susceptibility to management of the widespread wetland invader, B. umbellatus. In the United States, there are two established cytotypes and at least five recognized amplified fragment length polymorphism (AFLP) genotypes (Gaskin et al. Reference Gaskin, Andreas, Grewell, Haefliger and Harms2021), but to date there has not been a thorough study of similarities and differences among them and whether management should be tailored to the population or generalized recommendations can be made for all target genotypes. Because the majority of previous studies were conducted at small scale with young (<6-mo-old) plants in containers that were limited in size, we used a mesocosm approach to be more representative of mature plants in an established field population. We used a combination of monthly measurements and annual fall biomass harvests to compare basic growth characteristics of genotypes, as well as the effectiveness of herbicide application on well-established plants, representing a large proportion of all genotypes that have so far been identified in North America.
Materials and Methods
Experimental Setup
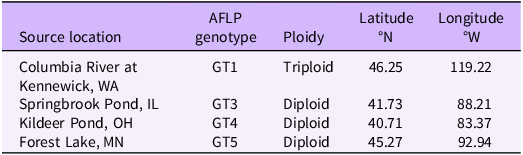
We compared growth and short-term vegetative spread of four B. umbellatus genotypes, representing the two cytotypes that are established in North America (Table 1). A subset of populations reported in Gaskin et al. (Reference Gaskin, Andreas, Grewell, Haefliger and Harms2021) were used in the current study, based on culture availability in our lab. One triploid and three diploid populations were cultured at the U.S. Army Engineer Research and Development Center (ERDC), Vicksburg, MS, since 2016 under identical conditions to reduce possible maternal effects before the experiment. Clonal propagules from a single individual in each population (triploid: ∼5-cm rhizome segments with at least one bud; diploid: axillary buds, hereafter “bulbils”) were collected from culture plants in early spring and floated in water in a greenhouse until sprouted (2 to 3 wk). Sprouts were placed individually in cells within seed starter trays with washed play sand and several grains of slow-release fertilizer (Osmocote® Plus 15-9-12 N-P-K, 5 to 6 month, ICL, Dublin, OH). Once all propagule shoots were approximately 20-cm tall, they were transplanted into experimental containers. Because starter plants of each genotype came from a single individual, resulting plants are considered clones.
Table 1. Butomus umbellatus clones used in the current study, original collection locations, and amplified fragment length polymorphism (AFLP) genotypes as determined in Gaskin et al. (Reference Gaskin, Andreas, Grewell, Haefliger and Harms2021).
Propagules were planted individually in the center of a 56.8-L round rubber stock tank (diameter: 66 cm; depth: 22 cm). Before planting, each container received 60 g of slow-release 15-9-12 (N-P-K) fertilizer at a rate of 2 g L−1 sediment (Madsen et al. Reference Madsen, Wersal and Marko2016) on the bottom of the container, covered with approximately 20 L (∼10-cm depth) of commercial top soil (Black Kow®, Oxford, FL), then capped with another 15 L (∼10-cm depth) of washed play sand. One planted container of each genotype was arranged in a single 1,135-L round stock tank and flooded with municipal water to just above the soil surface until plant growth was observed. Once all plants were established, the water level was raised to approximately 25 cm above the soil surface and maintained at that level throughout the study using PVC overflow pipes mounted externally to the tanks. Water was added as necessary to account for evaporative loss during summer months, and full flushes were done every few months to mitigate algal formation and buildup of salts. Tanks were arranged in parallel rows with minimal shading, and plants were allowed to overwinter without any additional protection from weather. In spring of years 2 and 3, an additional 30g of 20-10-5 (N-P-K) fertilizer was applied to each plant using ten 3-g fertilizer tablets (Agriform, ICL) pressed into the sediment evenly across the surface. For each of four B. umbellatus genotypes, we planted 12 control (untreated), 8 triclopyr, and 8 imazamox tanks. A portion of the control tanks were harvested at the end of the first year, then half of remaining control and treatment tanks were harvested at the end of year 2, and the rest at the end of year 3, as described later.
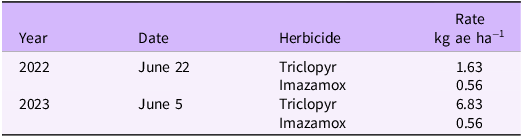
Tanks were randomly assigned experimental treatments: control (no treatment), imazamox (one application during year 2), imazamox (two foliar applications, with one application during year 2 and one application during year 3), triclopyr (one application during year 2), triclopyr (two foliar applications, with one application during year 2 and one application during year 3). Herbicides were chosen for this study because we previously observed efficacy in small-scale trials for both diploid and triploid plants (unpublished data), previous research has documented efficacy of foliar applications on triploid B. umbellatus (Wersal et al. Reference Wersal, Poovey, Madsen, Getsinger and Mudge2014), both are labeled for aquatic use on B. umbellatus in most northern tier states where B. umbellatus occurs, and they represent two distinct modes of action (imazamox is an acetolactate synthase inhibitor and triclopyr is an auxin mimic). Further, much of the previous work on B. umbellatus with herbicides focused on subsurface (Poovey et al. Reference Poovey, Mudge, Getsinger and Sedivy2013) or bare ground (Getsinger and Madsen Reference Getsinger and Madsen2021; Madsen et al. Reference Madsen, Woolf and Wersal2017) application (but see Wersal et al. Reference Wersal, Poovey, Madsen, Getsinger and Mudge2014). Plants were allowed to establish for 1 yr before the first herbicide applications were made. In year 2, herbicides were applied June 22, 2022, and in year 3, application was administered 2.5 wk earlier, on June 5, 2023. The rate of triclopyr was increased in year 3, because limited control was observed from year 2 applications (Table 2). Herbicide treatments were applied to the plant foliage using a CO2-powered sprayer at an equivalent of 468 L ha−1 diluent delivered through a single TeeJet® 11002 Visflo stainless steel nozzle (TeeJet Technologies, Glendale Heights, IL) at 207 kPa. Each treatment included non-ionic surfactant (Cide-Kick II, Brewer International, Vero Beach, FL) at 0.25% v/v. Water level within tanks was maintained at 25 cm, and mean plant height was ≥60 cm above the sediment during application.
Table 2. Herbicide treatment rates and application dates during the study to determine differences in Butomus umbellatus susceptibility to management.
To document general phenological patterns in growth and flowering, tanks were observed monthly, beginning 1 mo after planting, in May 2021. Observations continued for three growing seasons, through final harvest in November 2023. Monthly data collection consisted of leaf abundance and number of inflorescences for each B. umbellatus replicate (i.e., 56.7-L stock tank). Leaves were counted only if they emerged from the water or were submerged but at the water surface. Inflorescences were included in the count only if they were at least partially open. Dead or mature (brown with seeds) inflorescences were not included in monthly counts. Leaf count was used to calculate a monthly relative growth rate (RGR) for each container as:
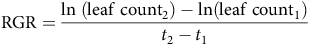 $${\rm{RGR}} = {{\ln \;\left( {{\rm{leaf}}\;{\rm{coun}}{{\rm{t}}_2}} \right) - {\rm{ln}}\left( {{\rm{leaf}}\;{\rm{coun}}{{\rm{t}}_1}} \right)} \over {{t_2} - {t_1}}}$$
where leaf counts are consecutive monthly measurements and t is the date of data collection. In both cases, the subscript “2” refers to the later data point. RGR was then examined over time to determine when maximum growth rate occurred and whether it differed between genotypes. We further calculated growing degree days to assess the relationship between heat accumulation and timing of growth and flowering for each genotype. Cumulative growing degree days (GDD) were calculated for each month by using the following formula:
 $${\rm{Cumulative}}\;{\rm{monthly}}\;{\rm{GDD}} = \sum {{T_{{\rm{ave}}}}} - \;{T_{{\rm{base}}}}\;$$
where T ave is the daily mean air temperature and T base is the lower growth threshold for B. umbellatus. Daily air temperature data were retrieved from the nearest weather station, in Vicksburg, MS (NOAA 2024). We used 10 C as an estimate of the base temperature, an approximate lower threshold that we have observed for B. umbellatus propagule sprouting (unpublished data). To determine the relationship between GDD accumulation and peak growth and flowering, we fit curves to the data for each genotype each year using Gaussian three-parameter equation (SigmaPlot, Grafitti LLC, Palo Alto, CA). Peak growth (total leaf abundance) and peak flowering were estimated by examining the curve-fit coordinates for each year to identify peaks. We then calculated mean GDDs for maximum leaf abundance and flowering for each genotype based on estimates from each year.
At the end of the first growing season, measurements were made to document vegetative spread of B. umbellatus plants. To accomplish this, distance from the center of the container (i.e., the location where sprouted propagules were originally planted) to the furthest visible emergent leaf was measured in all four cardinal directions. With those measurements, average directional spread was calculated, then invaded area was estimated by calculating the area of a circle using mean spread distance as the radius. Further, as an estimate of spread potential within B. umbellatus stands, we calculated a simple worst-case scenario by taking the product of mean annual propagule production and mean basal area at the end of one growing season, assuming 100% propagule release and 95% and 90% propagule viability for triploid and diploid propagules, respectively (Sartain et al. Reference Sartain, Harms and Coomes2024). In reality, the number of bulbils or rhizome buds naturally released from B. umbellatus plants is unknown. The resulting calculation was an estimate for spread potential stemming from a single established propagule after a season of growth.
At the end of each growing season (November), four tanks of each treatment were harvested for biomass. Harvest consisted of excavating the entire experimental container, removing all biomass, rinsing, and separating biomass into aboveground (leaves, flowers), belowground (roots), and propagative (rhizome buds, bulbils) biomass. Plant parts were placed into separate paper bags, then dried to constant weight at 70 C. Biomass was weighed to the nearest 0.01 g. In addition to bulk drying and weighing of propagules, they were individually counted.
Statistical Approach
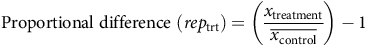
For phenology, we did not conduct formal analysis but describe data qualitatively. Genotype-specific spread at the end of the first growing season was compared using one-way ANOVA, with area (cm2) as the dependent variable and B. umbellatus genotype as the independent variable. Year-end harvests were analyzed separately for each year and with three types of statistical comparisons. First, we focused comparisons on control plants to investigate general differences in growth (total biomass) and vegetative reproduction (number of propagules) between genotypes. Thus, we analyzed differences between genotypes grown for one, two, or three full seasons. Next, we compared genotype responses to herbicide application, analyzing years 2 and 3 separately. For those years, we calculated a proportional difference of treatment replicates from the control treatment for each of the above variables, calculated as:
 $${\rm{Proportional}}\;{\rm{difference}}\;\left( {re{p_{{\rm{trt}}}}} \right) = \left( {{{{x_{{\rm{treatment}}}}} \over {\overline {{x_{{\rm{control}}}}} }}} \right) - 1\;$$
where the proportional difference from the non-treated control was calculated for each treatment replicate (rep trt) using the mean value of control replicates for each genotype and year.
For each year, general linear models were used to compare total dry weight biomass and total number of propagules among genotypes. For comparison of non-treated plants, only genotype was included as a main effect, so the resulting model was the equivalent of a one-way ANOVA. General linear models were also used to compare response to management in years 2 and 3. First, proportional response of plants to herbicide treatments was the dependent variable and genotype, herbicide, and the genotype by herbicide interaction were fixed effects in the models. All variables were normally distributed for analysis, so no transformation was necessary. Comparing proportional response of plants allowed a direct comparison that included genotypes with potentially inherent differences in growth rates. Therefore, we also compared treated plants directly with control non-treated plants within each genotype and year using one-way ANOVA. Differences between means were deemed significant at α = 0.05. If statistical differences were detected, mean separation was accomplished with a Tukey post hoc test. All analyses were conducted in SAS v. 9.4 (SAS Institute, Cary, NC).
Results and Discussion
Spread
Within the first season, all B. umbellatus genotypes grew and spread to nearly cover the surface of their experimental containers (Figure 1). Diploid GT3 plants spread the least, covering an average of 1,502 cm2, whereas triploid GT1 and diploid GT4 and GT5 spread to cover 1,785 ± 59 cm2, 1,983 ± 71 cm2, and 1,887 ± 68 cm2, respectively after 6 mo of growth.
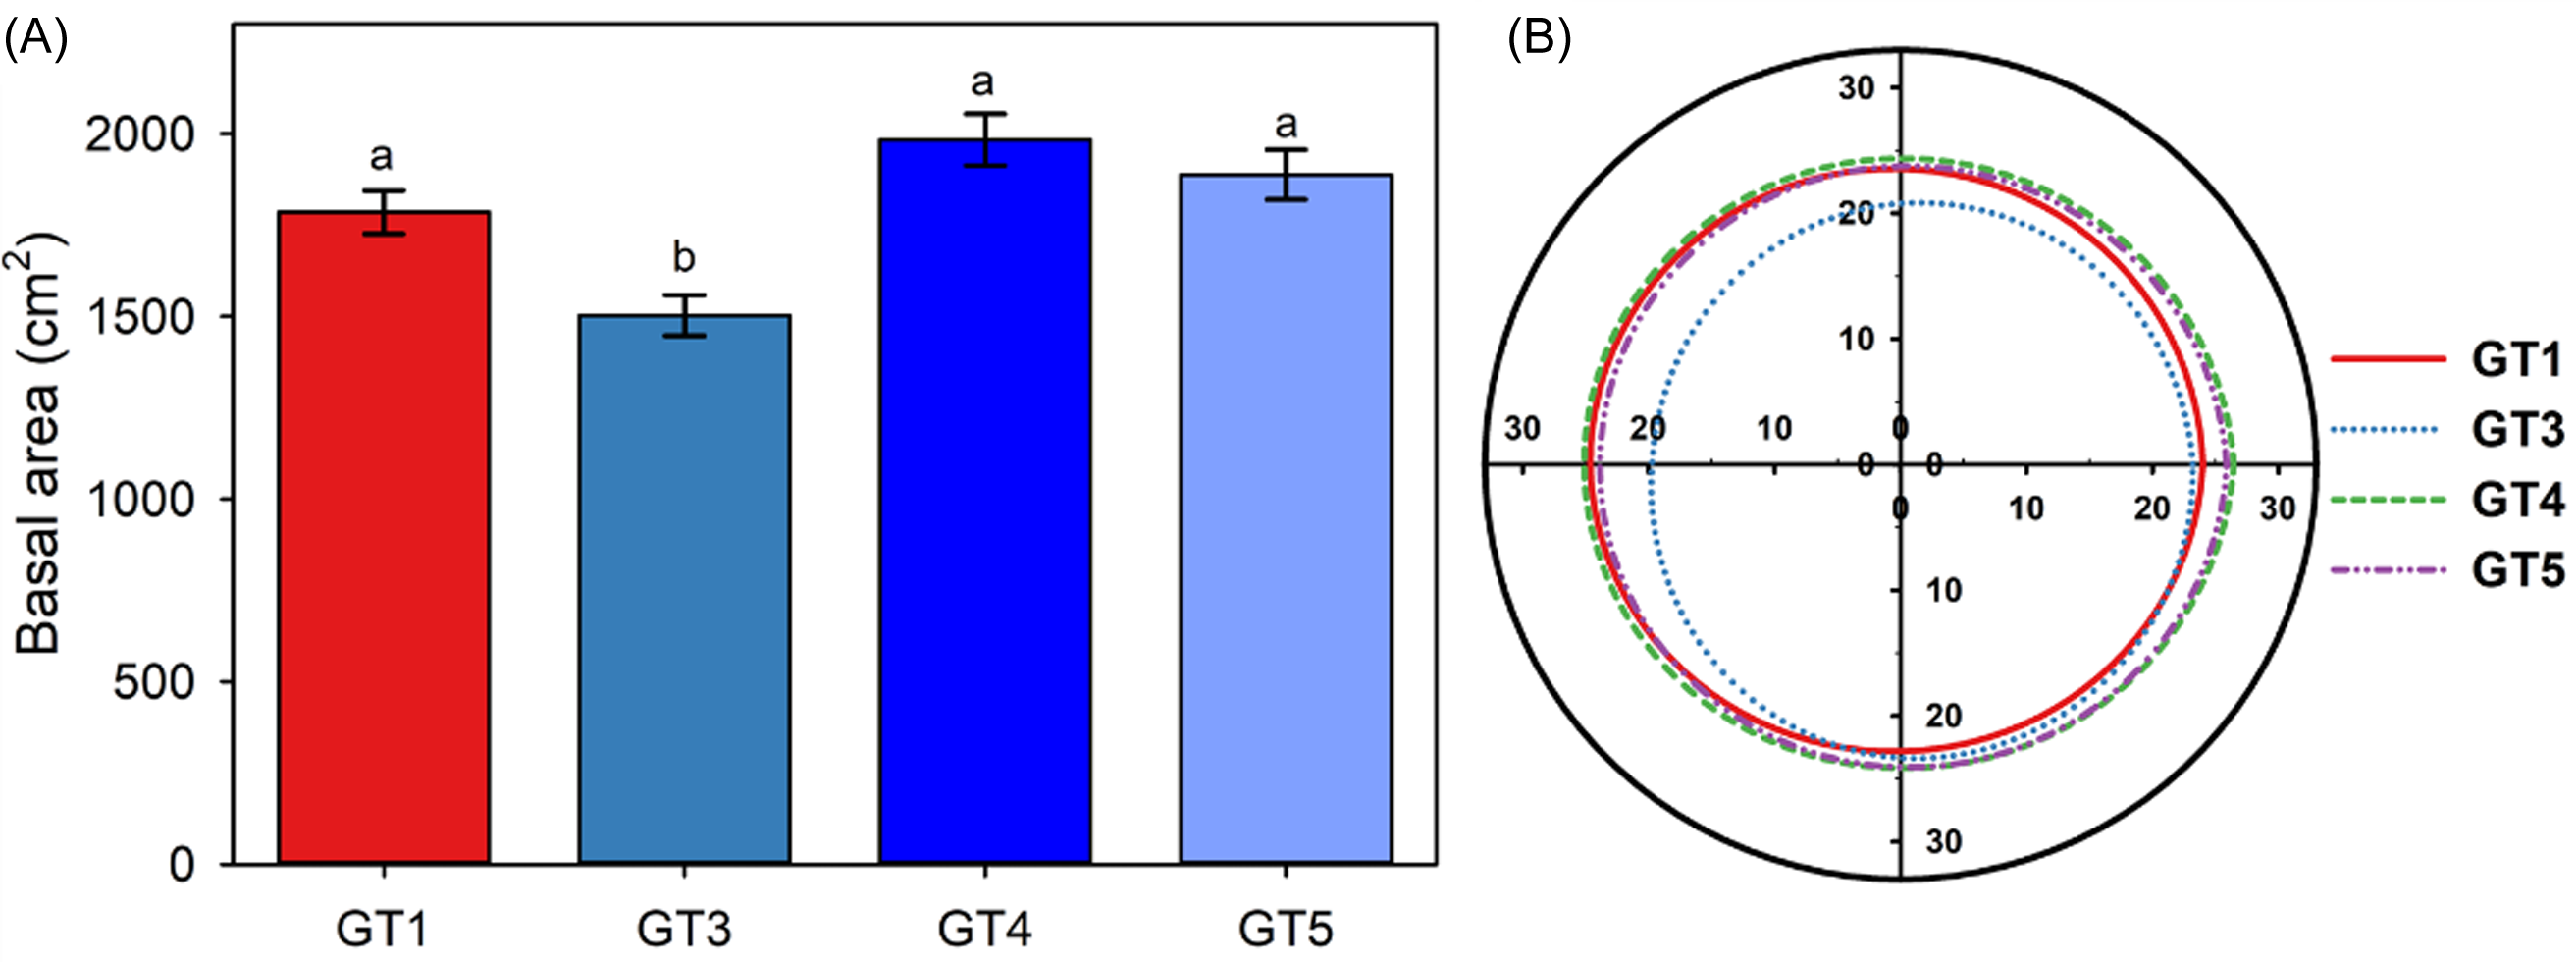
Figure 1. Mean (±SE) basal area of Butomus umbellatus plants after one season of growth from a single propagule (A) and polar plot of mean spread measurements (B). Axis units in (B) are centimeters, and the boundary of the experimental container is represented by the outer black circle.
From a single B. umbellatus GT5 propagule that establishes in spring, grows for a single growing season, and distributes newly developed propagules, there is potential to increase an infestation size by up to 1,775 m2 in the second growing season (Table 3). The spread potential is much less for triploid plants than for diploid plants due to the lower number of vegetative propagules produced. However, triploid rhizome buds typically have high viability and represent a large energy reserve, so they are likely to successfully establish more readily than bulbils produced in diploid populations. The number of propagules released during a growing season is unknown and likely depends on the level of disturbance within the invaded area. Disturbance events may include human activities, wildlife (e.g., waterfowl), or significant weather events (Harms and Shearer Reference Harms and Shearer2015).
Table 3. Estimate of spread potential, given propagule production and vegetative spread of Butomus umbellatus within a single growing season. a
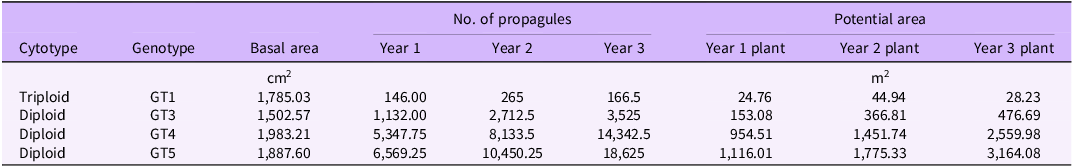
a Estimates were made using propagule numbers produced by 1-, 2-, or 3-yr-old untreated plants, assuming 90% viability of bulbils (GT3, GT4, GT5 plants) and 95% viability of rhizome buds (GT1 plants) (Sartain et al. Reference Sartain, Harms and Coomes2024).
Although all B. umbellatus genotypes displayed significant capacity for lateral spread within the first year of our study (nearly 25 cm, on average, in all directions), a better understanding of long-term spatial dynamics might come from detailed field site demographic studies that include measurements of propagule production, release, and spread (Jelbert et al. Reference Jelbert, Buss, McDonald, Townley, Franco, Stott, Jones, Salguero-Gómez, Buckley, Knight, Silk, Sargent, Rolph, Wilson and Hodgson2019). There is likely value in including depth gradients in future studies as well. We conducted our study under stable (maintained at 25-cm depth), nonfluctuating water levels, but propagule production and establishment vary with water depth, at least for triploid GT1 plants (Carter et al. Reference Carter, Madsen and Ervin2018). Nevertheless, it is now possible to model and compare spread of B. umbellatus genotypes using empirically determined parameters, a future direction that should be explored to provide the best assessment of local impacts of B. umbellatus. Including genotype-specific response to herbicide in modeling efforts would further improve the ability of water resource managers to make informed management decisions based on the genotype present in their water bodies and local site conditions. Although we tested four of the known genotypes in North America, there are several other rarer genotypes that may require unique management approaches in the regions where they occur (Gaskin et al. Reference Gaskin, Andreas, Grewell, Haefliger and Harms2021).
Phenology
During the first growing season, plants of all B. umbellatus genotypes were similar in the timing of growth and flowering (Figures 2–4). In year 2, leaf abundance increased during early spring, but plants were then subjected to a freeze in which air temperature reached below freezing for several consecutive days. Maximum growth rate of the GT1 genotype occurred in May during year 2 (RGR = 0.11 ± 0.03) and March during year 3 (RGR = 0.22 ± 0.05). Maximum leaf production occurred for diploid plants in April during year 2 and March during year 3 (Figure 3). Overall, peak leaf production occurred with 1,749 ± 22 GDD for GT1 plants, and 1,896 ± 82, 1,848 ± 45, and 1,895 ± 94 GDD for GT3, GT4, and GT5 plants, respectively (Supplementary Figure 1).
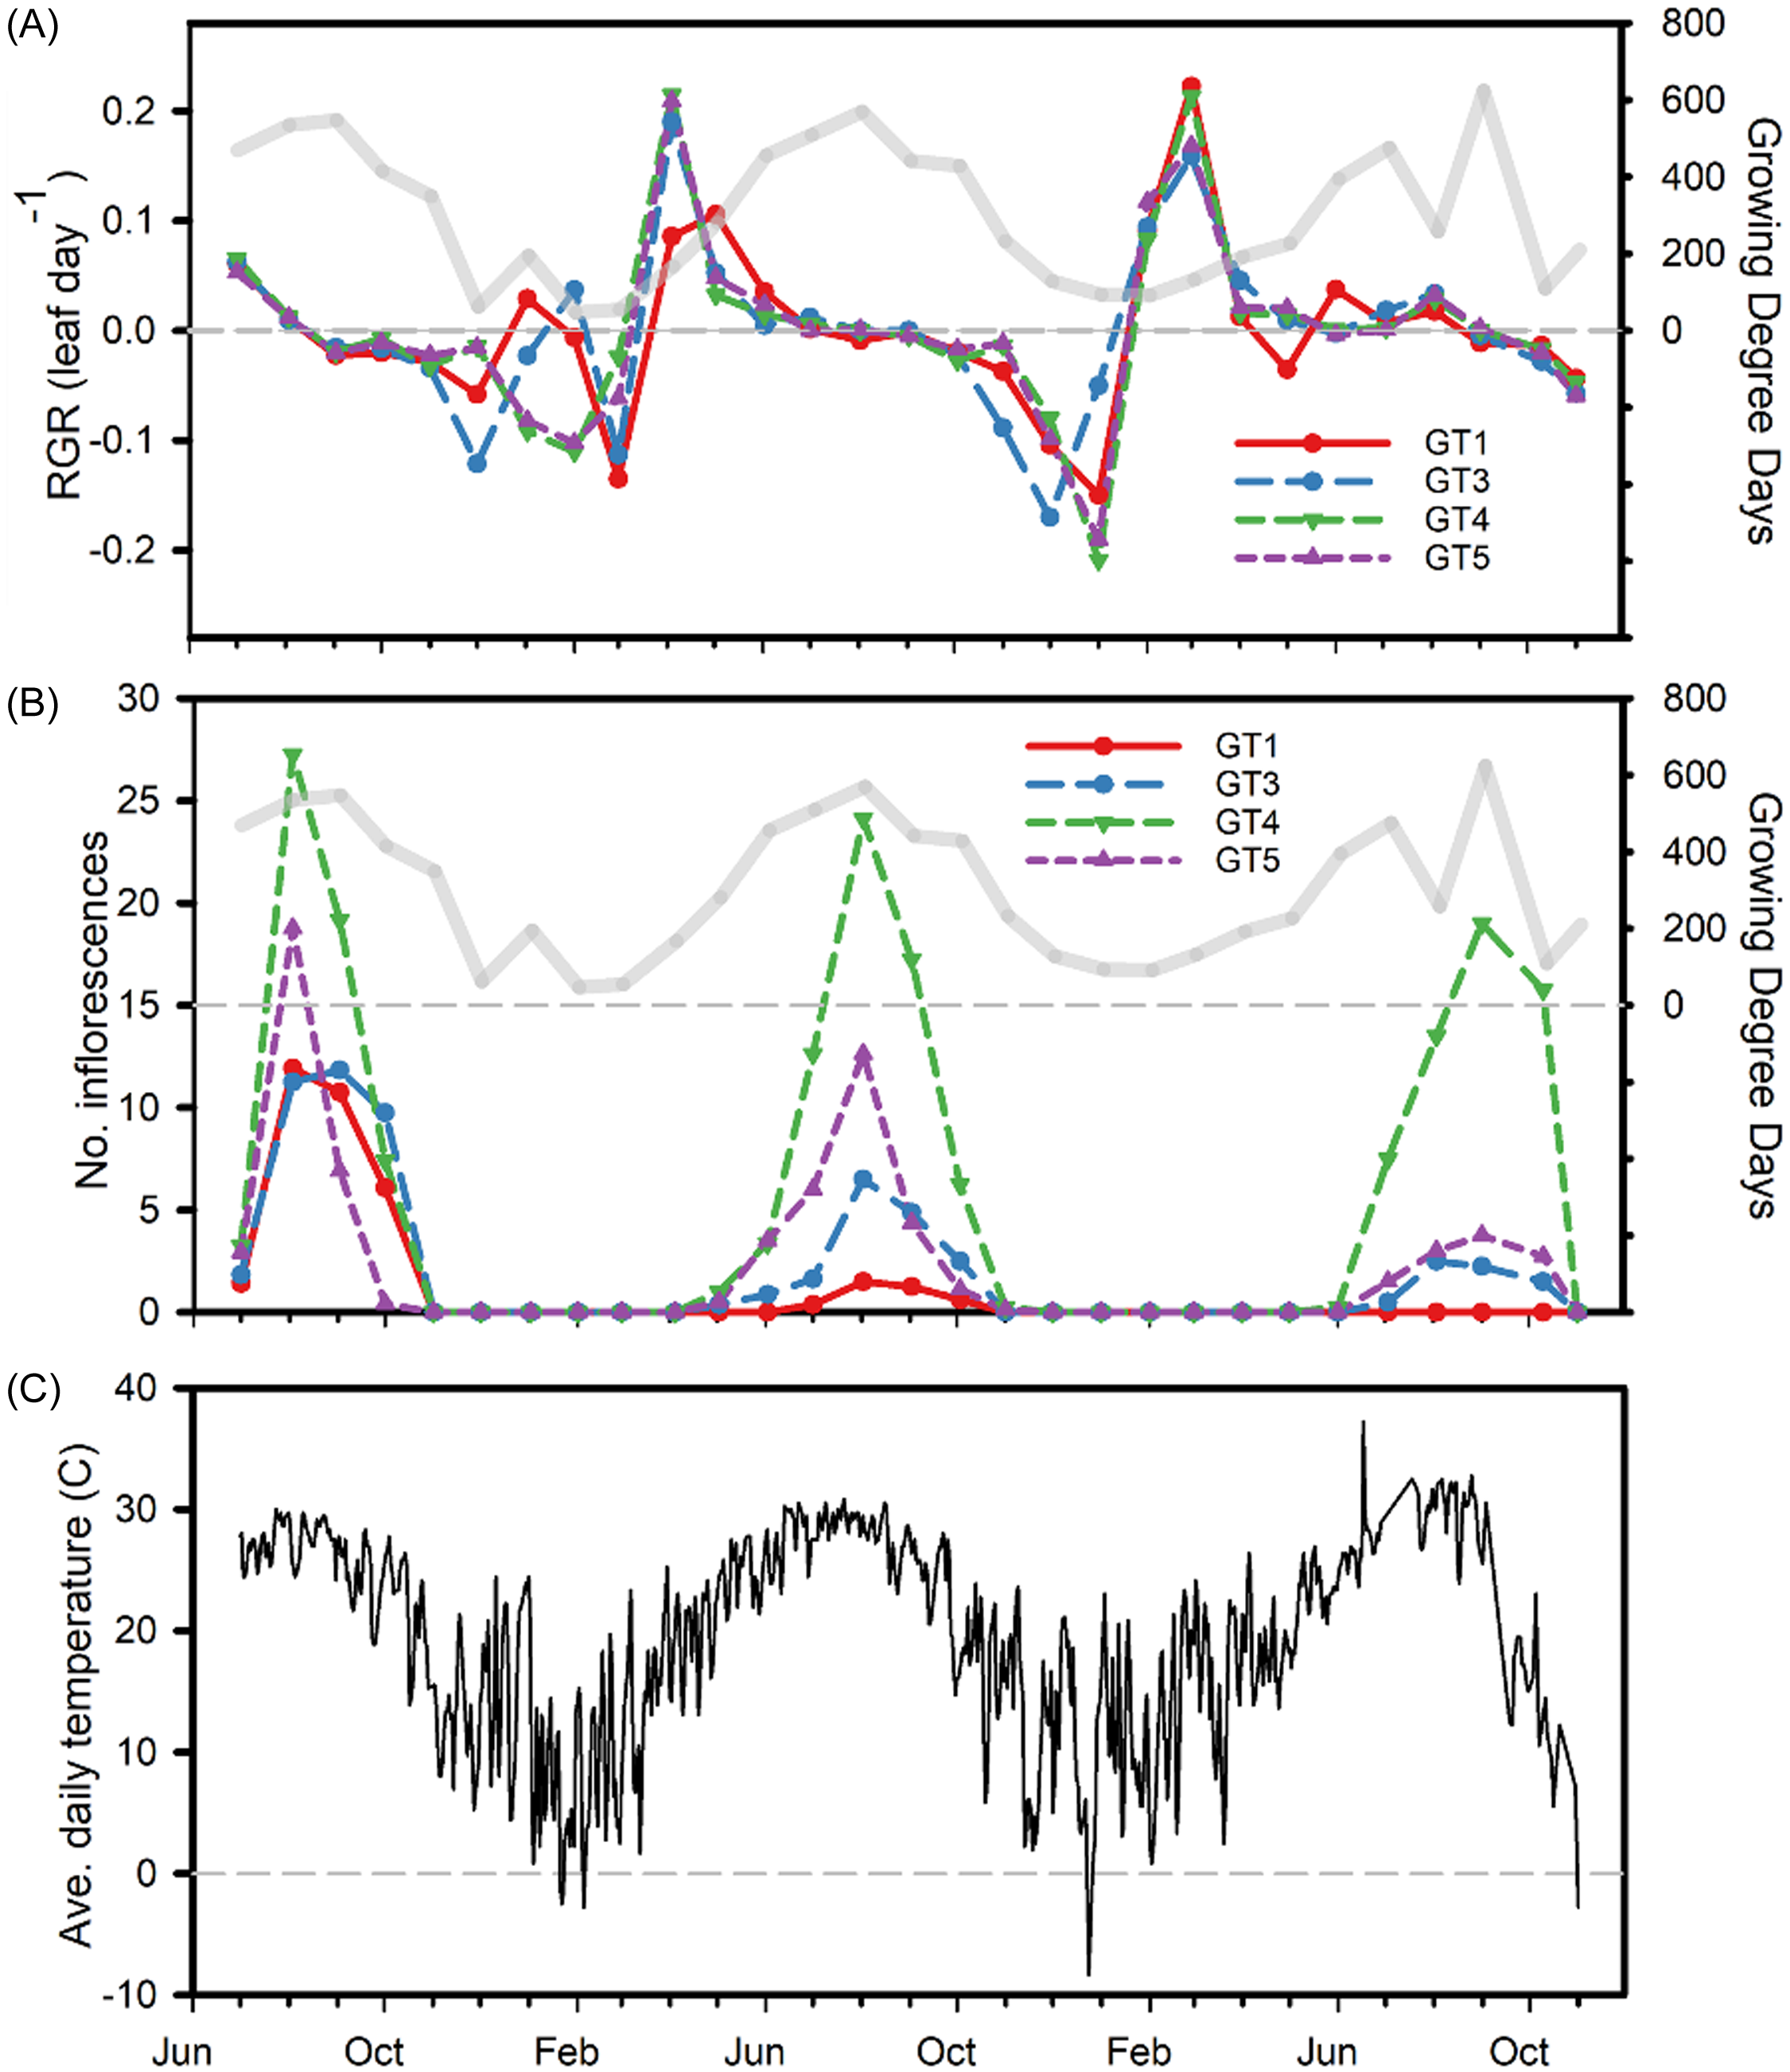
Figure 2. Time series of relative growth rate (RGR; number of leaves per day) for the study period June 2021–November 2023 (A) and number of inflorescences (B) for untreated control plants of four Butomus umbellatus genotypes grown in mesocosm tanks over three growing seasons. Also shown is average daily air temperature over the span of the study (C). In A and B, monthly cumulative growing degree days (GDD) are displayed as a transparent gray line, triploid genotype is GT1, and diploid genotypes are GT3–GT5. Dashed gray lines in each represent zero RGR (A), GDD (A,B), or degrees Celsius (C). Temperature data were retrieved from the nearest weather station, in Vicksburg, MS (NOAA 2024).
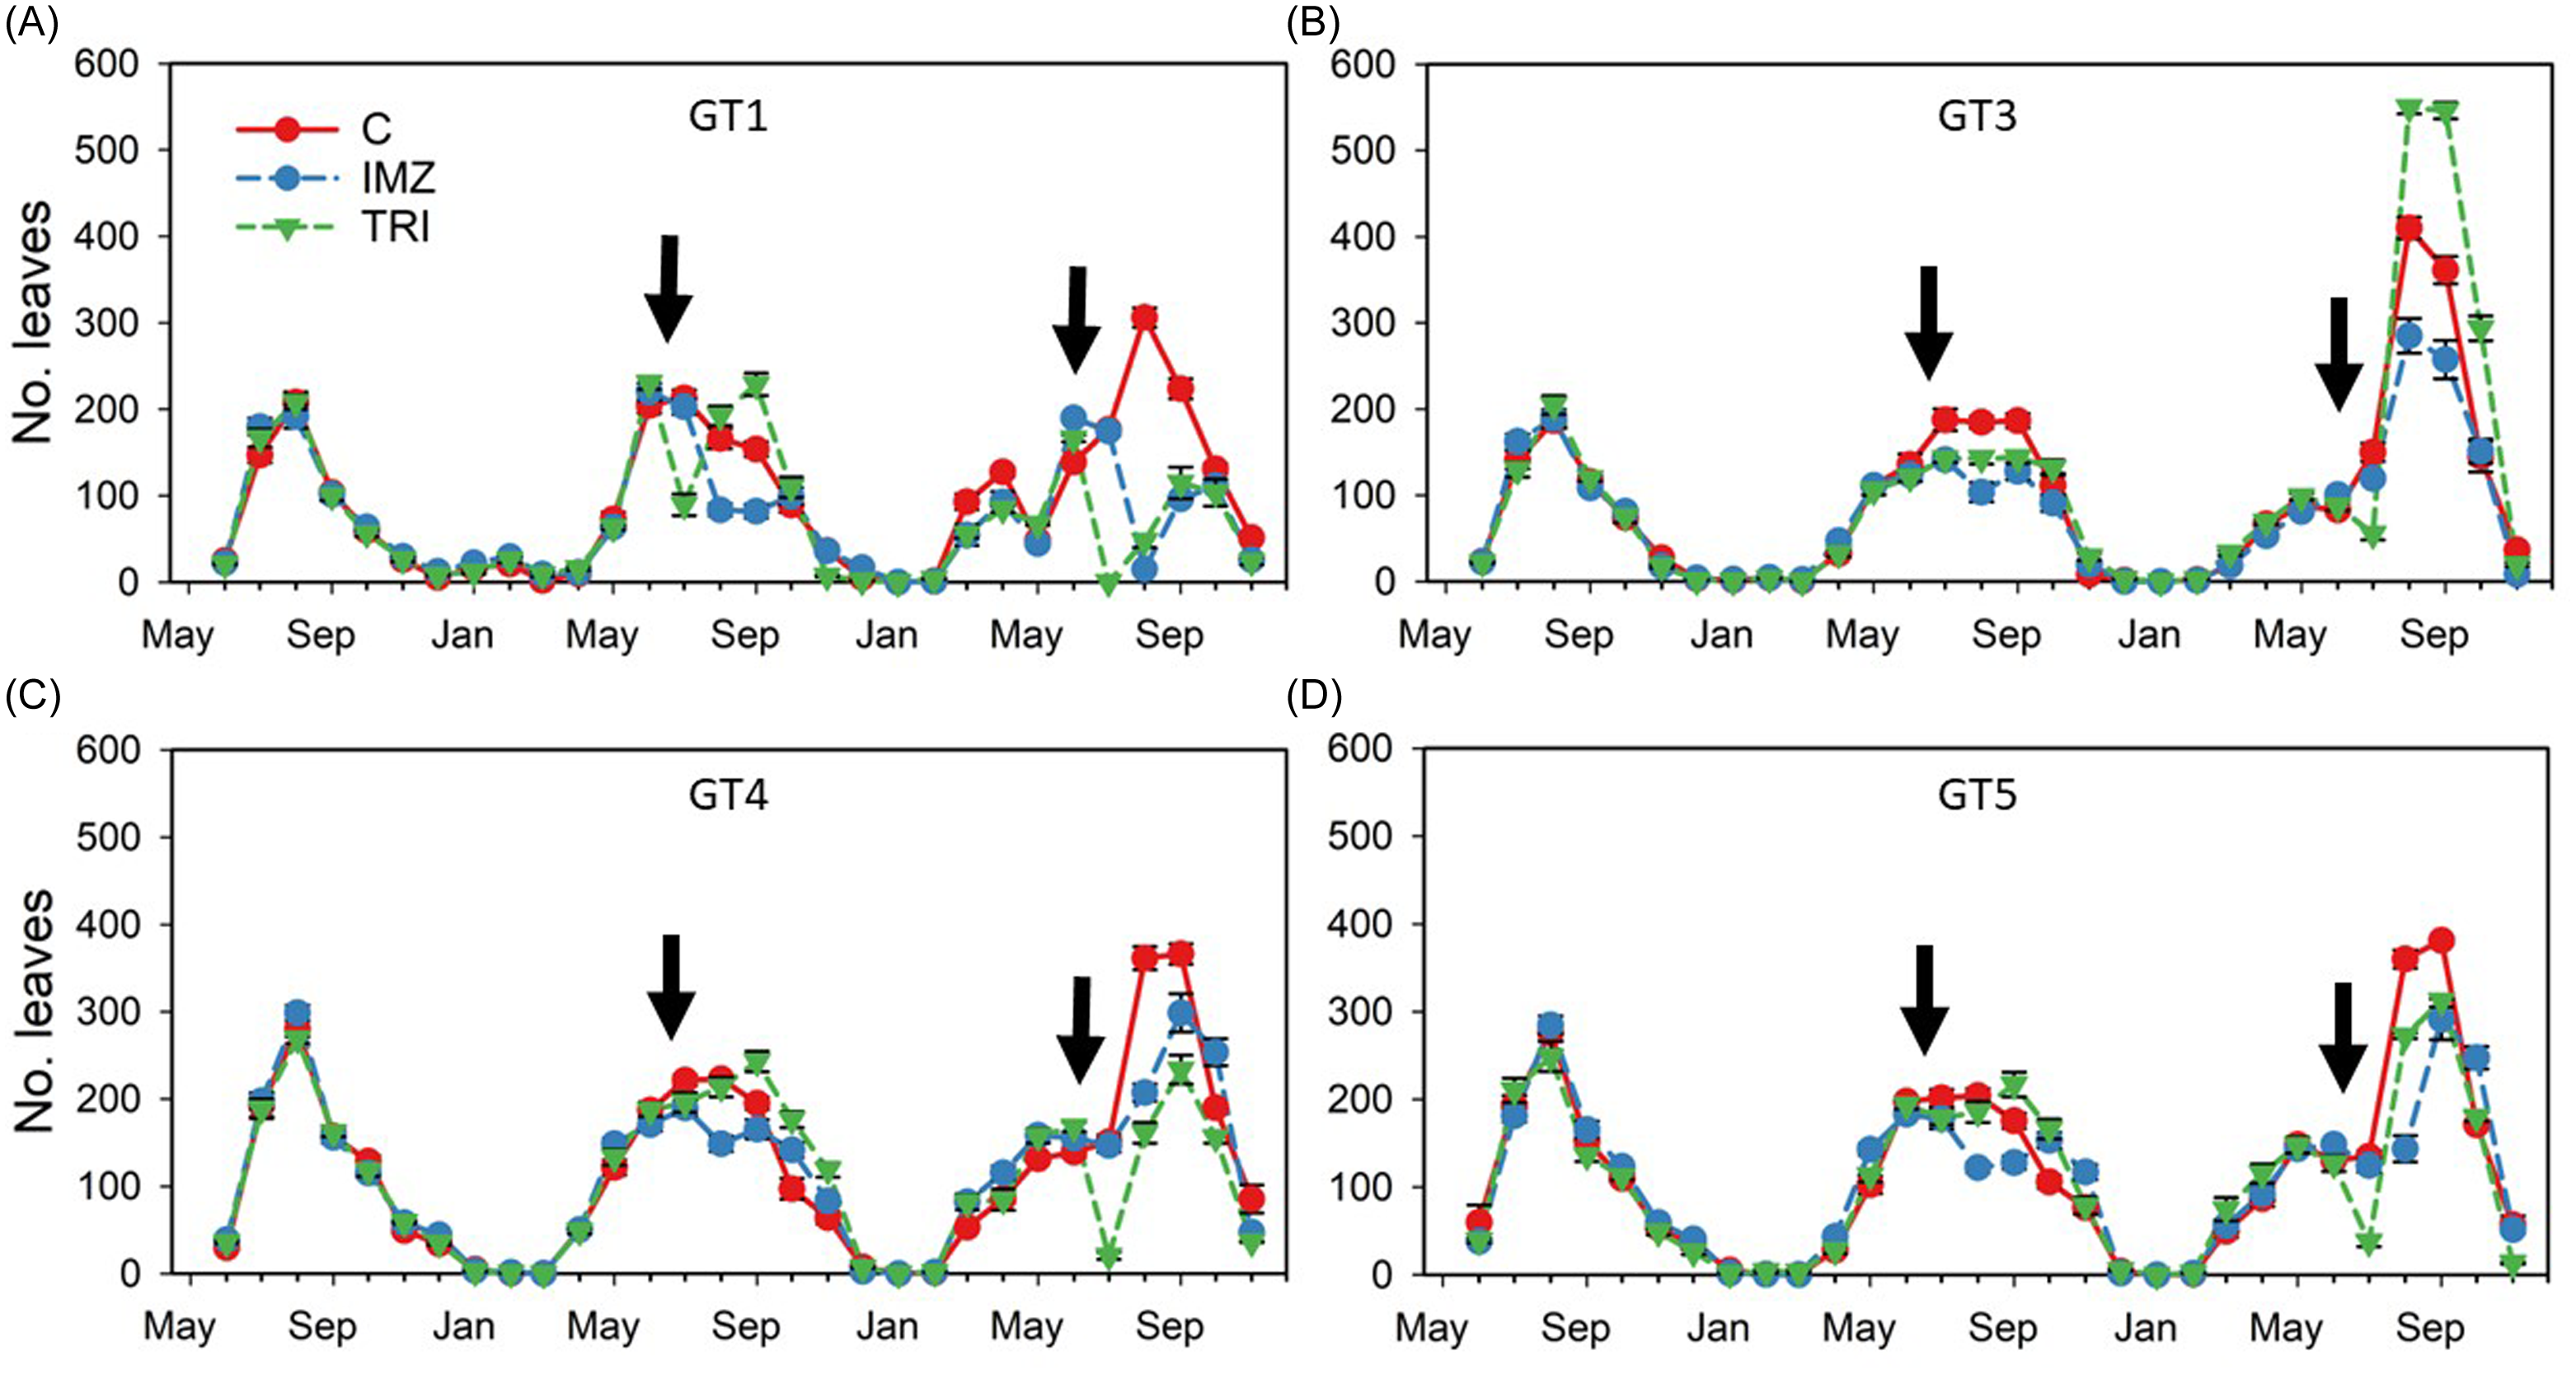
Figure 3. Mean (±SE) number of leaves observed (monthly) over the duration of the study, May 2021 to November 2023, of Butomus umbellatus genotypes GT1 (A), GT3 (B), GT4 (C), and GT5 (D), and their response to herbicide application. Dates of herbicide application during years 2 and 3 are noted with arrows. Error bars are present but obscured behind treatment symbols. C, control; IMZ, imazamox; TRI, triclopyr. The B. umbellatus genotype GT1 is triploid, and genotypes GT3–GT5 are diploid.
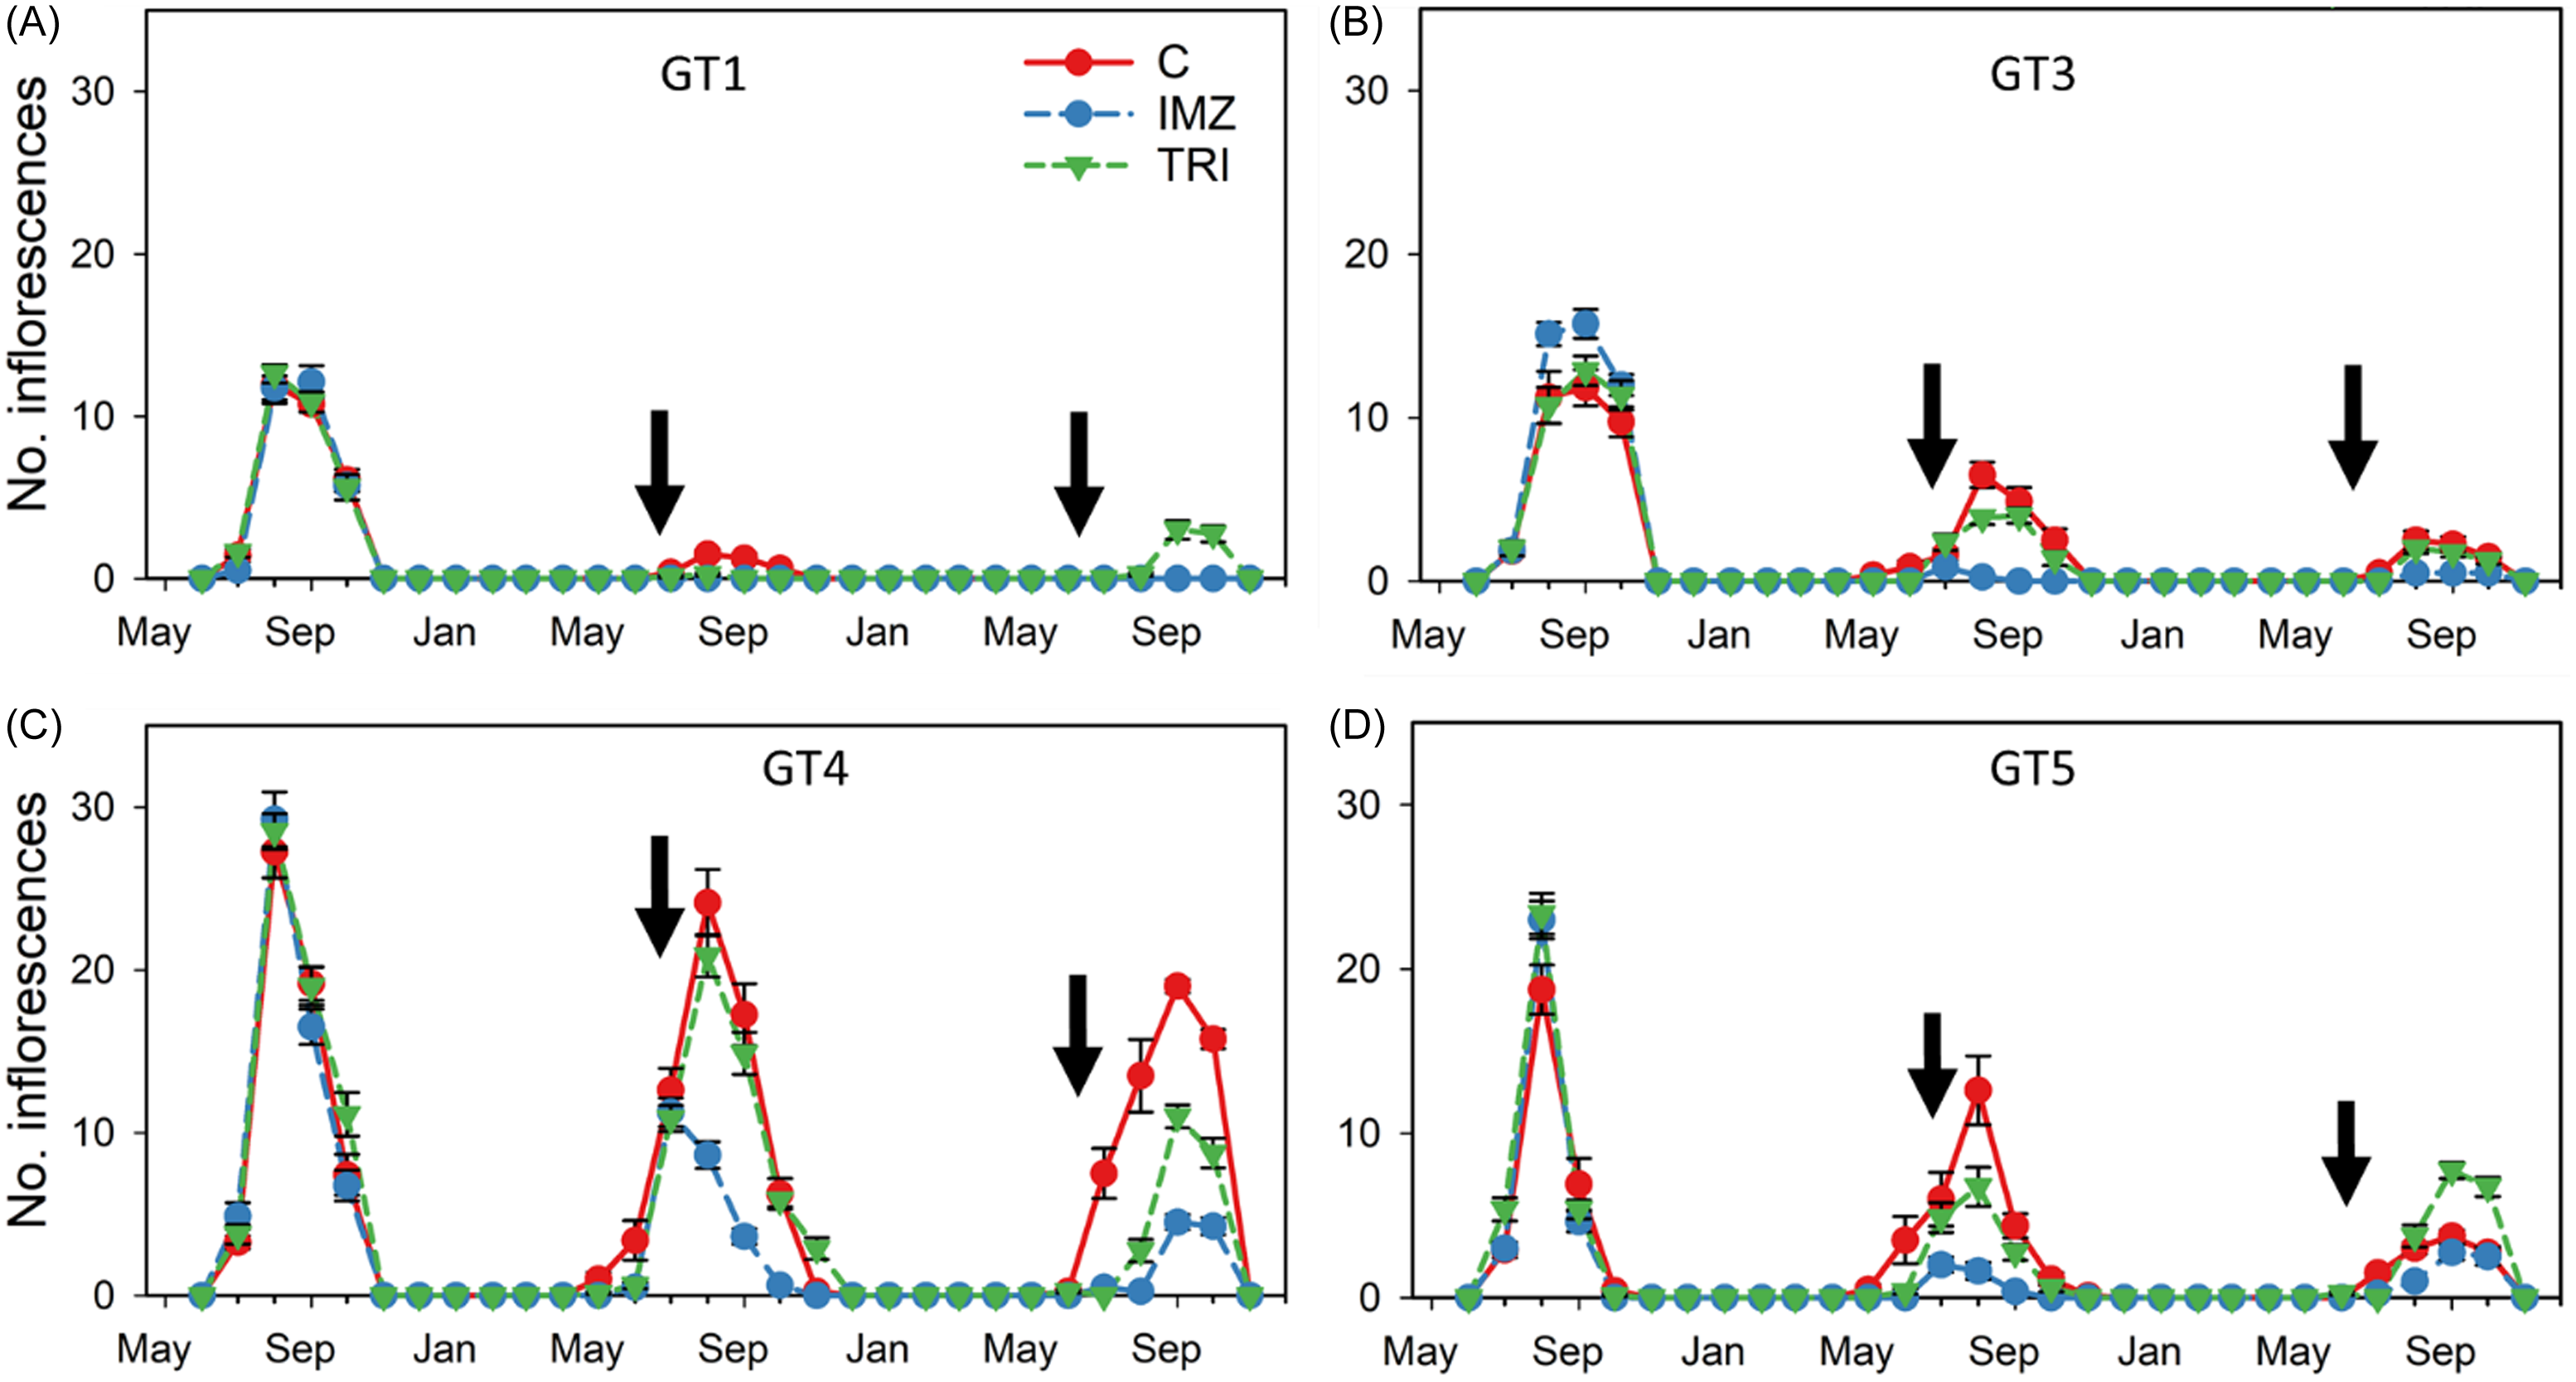
Figure 4. Mean (±SE) number of inflorescences observed during a three growing season study, May 2021–November 2023, of Butomus umbellatus genotypes GT1 (A), GT3 (B), GT4 (C), and GT5 (D), and their response to herbicide application. Dates of herbicide application during years 2 and 3 are noted with arrows. Error bars are present but obscured behind treatment symbols. C, control; IMZ, imazamox; TRI, triclopyr. The B. umbellatus genotype GT1 is triploid, and genotypes GT3–GT5 are diploid.
The most inflorescences were produced during August of the first year by diploid GT4 plants (mean 29.25 ± 1.7 inflorescences container−1) (Figure 4). However, mean flowering was consistently highest during year 1 and gradually declined during years 2 and 3. Flowering initiated in June, only a month after planting during the first growing season, then beginning in April for diploid plants during year 2, and late May in year 3. Triploid GT1 plants initiated flowering 2 mo after diploid plants during year 2 and only flowered in triclopyr-treated plants after herbicide application (August through October) in year 3. Overall, peak flowering in non-treated control plants coincided with the accumulation of 2,210 ± 51 (GT1), 2,183 ± 45 (GT3), 2,099 ± 22 (GT4), and 2,014 ± 52 (GT5) GDD (Figure 2). Herbicide application in year 2 was conducted several months post-flowering, whereas application in year 3 was done within seven days of the first documented inflorescence. Overall, imazamox suppressed flower production in both diploid and triploid plants both years, but the effect was greatest for GT1 and GT3 plants, in which flowering was already low.
Annual Differences
There were significant differences between genotypes in annual growth and reproduction (Supplementary Table 1), and differences tended to increase in successive years (Figure 5). Diploid GT3 plants had highest biomass all 3 yr (Figure 5A–C). Biomass of triploid GT1 plants was equivalent to biomass of diploid GT4 and GT5 plants at the end of year 1 (Figure 5A), but by the end of the study was second to biomass of GT3 plants (Figure 5C). Diploid GT5 plants produced the most vegetative propagules, with nearly 20,000 per container by the end of the study (Figure 5F).
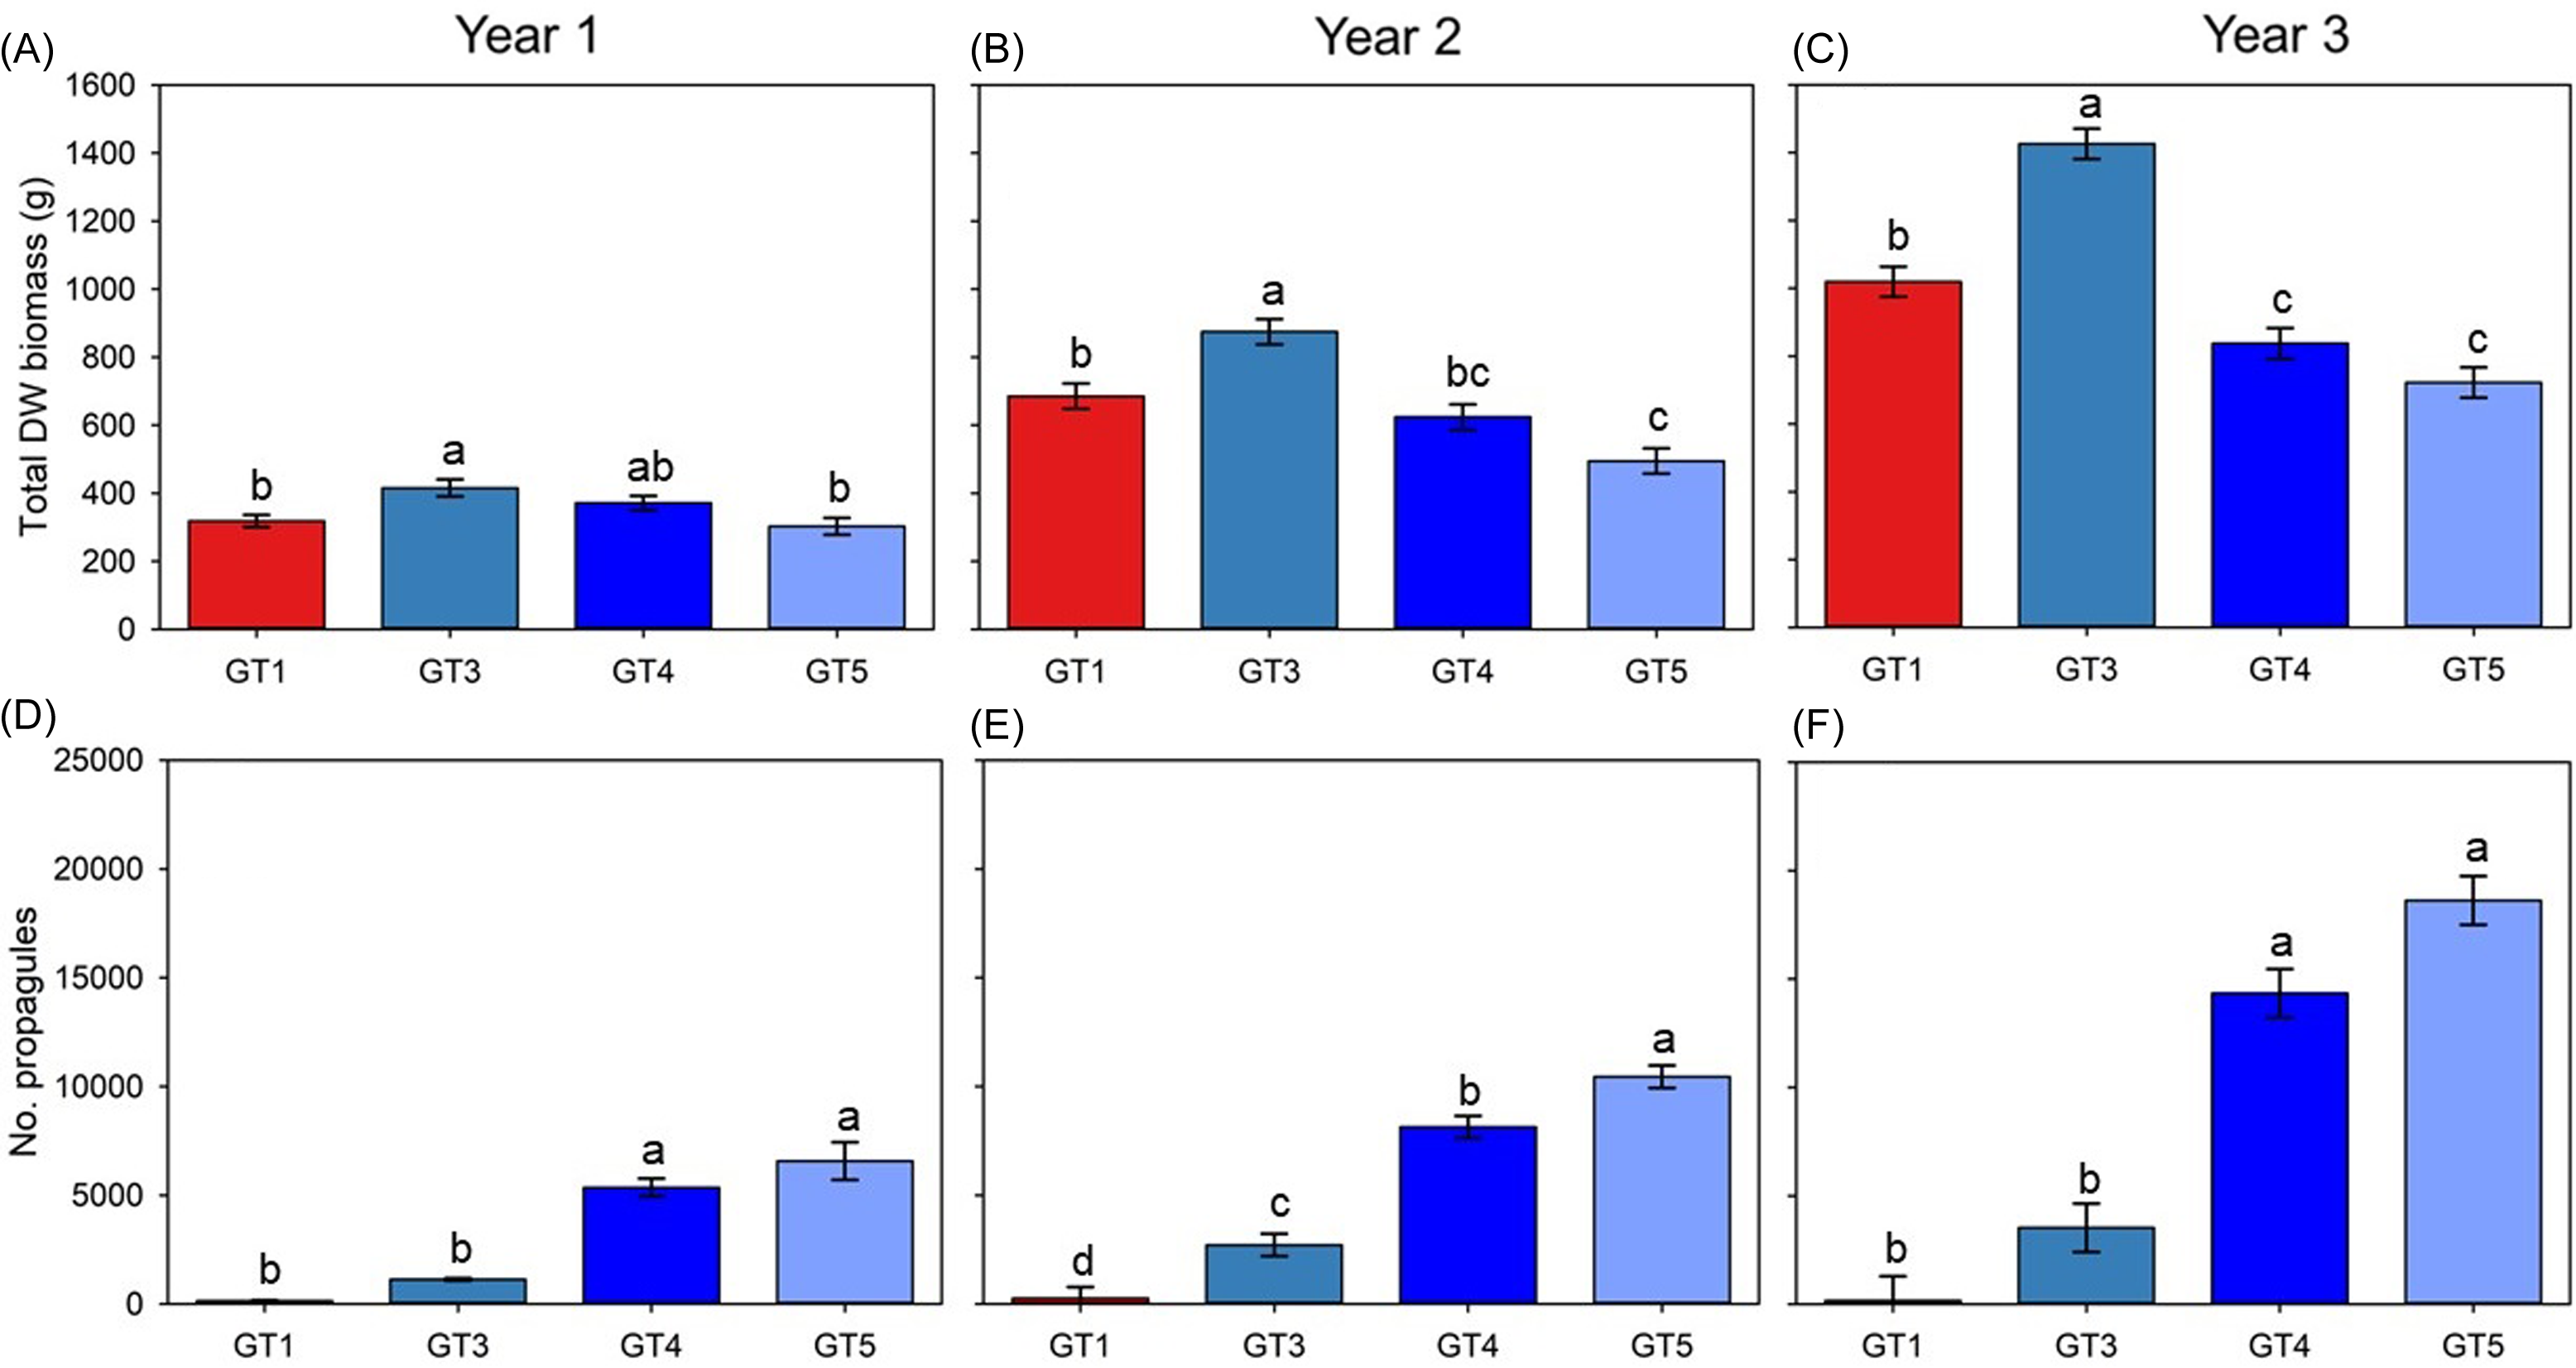
Figure 5. Mean (±SE) results for total biomass (A–C) and number of propagules (D–F) from annual harvests of four Butomus umbellatus genotypes (GT1, GT3, GT4, GT5) grown in outdoor mesocosms. Red bars signify the triploid genotype of B. umbellatus, and blue bars reflect diploid genotypes. Letters above means represent significantly different means, determined by Tukey post hoc test at α = 0.05. DW, dry weight. The B. umbellatus genotype GT1 is triploid, and genotypes GT3–GT5 are diploid.
In year 2, no significant genotype, herbicide, or interaction effect on total dry weight biomass of treated plants was detected (Supplementary Tables 1 and 2). However, there was a significant herbicide effect on propagule abundance, as plants treated with triclopyr produced approximately 25% fewer propagules than imazamox-treated plants, overall (Figure 6). Within genotypes, neither imazamox nor triclopyr significantly reduced total biomass compared with the control treatments at the year 2 harvest (Figure 7). Nevertheless, when it came to propagule abundance at the end of year 2, triclopyr notably decreased the number of propagules compared with the control in diploid GT4 and GT5 plants (Figure 7).
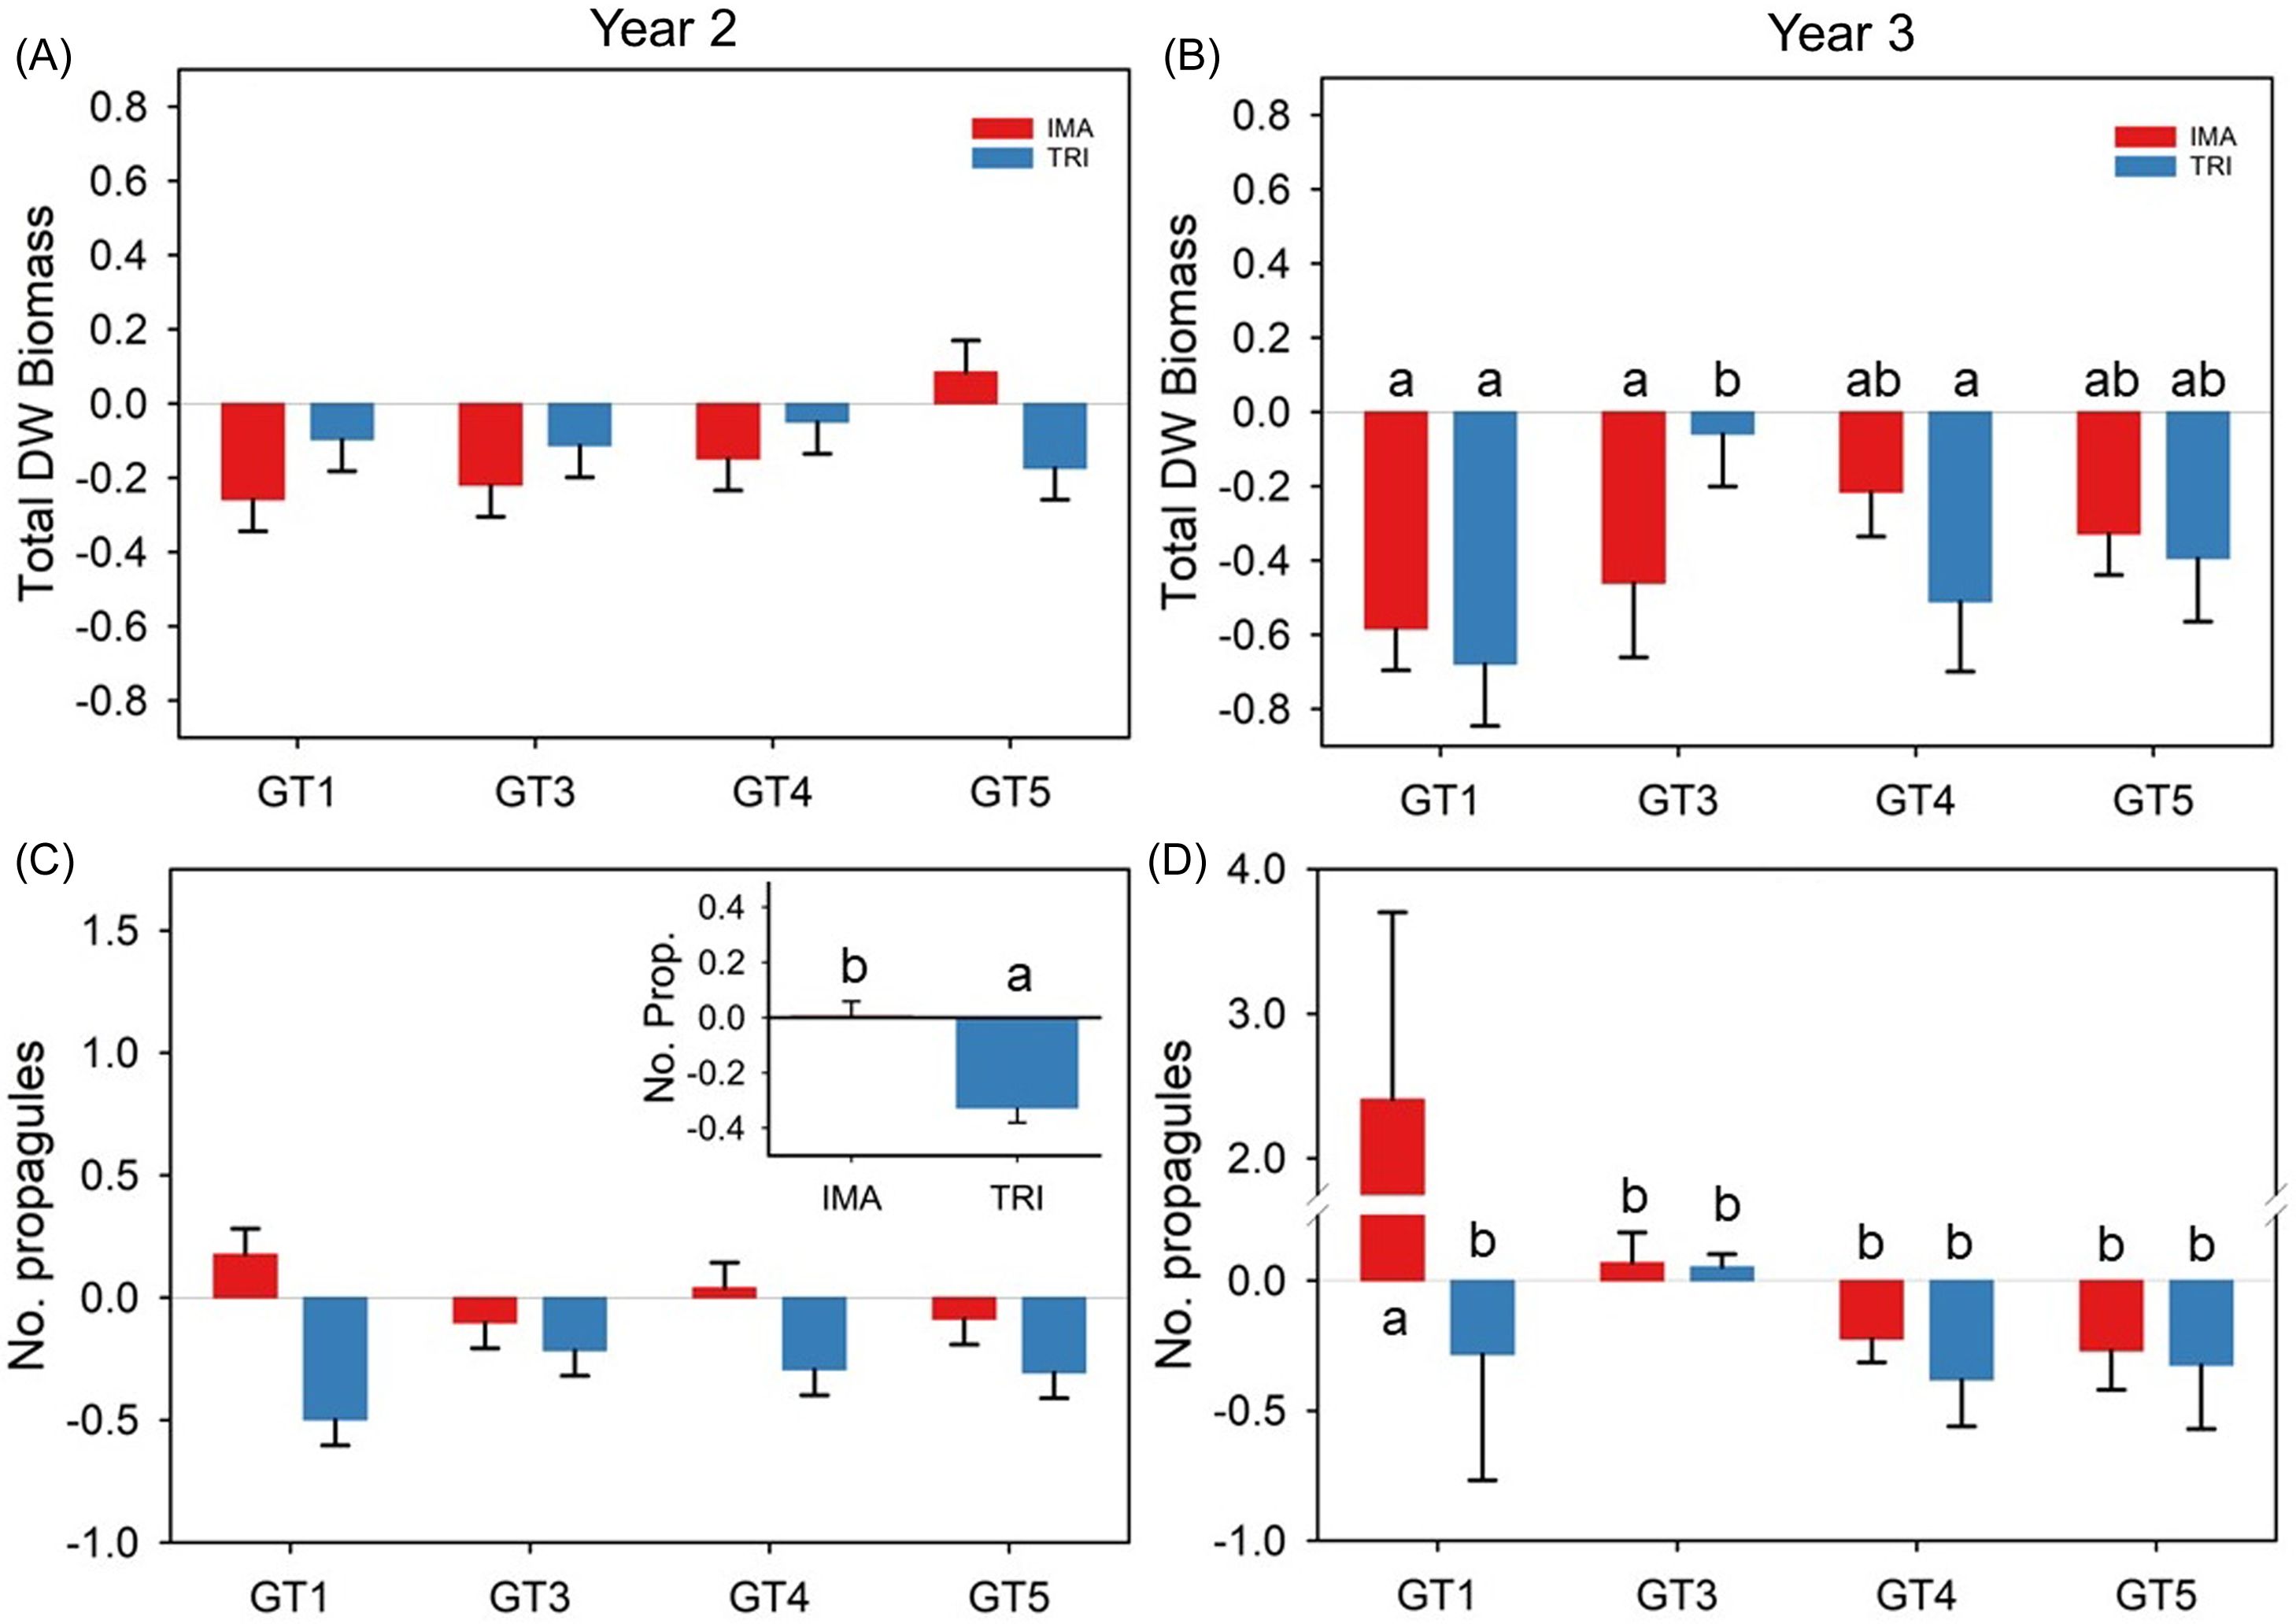
Figure 6. Year 2 and three mean (±SE) herbicide treatment effects for four Butomus umbellatus genotypes (GT1, GT3, GT4, GT5) grown in outdoor mesocosms. Application rates of triclopyr increased from 1.63 kg ae ha−1 to 6.83 kg ae ha−1 between years 2 and 3. Note: Except for the number of propagules, panels for both years are on the same axes to visually display differences. Letters above bars represent significantly different means across genotypes and treatments, determined by Tukey post hoc test at α = 0.05. DW, dry weight; IMA, imazamox; TRI, triclopyr. The B. umbellatus genotype GT1 is triploid, and genotypes GT3–GT5 are diploid.
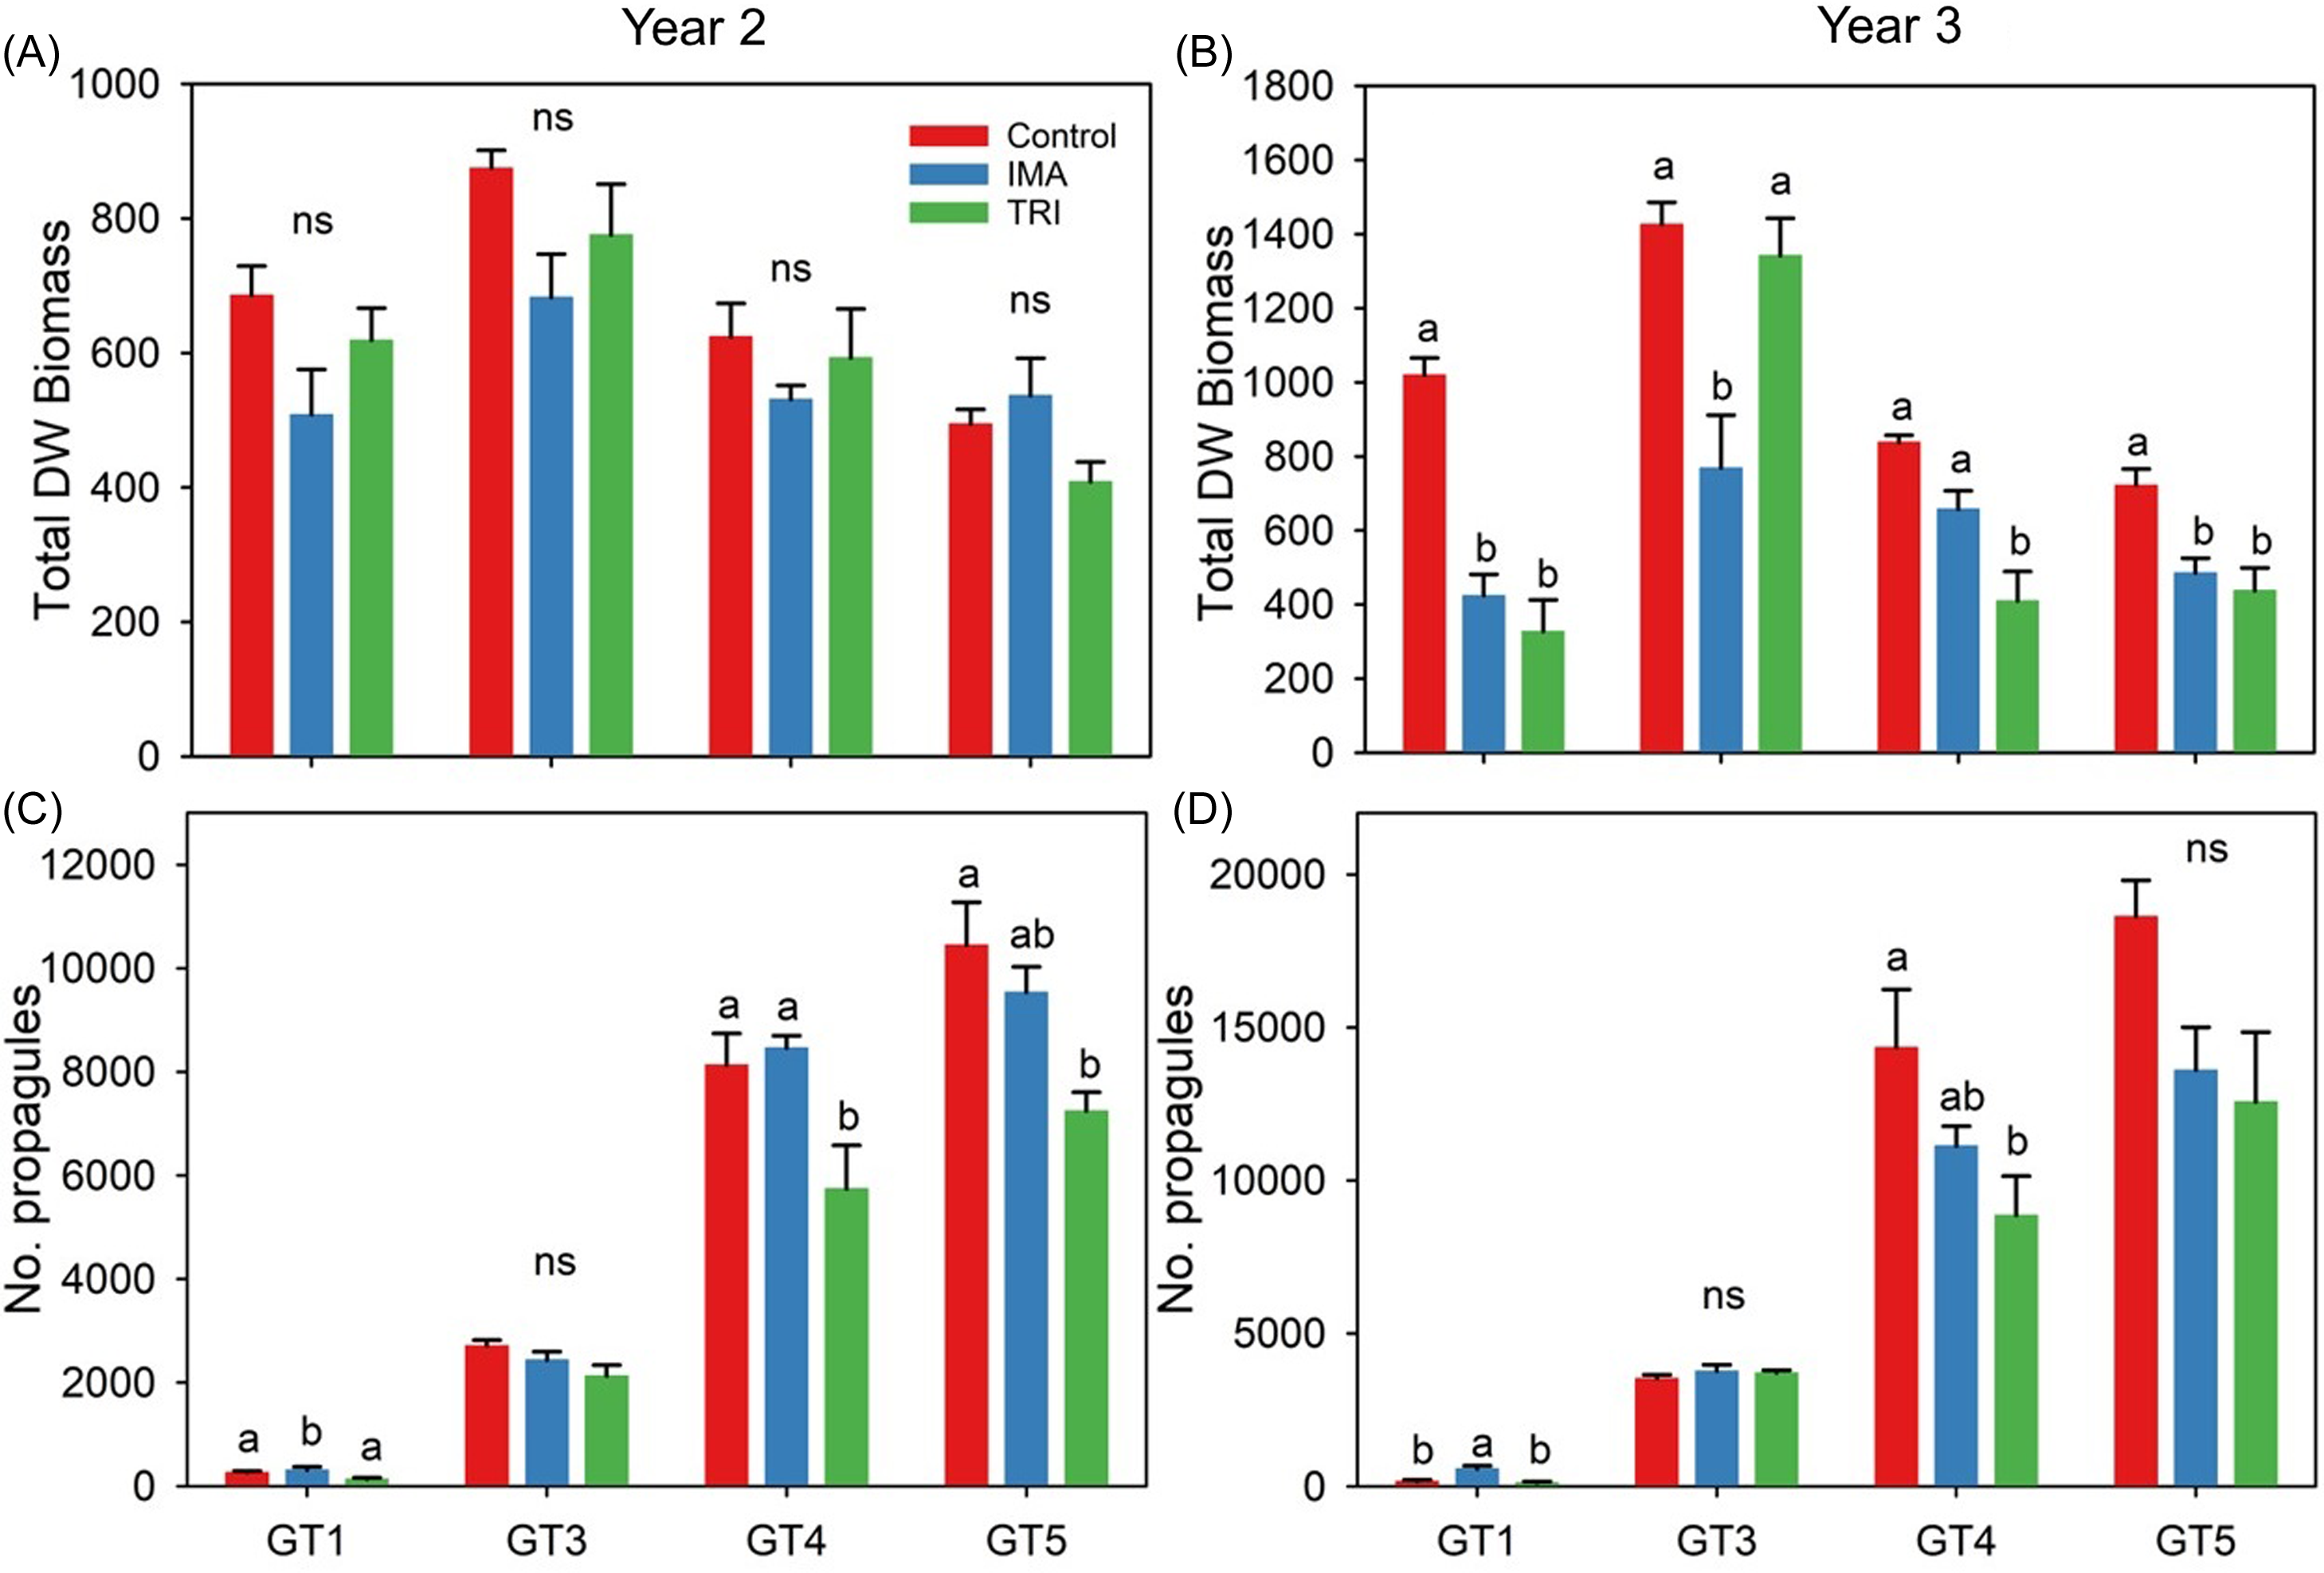
Figure 7. Mean (±SE) biomass (A and B) and propagule abundance (C and D) for Butomus umbellatus genotypes treated with herbicides for 1 yr (year 2) or 2 yr (year 3). Letters above bars represent significantly different means within each genotype, determined by Tukey post hoc test at α = 0.05. DW, dry weight; IMA, imazamox; ns, not significant; TRI, triclopyr. The B. umbellatus genotype GT1 is triploid, and genotypes GT3–GT5 are diploid.
In year 3, a significant two-way interaction (genotype by herbicide) was detected for total biomass (P = 0.001) and propagule abundance (P < 0.001). Overall, total biomass was reduced in all genotypes treated with either herbicide, but the magnitude of reduction was variable. The increased application rate of triclopyr in year 3 resulted in more rapid injury and a drastic decrease in aboveground biomass (e.g., leaves) in GT1, GT4, and GT5 plants by 4 wk after treatment (WAT). Short-term reduction of aboveground biomass was much less pronounced in GT3 plants. Following a slight decrease in mean number of leaves at 2 to 3 WAT, rapid plant recovery was observed, indicated by mean leaf number that exceeded the control by 8 WAT (Figure 3).
Triploid GT1 biomass was effectively reduced by 58% and 68% of the control using imazamox and triclopyr, respectively. Diploid plants were generally less sensitive to herbicide application. Imazamox reduced GT3 biomass by 46%, whereas triclopyr reduced biomass by an a nonsignificant 5% (Figure 6B). In contrast, diploid GT4 displayed the opposite pattern (imazamox reduced biomass by 21% and triclopyr by 51%), and GT5 plants were reduced equally by the two herbicide treatments (Figures 6 and 7). Generally, herbicide treatment effects ranged from a slight increase (5% to 6% increase in bulbils in GT3 plants) to a significant decrease (38% reduction in bulbils in GT4 plants treated with triclopyr) in propagule abundance. However, propagule abundance in year 3 was significantly greater (240%) in GT1 plants treated with imazamox compared with non-treated plants (Figure 7).
Management of invasive plants can be complicated by the genetic structure of the invasion, particularly if genotypes differ in the timing of growth or reproduction or display heterogenous responses to management tools such as biological and chemical control. In the current multiyear outdoor mesocosm study, we found differences in the timing of growth and flowering among invasive B. umbellatus genotypes, differences in the type and magnitude of vegetative propagation, and differences in plant susceptibility to two systemic herbicides. This study joins others that have documented differences among B. umbellatus genotypes in a range of traits, such as reproduction, competitive ability, nutrient use, herbivore and disease resistance, and salinity tolerance (unpublished data; Harms Reference Harms2020; Harms and Walter Reference Harms and Walter2021; Harms et al. 2020a, Reference Harms, Cronin and Gaskin2021a; Lui et al. Reference Lui, Thompson and Eckert2005). This is among the first studies to document vegetative spread of B. umbellatus plants over the course of a season, with implications for predicting spatial dynamics of newly establishing infestations (Carter Reference Carter2014).
Differences in genotype response to management can manifest in a number of ways. For example, quantitative differences in total biomass among treatments were not significant following harvest in the second year, but visual differences among genotypes in response to herbicides were apparent in both years following treatments. GT1 leaves exposed to triclopyr displayed chlorosis and greater auxin herbicide symptomology compared with diploid genotypes at 1 WAT (Figure 8). Epinasty, a common symptom in plants exposed to auxin herbicides, became apparent in inflorescences after they were treated, and stunting/malformation of inflorescences developed posttreatment was consistent across all triclopyr-treated plants up to 7 WAT. Visual observations of imazamox-treated plants indicated no new inflorescence production, and foliar chlorosis was still developing at 4 WAT. This result was expected, as imazamox quickly inhibited growth, and initial symptomology appeared as chlorosis in meristematic areas several weeks after treatment, followed by gradual foliar chlorosis and necrosis in susceptible plants (Shaner Reference Shaner2014). By 10 WAT, aboveground biomass (i.e., number of leaves) was reduced in imazamox-treated plants and greater in triclopyr-treated plants when compared with non-treated controls (Figure 3). Although propagule abundance decreased in diploid plants, it significantly increased (240%) in triploid GT1 plants treated with imazamox. This response is potentially a result of herbicide injury to the meristematic region of the plant, loss of apical dominance in individual rhizome apices, and subsequent prolific production of rhizome buds. Application of imidazolinone (e.g., imazamox) and sulfonylurea herbicides in some grass species have been reported to release tillers from apical dominance (Boutin et al. Reference Boutin, Lee, Peart, Batchelor and Maguire2000; Little and Shaner Reference Little, Shaner, DL and SL2017) and lead to increased lateral bud formation in woody and herbaceous landscape plants (Hurt and Vencill Reference Hurt and Vencill1994). Furthermore, imazamox has been documented to stimulate tuber production in yellow nutsedge (Cyperus esculentus L.) when compared with non-treated plants (Nelson and Renner Reference Nelson and Renner2002). The mean weight of rhizome buds from imazamox-treated GT1 plants was considerably smaller (0.10 g) compared with control (0.16 g) and triclopyr-treated (0.19 g) GT1 plants. As such, it could be speculated that a large proportion of buds may not be viable and/or are less likely to develop significant aboveground biomass to support further ramet establishment and prolific bud production. Previous research by Carter et al. (Reference Carter, Madsen and Ervin2018) indicated individual triploid rhizome buds required ≥10 wk of growth before developing a new bud, and the majority failed to produce a new bud over the course of the 12-wk study. Regardless, management actions should incorporate efficient monitoring protocols to ensure follow-up treatments are administered as needed so that long-term control objectives are accomplished.
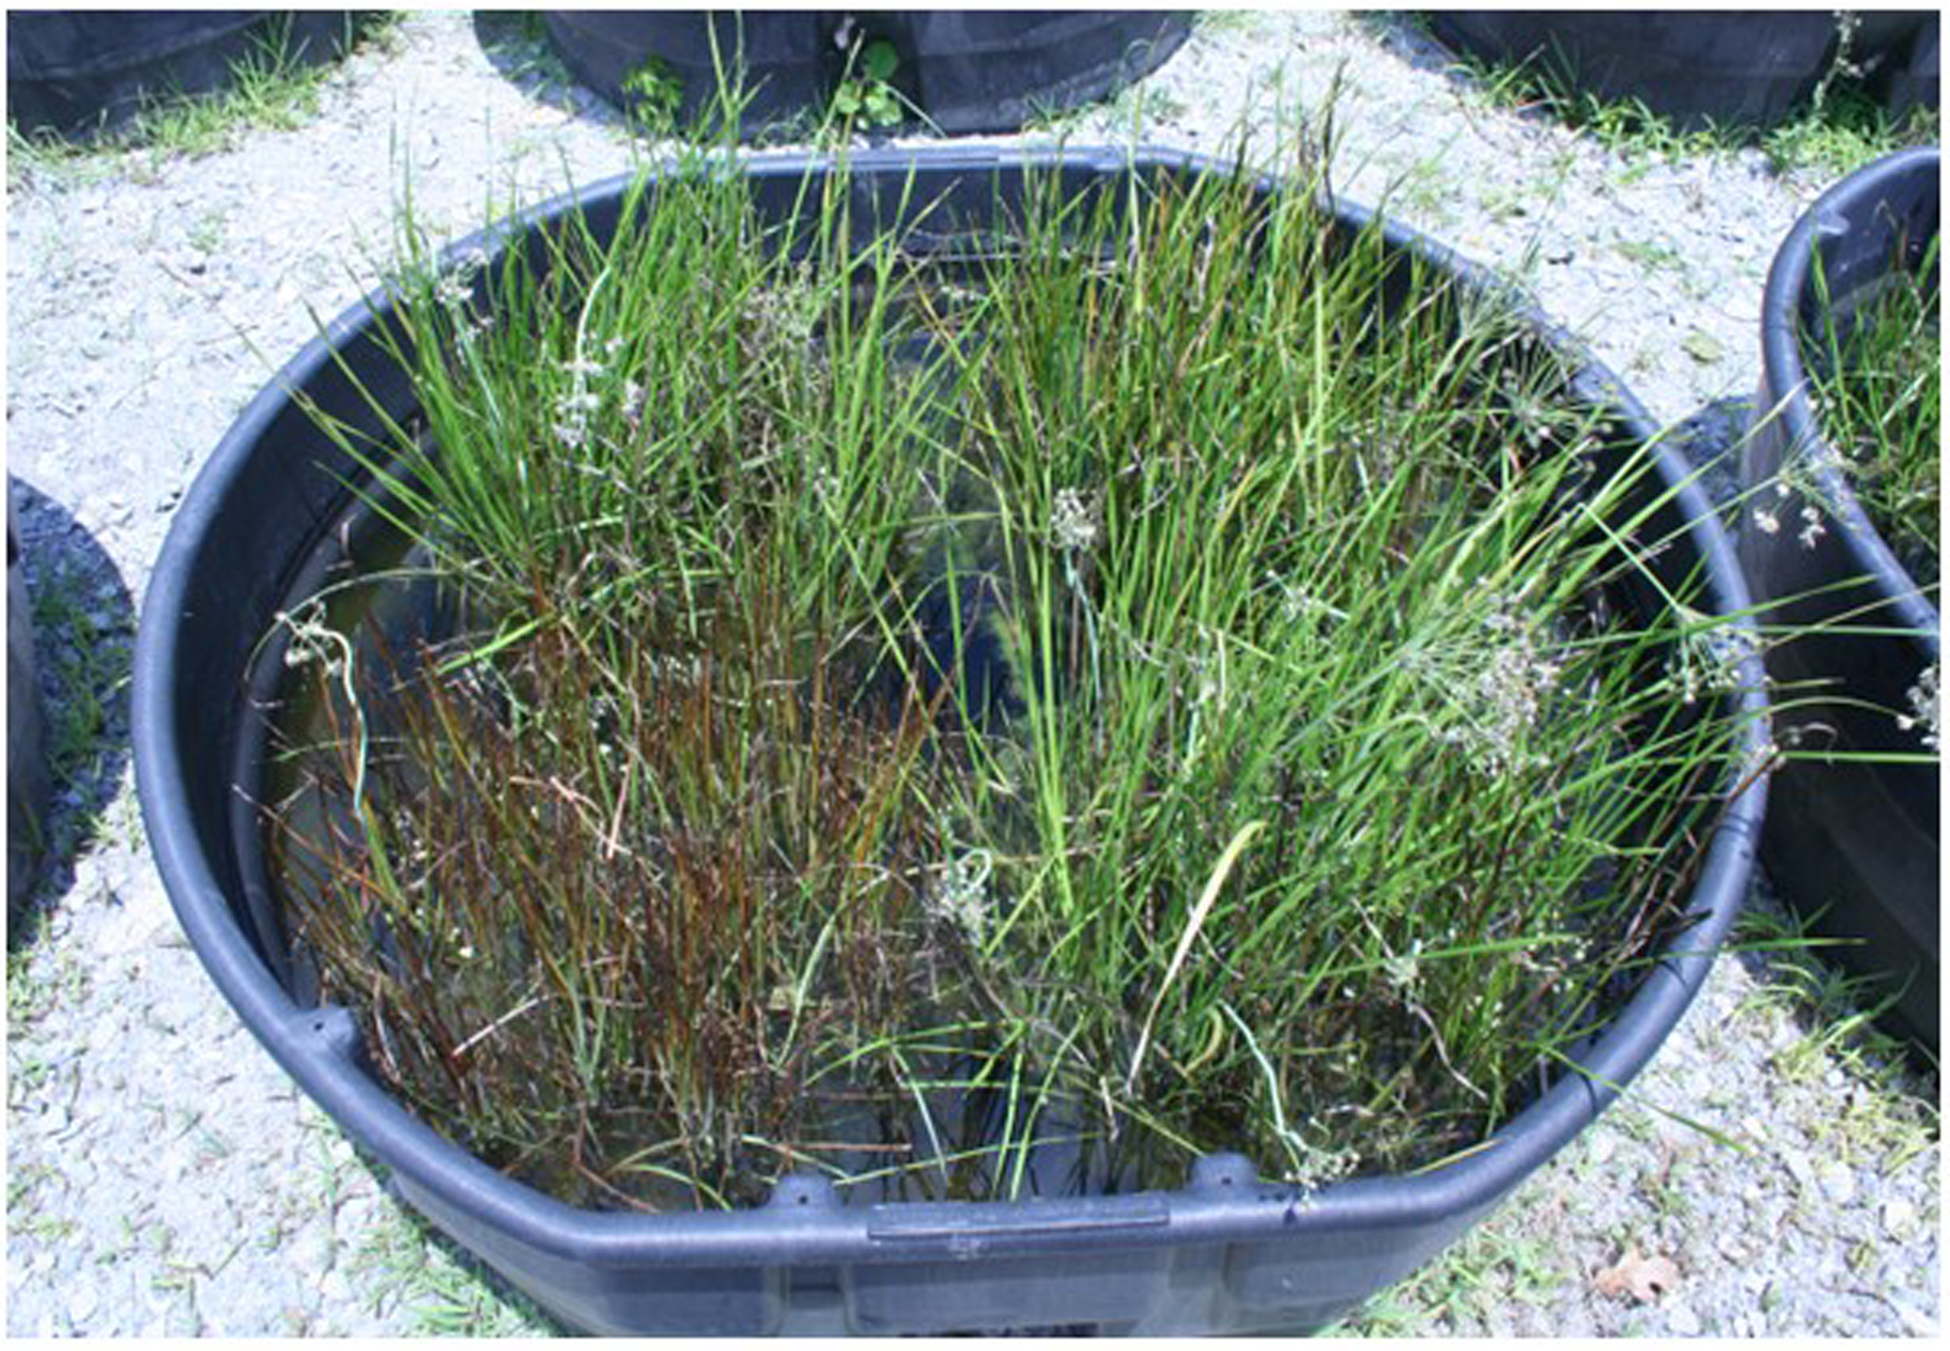
Figure 8. Butomus umbellatus tanks 1 wk after treatment with triclopyr. Clockwise from the lower left position of the tank, plants are triploid genotype GT1, diploid GT5, diploid GT3, and diploid GT4.
The ability to predict B. umbellatus genotype response to chemical control measures is important for management decisions, because it determines when and where to use available tools. Our study indicated that B. umbellatus genotypes differ significantly in their response to herbicide treatments; generally, triploid plants are more susceptible than diploid plants. Although total biomass was reduced in triploid GT1 plants treated with imazamox, resources were disproportionately allocated to vegetative propagation; the number of propagules (rhizome buds) in imazamox-treated GT1 plants was significantly greater than in non-treated control plants. Overall, mean propagule abundance (rhizome bulbils) was substantially higher in diploid plants compared with triploid plants, but it is unclear how the differences in type (rhizome bud vs. bulbil) and abundance translate to spread and implementing effective management. Overall, annual herbicide treatment in consecutive years improved B. umbellatus control, and our study further supports the notion that a single annual herbicide treatment is likely ineffective at achieving significant long-term control. Thus, consecutive annual herbicide treatments are likely necessary to achieve sustained management success.
Few aquatic invasive plant management mesocosm experiments take place over multiple years or are conducted at a scale that represents field conditions. This may be due to the costs and level of effort associated with conducting such a study (Netherland and Getsinger Reference Netherland and Getsinger2018). At a minimum, it is important to use appropriately sized containers that allow unimpeded growth for the life of the experiment (Wersal and Madsen Reference Wersal and Madsen2018) and to include an appropriate pretreatment period to allow proper plant establishment. We used relatively large (58-L) containers to grow each B. umbellatus replicate and followed growth over three growing seasons. Plants quickly spread to reach the perimeter of experimental containers by the middle of the second growing season. However, growth and biomass accumulation continued through the end of the third year. Thus, although we discontinued spread measurements after the first year, we continued to document and compare biomass differences into second and third years. Additionally, the length of time plants were grown before making observations on differences in biomass, reproduction, or response to herbicides was clearly important. For example, we found triploid GT1 plants had similar or less biomass than diploid genotypes GT4 and GT5 initially (at the end of the first growing season), but ultimately had 20% and 34% more biomass than GT4 and GT5 plants at the end of the experiment (at the end of the third growing season). Thus, we echo the call from previous authors in suggesting that size and temporal scale are important considerations when undertaking management studies of invasive plants (Netherland and Getsinger Reference Netherland and Getsinger2018).
These results contribute to the growing body of work highlighting the importance of (1) understanding genetics of invader populations and (2) determining how populations differ in their response to management actions. The aquatic and wetland invader B. umbellatus has been the subject of much study in the United States, because it is widely distributed, has distinct genotypes, and impacts the use of water resources. Future work should continue to account for genetic differences between populations to develop cost-effective and efficacious management tools. There should also be a push to integrate information about genotype-specific growth, reproduction, and susceptibility to management into the decision-making process and when prioritizing locations for control or modeling potential control outcomes.
Supplementary material
To view supplementary material for this article, please visit https://doi.org/10.1017/inp.2025.16
Acknowledgments
The use of trade, product, or firm names in this report is for descriptive purposes only and does not imply endorsement by the U.S. government. The tests described and the resulting data presented herein, unless otherwise noted, were obtained from research conducted under the Aquatic Plant Control Research Program of the U.S. Army Corps of Engineers by the USAERDC. Permission was granted by the Chief of Engineers to publish this information. The findings of this report are not to be construed as an official Department of the Army position unless so designated by other authorized documents. This work was supported by the U.S. Army Engineer Research and Development Center Aquatic Plant Control Research Program under the management of Michael Greer. The authors also thank Caitlin Strickland, Blake DeRossette, Bailey Coomes, Sandor Dibble, Alan Katzenmeyer, Ian Knight, Megann Harlow, Andre Le Van, Juliet Jackson, Annie Huang, and Courtney Bell for assistance setting up, maintaining, or harvesting this study.
Funding statement
This research was funded by the U.S. Army Engineer Research and Development Center Aquatic Plant Control Research Program under the management of Michael Greer.
Competing interests
The authors declare no competing interests.


 Open access