In February 2025, German voters will vote for the fifth time since 1949 in early federal elections. In 1972 and 2005, the minority positions of Willy Brandt and Gerhard Schröder, respectively, in the Bundestag led to new elections. In 1990, the elections were triggered by reunification and the fall of the Berlin Wall. In 1983, the early elections were the result of a change of alliance by the Free Democratic Party (FDP). It is impossible to draw a general rule on the effect of a dissolution on the electoral score of the outgoing chancellor’s party because the incumbents were reelected only two times out of four. In 2024, the departure of the FDP due to disagreement on economic policy, among other issues, ended the “tricolor” or “traffic-light” Social Democratic Party (SPD)–Greens–FDP coalition. For forecasters, these elections represent a challenge not only because of their unexpected nature but also due to multiple parties in the German political landscape.
For forecasters, these elections represent a challenge not only because of their unexpected nature but also due to multiple parties in the German political landscape.
Although the study of German voting functions had been the subject of little research, since 1998, we have regularly proposed political-economic forecasts of the Bundestag elections, whether in press articles such as Le Figaro (Jérôme, Jérôme-Speziari, and Lewis-Beck Reference Jérôme, Jérôme-Speziari and Lewis-Beck1998, Reference Jérôme, Jérôme-Speziari and Lewis-Beck2002) or other media, audiovisual content, and websites (Jérôme, Jérôme-Speziari, and Lewis-Beck Reference Jérôme, Jérôme-Speziari and Lewis-Beck2009; Jérôme-Speziari Reference Jérôme-Speziari2005). Because these innovative works had a certain success, we invested in peer-reviewed outlets, notably through publications in this journal (Jérôme, Jérôme-Speziari, and Lewis-Beck Reference Jérôme, Jérôme-Speziari and Lewis-Beck2013, Reference Jérôme, Jérôme-Speziari and Lewis-Beck2017, Reference Jérôme, Jérôme-Speziari and Lewis-Beck2022). Our political-economic models correctly predicted the winner five times in the seven elections from 1998 to 2017, as well as the nature of the coalitions (e.g., in 2009 and 2017, when Angela Merkel governed “in a grand coalition” with the SPD). However, our models failed in 2002, when our single-equation voting function did not anticipate the narrow victory of the Green Party (the Greens) over the FDP; and in 2021, when Olaf Scholz’s SPD won by “surprise.”
Our modeling strategy has adapted to the changes in the party structure of German parties in the past 25 years. In 2013, we attempted to better integrate the institutional features of proportional representation (PR) and the multiparty system, which have become more complex with new parties likely to win seats. Of course, this has increased the number of hypothetical coalitions. We therefore turned to a seemingly unrelated regression (SUR) model (Zellner Reference Zellner1962). This approach, which explicitly considers both large and small parties, was particularly beneficial in 2017 when the more extreme parties of the Alternative for Germany (AfD) and the Left Party won almost 22% of the vote, which forced the SPD and the Christian Democratic Union/Christian Social Union (CDU/CSU) to form a grand coalition.
However, in 2021, the SUR model had placed the CDU/CSU in the lead, followed by the SPD and the Greens. Everything suggested that the grand coalition would be renewed. Instead, Scholz’s SPD narrowly beat the CDU/CSU led by Merkel’s successor, Armin Laschet, who was preferred over the more popular Bavarian Prime Minister Markus Söder. Ultimately, the SPD would build a “traffic-light” coalition with the Greens and the liberal democrats of the FDP.
Nevertheless, the model’s early forecast (June 2021) was unable to record certain phenomena that had accumulated a month before the election. The indicator of preference for the chancellor—the only popularity variable available for the voting functions of those supporting the outgoing chancellor (INCMAIN) and his main challenger (OPPMAIN)—witnessed a reversal of the trend between Scholz and Laschet, whose campaign collapsed following numerous communication errors that ruined his credibility. Furthermore, from mid-August 2021, the voting intentions of Annalena Baerbock’s Greens and the Linke Parteï (the Left) collapsed in favor of Scholz. On the Right, the CDU/CSU suffered from the progress of the AfD and the Freie Wälher Parteï (FW) (Free Voters party), a diverse right-wing sovereigntist party initially created in Bavaria in 2009 that achieved its best score of 2.4% in 2021. Finally, the FDP—a pivotal party in German political life—received 11.5% of the vote.
This last-minute fluidity between the electorates of ideologically similar parties was described by political scientist Éric Dupin (Reference Dupin1989) as a phenomenon of “cousin electorates.” Thus, in 2021, our main equations, INCMAIN and OPPMAIN (see the dataverse appendix, pp. 2–3, and table 1, p. 9), did not include the voting intentions for the outgoing SPD and its main challenger, the CDU/CSU,Footnote 1 as well as the popularity indicator for the chancellor. The following section discusses the steps taken to overcome these challenges.
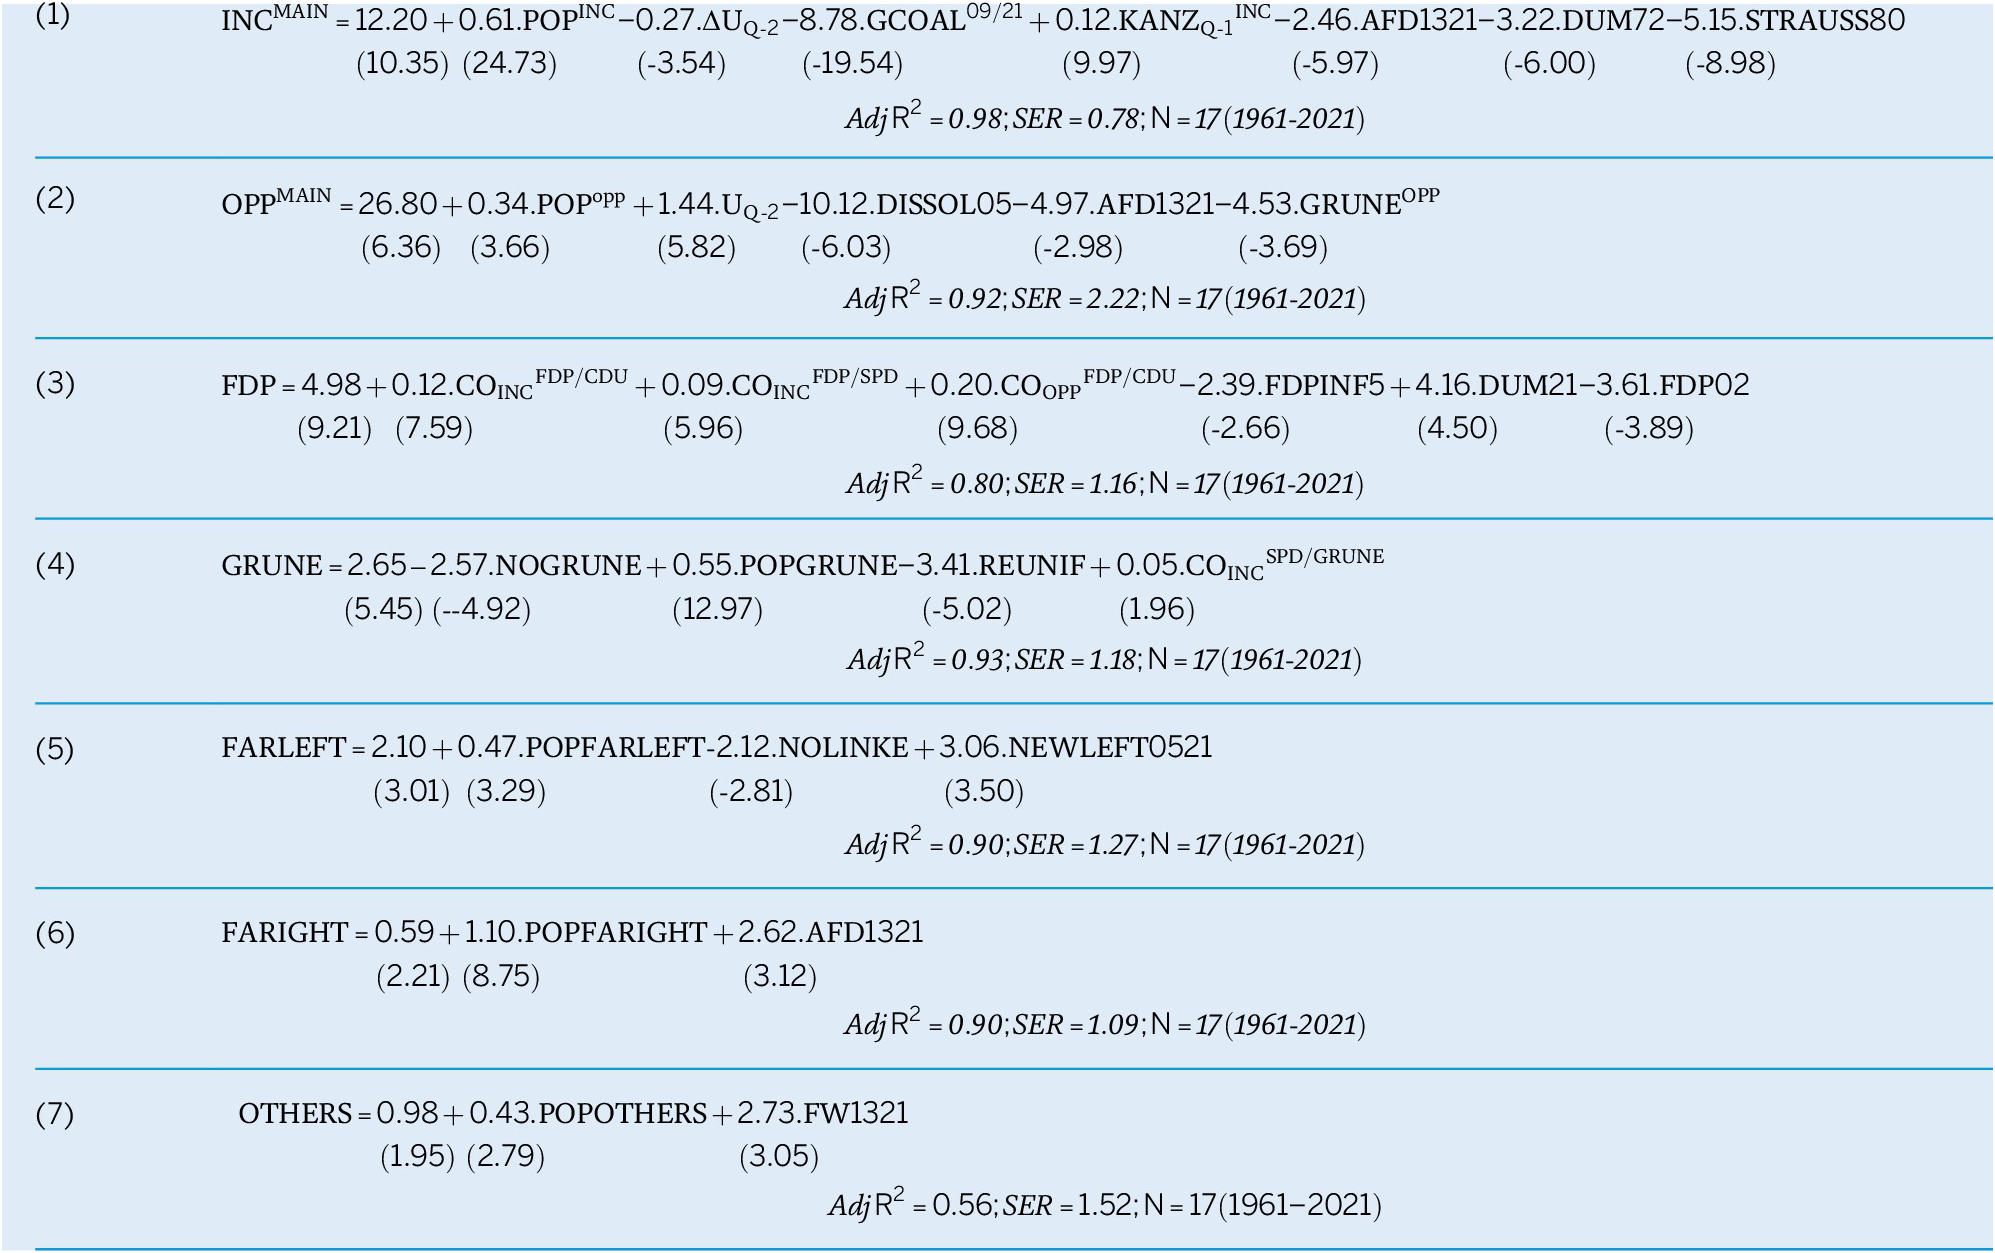
Table 1 Vote functions-SUR estimates

Note: t-stats (two-tail) are between brackets
METHODOLOGICAL CHANGES COMPARED TO 2021
For the early federal elections of 2025, we made modifications to capture the unexpected changes in voter preferences.Footnote 2 This first led us to insert the voting intentions (one quarter before the election) for the party of the incumbent chancellor (POPINC) and the main opponent (POPOPP), respectively, in equation (1) of the incumbent vote (INCMAIN) and in equation (2) of the challenger vote (OPPMAIN). To consider the increasing electoral weight of the AfD, we made the voting function (6) of the Far Right (FARIGHT) autonomous, whereas it had been merged into equation (7) of the other parties (OTHERS) in 2021 (Jérôme, Jérôme-Speziari, and Lewis-Beck Reference Jérôme, Jérôme-Speziari and Lewis-Beck2025). (It should be noted that the Far Right has been present in German legislative elections since 1949.)
We reestablished a “classical” political-economic model by returning to the system of voting equations (now seven) followed by a system of swing ratios transforming votes into seats. In 2021, the direct forecast of the percentage of seats made it possible to reduce the size of the cumulative errors, but there were two drawbacks. It did not make it possible to predict whether certain parties risked being eliminated from the distribution of seats by not crossing the 5% threshold. It also did not allow estimation of the premium (or discount) in seats resulting from the PR system with double voting (i.e., Erststimme and Zweitstimme). The following section discusses the practical aspects of the modeling exercise.
THE POLITICAL-ECONOMIC MODEL: FOUNDATIONS AND OPERATIONALIZATION OF VARIABLES
The underlying theory of our model is based on the hypothesis of government responsibility, which sets up a punishment/reward logic for the candidates (Key Reference Key1966). Depending on the economic and political results attributed to it, which constitute its record, the outgoing government receives an electoral bonus in the event of good performance and experiences an electoral cost in the event of poor performance. The modeling of the chancellor’s party and the opposing party most closely reflects this idea of retrospective reward/punishment. The specifications of our equations align with standard voting functions containing macroeconomic data and survey measures of the executive’s popularity (Lewis-Beck and Stegmaier Reference Lewis-Beck and Stegmaier2013). The final form of the model, however, can be considered synthetic because we incorporated voting intentions for political parties (Lewis-Beck, Nadeau, and Bélanger Reference Lewis-Beck, Nadeau and Bélanger2016).
In the German case, the endogenous variable of the main party of the incumbent coalition (INCMAIN) measures the percentage of votes of the chancellor’s party CDU/CSU or SPD (or of the candidate designated by his or her side). Similarly, the dependent variable of the main opposition party (OPPMAIN) measures the percentage of votes of the main opponent of the outgoing chancellor. For the explanatory economic variable, we used a variation of the unemployment rate that is, ΔUQ-2 measured two quarters before the election over the duration of the elapsed mandate. When the variation is positive, the main outgoing party experiences an electoral cost and the main opponent receives an electoral bonus.
The exogenous variable of preference for the incumbent chancellor (i.e., KANZQ-1INC; see the dataverse appendix, p. 2) or the representative of his or her side measures one quarter before the election (Norpoth and Gschwend Reference Norpoth and Gschwend2010). The electoral premium for the latter results from the benchmark with the incumbent’s main challenger. (We chose not to use this variable in equation (2) OPPMAIN considering that this type of evaluation is ambiguous because the challenger does not have a record.)
Our SUR voting model (see the dataverse appendix, pp. 6–8), estimated using the elections from 1961 to 2021, consists of a system of seven equations. The first two endogenous variables mentioned previously (1 and 2) constitute the two classic equations: one expresses the votes obtained by the main incumbent party (i.e., the SPD in 2025) and the other explains the main opposition party (i.e., the CDU/CSU in 2025). The other five equations explain the percentage of votes for (3) the FDP (Free Democrats); (4) the Greens (GRUNE); (5) the Far Left (FARLEFT; mainly the Linke and ex-Party of Democratic Socialism [PDS])Footnote 3; (6) the Far Right (FARIGHT), whose main component is the AfD; and (7) the other parties (OTHERS).
According to Powell and Whitten’s (Reference Powell and Whitten1993) hypothesis on “clarity of government responsibility,” smaller parties should be considered less responsible for the results of the outgoing government. It follows that voting for the FDP should be more prospective than retrospective. Voters then will express their desire (or not) to see it included in a new coalition. (The FDP, often a pivotal party, means that this variable has been measured by German pollsters for 50 years.) We therefore distinguished the case in which the FDP is outgoing with the CDU (COINCFDP/CDU) or the SPD (COINCFDP/SPD) and the case in which it is in opposition with the CDU (COOPPFDP/CDU). Regarding the other parties, the main characteristics of the equations are defined as follows.
The percentage of votes for the Greens depends mainly on the strength of their opposition (POPGRUNE) as measured in the polls (i.e., IFD Allensbach and ZDF-Politbarometer). In addition to this are the “preferred coalitions” when the Greens are in power with the SPD (COINCSPD/GRUNE). When the Greens are included in a preferred coalition with the SPD, while they are in power, they should receive a bonus from the incumbent.Footnote 4 For the Far Left (FARLEFT), POPFARLEFT (see the dataverse appendix, p. 5) measures the strength of voting intentions in the polls (i.e., IFD Allensbach and ZDF-Politbarometer). The dummy variable NEWLEFT measures the average electoral bonus earned by the “new” parties of the “left of the left” from 2005 to 2021, which are competitors of the SPD and the Greens.
At this stage, our modeling of the Far Right (see the dataverse appendix, p. 5) can be only preliminary given that the AfD was created as recently as 2013. Thus, we evaluated the premium for the Far Right in general via a dummy variable (AfD1321). The main variable in this function is the voting intentions for the extreme right, including the AfD. Finally, the share of other parties in the polls (OTHERS) is explained by the voting intentions in the polls for other parties (POPOTHERS)—knowing that the free voters of the FW now occupy an important place in this bloc (IFD Allensbach).
In addition to the theoretical specifications of these equations, specificities of the German electoral rules must be considered—for example, the threshold of 5% of the votes. In general, parties that do not exceed the threshold of 5% of the votes cannot obtain seats. In addition to the AfD, this situation affected the FDP in 2013 and the PDS in 1994. To account for this in the case of the FDP, we used the dummy variable FDPINF5. Other indicator variables also were used to indicate that the Greens and Die Linke did not participate in the elections (i.e., NOGRUNE from 1961 to 1976 and NOLINKE from 1961 to 1987).
In addition to the consequences of electoral rules, changes in the nature of coalitions, electoral strategies, and institutional arrangements have modified the results at the ballot box. For example, when the Greens are in opposition, it has a negative effect on SPD votes. The creation and rise of the AfD also had a negative effect on the votes of both the chancellor’s party and the main opposition party. Furthermore, the early federal elections of 1972 (DUM72), following Willy Brandt’s defeat in the Bundestag, had a negative impact on his SPD incumbents even though the SPD was reelected.
On the one hand, in 2005 (DISSOL05), the defeat of Gerhard Schröder—who, according to some, wanted to provoke a “strategic” dissolution before the end of the term—cost the CDU/CSU points. On the other hand, the outgoing chancellor had not imagined that the FDP would overtake its Green allies. Nevertheless, regarding the FDP, the prospect of becoming a supporting party in 2021 (DUM21) resulted in an average electoral bonus of 4.16% of the votes, to the detriment of the CDU. Finally, a major political change occurred with the reunification (REUNIF) in 1990, when the Greens emerged and whose presence has been maintained until today. These complexities obviously pose challenges for estimating the modeling outcomes, which are discussed in the following section.
THE SUR MODEL ESTIMATES
Using the previously mentioned equations and variables, we estimated the SUR model for each of the voting functions. The estimated coefficients served as the basis for our forecasts of the parties’ votes for the February 2025 federal elections. The SUR model is presented in table 1. The coefficients of determination indicate the strength of the equations. For the two main equations predicting support of or opposition to the main parties (INCMAIN and OPPMAIN), SPD and CDU/CSU, the adjusted R²s are 0.98 and 0.92, respectively. Similarly, their regression standard errors (SER) are satisfactory, from 0.78 to 2.22 points, respectively. For the smaller parties, these statistics also are solid, with the adjusted R² ranging from 0.93 to 0.56 and the SER from 1.09 to 1.52. The equation for the other parties (OTHERS) is the least predictable.
FORECASTS FOR FEBRUARY 2025
To forecast the seats share of the parties,Footnote 5 the current values were inserted into the equations, as follows:
 $$ {\displaystyle \begin{array}{l}{\mathrm{U}}_{\mathrm{Q}\hbox{-} 2}=0.1\%\left(\mathrm{Change}\ \mathrm{June}\;\left(\mathrm{t}\right)\hbox{--} \mathrm{June}\;\left(\mathrm{t}\hbox{-} 4\right)\right);{{\mathrm{KANZ}}_{\mathrm{Q}\hbox{-} 1}}^{\mathrm{INC}}=\\ {}43\hskip-0.12em \%\hskip-0.12em \left(\mathrm{O}.\mathrm{Scholz}\right);{\mathrm{POP}}^{\mathrm{INC}}\hskip-0.3em =\hskip-0.2em 15\hskip-0.12em \%\left(\mathrm{SPD}\right);{\mathrm{POP}}^{\mathrm{OPP}}\hskip-0.3em =\hskip-0.3em 37\%\hskip-0.12em \left(\mathrm{CDU}\hskip-0.3em /\hskip-0.2em \mathrm{CSU}\right);\\ {}{{\mathrm{CO}}_{\mathrm{INC}}}^{\mathrm{FDP}/\mathrm{CDU}}=0\%;{{\mathrm{CO}}_{\mathrm{INC}}}^{\mathrm{FDP}/\mathrm{SPD}}=0\%;{{\mathrm{CO}}_{\mathrm{OPP}}}^{\mathrm{FDP}/\mathrm{CDU}}=0\%;\\ {}\mathrm{POPGRUNE}=10\%;{{\mathrm{CO}}_{\mathrm{INC}}}^{\mathrm{SPD}/\mathrm{GRUNE}}=11\%;\mathrm{POPFARLEFT}=\\ {}7.5\%;\mathrm{NEWLEFT}0521=3.06;\mathrm{POPAFD}=17;\mathrm{DUMAFD}=2.62;\\ {}\mathrm{POPOTHERS}=9.5\%;\mathrm{FW}1321=2.73\end{array}} $$
The forecast calculation method proceeded in four stages. First, we generated the estimated coefficients of the seven equations of the SUR equation system, which we applied to the values shown in the box. As can be the case with this type of estimate, the total of predicted votes often is different from 100; therefore, we obtained raw-vote results the total of which was greater than 100. In the second stage, we normalized these results, returning them to a total of 100. The third stage estimated a system of swing-ratio equations (i.e., SUR) to transform the votes into seat percentages (see the dataverse appendix, pp. 13–15). We then applied the estimated swing-ratio coefficients to the normalized voting data (figure 1). In the fourth stage, we normalized the seat-share percentages obtained before calculating the predicted seats at the Bundestag for each bloc (figure 2) on the basis of the 2021 total seats (i.e., 736) (see the dataverse appendix, p. 15).

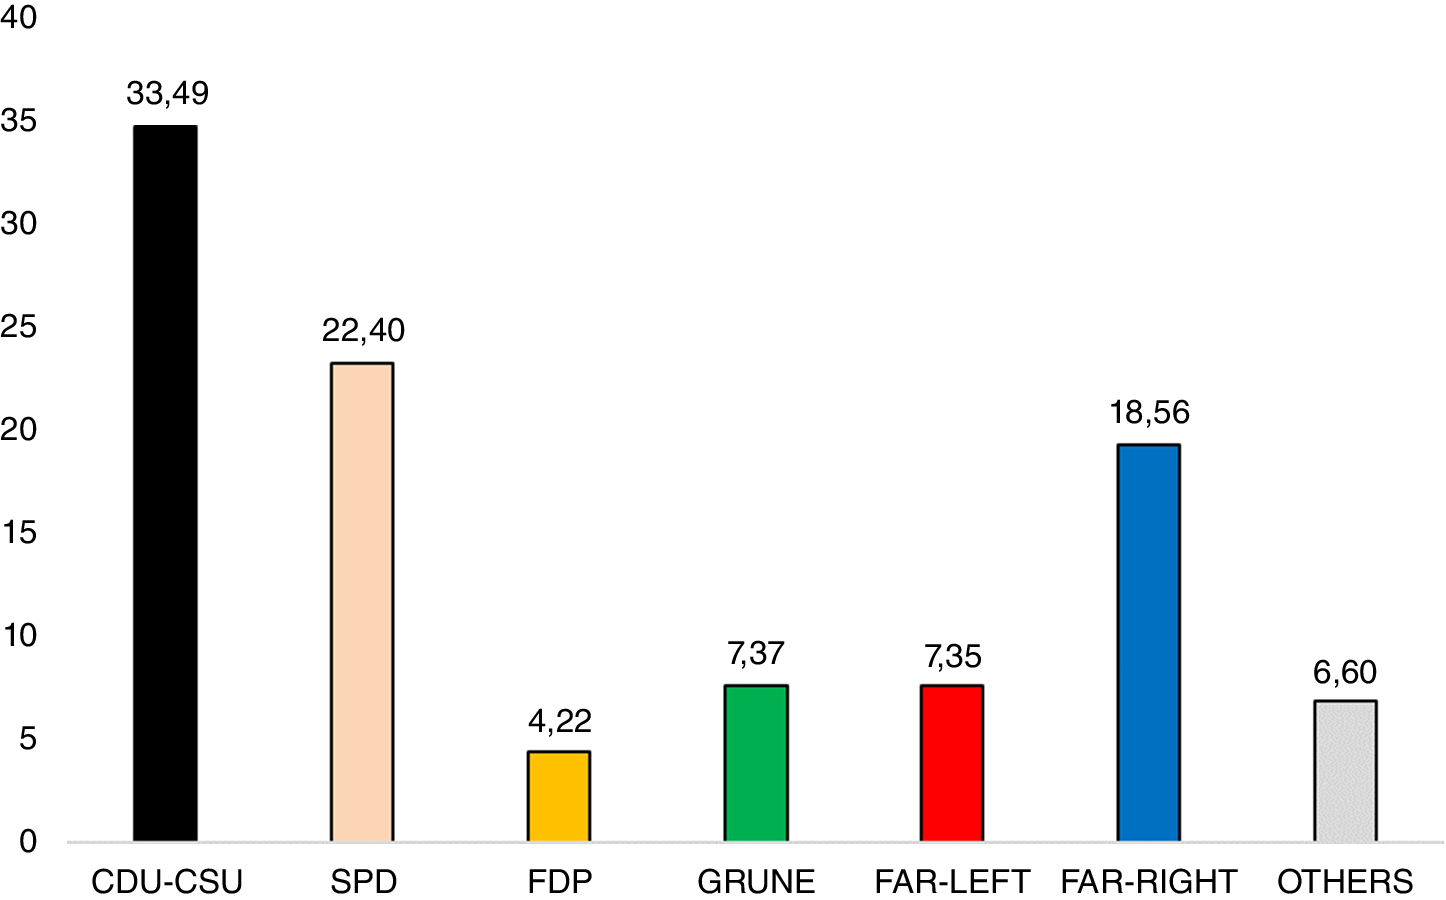
Figure 1 Vote-Share Forecast (%), December 2024

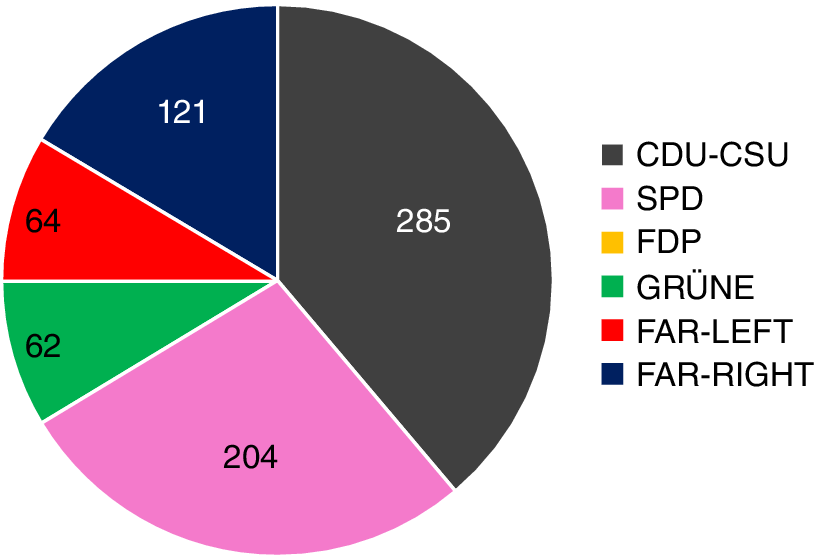
Figure 2 Seats Forecast, December 2024
We implicitly mentioned the question of forecast accuracy by referring to the satisfactory level of SER in our voting equations. However, we completed this indicator by calculating the root mean squared error (or Theil’s U coefficient). The low average error affecting the vote forecast, according to this definition, ranges from 0.57 (INCMAIN) to 1.89 (OPPMAIN) (see the dataverse appendix, p. 15). The error affecting the other equations is less than 1.4. Beyond this overall observation, however, a study of the graphs comparing the respective patterns of forecast and actual votes (see the dataverse appendix, pp. 9–12) for the seven political blocs reveals that for OPPMAIN, FARIGHT, GRUNE, and FARLEFT, forecasts deviate slightly more frequently from actuals at other recent dates. In the two latter cases, this may be indicate porosity between the ecologist and non-SDP left-wing electorates. This argument also is valid in the two former cases, underlining the fact that the CDU/CSU and the AfD will be competing for market share on the Right until the end of the elections. This does not exclude last-minute variations in voting, according to Dupin’s (Reference Dupin1989) hypothesis.
In December 2024, the CDU/CSU led by Friedrich Merz was expected to win with 33.5% of the vote and 38.7% of the seats (i.e., 285 of 736 seats in 2021), which remains far from the absolute majority (see figures 1 and 2). Contrary to the pessimistic forecasts of the polls, Olaf Scholz should limit the damage with 22.4% of the votes and 28% of the seats—that is, approximately the same number of 204 seats as in 2021. Given these percentages and the goal of achieving a majority share in the legislature, it seems most likely that the grand coalition will return to power.
In December 2024, the CDU/CSU led by Friedrich Merz was expected to win with 33.5% of the vote and 38.7% of the seats (i.e., 285 of 736 seats in 2021), which remains far from the absolute majority.
Furthermore, our forecast indicates that the FDP, with 4.2% of the vote, would not cross the 5% mark and, therefore, would not be able to claim any seats (see figures 1 and 2). The Greens and the Far Left would be almost equal with 7.3% of the vote, which would give them 64 and 62 seats, respectively. Finally, the AfD of the extreme right would make a breakthrough, with 18.5% of the vote and almost 121 seats in the Bundestag. It should be noted that the economy will have a slightly different role than usual in the upcoming federal elections. The increase in unemployment during the past term was only 0.1%. Thus, the electoral cost for Scholz will be limited, as will the potential gain for Merz. Therefore, the outcome will depend on the credibility of the outgoing chancellor and the political parties as well as the desired coalitions.
DISCUSSION
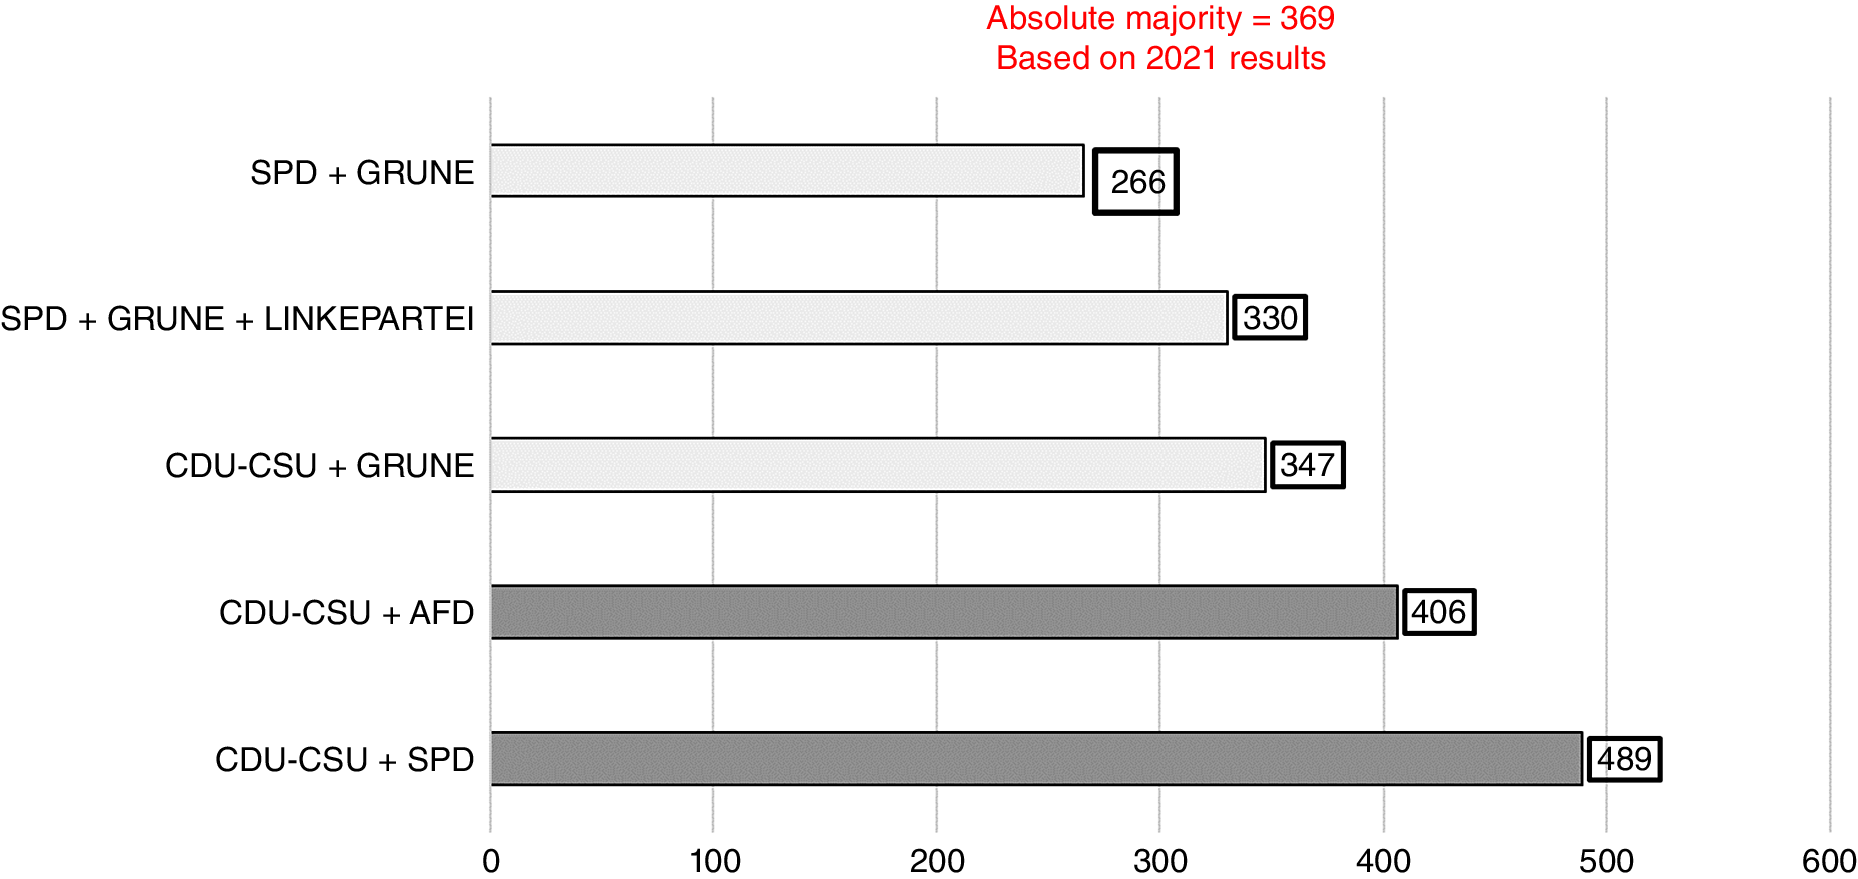
By examining the various hypothetical coalitions (figure 3), we observed that only two coalitions could achieve an absolute majority if the FDP is eliminated. A right-wing “blue” CDU/CSU–AfD coalition would cross the majority threshold, with 406 seats. However, even if Merz is more conservative than his predecessors, the respective positions of the two parties on European issues make their convergence very delicate. It is worth noting that the FDP is at risk of being eliminated again as in 2013. According to the Politbarometer poll of November 2024, only 7% of Germans want a CDU/CSU–FDP coalition and none wants a coalition with the SPD alone or SPD–Greens. The Free Democrats apparently have paid dearly for their exit from the outgoing coalition.

Figure 3 Hypothetical Coalitions, December 2024
Conversely, a new grand coalition of CDU/CSU–SPD could gain 489 seats. Incidentally, 30% of Germans want such a configuration (Politbarometer of November 2024). This coalition assumes that the SPD achieves a score aligned with our political-economic forecast, which is not convergent with the polls of November 2024, in which it receives 15% of the votes.
…a new grand coalition of CDU/CSU–SPD could gain 489 seats.
However, in the preferred chancellor popularity indicator, Scholz is almost on a par with Merz (i.e., 43% versus 46% in favor; Politbarometer). This means that the SPD could perform somewhat better than expected in terms of voting intentions. There also remains what forecasters call the “black swans” and, in reference to table 1, also could be called “uncontrolled exogenous shocks.”Footnote 6
In this sense, the Magdeburg car attack of December 21, 2024, could have electoral consequences in February 2025. It depends on whether voters will hold accountable the outgoing chancellor as well as the governing parties that preceded him. If this were the case, the AfD could emerge even stronger, thereby weakening the bloc of parties in government—whose base could fall to less than 50% of the votes. In these circumstances, a coalition with the Greens would prove indispensable to prevent political deadlock, but at the cost of probable political instability given the great divergences in terms of both economic policy and the issues of immigration and aid to Ukraine. So far, however, the Kenyan coalitionFootnote 7 has never been attempted at the national level.
DATA AVAILABILITY STATEMENT
The editors have issued an exception to the Data Availability Policy for this manuscript. It was part of an expedited process associated with the symposium on ‘Forecasting the 2025 German Election’ before upload and verification of replication materials. Between initial acceptance on 20 February 2025 and 31 October 2025, and after extended correspondence between the editors and authors, the editorial team was able to reproduce part of the results in the paper using the materials the authors provided on Dataverse. The provided replication files do not include the necessary materials to reproduce Figures 1–3 in the manuscript, as well as all figures in section A4 of the Appendix. Future election forecasting symposia will require the submission of replication materials simultaneously with the initial submission of the manuscript. The data is available at the PS: Political Science & Politics Harvard Dataverse at https://doi.org/10.7910/DVN/BZZAWT.
CONFLICTS OF INTEREST
The authors declare that there are no ethical issues or conflicts of interest in this research.