


1. Introduction
Choice architecture can be used to influence people’s choices via rational or non-rational persuasion (Feltz and Cokely, Reference Feltz and Cokely2024, Chapter 7; Hausman and Welch, Reference Hausman and Welch2010). For example, researchers interested in increasing people’s willingness to drink recycled water (Dolničar and Saunders, Reference Dolničar and Saunders2006) could aim to support informed decision-making by providing people with transparent risk communications, including accurate and relevant evidence on the risks and benefits of water recycling programs (e.g., educational boosts that promote rational agency).Footnote 1 Alternatively, researchers might nudge choices toward water recycling with a task structure that requires participants to opt out of drinking recycled water, rather than requiring them to opt in for participation (e.g., a default nudge that largely bypasses rational processing).Footnote 2 In the case of the nudging, although the default does not strictly prohibit any choice (Evans, Reference Evans2008; Thaler and Sunstein, Reference Thaler and Sunstein2008), a primary reason people’s choices are influenced is because people tend to rely on specific heuristics (e.g., stay with default recommendations), not necessarily because they have fully considered, evaluated, or understood their choices (e.g., non-rational persuasion; Blumenthal-Barby and Burroughs, Reference Blumenthal-Barby and Burroughs2012; Ghesla et al., Reference Ghesla, Grieder and Schmitz2019; Johnson and Goldstein, Reference Johnson, Goldstein and Shafir2013; Madrian and Shea, Reference Madrian and Shea2001; Thaler and Sunstein, Reference Thaler and Sunstein2008; Venema et al., Reference Venema, Kroese and De Ridder2018).
Because of the different cognitive mechanisms involved in rational versus non-rational persuasion techniques, people could theoretically be nudged into making choices that are inconsistent with their current underlying attitudes, desires, preferences, and values (Johnson, Reference Johnson2021).Footnote 3 While these effects might be argued to be potential benefits of nudging (e.g., getting people to do things that are good for them, even when they otherwise don’t want to), this also could make nudges more likely to involve serious practical and ethical costs (for a review, see Ethical Interaction Theory; Feltz and Cokely, Reference Feltz and Cokely2024, Chapter 7). For example, a default nudge might influence people to drink recycled water even when they feel worried about water recycling and intend to vote against it. The resulting potential gap between attitudes and choices appears relevant to researchers and practitioners for many reasons, particularly in cases when other choice architectures are likely to avoid such gaps. For example, a well-designed educational boost seems unlikely to influence people to do things they don’t want to do because education targets people’s (rational) understanding rather than directly aiming to influence or bias their choices. However, for an educational boost to be a viable alternative, there is another question that is relevant: can a simple educational boost (e.g., fast, inexpensive, and easy to present) still promote the same kinds of choice benefits as a default nudge could? For water recycling, evidence suggests that this may be the case,Footnote 4 as some studies have shown that short educational videos can increase reported acceptance of recycled water (e.g., videos explaining that recycled water poses few risks, is increasingly needed, and offers many benefits that non-experts are generally unaware of; Tanner and Feltz, Reference Tanner and Feltz2022; Tanner et al., Reference Tanner, McDonald, Mahmoud-Elhaj, Sabatini, Chamberlain, Nijhawan, Rainbolt-Forbes and Feltz2024; also see Dolnicar et al., Reference Dolnicar, Hurlimann and Nghiem2010; Fielding and Roiko, Reference Fielding and Roiko2014; Price et al., Reference Price, Fielding, Gardner, Leviston and Green2015; Roseth, Reference Roseth2008; Simpson and Stratton, Reference Simpson and Stratton2011).
2. What is recycled water and why should we care?
According to a recent survey of almost 150,000 participants in 141 countries, over half of all sampled adults anticipate that within the next two years their drinking water could cause them serious harm (Miller et al., Reference Miller, Staddon, Salzberg, Lucks, Bruine De Bruin and Young2024). Moreover, estimates have suggested that at least one-third of the world’s population lives in water-stressed countries, presenting a serious risk to health and welfare (Elimelech, Reference Elimelech2006). As the need to address this issue rises, the reuse of municipal wastewater—referred to hereafter as water recycling (United States Environmental Protection Agency et al., 2012)—has received interest because recycling water represents one potentially efficient way of increasing potable water access (Tortajada and Ong, Reference Tortajada and Ong2016). In fact, according to most experts, water recycling appears to offer major advantages as compared to other possible solutions. For example, it is generally less energy-intensive to produce recycled water than to desalinate seawater. Water recycling is also largely resistant to environmental changes such as climate-change-induced drought and can reduce the amount of waste discharged into the environment (Fielding et al., Reference Fielding, Dolnicar and Schultz2019).
Unfortunately, public acceptance of recycled water tends to be low, especially when considered for purposes such as cooking and drinking (Dolničar and Saunders, Reference Dolničar and Saunders2006). This resistance is inconsistent with a large body of research demonstrating that recycled water is generally at least as safe as normal tap water (Khan and Roser, Reference Khan and Roser2007). There is considerable practical evidence on the safety and efficacy of water recycling as well, as many locations around the world have already successfully implemented recycled water systems for many years (e.g., Singapore, Namibia, and some cities in the United States; Lee and Tan, Reference Lee and Tan2016; Sanchez-Flores et al., Reference Sanchez-Flores, Conner and Kaiser2016; van Rensburg, Reference van Rensburg2016). Nevertheless, in some cases, low recycled water acceptance has resulted in public opposition that has delayed or halted proposed water recycling programs (e.g., San Diego, United States and Toowoomba, Australia; Hurlimann and Dolnicar, Reference Hurlimann and Dolnicar2010; Po et al., Reference Po, Kaercher and Nancarrow2003; Uhlmann and Head, Reference Uhlmann and Head2011).
Research suggests that several common psychological factors likely play roles in influencing attitudes toward recycled water (Fielding et al., Reference Fielding, Dolnicar and Schultz2019; Smith et al., Reference Smith, Brouwer, Jeffrey and Frijns2018), including disgust sensitivity, perceived risks and benefits to one’s health, trust in authority, and knowledge about recycled water. Accordingly, considerable research has been conducted aimed at understanding what interventions may be able to change public attitudes towards recycled water (Nemeroff et al., Reference Nemeroff, Rozin, Haddad and Slovic2020). Importantly, attitudes regarding water recycling may in some ways be as important as choice indicators to choice architects. While choice is understandably of primary interest in many domains (e.g., enrolling in retirement savings programs or applying for financial aid; Beshears et al., Reference Beshears, Choi, Laibson, Madrian, Brown, Liebman and Wise2009; Bettinger et al., Reference Bettinger, Long, Oreopoulos and Sanbonmatsu2012), this may not be true in others. For example, recent research has suggested that even though default nudges can dramatically increase rates of consent to be an organ donor, actual rates of organ donation in many countries have not significantly increased since switching to systems where individuals must opt out of organ donation (Dallacker et al., Reference Dallacker, Appelius, Brandmaier, Morais and Hertwig2024). Dallacker et al. suggest this may be largely attributable to family objections. They also speculate that absent explicit interpersonal communication on the topic, families may often view consent obtained via defaults alone as a fairly weak signal of true, underlying preferences. Among other explanations, it seems possible that although a discrete choice was made by the individual (i.e., to remain with the default by consenting to organ donation), the individual’s underlying attitudes regarding organ donations were otherwise largely unaffected. Similar outcomes seem possible for choices involving recycled water (e.g., they could, perhaps, influence one-off choices to drink recycled water but might not influence attitudes enough to vote in favor of recycled water); however, we have been unable to find any direct tests of these relations between attitudes, choices, and choice architecture types in the literature. This is a gap we attempt to address in this paper.
3. Experiments
A primary goal of the current research was to empirically test and compare the effects of default nudges and educational interventions on specific choice indicators related to recycled water acceptance. Following previous research, we hypothesized that both default nudges and educational boosts would be effective at influencing simple binary choices, such that either defaulting participants into a hypothetical recycled water program or educating them about recycled water should be expected to increase acceptance of recycled water. However, we extended previous research by further examining several attitudinal indicators of acceptance (e.g., worry about recycling; intentions to protest water recycling policies). We hypothesized educational interventions would be more effective at influencing these underlying indicators of recycled water acceptance because of the nature of educational boosts (e.g., designed to promote rational persuasion by providing a more representative understanding of key issues).
We tested these hypotheses in two experiments. Experiment 1 (n = 332), which will not be reported here in detail (but see the Appendix for a complete report), was designed to test the effectiveness of defaults and education using a specific choice indicator, namely whether participants would consent to receiving recycled water from their taps. This choice was hypotheticalFootnote 5 and had limited realism (e.g., individuals are typically not free to make independent decisions regarding the source of their tap water). Nevertheless, as expected, we found that relationships were generally consistent with our hypotheses, such that defaults affected specific choices but not attitudes, while education affected both choices and attitudes.Footnote 6 Given these results, and considering their limits, we designed Experiment 2 as a replication and extension of Experiment 1 that focused on a more realistic choice (i.e., whether to buy water from a company supplying recycled water), along with a broader range of attitudinal and related indicators. We again hypothesized that the educational intervention would have positive effects on all choice and attitudinal indicators, while the default nudge would only reliably affect choices.
3.1. Participants
Two hundred and eighty-six participants were recruited for Experiment 2. Participants were recruited using Amazon’s Mechanical Turk (MTurk)Footnote 7 in exchange for $0.75 USD. To increase data quality, a filter was applied through CloudResearch’s MTurk Toolkit that restricted the MTurk subject pool to only those who have been previously approved by CloudResearch. CloudResearch approved participants have been found to provide higher quality data than many other online participant recruitment platforms (Hauser et al., Reference Hauser, Moss, Rosenzweig, Jaffe, Robinson and Litman2022; Peer et al., Reference Peer, Rothschild, Gordon, Evernden and Damer2022). A total of 22 participants were excluded for having IP addresses not associated with the United States of America or failing attention checks. Among the 264 participants analyzed, reported ages ranged from 20 to 79 (M = 44.97, SD = 14.01). One hundred fifty-two participants identified as female, 107 identified as male, two indicated non-binary, and three declined to specify gender. A post-hoc power analysis indicated that the current study could reliably detect a small-sized effect (power = .8, alpha = .05, V = 0.17).Footnote 8
3.2. Procedure
Participants first completed a pretest gauging objective knowledge of recycled water. Knowledge was included as a manipulation check to ensure that the educational intervention was working as intended (i.e., by increasing knowledge, which was hypothesized to predict choice). We used a set of 39 true/false/I don’t know items validated by Mahmoud-Elhaj et al. (Reference Mahmoud-Elhaj, Tanner, Sabatini and Feltz2020). Next, using a 2 x 2 between-subjects design,Footnote 9 participants were assigned to an education condition and a default condition. Specifically, participants were first randomly assigned to a relevant or irrelevant educational information condition. Participants in the relevant information condition watched a five-minute educational video developed in conjunction with recycled water experts (https://www.youtube.com/watch?v=eGcZjnwQy2w). This video emphasized the need for recycled water (e.g., to sustain population growth and resist problems caused by drought). It also included illustrations of key recycled water definitions like direct, indirect, and de facto reuse; information concerning the wastewater treatment process, and testimonials and information concerning sites in the United States already using recycled water (Tanner et al., Reference Tanner, McDonald, Mahmoud-Elhaj, Sabatini, Chamberlain, Nijhawan, Rainbolt-Forbes and Feltz2024). Meanwhile, participants in the irrelevant information condition watched a video of similar length describing how the internet works (https://www.youtube.com/watch?v=7_LPdttKXPc).
Next, participants were presented with the following scenario:
Imagine you work for a small business. As part of your job, you are in charge of ordering water for the office water dispenser. In the past, your business has ordered from Company A, which is listed as the business’s default provider of water. One day, (default in: Company A; default out: one of Company A’s competitors—Company B) announces it will officially supply only recycled water to customers. You notify your boss of this change, and they tell you that you can continue ordering from Company A (default out: which uses traditional purified water), or you can choose to switch providers and instead start ordering water from Company B (default in: which uses traditional purified water). Assuming Company A and Company B offer the same prices for their water, and you have no outside pressure to choose one option over the other, which company would you choose?
Participants were randomly assigned to either the default-out condition or the default-in condition and were asked if they wanted to stay with the default and order from Company A (which offered recycled water in the default-in condition and traditional water in the default-out condition) or switch to Company B (which offered the opposite type of water). Answers to this question served as our specific choice indicator of acceptance.
Next, participants responded to the objective knowledge of recycled water scale again to obtain a post-knowledge score. Subsequently, participants completed a battery of items related to factors we classified as deeper attitudinal criteria (i.e., indicators aimed at measuring with more nuance how one feels or what motivations one might have about recycled water). Specifically, participants first responded to a set of three questions aimed at gauging the strength of their attitudes concerning recycled water acceptance:
-
1) How likely are you to drink recycled water? (11-point Juster scale; 1 = almost no chance/1 chance in 100, 11 = practically certain/99 chances in 100)
-
2) Would you support or oppose using recycled water at your residence? (7-point Likert scale; 1 = strongly oppose, 7 = strongly support)
-
3) I do not want purified recycled water to be mixed with drinking water. (7-point Likert scale; 1 = strongly agree, 7 = strongly disagree)
These items were drawn from various measures reported in previous literature (Garcia-Cuerva et al., Reference Garcia-Cuerva, Berglund and Binder2016; Kemp et al., Reference Kemp, Randle, Hurlimann and Dolnicar2012; Nancarrow et al., Reference Nancarrow, Leviston and Tucker2009) that were previously found to load well onto a common factor (Tanner, Reference Tanner2021). Of note, Item 1 was measured on a different scale than the other items, so we checked skew and kurtosis statistics and ensured none of the items were significantly non-normally distributed (skewness range: [−.54, −.06], kurtosis range: [−1.28, −.34]) and then standardized scores by calculating z-scores for each item. The standardized items displayed good internal consistency (Cronbach’s alpha = .87, 90% CI [.85, .90]), thus, z-scores for items were summed to form an overall attitudinal acceptance strength score.
Then, we gauged the extent to which participants felt they would be satisfied with policymakers, their relevant affective reactions (worry), the extent to which they would intend to engage in specific actions in protest to recycled water, and the extent to which they would recommend specific negative courses of action for others if recycled water were to be implemented in their city:
-
1) I would be upset with my local government if they asked people to use recycled water for drinking. (Satisfaction; reverse-coded)
-
2) I would trust my local government if they decided to ask people to use recycled water for drinking. (Satisfaction)
-
3) I would be worried about my health if my local government decided to ask people to use recycled water for drinking. (Affective reaction)
-
4) I would likely protest if my local government decided to ask people to use recycled water for drinking. (Intentions)
-
5) I would consider moving if my local government decided to ask people to use recycled water for drinking. (Intentions)
-
6) I would tell my friends and family not to move here if my local government decided to ask people to use recycled water for drinking. (Negative recommendations)
Each item was measured on a 7-point Likert scale (1 = strongly disagree, 7 = strongly agree). For the measures with two items, item responses were highly correlated (satisfaction: r = .54, p < .001; intentions: r = .70, p < .001), so those scores were summed to form composite satisfaction and intention scores, respectively.
Participants then completed the 7-item version of the Berlin Numeracy Test (BNT; Cokely et al., Reference Cokely, Galesic, Schulz, Ghazal and Garcia-Retamero2012, Reference Cokely, Feltz, Ghazal, Allan, Petrova and Garcia-Retamero2018; Schwartz et al., Reference Schwartz, Woloshin, Black and Welch1997). The BNT measures statistical numeracy, or the ability to understand and apply basic probabilistic information. Numeracy has been associated with knowledge acquisition and decision quality across many domains (e.g., health, climate change, environmental hazards, finances; Cokely et al., Reference Cokely, Feltz, Ghazal, Allan, Petrova and Garcia-Retamero2018 for a review; see also Allan et al., Reference Allan, Ripberger, Ybarra, Cokely, Gore and Ward2017; Cho et al., Reference Cho, Cokely, Ramasubramanian, Allan, Feltz and Garcia-Retamero2024; Garcia-Retamero et al., Reference Garcia-Retamero, Sobkow, Petrova, Garrido and Traczyk2019; Grounds and Joslyn, Reference Grounds and Joslyn2018; Ramasubramanian et al., Reference Ramasubramanian, Allan, Retamero, Jenkins-Smith and Cokely2019 for specific examples). Numeracy has also been shown to be a strong predictor of risk literacy (i.e., the ability to evaluate and understand risk; see Cho et al., Reference Cho, Cokely, Ramasubramanian, Allan, Feltz and Garcia-Retamero2024 for a discussion of potential mechanisms). One’s assessments of risks (e.g., potential health risks) are likely to be related one’s feelings about recycled water use; thus numeracy might predict recycled water acceptance. Finally, participants provided basic demographic information.Footnote 10
3.3. Results and discussion
3.3.1. Education manipulation check
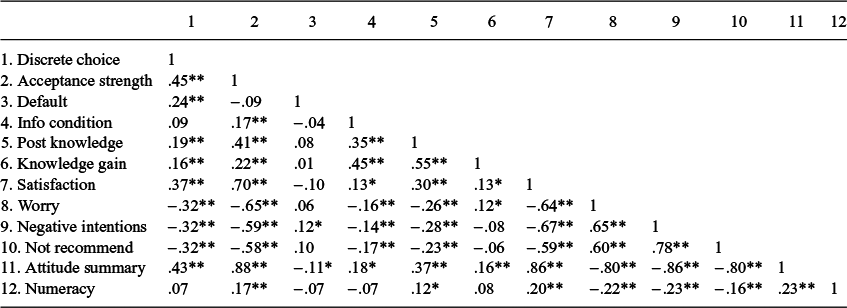
To ensure the educational intervention was functioning as intended, we first examined objective knowledge between the two education conditions. As expected, knowledge difference scores differed significantly between the irrelevant and relevant education conditions (t (262) = 11.12, p < .001, d = 1.37 (90% CI [1.14, 1.59])). Those in the relevant condition gained more knowledge (M = 9.46, SD = 7.83) than those in the irrelevant condition (M = .86, SD = 4.26), suggesting that the educational intervention increased knowledge (see Table 1 for correlations).
Table 1 Correlations from Experiment 2
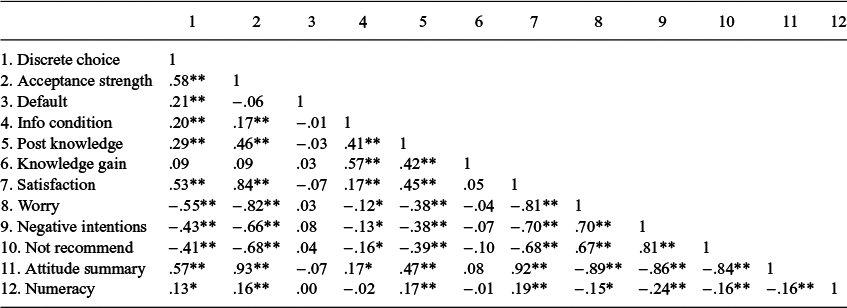
Note: Variables were coded as follows: choice (0 = did not enroll in water program/did not buy recycled water, 1 = enrolled/did buy recycled water); default (0 = out/traditional water, 1 = in/recycled water); info condition (0 = irrelevant, 1 = relevant); * p <.05, ** p < .01.
3.3.2. Choice indicator
The default nudge was significantly associated with the hypothetical decision to choose the recycled water company, ${\chi}^2$
(1) = 12.12, p < .001, V = .21 (90% CI [.11, .31]). Specifically, 69 out of 136 (51%) participants in the default-in condition chose to order from the recycled water company, while only 38 out of 128 (30%) participants in the default-out condition chose the recycled water company. The educational intervention was also significantly associated with the recycled water company choice
${\chi}^2$
(1) = 12.12, p < .001, V = .21 (90% CI [.11, .31]). Specifically, 69 out of 136 (51%) participants in the default-in condition chose to order from the recycled water company, while only 38 out of 128 (30%) participants in the default-out condition chose the recycled water company. The educational intervention was also significantly associated with the recycled water company choice $, {\chi}^2$
(1) = 10.47, p < .01, V = .20 (90% CI [.10, .30]), with 66 out of 131 (50%) participants in the relevant information condition choosing to enroll compared to 41 out of 133 (31%) in the irrelevant information condition (see Figure 1).
$, {\chi}^2$
(1) = 10.47, p < .01, V = .20 (90% CI [.10, .30]), with 66 out of 131 (50%) participants in the relevant information condition choosing to enroll compared to 41 out of 133 (31%) in the irrelevant information condition (see Figure 1).
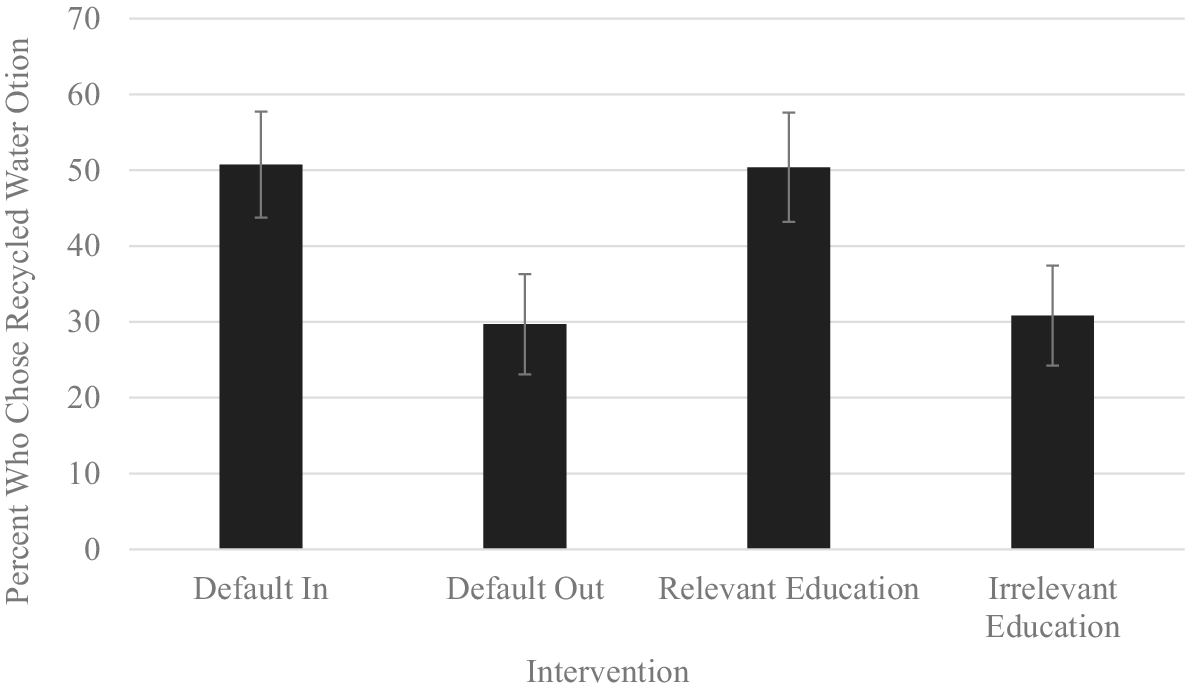
Figure 1 Enrollment in hypothetical recycled water program by intervention from Experiment 2
Note: Error bars represent 90% confidence intervals.
To test if effects from the default conditions were significantly different from effects observed in the education conditions, we used Cochran’s Q (Cochran, Reference Cochran1954), a statistical test commonly used in meta-analyses to assess heterogeneity of effects. A significant Q-test indicates significant heterogeneity among effect sizes and thus would provide evidence that the effects were significantly different from each other. The Q-test for this experiment was not significant, Q(1) = 0.35, p = .85, indicating that the effects of education and defaults on choice were not statistically different from each other (i.e., defaulting-in and educating likely increased choice-based acceptance by a similar amount).
3.3.3. Attitudinal indicators
To test attitudinal indicators of acceptance, we used 2 x 2 ANOVAs to compare the effects of the defaults and educational interventions on all attitude indicators. Results were consistent with our hypothesis that education would affect attitudes related to recycled water use while defaulting people into recycled water use would not. Specifically, the education condition had significant main effects across all the attitude variables (all ps ≤ .05), with education leading to higher acceptance in all cases. Meanwhile, there were no significant main effects for defaults (all ps ≥ .20), and no significant interactions between education and defaults (all ps ≥ .30).
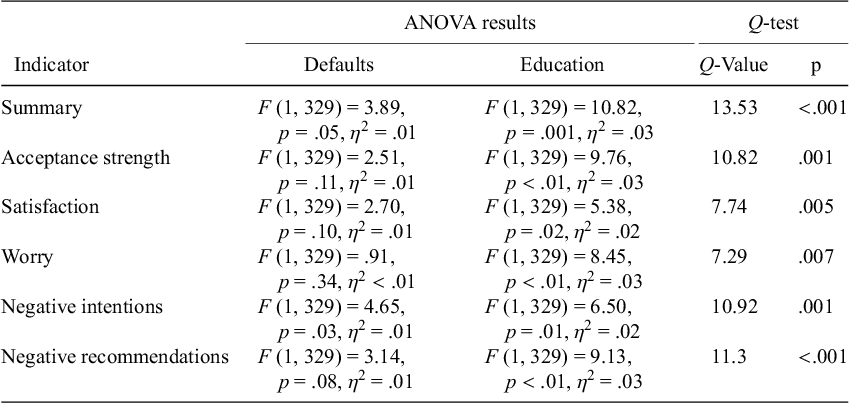
We also calculated a summary measure of all the attitudinal indicators. To do so, all the attitude indicator scores were standardized and included in a principal component analysis (PCA). There was some misfit in the model (χ2 (27) = 263.05, p = <.001). However, all items loaded well onto one component (all loadings ≥ .79), and one component accounted for 70% of the variance. Moreover, results from the PCA found no evidence of multiple components (eigenvalues for all components after the first component ≤ .78.). Thus, a summary attitudinal indicator was calculated by averaging across all standardized individual attitudinal indicators. An ANOVA conducted on the summary attitudinal indicator found a main effect of education (p = .01), such that those who received the educational boost were significantly higher in acceptance than those who did not receive the educational intervention. There was no significant main effect for defaults (p = .27) and no significant interaction (p = .45). Additionally, all Q-tests were significant (all ps ≤ .03) with the exception of the test for worry (which was almost significant; p = .08), suggesting that educating participants was generally significantly better at increasing attitude-based acceptance than was defaulting-in. See Table 2 for all deeper acceptance ANOVA and Q-tests from Experiment 2, as well as Figure 2 for graphs of all effects for attitude indicators.
Table 2 Attitudinal variable tests from Experiment 2
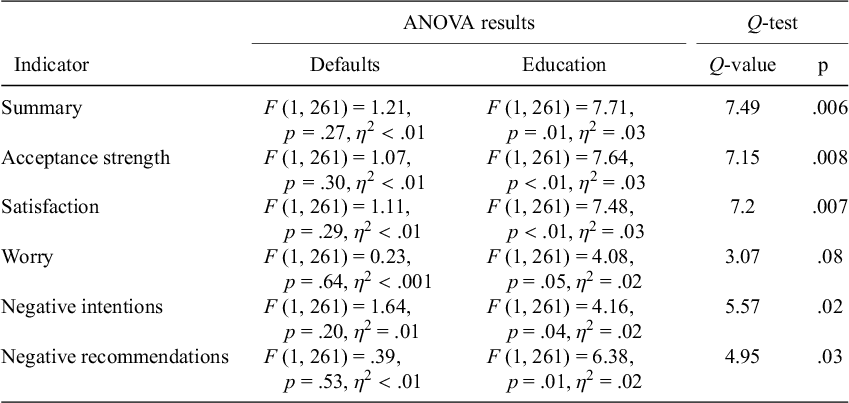
Note: Interaction terms were not included in these ANOVA models, as no interactions neared significance (all ps ≥ .30); df for all Q tests = 1.
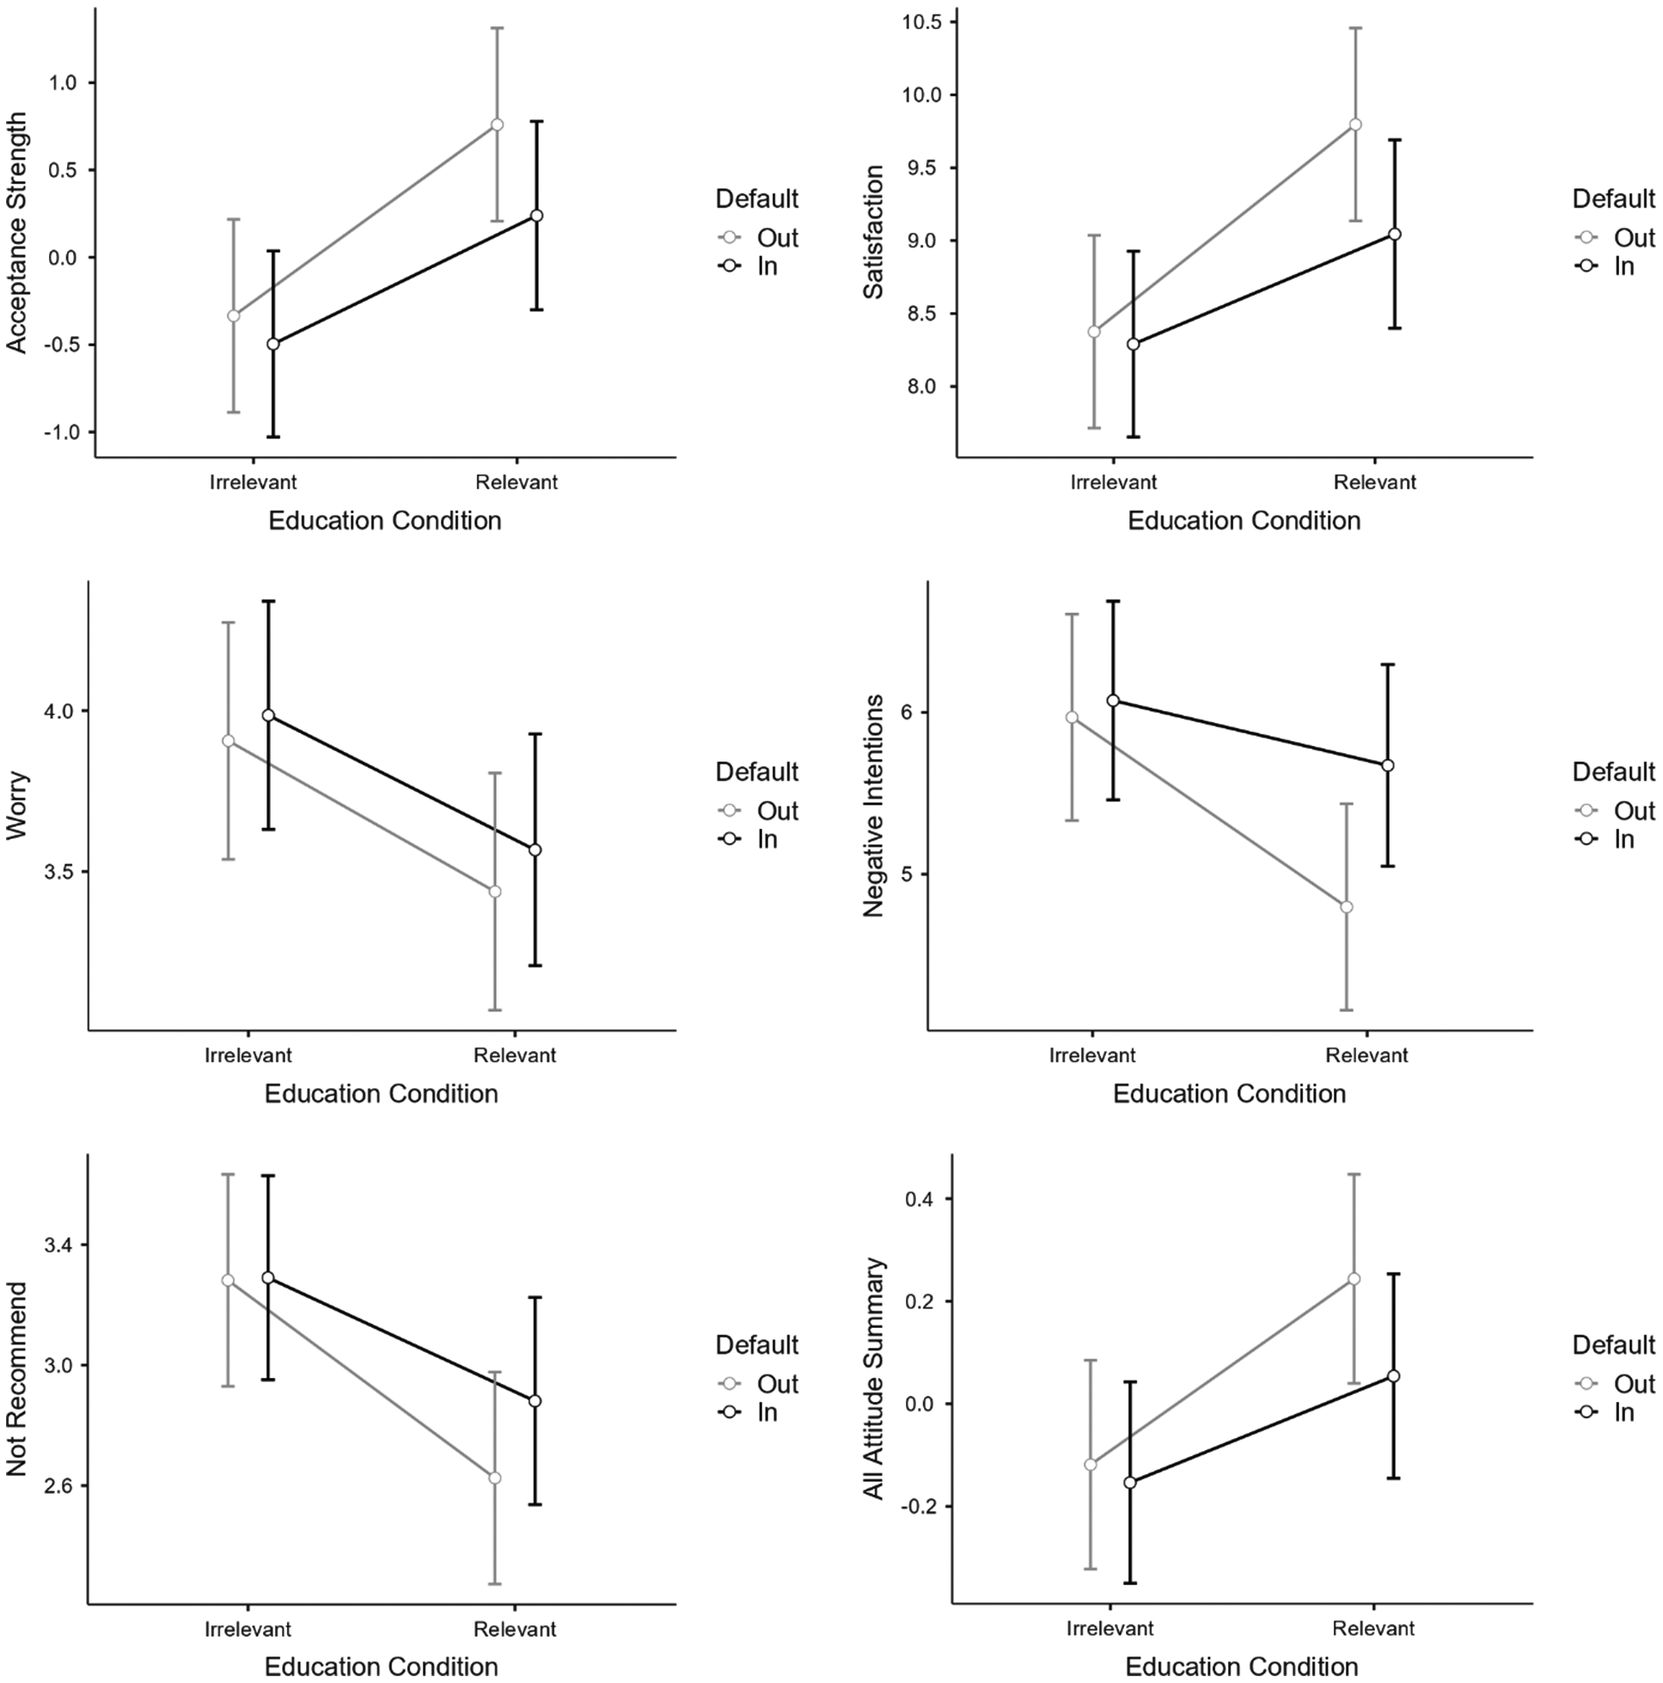
Figure 2 Graphs depicting results for attitudinal indicators from Experiment 2.
Note: Error bars represent 90% confidence intervals. Y-axis for the ‘Acceptance Strength’ and the ‘All attitude summary’ graphs represents standardized z-scores; Y-axis for all other graphs represents raw or summed scores.
3.3.4. Discussion
Effects from Experiment 2 were consistent with our hypotheses and replicated the general pattern of results from Experiment 1. When using a more realistic hypothetical choice scenario, the default nudge was effective at influencing specific choices (i.e., the discrete choice to buy from a recycled water company). However, defaulting people into recycled water use had no other reliable effects on the attitudinal variables, suggesting that defaults reliably influenced only specific choice outcomes about recycled water. Nevertheless, the educational intervention affected both specific choices and attitudinal indicators of acceptance, consistent with our hypothesis about education’s ability to increase multiple outcomes related to recycled water acceptance (e.g., choices, attitudes, intentions, knowledge).
4. General discussion
The results from our experiments suggest that both default nudges and educational interventions may be able to increase public acceptance of recycled water under some circumstances. In both experiments, findings indicated that defaulting participants into a hypothetical water program was associated with increased enrollment in that program, a result that is consistent with previous literature (Tanner and Feltz, Reference Tanner and Feltz2022). However, in both experiments, defaulting participants into recycled water use had no consistent effect on the attitudinal indicators related to water recycling acceptance. This finding suggests that although defaults can influence specific choices about recycled water, defaults remain unlikely to affect potentially influential feelings, attitudes, intentions, and related behaviors. In contrast, the educational intervention was effective at influencing specific choices across both experiments and also consistently influenced attitudinal indicators of acceptance, typically resulting in meaningful shifts of relevant attitudinal and knowledge indicators.Footnote 11 These observed benefits are also consistent with previous findings indicating that educational interventions can have significant effects on people’s confidence in their decision to accept water recycling (Tanner and Feltz, Reference Tanner and Feltz2022).
Because voting in favor of recycled water is likely to be a pivotal outcome for affected communities, we think it is noteworthy that defaulting participants into recycled water use failed to increase attitude-based acceptance of recycled water. This suggests that although defaults may influence some recycled water behaviors (e.g., making one-time decisions to choose recycled water), they are unlikely to influence other voting-relevant behaviors. Similarly, it seems likely there is an ethical cost to using an intervention that affects specific choices yet does not affect their corresponding attitudes (see Ethical Interaction Theory, Feltz and Cokely, Reference Feltz and Cokely2024, Chapter 7). To illustrate, Wolf (Reference Wolf and Shafer-Landau1987) might refer to this incongruence between choices and deeper held attitudes as a case where individuals have been ‘alienated from their actions’ (p. 376). That is, actions have been governed not by one’s deeper feelings, values, understanding, and desires (e.g., informed by rational persuasion), but by external and independent forces (e.g., biased via non-rational persuasion). Moreover, using interventions that promote specific decisions that are incongruent with an individual’s own attitudes and beliefs seems in many respects to conflict with psychology’s commitment to best practices and ethical standards (e.g., Justice and Respect for People’s Rights and Dignity; American Psychological Association, 2017 ; also see Baron, Reference Baron2024, Chapter 15 and Keeney, Reference Keeney1992 for discussions regarding the importance of helping individuals identify and consult their fundamental values when making decisions). In extreme cases, this sort of incongruence resulting from non-rational persuasion (e.g., default nudging) may even have legal implications, because some people may reasonably feel they have been coerced into a specific choice.
Nevertheless, in some instances there could also be ethical benefits of using non-rational persuasion techniques. For example, nudges such as defaults might sometimes help to counteract biases that would prevent one from making choices consistent with one’s own deeper values, beliefs, and so on. For recycled water choices, such an effect could occur if nudging helped to circumvent reflexive reactions such as disgust, a factor that could prevent individuals from reflecting on expert opinions about recycled water safety and scarcity. Some evidence also suggests positive effects from nudges can endure even after the intervention is removed (e.g., Brandon et al., Reference Brandon, Ferraro, List, Metcalfe, Price and Rundhammer2022; Venema et al., Reference Venema, Kroese and De Ridder2018). And in some other cases, the societal benefits that nudges may provide could outweigh potential ethical costs to the individual, especially when compared to less flexible and more paternalistic options such as mandates or regulations (e.g., in the case of organ donation, an automatic enrollment default could, in theory, save thousands of lives and thus be ethically justifiable, even if most individuals would not have opted in otherwise).
Educational interventions are also not without their potential limitations and costs. For example, it is likely that more money, time, and testing may typically be required to ensure that an educational intervention would be sufficiently effective as compared to implementing simple defaults. And there are issues of differential accessibly that may be relevant and should be considered (e.g., designing for people who are visually impaired; designing for non-native speakers). It also remains unclear how enduring different educational interventions can be.Footnote 12 Accordingly, future research may wish to examine attitude-based acceptance longitudinally to assess change over time and to extend these investigations to other domains. Likewise, future research should be designed to test whether the current findings do indeed generalize beyond the hypothetical scenarios used in the current study. Because of the hypothetical nature of the choices, it is possible that factors such as social desirability could have artificially inflated the effectiveness of the interventions. It would also likely be informative to replicate these findings in situations where individuals receive some actual product or make some real choice that has consequences for their lives outside of the study (e.g., perhaps using a procedure akin to Leong and Lebel, Reference Leong and Lebel2020—who gave participants a small amount of money to spend on actual bottles of mineral or recycled water—but modified to accommodate a default option).
These limitations and questions notwithstanding, the current results serve as another example of the potential benefits of using choice architecture for rational persuasion (e.g., educational boosts) rather than non-rational persuasion (e.g., default nudges). Unfortunately, we have the impression that some researchers assume simple and effective nudges must be superior to educational interventions. Yet, as seen in the current data, we find there is evidence indicating the opposite may often be true. In accord with other potential benefits of educational boosts, such as their ability to foster competencies, engage citizens, and equip individuals with skills they need to navigate an ultra-processed world (Herzog and Hertwig, Reference Herzog and Hertwig2025), our current results underscore the need for more comprehensive comparisons of the costs and benefits of potential decision interventions. Further evidence for this idea is presented as part of the empirical basis for Ethical Interaction Theory (Feltz and Cokely, Reference Feltz and Cokely2024, Chapter 7)—a formal theory that indicates researchers have an ethical obligation to consider and compare the relative merits of the choice architectures they could use. The theory emphasizes the importance of balancing values, including but not limited to autonomy and beneficence, when designing choice architectures and provides a heuristic checklist to help researchers compare different potential interventions (i.e., choice architecture policy analysis; Feltz and Cokely, Reference Feltz and Cokely2024). However, Ethical Interaction Theory does not hold that one class of choice architecture is necessarily better than others in all situations (e.g., see Mrkva et al., Reference Mrkva, Posner, Reeck and Johnson2021 for potential examples of nudges decreasing disparities). Instead, Ethical Interaction Theory simply holds that choice architects should respect, promote, and protect the autonomy of competent decision makers (among other values such as trust and justice) whenever the benefits are sufficient and the costs are reasonable.
Funding statement
This research did not receive any specific grant from funding agencies in the public, commercial, or not-for-profit sectors.
Data availability statement
Data and additional analyses can be found at the paper's open science link: https://osf.io/p6kha/?view_only=bb377b2e36ab4a9abbd83481942bf381
Competing interest
The authors declare none.
Appendix (Experiment 1)
Method
Participants. Participants were recruited using the student participant pool at a large university in the United States. Responses were collected from a total of 409 participants. Forty-five participants were excluded for answering an attention check question incorrectly and 22 participants were excluded for failing to complete the survey, not meeting the minimum age requirement, and displaying additional signs of inattention (e.g., providing nonsense answers to open-ended questions), resulting in a final sample of 332 participants. These participants ranged in age from 18 to 44 (M = 19.5, SD = 2.38). About 56% identified as female (N = 186), and one participant did not disclose their gender. A post-hoc power analysis indicated that the current study could reliably detect a small sized effect (power = .8, alpha = .05, V = 0.15).
Procedure.Procedures for Experiment 1 were identical to those reported in-text for Experiment 2, except the hypothetical choice used the following scenario, originally reported by Tanner and Feltz (Reference Tanner and Feltz2022):
Our city is implementing a program to begin using high quality reclaimed (i.e., recycled) water for various purposes, including use in residential taps. Our records indicate that you may be affected by this change. You (are/are not) currently enrolled in this program, but you have the option to (enroll/unenroll). Please indicate your enrollment preference below.
Participants were randomly assigned to either a default-out condition or a default-in condition. Those assigned to the default-out condition were told they had not been automatically enrolled in this program, but they could choose to enroll if they desired. Those assigned to the default-in condition were told they had been automatically enrolled in the program, but they could choose to unenroll. Participants were then asked if they wanted to stay with the default option or switch to the other option. Answers served as our discrete choice indicator of acceptance.
Table A1 Correlations from Experiment 1
Note: Variables were coded as follows: choice (0 = did not enroll in water program/did not buy recycled water, 1 = enrolled/did buy recycled water); default (0 = out/traditional water, 1 = in/recycled water); info condition (0 = irrelevant, 1 = relevant); * p < .05, ** p < .01.
Results and discussion
Education manipulation check. Pre/post-intervention difference scores differed significantly between the irrelevant and relevant education conditions (t (330) = 9.13, p < .001, d = 1.00 (90% CI [.81, 1.19])) with those in the relevant condition gaining more knowledge (M = 8.42, SD = 7.98) than those in the irrelevant condition (M = 1.21, SD = 6.32). This suggests that the educational intervention functioned correctly and increased knowledge (see Table A1 for correlations from this experiment).
Choice indicator. Consistent with our hypothesis, defaults were significantly associated with the discrete decision to enroll in the hypothetical water recycling program, ${\chi}^2$
(1) = 19.65, p < .001, V = .24 (90% CI [.15, .33]). Specifically, 128 out of 163 (79%) participants in the default-in condition chose to enroll in the program while 94 out of 169 (56%) participants in the default-out condition chose to enroll. The educational intervention was also significantlyFootnote 13 (but weakly) associated with enrollment in the program
${\chi}^2$
(1) = 19.65, p < .001, V = .24 (90% CI [.15, .33]). Specifically, 128 out of 163 (79%) participants in the default-in condition chose to enroll in the program while 94 out of 169 (56%) participants in the default-out condition chose to enroll. The educational intervention was also significantlyFootnote 13 (but weakly) associated with enrollment in the program $, {\chi}^2$
(1) = 2.93, p = .04, V = .09 (90% CI [.00, .18]), with 117 out of 164 (71%) participants in the relevant information condition choosing to enroll compared to 105 out of 168 (63%) in the irrelevant information condition (see Figure A1). Notably, participants in the relevant info condition enrolled at a similar rate as those in the default-in condition. Accordingly, the weaker effect observed here may not indicate that the relevant educational intervention was less effective than defaults at increasing decisions to accept recycled water, but rather that defaulting people out was more effective at decreasing acceptance than the irrelevant educational video. Future research is needed to explore this more fully. Finally, to test if effects from default condition were significantly different from effects observed in the education condition, a Cochran’s Q test (Cochran, Reference Cochran1954) was conducted. Results from this test were significant, Q(1) = 3.88, p = .05, suggesting a significant amount of heterogeneity between the two effects. This provides evidence that the effect of defaulting participants into the program was significantly larger than the effect of educating for this variable.
$, {\chi}^2$
(1) = 2.93, p = .04, V = .09 (90% CI [.00, .18]), with 117 out of 164 (71%) participants in the relevant information condition choosing to enroll compared to 105 out of 168 (63%) in the irrelevant information condition (see Figure A1). Notably, participants in the relevant info condition enrolled at a similar rate as those in the default-in condition. Accordingly, the weaker effect observed here may not indicate that the relevant educational intervention was less effective than defaults at increasing decisions to accept recycled water, but rather that defaulting people out was more effective at decreasing acceptance than the irrelevant educational video. Future research is needed to explore this more fully. Finally, to test if effects from default condition were significantly different from effects observed in the education condition, a Cochran’s Q test (Cochran, Reference Cochran1954) was conducted. Results from this test were significant, Q(1) = 3.88, p = .05, suggesting a significant amount of heterogeneity between the two effects. This provides evidence that the effect of defaulting participants into the program was significantly larger than the effect of educating for this variable.
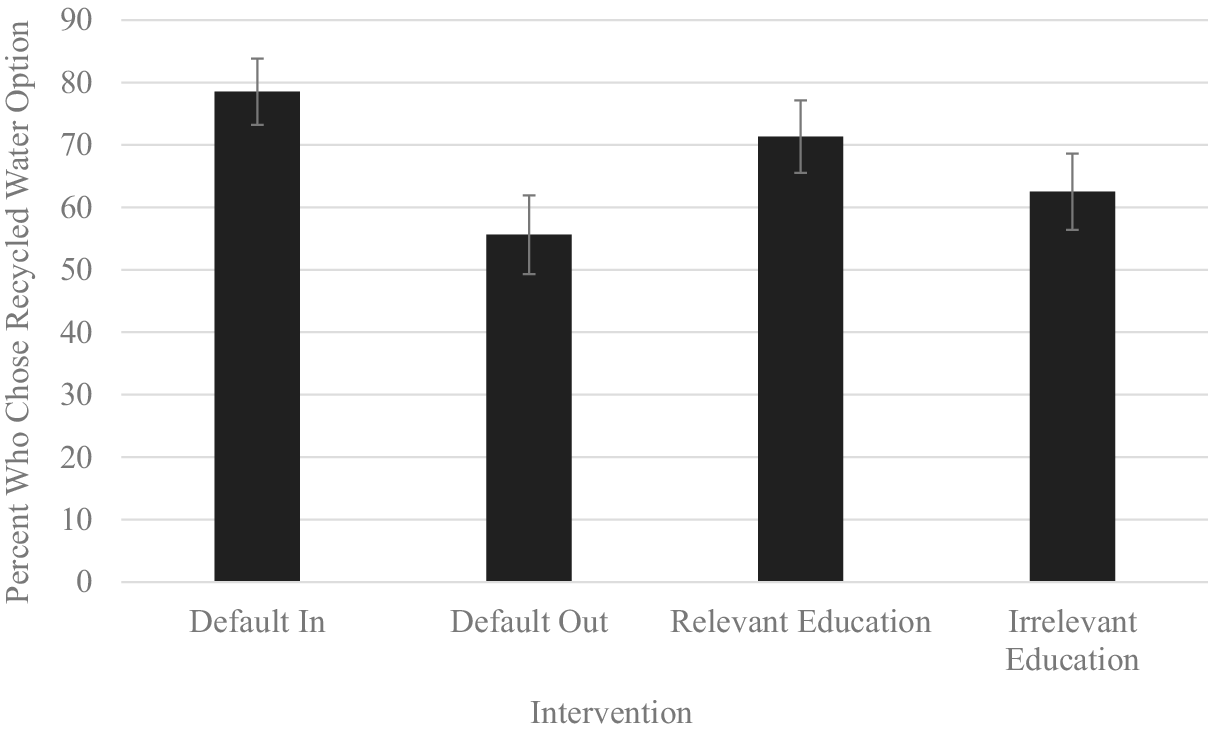
Figure A1 Enrollment in hypothetical recycled water program by intervention from Experiment 1.
Note: Error bars represent 90% confidence intervals.
Table A2 Attitudinal variable tests from Experiment 1
Note: Interaction terms were not included in these ANOVA models, as no interactions neared significance (all ps ≥ .35); df for all Q tests = 1.
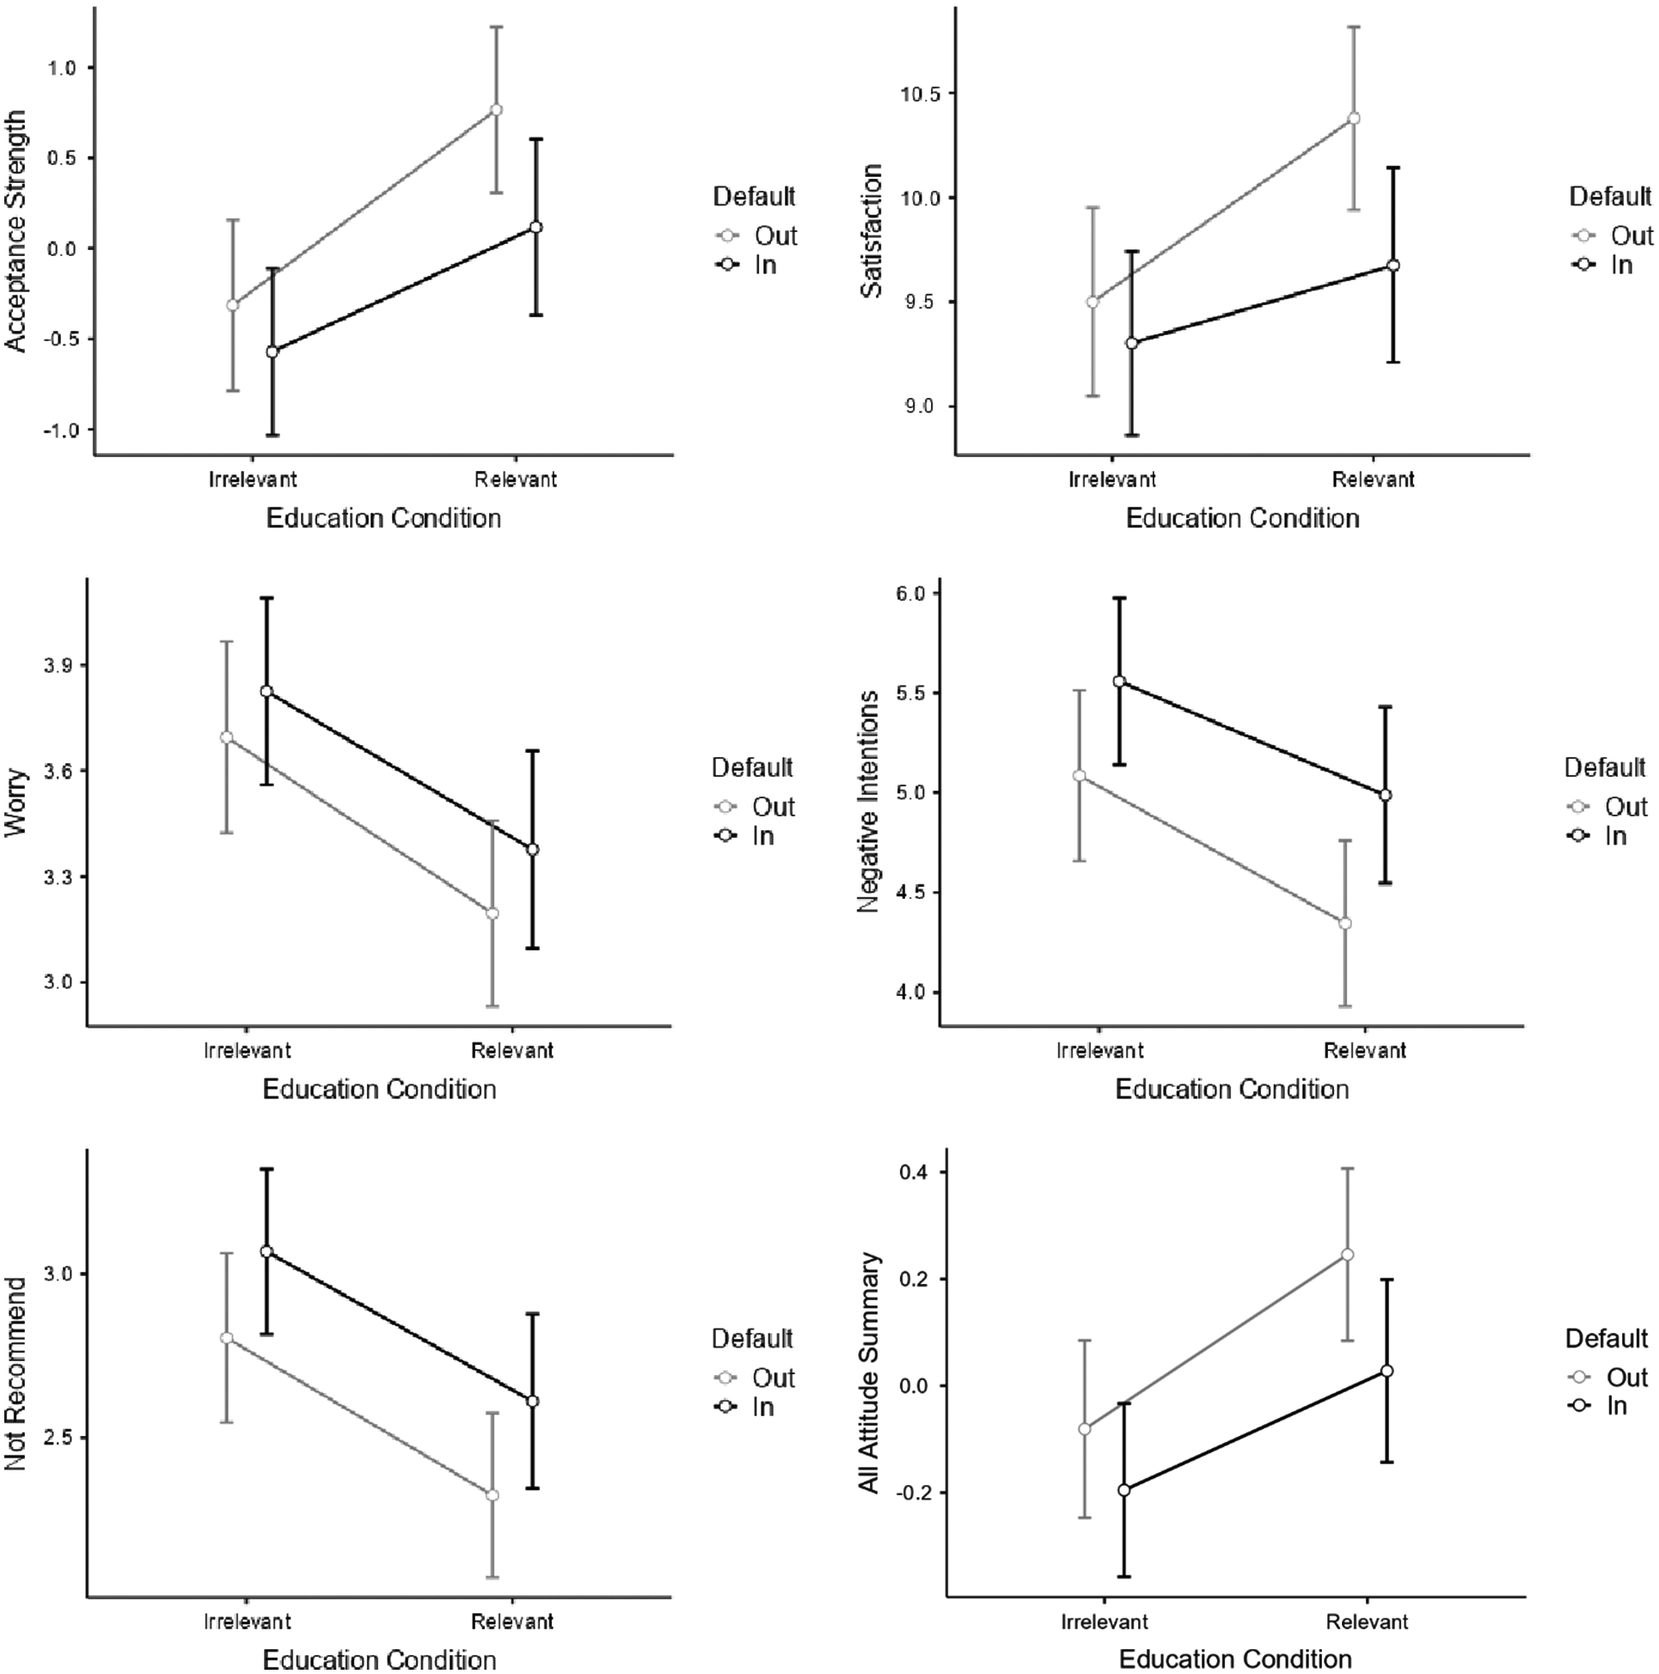
Figure A2 Graphs depicting results for attitudinal indicators from Experiment 1.
Note: Error bars represent 90% confidence intervals. Y-axis for the ‘Acceptance Strength’ and the ‘All attitude summary’ graphs represent standardized z-scores; Y-axis for all other graphs represent raw or summed scores.
Attitudinal indicators. We compared the effects of education and defaults on attitudinal indicators of acceptance using 2 x 2 ANOVAs. Education had significant effects on all attitudinal indicators of acceptance (all ps $\le$
.02), such that those who were educated had stronger acceptance strength, were more trusting, worried less, etc. Meanwhile, for defaults, a significant main effect occurred only for the intentions variable (p = .03), and an almost significant effect occurred for the negative recommendations variable (p = .08). However, in both cases, being defaulted into recycled water use was associated with negative consequences (i.e., higher intentions to move/protest, almost increased intent to give negative recommendations), relative to being defaulted out. No other effects were reliably significant.
$\le$
.02), such that those who were educated had stronger acceptance strength, were more trusting, worried less, etc. Meanwhile, for defaults, a significant main effect occurred only for the intentions variable (p = .03), and an almost significant effect occurred for the negative recommendations variable (p = .08). However, in both cases, being defaulted into recycled water use was associated with negative consequences (i.e., higher intentions to move/protest, almost increased intent to give negative recommendations), relative to being defaulted out. No other effects were reliably significant.
To compare effects across all attitudinal indicators, we conducted a principal component analysis using standardized attitudinal indicators. The PCA indicated only one component (eigenvalues for all components after the first component < .92; fit statistics were similar to the experiment reported in-text—χ2 (27) = 290.36, p = <.001—with all loadings ≥ .70 and 61% variance accounted for by one component), so individual scores across the indicators were averaged to form a composite attitude indicator score. A 2 x 2 ANOVA found a significant main effect for both defaults (p = .05) and education (p = .001). Specifically, those who were defaulted out of recycled water use were significantly higher in acceptance than those defaulted in, while those who were educated were significantly higher in acceptance than those who did not receive the relevant educational intervention. Finally, Q-tests were significant for all indicators (all ps < .01), suggesting that educating participants was significantly better at increasing acceptance attitudes than defaulting-in was for these indicators. See Table A2 for ANOVA and Q-test results from Experiment 1 and Figure A2 for graphs of effects on all attitudinal indicators.
Discussion. Results from this experiment replicated many of the relationships that have been observed in prior research. Defaulting participants into the program was significantly associated with choosing to accept recycled water (i.e., the by enrolling in the hypothetical program). Meanwhile, the relevant educational intervention also weakly influenced the specific choice to enroll. This might suggest that setting defaults can be an effective way to influence specific choices to accept recycled water and may potentially outperform strategies such as education in encouraging those decisions.
However, this experiment also added to previous research by comparing the different interventions’ effects on attitudinal indicators of acceptance. Specifically, the relevant educational intervention was effective at increasing the strength of attitudinal acceptance of recycled water, while defaulting participants into the program was not effective at increasing attitudinal acceptance strength. Likewise, for each of the attitudinal variables, the relevant educational intervention was effective at increasing desirable outcomes (e.g., satisfaction with policymakers) and decreasing undesirable outcomes (e.g., negative affect, intentions to protest/move) relative to the educational control, while defaulting people in either had no effect (e.g., on satisfaction and negative affect), or increased the undesirable outcome (e.g., intentions of moving/protesting) relative to defaulting people out.
In sum, Experiment 1 suggested that defaults and educational interventions may both be effective at increasing acceptance, but in different ways. Defaulting participants into the desired specific choice was more effective at encouraging participants to make the desired specific choice but had no desirable effects on any of the attitudes related to acceptance. Meanwhile, the educational boost had a weaker effect on the specific choice indicator, but it also had desirable effects on all attitudinal indicators of acceptance.


 Open access