
1. Introduction
This study aims to investigate the accident frequency and severity associated with electric vehicles (EVs) in comparison to internal combustion engine vehicles (ICEVs).
There is a global initiative aimed at promoting the adoption of electric vehicles (EVs) to conserve fossil fuels and transition towards a net-zero emissions future. The adoption of EVs is experiencing significant growth on a global scale, amidst a substantial reliance on fossil fuels.
The existing body of research on EVs and particularly on real accident data is notably limited. There is a scarcity of studies that employ the same methodology across fuel types to analyse the differences between these two vehicle types. Whilst studies on EVs exist, some are based on older timeframes where data is limited, and most research does not compare ICEVs against EVs using the same model form. Furthermore, where research has been conducted, it primarily focuses on the severity of accidents rather than their frequency, which we contend is equally important to consider.
In our analysis, we will also explore the various factors that significantly influence both accident frequency and severity in the context of EVs and ICEVs. EVs are characterised by distinct mechanical and operational features, including quieter engines and heavier chassis. These attributes contribute to a different driving experience and may influence the dynamics of accidents. Furthermore, EVs are equipped with advanced technologies that provide enhanced safety features, such as regenerative braking, which allows for greater torque and acceleration (Liu et al., Reference Liu, Zhang and Wang2019). While these features can improve vehicle performance, they may also lead to an increase in pedestrian and low-level crashes due to the unique driving characteristics of EVs. These unique characteristics involve the high torque, instant power nature and simplified drivetrain of EVs. These will be discussed later in the paper.
Despite the potential for increased accident frequency, it is essential to recognise that the advanced safety equipment found in EVs is designed to mitigate risks and reduce the overall incidence of accidents. However, the specialised nature of these components means that their replacement following an accident may require skilled labour and specific parts, potentially leading to higher costs associated with insurance claims. This aspect raises important questions regarding the economic implications of EV ownership and the overall impact on insurance markets (Lee, Reference Lee2018).
Separating the fuel type from the risk profile of vehicles presents a complex challenge. The interplay between vehicle technology, driver behaviour and environmental factors complicates the assessment of accident risks.
The main objective of this paper is to provide actuaries and modellers with an insight into the different frequency and severity statistics for the parametrisation of EVs in their models
In this study, we aim to provide insights into these dynamics by examining real-world accident data and identifying patterns that may emerge from the comparison of EVs with ICEVs. By focusing on both accident frequency and severity, we hope to contribute to a more comprehensive understanding of the safety implications of transitioning to EVs. As the adoption of EVs continues to grow globally, understanding their safety performance relative to traditional vehicles becomes increasingly critical. This research not only seeks to fill the existing gaps in the literature but also aims to inform policymakers, manufacturers and consumers about the potential risks and benefits associated with EVs. Ultimately, our findings may play a pivotal role in understanding the differences of EVs to ICEVs on claims experience, shaping future insurance pricing models and helping companies quantify the transition to EVs.
Our study uses data from Norway to help assess these relativities between frequency and severity of EVs against ICEVs in a granular way. Norway has one of the highest penetrations of EVs in the world and is a good case study to analyse real accident data. Although this research is based on data from Norway, the results are expected to follow through for other countries.
1.1. Global EV Penetration
Table 1 shows the proportion of EVs and Figure 1 shows EV sales by the leaders in EV adoption.
Table 1. Global EV penetration


Figure 1. EV sales by country.
Norway is leading the initiatives around EVs and has a wealth of experience and data to help analyse the effectiveness of EVs. ICEVs are slowly being phased out with countries restricting the sales of ICEVs in the future. Table 2 shows when ICEVs will start to be phased out.
Table 2. Global ICEV phasing out

1.2. Norway Leads EV Penetration
Norway’s aggressive target reflects its commitment to sustainability, leveraging its wealth from oil and gas to transition to EVs. The EU’s 2035 ban is part of a broader strategy to reduce carbon emissions, although the deal with Germany allows for some combustion engine vehicles using synthetic fuels.
The UK has set a clear path towards achieving net-zero emissions by 2050, with significant milestones for EV adoption. Initially, the UK aimed to ban the sale of new petrol and diesel cars by 2030, promoting a shift towards zero-emission vehicles. However, this target has been adjusted to allow for a broader range of low-emission vehicles until 2035. This change reflects a strategic approach to facilitate a smoother transition to EVs while ensuring that the necessary infrastructure and market conditions are in place to support widespread adoption. The revised target underscores the UK’s commitment to reducing carbon emissions and enhancing sustainability in the automotive sector.
Following suit with a 2035 target, Canada is aligning with global trends to reduce reliance on fossil fuels in the automotive sector. The US approach varies by state, with some states aiming for 2040 to phase out fossil fuel vehicles, reflecting a decentralised strategy in tackling climate change. The collective commitment from various countries and automakers to phase out fossil fuel vehicles by 2040 highlights a significant shift in the automotive industry towards sustainability and reduced carbon footprints.
Below is a map showing EV share of sales in 2023, displaying how far ahead Norway are as the only country above 75% of total sales being some breed of EV.
1.3. Demographic Differences Between EVs and ICEVs
The demographic differences between ICEVs and EVs are notable and can influence driving behaviour and accident patterns. Generally, EV owners tend to be more affluent, as EVs are often priced higher than their ICEV counterparts, which may skew the demographic towards older, more financially stable individuals. Tax benefits and subsidies such as salary sacrifice in the UK mean that higher earners are more likely to buy EVs. EV drivers are potentially more environmentally conscious, often prioritising sustainability and technology in their vehicle choices.
This demographic may also exhibit different driving patterns, with EVs being more commonly used for urban commuting and predictable journeys, while ICEVs may still dominate in rural areas and for longer trips.
Figure 2 shows the plug-in vehicles per 100 households against the gross disposable income (£) by local authority in the UK. We have removed outliers and we can see a positive correlation between income and plug-in penetration.
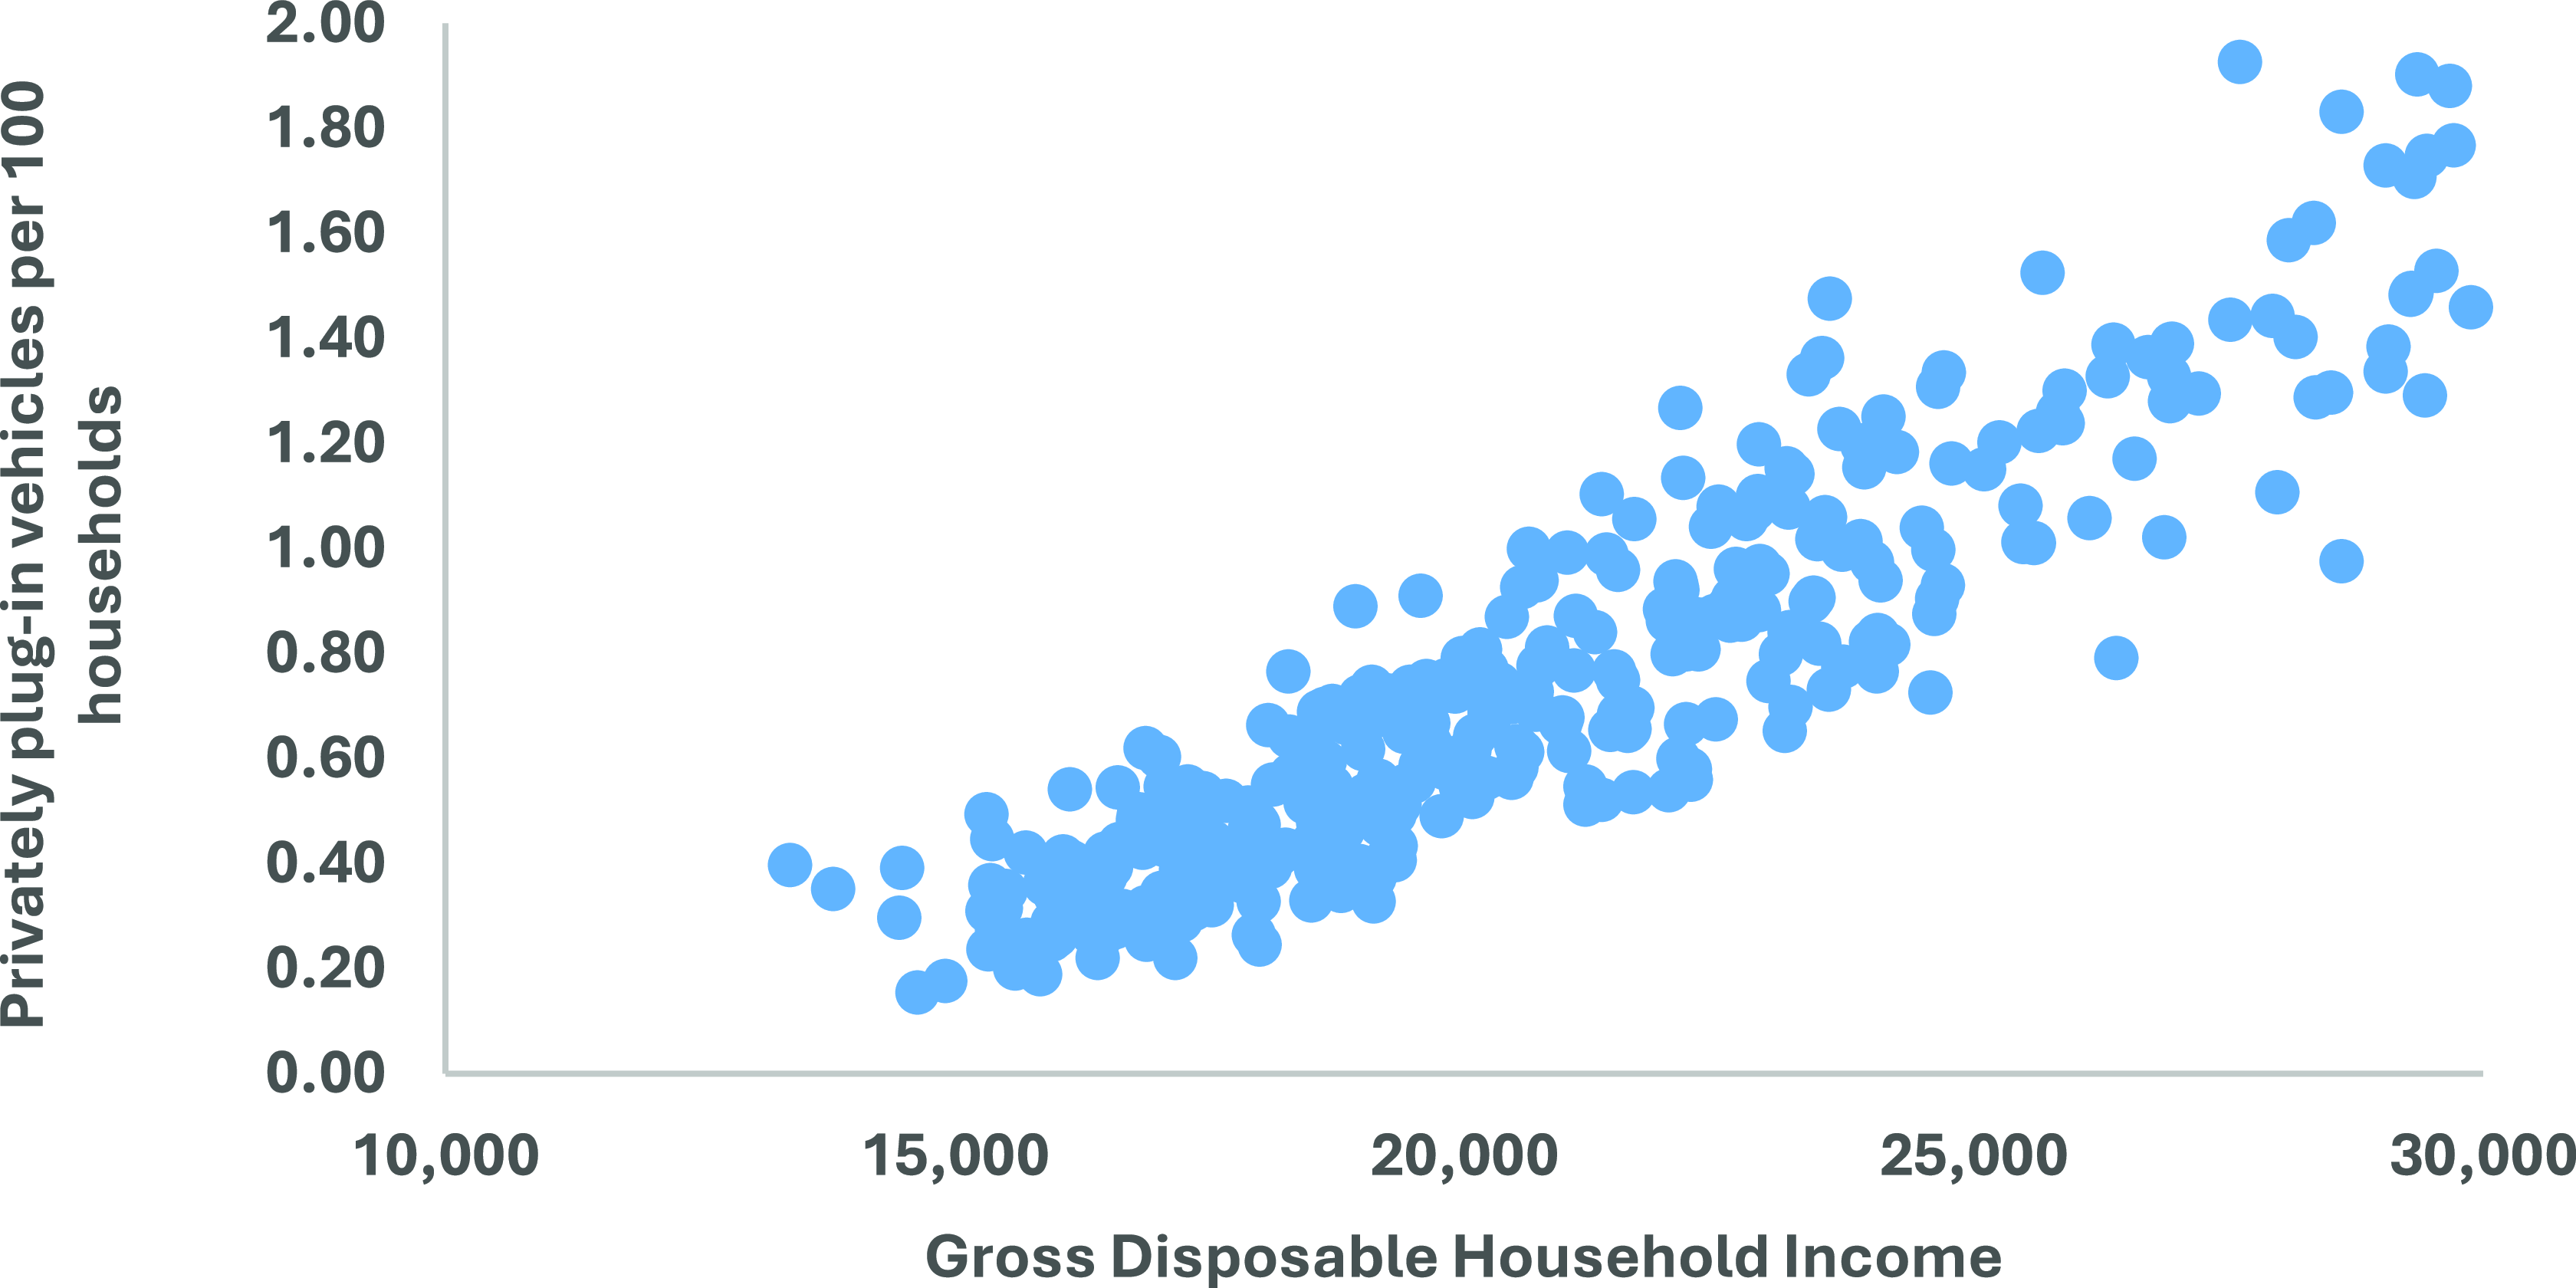
Figure 2. Privately licensed plug-in vehicles per 100 households (2020), by gross disposable household income per head (2019), UK.
1.4. Insurance Risks Associated with EVs
The transition to EVs presents a unique set of risks and opportunities for the insurance industry. As we navigate this evolving landscape, it’s essential to understand the implications of these changes on risk assessment and management.
Firstly, one of the most significant risks associated with EVs is the potential for higher repair costs. The advanced technology embedded in these vehicles, including sophisticated sensors and battery systems, can lead to increased claims costs when accidents occur. Insurers must adapt their pricing models to reflect these higher repair expenses, ensuring that policies adequately cover the potential financial impact on both the insurer and the insured. It is expected that these costs will change over time and reduce as the supply change adapts to the new technology.
While we demonstrate that EVs have the potential to demonstrate lower accident frequency, they are not without their challenges. There have been reports that the quieter operation of EVs can lead to a higher incidence of pedestrian accidents, as individuals may not hear an approaching vehicle. This highlights the need for targeted safety enhancements and awareness campaigns to mitigate these risks. Insurers should consider incorporating these factors into their underwriting processes, ensuring that they account for the unique characteristics of EVs.
The complexity of EV repairs can lead to longer claim processing times. Insurers may need to invest in training for claims adjusters to handle EV-specific damages effectively. This investment in knowledge and resources will not only improve efficiency but also enhance customer satisfaction during the claims process.
One of the more extreme risks associated with EVs is the potential for battery fires. While rare, incidents of battery fires can lead to significant damage and pose serious safety risks. Insurers must be prepared to address these scenarios, which may involve higher liability claims and the need for specialised repair facilities. This risk underscores the importance of thorough safety standards and regulations in the manufacturing and maintenance of EV batteries.
In terms of third-party own damage, all the above risks around increased repair costs and supply chain are still relevant. The unique characteristics of EVs, such as their weight and driving dynamics, can influence the nature of third-party own damage claims. For instance, the heavier weight of EVs may result in more significant damage to other vehicles involved in accidents, leading to higher repair costs for third-party claims. We look at weight of EVs compared to ICEVs in the severity Section 4.3.
In terms of bodily injury outcomes in the event of accidents, understanding these risks is crucial for managing large losses and helping analysts understand the differences in catastrophic claims between EVs and ICEVs. We show that EVs have lower accident frequency, however one of the concerns regarding EVs is their potential for higher severity in certain types of accidents, particularly those involving pedestrians and cyclists. The quieter operation of EVs can lead to a higher incidence of pedestrian accidents, as individuals may not hear an approaching vehicle. This increased risk of pedestrian collisions can result in more severe bodily injuries, necessitating targeted safety enhancements and awareness campaigns to mitigate these risks.
The weight of EVs, primarily due to their battery systems, can have potential to contribute to higher impact forces in collisions. This increased mass may lead to more severe injuries for occupants of smaller vehicles or vulnerable road users involved in accidents with EVs. As a result, insurers may need to adjust their risk assessment frameworks to account for the potential for greater bodily injury claims associated with EVs.
The advanced safety technologies integrated into EVs, such as advanced driver assisted systems (ADAS), automatic emergency braking and collision avoidance systems, can help reduce the frequency of accidents. However, when accidents do occur, the complexity of repairs for damaged sensors and other components can lead to higher claims costs. This complexity may also affect the speed and efficiency of claims processing, further impacting the overall experience for those involved in accidents. We examine bodily injury in different car types and there is evidence to show that bodily injury reduces in larger car types in the severity section.
The unique characteristics of EVs, including their driving dynamics and the presence of ADAS, can also influence the nature of injuries sustained in accidents. For instance, the regenerative braking systems in EVs may lead to different collision patterns compared to traditional vehicles, potentially affecting the types of injuries that occur.
We list some ADAS features in Table 3 that contribute to lower frequency:
Table 3. ADAS features

ADAS can also help to reduce severity as the features above help to reduce collision force and make drivers more aware to help react and reduce impact.
1.5. Geo Political Landscape and the Effects on EVs
Because of the supply chain effect discussed, EVs may be more exposed to the broader geo political landscape. The broader geopolitical landscape can significantly impact the EV market in various ways, influencing both supply chains and consumer adoption. Sourcing of raw materials for EV batteries, such as lithium, cobalt and nickel, is heavily dependent on geopolitical factors. Many of these materials are concentrated in specific regions, and any political instability or trade tensions in these areas can disrupt supply chains, leading to increased costs and potential shortages. For instance, if a country that is a major supplier of lithium faces sanctions or political unrest, it could hinder the production of EV batteries and, consequently, the availability of EVs in the market.
Additionally, international trade policies and tariffs can affect the cost of EV components and vehicles. Changes in trade agreements or the imposition of tariffs on imported EVs or their parts can lead to higher prices for consumers, potentially slowing down the adoption of EVs. Conversely, supportive trade policies that promote EV manufacturing and sales can encourage growth in the sector.
The global push for sustainability and carbon neutrality is shaping government policies and regulations. Countries are increasingly setting ambitious targets for reducing greenhouse gas emissions, which often include incentives for EV adoption. However, the effectiveness of these policies can vary based on the political climate and the commitment of governments to uphold environmental standards. In addition, there is an upfront cost to sustainability targets and political shifts can lead to changes in these policies, impacting consumer confidence and investment in EV infrastructure.
Furthermore, the geopolitical landscape can influence technological advancements in EVs. Countries that prioritise innovation and investment in clean energy technologies may lead the way in developing more efficient and affordable EVs. In contrast, regions that lag in these investments may find themselves at a disadvantage in the global EV market.
The geopolitical landscape plays a crucial role in shaping the future of EVs. Factors such as resource availability, trade policies, government regulations and technological advancements are all interconnected with the political climate. As the world continues to navigate these complexities, the EV market will need to adapt to ensure sustainable growth and resilience against geopolitical challenges.
While the rise of EVs brings new risks, it also offers an opportunity for insurers to innovate and adapt. By understanding the unique challenges posed by EVs, including extreme risks like battery fires, and implementing tailored strategies, the insurance industry can ensure a sustainable and secure future for all road users.
2. Literature Review
The increasing adoption of EVs has prompted a growing body of research examining their impact on road safety, particularly in comparison to ICEVs. This literature review synthesises key findings from various studies that analyse accident frequency and severity, focusing on the unique characteristics of EVs and their implications for road safety.
2.1. Overview of Electric Vehicle Safety
Research indicates that EVs are generally associated with lower accident rates compared to ICEVs. Introduction of EVs in Norway has coincided with a significant reduction in overall traffic accidents (Figenbaum & Kolbenstvedt, Reference Figenbaum and Kolbenstvedt2016). This trend is attributed to several factors, including the inherent design of EVs, which often prioritises safety features and stability. Furthermore, the integration of Advanced Driver Assistance Systems (ADAS) in many EV models has been shown to enhance safety by reducing human error, a leading cause of road accidents (Kumar et al., Reference Kumar, Singh and Gupta2020).
In addition, research by Ghosh et al. (Reference Ghosh, Kockelman and Bansal2021) indicates that the weight distribution and lower centre of gravity in EVs contribute to improved handling and stability, which can further reduce the likelihood of accidents. The authors argue that these design features, combined with the quiet operation of EVs, may lead to different accident dynamics compared to ICEVs, necessitating a deeper understanding of how these vehicles interact with other road users.
Moreover, studies by Hall & Smith (Reference Hall and Smith2020) and Kahn & Bansal (Reference Kahn and Bansal2021) have shown that the unique characteristics of EVs, such as regenerative braking and instant torque, can influence driving behaviour, potentially leading to safer driving practices. They found that EV drivers tend to exhibit more cautious driving behaviours, which may contribute to lower accident rates. Kahn & Bansal (Reference Kahn and Bansal2021) further emphasise the importance of driver education regarding the specific features of EVs to maximise their safety benefits.
2.2 Accident Frequency and Severity
Several studies have focused on the frequency and severity of accidents involving EVs. A comprehensive analysis by Bansal et al. (Reference Bansal, Kockelman, Wang and Zhang2020) found that while the overall frequency of accidents has decreased, the severity of accidents involving EVs tends to be lower than that of ICEVs (Wang et al., Reference Wang, Zhang and Chen2021), who conducted a comparative analysis of accident data in urban settings, revealing that EVs are less likely to be involved in severe accidents, particularly in congested traffic conditions. The authors attribute this to the lower speeds at which EVs are often driven, as well as their advanced safety features.
A study by Høye (Reference Høye2019) examined accident data across multiple countries and found that EVs had a significantly lower fatality rate compared to ICEVs. This study suggests that the lower severity of accidents involving EVs may be linked to their design, which often includes crumple zones and other safety innovations that mitigate the impact of collisions. Additionally, the research by Zhang et al. (2023) highlights that the environmental conditions, such as weather and road type, also play a crucial role in accident severity, indicating that further investigation into these factors is necessary to fully understand the dynamics of EV-related accidents.
Further supporting this, a study by Kockelman et al. (Reference Kockelman, Bansal, Wang and Zhang2021) found that the presence of charging infrastructure and its distribution in urban areas can influence accident rates, as EVs are more likely to be driven in areas with adequate charging facilities. This suggests that urban planning and infrastructure development play a significant role in shaping the safety outcomes associated with EVs.
2.3 The Role of Advanced Driver Assistance Systems (ADAS)
The role of ADAS in enhancing the safety profile of EVs has been a focal point in recent literature. According to a study by Lee (Reference Lee2022), features such as automatic emergency braking, lane-keeping assist and adaptive cruise control significantly reduce the likelihood of accidents. The authors argue that these technologies are particularly effective in mitigating the risks associated with distracted driving, which is prevalent among all vehicle types.
Research by Kockelman et al. (Reference Kockelman, Bansal, Wang and Zhang2021) indicates that the effectiveness of ADAS is amplified in urban environments where traffic congestion and pedestrian interactions are more common. The study found that EVs equipped with these systems experienced a notable reduction in collision rates, suggesting that the integration of technology can play a pivotal role in enhancing road safety (Kockelman et al., Reference Kockelman, Bansal, Wang and Zhang2021). Additionally, the work of Chen et al. (2020) supports these findings, indicating that the presence of ADAS not only reduces accident frequency but also influences driver behaviour, encouraging safer driving practices and increased awareness of surrounding traffic conditions.
Moreover, a meta-analysis by Gunter et al. (Reference Gunter, Smith and Lee2022) reviewed multiple studies on ADAS and concluded that these systems could reduce accident rates by up to 30% in certain driving conditions. This underscores the potential of technology to transform road safety, particularly as EVs become more prevalent in the market. The authors also highlight the need for ongoing research to evaluate the long-term effectiveness of these systems as they evolve (Gunter et al., Reference Gunter, Smith and Lee2022).
2.4 Implications for Insurance and Risk Assessment
The unique characteristics of EVs necessitate a re-evaluation of traditional insurance models. Research by Høye (Reference Høye2019) suggests that insurers must adapt their risk assessment frameworks to account for the distinct safety profiles of EVs. The study highlights the importance of incorporating factors such as vehicle technology, driver behaviour and environmental conditions into pricing models. As EV adoption continues to rise, understanding these dynamics will be crucial for actuaries and insurers in accurately assessing risk and setting premiums (Høye, Reference Høye2019).
Moreover, the study by Bansal et al. (Reference Bansal, Kockelman, Wang and Zhang2020) emphasises the need for insurers to consider the long-term implications of EV technology on accident rates. The authors argue that as EVs become more prevalent, traditional risk models may underestimate the potential for reduced claims due to the lower accident rates associated with these vehicles. This necessitates a shift in how insurers approach risk assessment, moving towards more data-driven models that reflect the evolving landscape of vehicle technology and driver behaviour. Additionally, the research by Ghosh et al. (Reference Ghosh, Kockelman and Bansal2021) suggests that insurers should also consider the potential for higher repair costs associated with advanced technologies in EVs, which could impact overall insurance pricing strategies.
Furthermore, the study by Kahn & Bansal (Reference Kahn and Bansal2021) highlights the importance of data analytics in refining insurance models for EVs. The authors argue that leveraging telematics data can provide insurers with insights into driving behaviour, allowing for more accurate risk assessments and tailored insurance products. This approach not only benefits insurers but also encourages safer driving practices among EV owners.
2.5 Future Research Directions
While existing literature provides valuable insights into the safety of EVs, there remains a need for further research to explore the long-term trends in accident frequency and severity as EV adoption increases specifically comparing it to ICEVs. Future studies should consider the impact of emerging technologies, such as autonomous driving, on road safety. The research by Zhang et al. (2023) indicates that the transition to fully autonomous vehicles may further alter accident dynamics, necessitating a comprehensive understanding of how these technologies interact with existing road safety frameworks.
Additionally, studies should focus on the behavioural aspects of EV drivers, including their usage patterns and interactions with other road users, to gain a comprehensive understanding of the factors influencing accident dynamics. Longitudinal studies examining the impact of EV infrastructure, such as charging stations and dedicated lanes, on accident rates could provide valuable insights into how urban planning and policy decisions affect road safety.
The research by Hall & Smith (Reference Hall and Smith2020) suggests that understanding the socio-economic factors influencing EV adoption can also shed light on accident trends. By examining how demographics and income levels affect driving behaviour and vehicle choice, researchers can better predict the implications for road safety as EVs become more mainstream.
2.6 Conclusion
The literature indicates that EVs present a lower risk profile compared to ICEVs, primarily due to their advanced safety features and the influence of driver behaviour. As the adoption of EVs continues to grow, ongoing research will be essential to inform insurance practices and enhance road safety. Understanding the nuances of accident frequency and severity in the context of EVs will enable stakeholders to make informed decisions that promote safer driving environments.
3. Materials and Data
Exposure data was gathered from the Norwegian government database, including the total million kilometres driven per fuel type and the number of registered vehicles per fuel type over the past four years. The roadway traffic volumes and registered vehicles were obtained from Statistisk sentralbyrå.
The summary of this data is shown in Tables 4 and 5 below.
Table 4. Number of registered vehicles

Table 5. Road traffic volumes by fuel type

2022 saw the number of EVs and Hybrids in Norway overtake the number of ICEVs. Registered EVs now represent over 33% of the total number of vehicles with the proportion growing rapidly. Interestingly, the average mileage driven in EVs is higher at 14.4k kms compared to 8.5k kms for petrol cars. This could be due to drivers who drive longer distances wanting the option with the cheaper fuel costs.
Traffic crash data from Norway was obtained from 2011 to 2023 from the Norwegian Public Roads Administration (NRPA). We obtained data from 2011 but have used the last 4 years only to focus on the most recent history and the volume of data as this was when EVs were most prevalent among the population.
This shows the average distance travelled per day for EVs is higher than for petrol cars as seen in Table 6. This is attributable to the lower running costs of EVs and is attributable to users with predictable driving patterns. Diesel cars are higher than both as diesel cars are designed for long-distance use. This might include more commercial usage such as vans and delivery vehicles.
We examine the crash data in the data set. Table 7 contains a summary of the crash data by fuel type.
Table 6. Average kilometres per day by fuel type

Table 7. Number of crashes by fuel type and year in Norway

For these 13,422 accidents we have obtained a detailed metadata as well as accident descriptions to help us analyse frequency and severity trends and propensities in detail. This is a credible dataset with 3,875 EV and Hybrid accidents to compare accident scenarios with ICEVs.
In order to analyse the differences in fuel types, we have removed light and heavy vehicles to give a homogenous portfolio of passenger cars. This removes the bias from light vehicles such as petrol motorbikes and heavy vehicles such as lorries and trucks. To focus on private car data we have filtered on the field “Personbil, stasjonsvogn (endret 2020),” which translates to “Passenger car, station wagon (changed 2020)” for vehicle type. We have also removed the small number of other fuel types such as “Gass,” “Etanol” and “CNC-Gass.”
Exposure and crash data sets were combined with the variables “Start Date” and “Geometry,” which meant any recorded accident that had the same date of occurrence and geometrical location were treated as the same event and we were then able to get a better insight into the individual accident features by combining two data sets with different accident parameters.
Some fields in the database were left blank; therefore, the total number of crashes in some of these tables representing crash scenarios may not match the overall sum of all recorded crashes.
Having the high-level exposure data over the previous four years enables us to normalise the frequencies by exposure, allowing for a more accurate comparison of the actual differences between fuel types based on probability measures.
4. Models
We analyse frequency of EV and ICEV crashes by looking at proportions of accidents by several factors and furthermore by normalising against kilometres driven.
4.1. Frequency
Table 8 presents the total normalised accident frequency over the past four years, along with a summary for all four years, based on the number of million kilometres driven per fuel type.
Table 8. Total accident frequency per million kms driven

We can see that ICEVs have a higher accident rate compared to electric vehicles. Overall, the analysis indicates a general decrease in the percentage of accidents for all vehicle types over the years, with electric vehicles showing a greater reduction than other fuel types.
Improvement over time may be attributed to:
-
Improvements in vehicle safety technology
-
Better road infrastructure and stricter driving enforcement regulations
-
Changing driving patterns post-pandemic which has led to a spread in driving habits
The overall frequency reduction is 17.3% reduction of accident frequency of EVs against ICEVs. As EV adoption increases and ICEV usage declines, we expect this declining accident frequency trend to continue. We explore this EV frequency performance by a number of features below.
It is noted that diesel cars have lower frequency than the petrol cars and a few reasons are given that may explain this:
-
1. Driving Environments – Diesel cars are potentially disproportionately used on higher-risk roads, urban deliveries or commercial work with frequent stops and turns. Petrol cars may be more commonly used for suburban or mixed-use personal driving, which might carry lower per-km risk.
-
2. Trip Characteristics – Diesel cars are often used for longer but fewer trips with more continuous driving, reducing the frequency per km driven.
-
3. Driver Risk Profiles – Driver attraction to diesel cars could differ, which includes company car drivers, van drivers, tradespeople and may engage in more professional behaviour.
-
4. Vehicle Types – Many larger vehicles use diesel such as vans and SUVs, which have different handling and better maintenance of safety systems etc.
It is also noted that hybrid frequency normalised for exposure is better (except for a spike in 2022) than EVs. Hybrids don’t depend on a charging infrastructure and hence might be used for longer trips where frequency is lower. There is lower range anxiety with hybrids and less instant torque, which may lead to less low-speed crashes.
Between 2019 and 2024, the landscape of motor insurance claims in Norway vividly mirrors the profound impact of the COVID-19 pandemic and the subsequent journey towards normality. In 2020, Norway experienced a drop in mobility, as lockdown measures curtailed travel, leading to a roughly 6.1% decline in kilometres driven compared to 2019 (Samferdsel/TØI, 2021). As restrictions eased in 2021, traffic volumes gradually rebounded, although they still lagged pre-pandemic levels for parts of the year. By 2022, mobility had largely returned to normal, aligning closely with pre-pandemic figures (TØI, 2022), which suggests that the frequency of claims had also stabilised to baseline levels. 2023 saw total kilometres driven at levels comparable to 2019, indicating a period of relative stability in exposure. Moving into 2024, traffic volumes remained steady compared with 2023, with Gjensidige observing stable or slightly lower underlying claim frequencies in Norway and Sweden during the final quarter (Gjensidige, 2025). While our analysis is influenced by the pandemic’s fluctuations, the adjusted frequency results, taking into account kilometre driven trends, offer a clearer picture of the true underlying patterns.
4.1.1. Collision Features
Table 9 breaks down the proportion of accidents across different scenarios. They display the proportion of accidents within each subset for each fuel type, followed by the probability of an accident per million kilometres driven. Additionally, they show the relativity in accident risk when transitioning from EV to ICEV fuel types.
Table 9. Frequency by road type

Both fuel types have the highest proportion of accidents occurring on single-car roads. However, there is a significant increase in the likelihood of a crash for ICEVs compared to EVs on these roads. In contrast, for nearly all other road types, EVs appear to be slightly more hazardous. Nevertheless, these other road types account for a much smaller proportion of total accidents.
Motorways have a higher accident frequency overall as these roads are relatively safe. However, EV frequency on motorways is higher than ICEV and this could be due to the demographic and driver effect on these roads.
Another notable factor is the accident rate on pedestrian streets, where there is three times more frequency moving from ICE to EV vehicles. This indicates a significantly higher frequency rate of accidents involving pedestrians for EVs compared to ICE vehicles. However, this subset accounts for only a small proportion of total accidents.
EVs show higher proportions and slightly higher accident chances on motorways. This trend needs further investigation as the expectation was for EVs to be safer on more predictable road types. This trend may be due to adjustments in the technology in EVs such as one-pedal driving and regenerative braking.
Single car road dominates most of the accidents in which EVs are performing better than ICEVs. However, for all other categories apart from walkway and cycleway, EVs are not performing as well. This can be attributed to the additional presence of more variables in these scenarios such as more cars or more pedestrians, in which ADAS may not be as helpful. Silent engines and higher torque may contribute to more crashes on these roads.
4.1.2. Time Features
Here we analyse the accidents by day of week and time of day. There is a clear difference in the frequency between the weekend and weekday. For both fuel types, weekends have a lower frequency, which may be attributed to commuting patterns in high traffic areas so fewer expected accidents in such situations.
Figure 3 shows accident proportions peak on Thursday and Friday for both EVs and ICEVs, reflecting higher vehicle activity or riskier driving behaviours. EVs have significantly lower accident proportions on weekends compared to ICEVs and lower when exposure adjusted every day of the week. EVs may be used for commuting and standard predicted journeys more than ICEVs which are used more for leisure and social journeys.
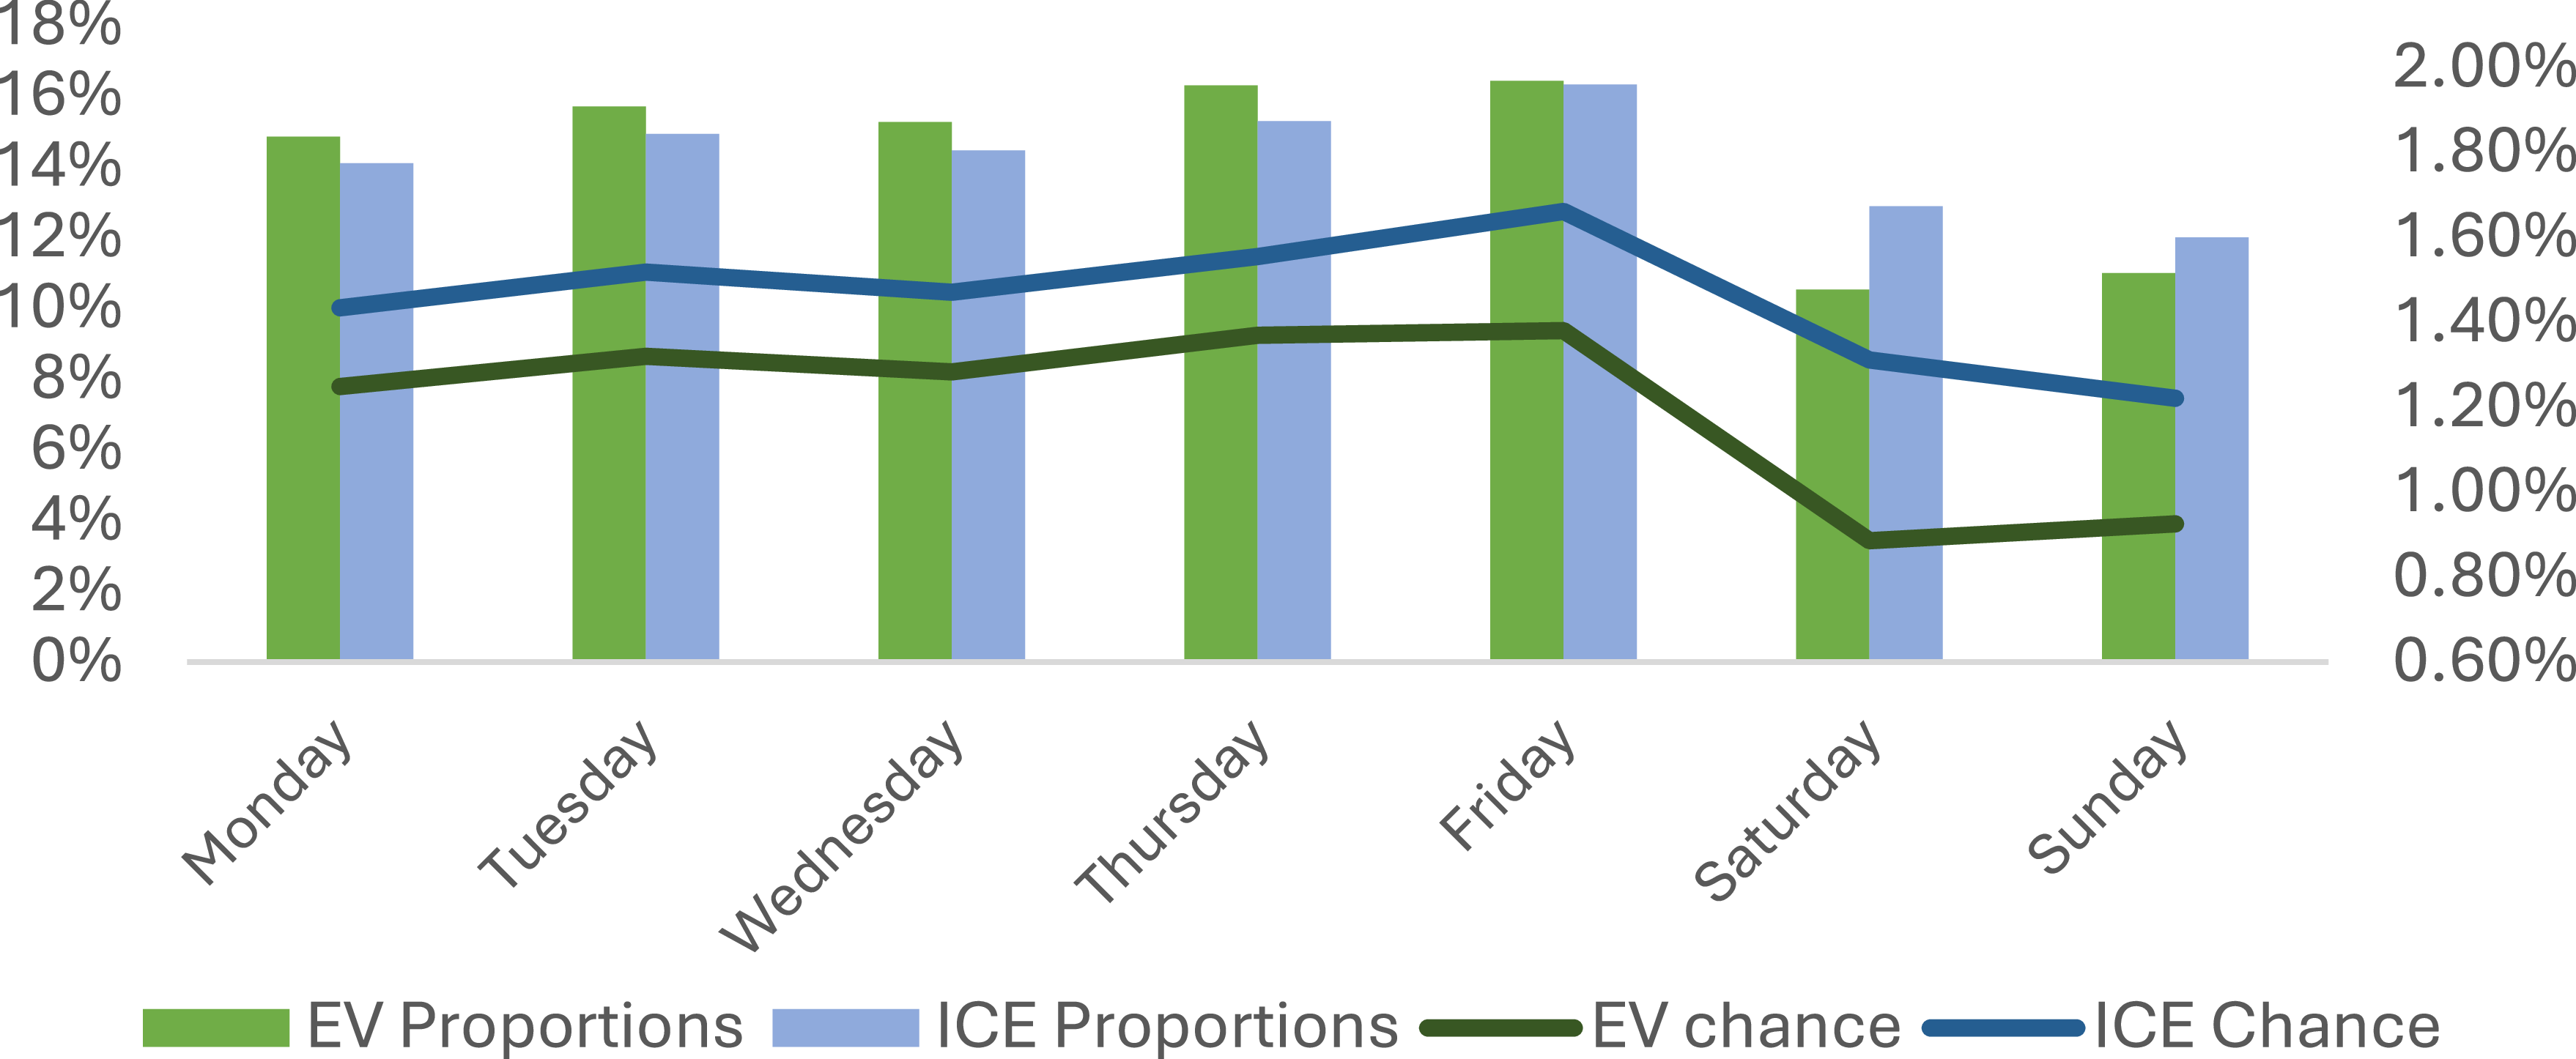
Figure 3. Accident frequency by day of week.
Figure 4 shows accident rates for both EVs and ICEVs exhibit a bimodal distribution, with notable peaks occurring during the morning commute (7am–8am) and the afternoon commute (2pm–4pm).

Figure 4. Accident frequency by time of day.
Late-night hours (12am–5am) show minimal accident proportions but higher relative risks (e.g. alcohol-related incidents or fatigue). There are fewer accidents at these time for EVs. There is more technology in newer cars that focuses on safety, which may be the reason the relative frequency of EVs is less than ICEVs.
4.1.3. Number of Units in Accident
Due to data protection rules the NPRA does not provide crash severity information in their data. It has been shown that accident size and number of units involved in the accident has a strong correlation with crash severity (Tamakloe et al., Reference Tamakloe, Hong and Park2020). That is the rationale behind later using the number of units as a proxy for the severity of the crash.
The number of units involved in an accident refers to the number of vehicles involved in the accident and is attributed to the vehicle at fault. Table 10 shows frequency by day of week. Table 11 indicates a significant decrease in single-unit accidents, suggesting that EV drivers or the advanced safety systems in these modern vehicles may be more effective at preventing isolated incidents.
Table 10. Frequency by day of the week

Table 11. Frequency by number of units

However, accidents involving more than two vehicles have remained approximately the same, indicating no significant difference between EVs and ICE vehicles in higher-unit collisions, with differences attributed to noise.
Most accidents involve 2 units or more as expected. However, EVs have fewer accidents involving just one unit, inferring that accidents with stationary objects are reduced significantly. This suggests EV drivers or vehicle systems are better at avoiding isolated accidents and roads with more variables involved have hindering effects on the ADAS in newer cars. Of the 17.3% reduction in frequency nearly 81% of this can be explained by the reduction in single-unit accidents.
4.1.4. Type of Accidents
We have categorised the type of accidents into nine groups from a wide range of accidents and descriptions. The following table summarises this proportion and frequency by type of accident.
EVs have higher proportions and frequencies than ICEVs of having accidents with pedestrians, most likely due to the quieter nature of EVs. However, they have considerably lower frequency in respect of accidents with stationary objects and single-vehicle accidents.
ICE vehicles have a higher chance of collisions on straight stretches, possibly linked to higher speeds or distracted driving. This may be a lack of advanced modern ADAS that can avoid skidding or swerving off road.
EVs have higher proportions but lower chances compared to ICE vehicles of accidents at straight sections of roads outside junctions. EVs are safer at junctions compared to ICEVs, reflecting possible benefits of collision avoidance systems or driver caution. ICEVs exhibit higher risks in straight-road sections outside junctions, possibly linked to higher speeds or less urban use. Table 12 shows frequency by type of accident, Table 13 shows frequency by junction type and Table 14 shows frequency by speed limit.
Table 12. Frequency by type of accident

Table 13. Frequency by junction type

Table 14. Frequency by speed limit

ICEVs have a disproportionate number of crashes on the 80 km/h roads, which translates to our single road accidents, as most roads outside the cities are single lane with a speed limit between 60–80 km/h. These can be attributed to EVs behaving better on single roads due to ADAS preventing single-car collisions.
However, at less common speed limits in urban areas and motorways we can see EVs behaving adversely. Norway has good motorways with speed limits between 90–110 km/h and in residential areas it ranges form 30–50 km/h. These urban and high-speed areas are seeing the EVs performing worse than ICEVs which may indicate areas in which the future of ADAS needs to be focused.
This could also be induced by the concentration of EVs in areas with a modern infrastructure, and the bias to need more facilities (e.g. chargers).
This could explain the drastic reduction in the rural road areas as EVs not being as popular on such roads. The concentration in motorways and urban areas for EVs can be explained as EVs being biased to take these roads rather than back roads due to infrastructure needed for charging, which wouldn’t be available on rural roads.
ICEVs face significantly higher accident risks at mid to higher speeds, likely due to greater rural and highway use.
One area that should be investigated is whether speeding was a factor in these crashes, as many EVs may not allow speeding knowing the speed limit, leading to stricter following of speed limits.
Table 15 shows frequency by weather conditions and Table 16 shows distribution by fuel type.
Table 15. Frequency by weather condition

Table 16. Distribution of accidents by fuel type

EVs outperform ICEs in all weather conditions, likely due to advanced safety systems. The highest improvements are in “Good visibility, precipitation” and “Poor visibility, precipitation” showing that perhaps the ADAS is working irrespective of the visibility.
Both vehicle types experience higher risks in bad visibility without precipitation, reflecting reduced driver awareness.
4.2. Frequency Summary
Across nearly all dimensions (type of accidents, road types, speed limits, weather), EVs demonstrate lower accident frequency compared to ICE vehicles, highlighting their advanced safety technology and possibly more cautious driver behaviour. This is seen by the normalising of frequency by exposure giving us a lower percentage chance over the most recent four years.
From our analysis, there is an 8.41% frequency of EV crashes compared to 10.17% for ICEV crashes, a 17% decrease.
There are some scenarios where EV frequency is higher than ICEV frequency. EVs are more frequently involved in pedestrian accidents and rear-end collisions compared to ICEVs. These trends may reflect driving behaviours such as higher torque and acceleration in EVs, or their quieter nature, which could reduce pedestrian awareness.
However, EVs demonstrate a significantly lower frequency of single-vehicle accidents compared to ICEVs. This may suggest superior stability control systems or better adherence to road conditions.
EVs dominate urban environments, as evidenced by higher accident proportions in urban speed zones and pedestrian streets.
The superior performance of EVs in high-risk areas (e.g. single-vehicle accidents, junctions, bad visibility) underscores the role of ADAS and vehicle design in reducing accident risk.
The improvement here will not be due to solely the fuel type but may also be due to:
-
1. Technology Effect: Advanced driver-assistance systems (ADAS), improved sensor and technology and monitoring road objects and stationary obstacles.
-
2. EV composition: EVs have a different vehicle composition to ICEV, with much quieter engines, heavier batteries and much greater torque and acceleration. This suggests greater pedestrian type collisions but fewer collisions with stationary objects.
-
3. Demographic composition: EVs are still more expensive than ICEV and as a result will appeal to a more affluent demographic. This will skew the results to older male drivers. This will lead to different driver behaviour, driving areas and transport uses.
-
4. Car usage: EVs, due to their range will be used for shorter distances than typical ICEVs. This will tend to be more for urban driving, and more predictable journeys such as commuting to work.
-
5. Necessary Infrastructure: EVs are somewhat limited to short trips on roads with charging ports unlike their ICEV counterparts, which may lead to higher concentration on road types with the necessary infrastructure to allow them to charge.
4.3. Severity
The severity in this study builds on two papers that have examined historical data in Norway. Here we discuss and compare the studies and show the enhancements we have made. Furthermore, we then use insurance data obtained to further try to quantify severity on different heads of damage.
The first paper is a research study that investigates the characteristics and trends of EV crashes in Norway from 2011 to 2018 (Liu et al., Reference Liu, Zhang and Wang2019). It highlights the increasing proportion of EV adoption and crashes, then identifies unique features of EV crashes compared to ICEVs, noting that EV crashes tend to occur more frequently during weekday peak hours, in urban areas, at roadway junctions, and on low-speed roadways with good visibility. The study employs logistic regression models to assess factors influencing crash severity for both EVs and ICEVs, revealing significant differences in how various factors affect crash outcomes for the two vehicle types. The findings suggest that EVs pose specific safety challenges, particularly to pedestrians and cyclists, due to their quiet operation. The study analyses approximately 350 accidents, whereas now we have over 3,800 accidents to analyse.
The second paper (Hou et al., Reference Hou, Su, Liu, Li and Ma2024) looks at EV data over a two-year period from 2020 to 2021 and investigates traffic accidents involving EVs focusing on the factors that influence the size of these accidents, defined as the number of traffic units involved. The study employs an ordered logit model to analyse data collected covering various aspects such as time of day, roadway type and environmental conditions. The findings indicate that most EV accidents occur on medium- and low-speed roads, primarily during peak hours and in good visibility conditions. The research highlights that rear-end collisions are the most common type of accident, likely due to the unique driving characteristics of EVs, such as their regenerative braking systems. The study also discusses the implications of these findings for traffic safety and suggests potential measures to mitigate risks, particularly for vulnerable road users like pedestrians and cyclists. The paper acknowledges limitations of the study and recommending further research to enhance understanding of EV safety features and driver behaviours. The paper doesn’t compare the severity of EVs to ICEVs, which we attempt to do.
The enhancements here are made by using more recent data where EV adoption now gives us more statistical significance and secondly by comparing on a commensurate basis to ICEVs. Our paper reinforces the findings of the previous studies regarding the prevalence of EV crashes during peak hours and in urban settings. It also acknowledges the unique safety challenges posed by EVs, particularly their quiet operation, which aligns with the conclusions of the first study. However, we delve deeper into the factors influencing crash severity, potentially offering new insights that could help analysts understand EV severity and relativity to ICEV better.
4.3.1. Modelling Severity
Within the NPRA data, crash severity and cost of claims information is not available due to data protection concerns and GDPR, hence we cannot use the severity of the accident exactly. We have instead opted to use number of units involved in the accident as a proxy. Many researchers have shown the number of involved units in an accident has a strong positive correlation with crash severity (Tamakloe). This infers that the greater the number of units involved in an accident the more severe the accident. Here we use number of units as a proxy for accident severity. Table 11: Frequency by number of units shows the proportional number of units involved in each accident and that most accidents involve 2 units or more. It is important to note that while the number of units serves as a useful general indicator, the actual size of claims can vary immensely within each category. For instance, an accident involving 1 unit may lead to a very large bodily injury claim, bigger than an accident involving multiple units or conversely a small personal accident claim.
4.3.2. Regression Model Selection
To analyse severity of EVs against ICEVs we tested a number of regression models. We fit several OLMs (ordered logit models) for both EVs and ICEVs. OLMs have been historically used in traffic crash analysis (Su, 2022). There are numerous advantages to using OLMs, particularly in their ability to effectively manage ordered dependent variables. OLMs are specifically designed to handle situations where the outcome variable is categorical and has a natural order, such as ratings or rankings. This characteristic allows for a more nuanced analysis compared to traditional regression models, which may not adequately capture the ordinal nature of the data.
Additionally, OLMs provide insights into the relationships between independent variables and the ordered outcomes, enabling researchers to understand how changes in predictors influence the likelihood of different outcomes occurring. The use of OLMs offers significant benefits in handling ordered dependent variables, providing deeper insights and enhancing predictive capabilities in various research contexts.
To model crash severity, our objective was to develop a model that accurately predicts the number of units involved in a crash based on various crash characteristics. We fitted multiple models and evaluated their performance using a range of statistical metrics.
The confusion matrix and corresponding performance indicators for each model are presented in the appendix, along with a detailed justification for the selection of each model. The confusion matrix is a performance measurement tool used to evaluate the accuracy of the OLMs. It is used to assess how well the model is performing by comparing the predicted classifications to the actual classifications. The confusion matrix displays the counts of true positive, true negative, false positive and false negative predictions across different categories of the ordered outcome variable. Each row of the matrix represents instances in a predicted class, while each column represents instances in an actual class.
To ensure reproducibility, we set a fixed random seed before splitting the dataset into training and test sets. We used an 85:15 split, allocating 85% of the data for training and 15% for testing.
To facilitate computation, we categorised key crash characteristics into factorised levels, including:
-
Day of the Week: Weekend or Weekday
-
Speed Limit: Fast, Medium or Slow
-
Daytime: Day or Night
-
Road Feature: Junction or Straight Segment
-
Road Condition: Wet, Dry or Icy
These factorised variables enabled a more structured and interpretable modelling process while maintaining computational efficiency.
By categorising the data into EV and ICEV crashes, while retaining all relevant crash characteristics, we obtained 3,615 EV crashes and 8,915 ICEV crashes. This distribution provides a robust and well-balanced data set, enabling the development of a comprehensive and reliable predictive model for crash severity.
The training split should give a good representation of the distribution of number of units in accidents. In our training model using our seed we get the following distribution.
Two unit collisions are the most dominant factor in both accident data sets; in EVs it represents 69.0% of the accidents and in ICEVs it represents 60% of accidents.
There is extensive work done in model selection in the appendix showing the rationale and differences between each potential model. Each of the tested models has differing weaknesses.
4.3.3. Severity Output
The model we have taken forward to show the expected effect of certain characteristics is the baseline OLM model (shown in appendix). This model has the highest accuracy and is not implementing any changes to the data that may skew the effect of certain characteristics. It is also the most parsimonious model and using the philosophical idea of Occam’s razorFootnote 1 this is the model we should choose. To consider the model’s inherent weakness of over prediction on two-unit collisions we focus more on the proportional effects of factors rather than the difference on magnitude.
The baseline OLM severity model has the best predictor of unit crashes that proxy severity
We estimated and parametrised the OLM model using RStudio, utilising the “MASS” package on the entire dataset. The summary of the regression analysis is shown in Table 17 for both EV and ICEV.
Table 17. OLM analysis of number of units

The variables that are statistically significant are highlighted in bold. This shows that for EVs weekend or weekday, the speed limit, day or nighttime are significant. For ICEV we have the same variables and an additional two: whether the crash is on a segment or a junction and whether the road is wet or not.
The base case has been set as a private car accident on a weekend at daytime (5am–9pm). The road is dry and has a speed limit of above 80 km/h (fast) and the crash occurs at a junction. Estimation is 2.8 units involved for EV crash and 2.7 for ICE. This is a 3.1% increase in units estimated involved for EVs compared to ICEVs.
Utilising these variables, there are 72 distinct scenarios in which the OLM can estimate the number of units involved. In these scenarios, the average estimated units for EVs is 2.04, while for ICEVs it is 1.89. This represents an increase of 7.9% in the average number of units estimated across the scenarios of EVs compared to ICEVs.
4.3.4. Severity Scenario Testing
We compare the estimated severities of each scenario in a like for like representation which may give better insight into the scale of the difference between the EV and ICEV crashes.
4.4. By road Speed
In Figure 5, the EV and ICEV severity are compared. Any point below the 45-degree line is a scenario in which EVs perform worse than ICE and any point above the line is a scenario in which ICEVs perform worse than EVs.

Figure 5. Severity by fuel type and road speed.
Also shown is the severity split by road speed limit on the corresponding accident, which gives insights on what speed alone does to the estimated units involved in the crashes.
This analysis shows that EV severity is in most scenarios higher than ICEV, except for a few specific cases. A key finding here is that OLM predicts all the highest severity claims to be on roads with fast speed limits (81 km/h +) shown by the dots in blue. Then the lowest severity claims for both fuel types were on medium (51–60 km/h) or slow (<51 km/h) roads.
The red dashed lines represent the average of the axis on which they originate with the average EV severity at 2.04 shown on the x-axis and the average ICE severity at 1.89 shown on the y-axis.
4.5 By Road Type
We check on the proportion of the differences of the estimated severity using the change,
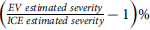 $\left( {{{EV\;estimated\;severity} \over {ICE\;estimated\;severity}} - 1} \right)\% $
. We do this on a scenario basis, where each point used is on a like for like basis.
$\left( {{{EV\;estimated\;severity} \over {ICE\;estimated\;severity}} - 1} \right)\% $
. We do this on a scenario basis, where each point used is on a like for like basis.
This highlights which fuel type is performing better in each scenario. We ordered the performance in the Figure 6. This shows from left to right the scenario in which EV performs best relative to ICE and gradually decreases as we continue right. All the values below the x-axis are scenarios in which EV severity is better than ICEs and above we can see it reaches as high as EV having more than 20% severity.

Figure 6. EVs against ICEVs severity by type of road.
The data is split into two segments, one for accidents at junctions and the other at straight segments of road. We can see that at junctions EVs do on average perform poorer but not of the same magnitude as for straight segments of road.
The average performance of the metric is 8.3%, represented in our graph by the dashed red line. This shows an important insight into the impact of junction and segment on the estimated OLM severity. There is a clear split in which junction is causing EVs to perform better relative to ICEVs and in some cases better as seen by the first few scenarios, which are below the x-axis.
4.6 By Day of the Week
We also show another interesting finding – the impact that weekend and weekdays have on the performance of EVs compared to ICEVs.
Although not as pronounced as type of road, we do see that weekdays tend to have a positive impact on the severity of EVs in relative to ICEVs. The average is represented by the dashed red line, showing on most cases Weekdays are below the average that is shown in Figure 7.

Figure 7. EVs against ICEVs severity by day of week.
There is clear interaction between the variables that is shown in Figure 8, but when comparing the two-way tables we can draw some further interesting conclusions. Lower speed limits are strongly associated with reduced accident severity for both EVs and ICEVs, with EVs showing a slightly stronger reduction. This suggests that speed control policies are particularly effective for EVs; this could be due to EVs having better technology around speed limiters and speed warning systems.

Figure 8. EVs versus ICEV by severity.
There are more interactions to be seen, the sequence of charts in Figure 8 shows the distribution of the EVs versus ICEVs severities, split by the different variables.
On each y-axis is the ICEV estimated severity and on the x-axis is the EV estimated severity.
Straight road segments reduce severity significantly for ICEVs but not for EVs. This may indicate that EV drivers or systems handle straight stretches differently.
EVs appear to handle challenging conditions (e.g. nighttime) slightly better than ICEVs, likely due to modern safety systems. However, ICEVs show more predictable reductions in severity on straight roads.
EVs and ICEVs differ in how accident severity is influenced by various factors. EVs generally perform better in conditions like nighttime, possibly due to advanced technology. However, ICEVs show more predictable severity reductions in straight-road conditions. These findings highlight the need for tailored safety strategies based on vehicle type and driving context.
ICEVs have lower severity in nearly all areas except slower roads. Tying back to frequency, we can see that single-unit accidents have dramatically decreased for EVs, which may have a knock-on effect for severity, in that there is now a sample bias towards more severe accidents as we are using units as proxy. This may cause the overall level of units to increase in nearly all areas as the less severe accidents have been avoided by the ADAS. When an accident does occur, we see more severity but in fact the chance of it just being a single unit has decreased drastically.
For both EVs and ICEVs, lower-speed limits correlate with reduced accident severity. However, EVs benefit slightly more from these reductions, emphasising the importance of speed management policies in mitigating severity for these vehicles.
Urban roads significantly reduce accident severity for both vehicle types, but rural roads show a stronger reduction for ICEVs. This suggests that ICEVs benefit more from the unpredictable nature of rural driving, whereas EVs may already have features that mitigate severity in less predictable environments.
ICEVs exhibit a greater reduction in severity on straight-road segments compared to EVs. This could indicate that ICEV drivers adjust their driving behaviour more effectively in such conditions.
This section of the paper delves into the complexities surrounding the severity of accidents involving EVs compared to ICEVs. It reveals that, in general, ICEVs are associated with less severe accidents; however, this trend varies based on factors such as road type, road conditions and time of day. Notably, EVs tend to perform better on less predictable roads, likely due to the advanced technology integrated into these vehicles. The analysis employs ordered logit models to assess the number of units involved in accidents, which serves as a proxy for severity. The findings indicate that while EVs have a lower overall accident frequency, they may experience higher severity in specific situations, such as pedestrian accidents. This section emphasises the need to consider the interplay of various factors, including visibility and road characteristics, in understanding accident severity. The insights derived from this analysis are vital for shaping effective safety strategies and informing insurance practices in the context of the evolving automotive landscape.
4.7. Quantifying Severity by Fuel Type
The analysis of severity so far has relied, as previous studies have, on number of units being a proxy for size of claim. This has shortcomings and is difficult to translate into an insurance context. We have expanded the research to examine data from the Highway Loss Data Institute (HLDI), which collects data by type of loss and make and model. We refer to type of loss as heads of damage or type of loss as is common in the UK insurance market. The data comprises of over 600 different car models and we have categorised this data and linked to model type, fuel type and weight to look at EVs compared to ICEVs and differences by insurance heads of damage.
Within the data set we had 50 different electric vehicles models, which we classified to their equivalent petrol model. For example, a Hyundai Kona 4dr was paired with its electric equivalent a Hyundai Kona electric 4dr. The pairs had to be the equivalent from the same manufacturer in this analysis. For electric only cars with no direct equivalent found, such as Teslas, these were not used to keep the comparison on a like-for-like basis. We found 28 pairs and the simple average of these 28 pairs was taken. This means for our analysis we are comparing the closest equivalent ICEV and EV possible and changes in weight and cost are not attributable to different manufacturer specifics.
4.7.1. Weight Analysis
As expected, electric cars are heavier than petrol cars and the differential depends on the category of car. On average, electric cars are approximately 23% heavier. The split by car type is in Table 18:
Table 18. Average weight by car category (lbs)

The primary difference is because of the lithium-ion batteries used in EVs, which are typically very dense and heavy. A typical 77 kWh battery can weigh 1,000–1,500 lbs, whereas a full tank of petrol will weigh 100–150 lbs. EVs typically require stronger frames and crash protection for their battery packs as the battery packs are placed low in the chassis, which improves handling but requires reinforced underbody protection. Extra crumple zones and side-impact reinforcement in EVs can add extra weight.
Table 19 gives a summary of the implications of the weight:
Table 19. Implications of EV weight

When we look at all of the makes and models regardless of fuel type against heads of damage, there is a weak positive correlation between weight and property damage as seen in Figure 9. This lends to the effect that the bigger and heavier the car, the more damage it will do.

Figure 9. Property damage size against weight.
Conversely, bodily injury the converse is true. There is a weak negative correlation between bodily injury severity and weight of vehicle as seen in Figure 10.

Figure 10. Bodily injury severity size against weight.
This is potentially due to larger vehicles having more technology and protection for drivers and passengers as well as more physical separation to the collision.
4.7.2. EV versus ICEV Average Cost Comparison
Table 21 shows the percentage increase in claim cost for electric compared to petrol cars by US heads of damage. It is important to note that we have only used direct pairs of comparable makes of car. Data for all heads of damage was not available for all pairs so across heads of damage the number of pairs differs and this is also shown in Table 21. We can see that for the injury cost the available data decreases considerably. There is also considerable volatility between different pairs. Our rigour in using direct matches of makes and models makes the analysis challenging but gives us a useful starting point to analyse the differences between EVs and ICEVs. We have taken a straight average rather than attempting to weight by usage or sales. We also show an average by removing the top and bottom deciles in order to remove the outliers. Finally, we show our choice to use in the analysis given the available data and diagnostic tests.
Table 20. Increase in electric claim cost by heads of damage

Table 21. Heads of damage summary

Table 20 offers insight into how the characteristics of EVs including their design, technology, user base and usage patterns influence risk and insurance outcomes. We analyse each head of damage to understand the underlying drivers and potential implications.
These heads of damage are the categorisations in the US and their applicability to the UK as well as reasoning is given below:
Collision relates to the cost of repairing the insured vehicle following a collision or other incident where the policyholder is at fault. The 22% increase in collision claims for EVs is consistent with expectations based on the structural and technological differences between EVs and ICEVs. EVs typically feature complex electronics, high-voltage battery systems and integrated sensor suites that support ADAS as discussed earlier. These components are costly to repair or replace and may require specialist repair networks, contributing to both higher parts costs and labour rates. Additionally, repair times for EVs can be longer due to availability of specialists and safety protocols related to battery handling, which further elevate costs. A 25% increase in EV cost is used in our analysis.
Property damage relates to third-party property damage, which includes damage to other vehicles or property caused by the insured driver and shows only a marginal increase of 3% for EVs. This modest uplift may reflect a combination of offsetting factors. On the one hand, EVs are generally heavier due to their battery packs, which could result in more substantial damage when collisions do occur. On the other hand, many EVs are equipped with ADAS features such as automatic emergency braking and lane-keeping assist, which may reduce impact severity. The demographic profile of EV drivers may be associated with safer driving behaviour. The near-parity in this category suggests that any increase in vehicle mass or repair cost is being counterbalanced by reduced collision frequency or lower-speed impacts. A 5% increase in cost is used in our analysis.
Comprehensive relates to theft and non-crash losses. Theft and non-crash losses are 9% lower for EVs, which likely reflects both technological and behavioural factors. EVs tend to incorporate more advanced security systems, including immobilisers, GPS tracking and over-the-air software updates that can disable functionality in the event of theft and help to recover the vehicle more quickly. Moreover, the relative immaturity of the EV parts aftermarket, combined with the proprietary nature of many EV components, reduces the incentive for theft for resale. These vehicles are also more likely to be garaged or parked in secure locations, especially given the need for home charging infrastructure. Collectively, these elements contribute to a lower-risk profile for theft-related claims. However, if cars are stolen or are hit by natural perils such as flood or hail they are more likely to be a write-off if there is damage to essential circuitry or components. For this reason we have chosen to be cautious and picked a 10% increase in costs for theft.
Personal injury claims, which refer to injuries sustained by the driver or passengers of the insured vehicle, are 24% lower for EVs. This suggests that less severe injuries to occupants occur in EVs. This may be attributed to smoother acceleration profiles, regenerative braking and a high prevalence of safety technology such as collision warnings and automatic braking. Structural design differences, such as the placement of the battery pack low in the chassis, may also enhance vehicle stability and crashworthiness. Additionally, driving behaviour likely plays a role; EV drivers may drive more conservatively due to range anxiety or increased awareness of regenerative braking efficiency. Our pick is a 20% reduction in costs for EV.
Bodily injury relates to third-party liability and bodily injury claims covers injuries to other road users caused by the insured are also 23% lower for EVs. This reduction is likely driven by similar factors: enhanced vehicle control, earlier braking and high ADAS adoption, all of which help prevent collisions or mitigate their severity. Our choice here is a 15% reduction.
Given that bodily injury claims are often the most costly and unpredictable component of motor insurance, this reduction is particularly noteworthy for insurers. It suggests that the introduction of EVs may contribute to lower average claim severities and improve overall portfolio loss ratios, at least in certain segments.
The differential performance of EVs across heads of damage suggests that traditional risk models may need recalibration. The marked reduction in injury-related claims presents a potential for long-term cost savings and improved safety outcomes, yet this is offset by higher costs associated with own damage repairs. For insurers, this may necessitate the development of more granular pricing structures that reflect the unique loss experience of EVs. EVs appear to move the insurance cost burden away from human harm and toward complex, high-value physical repairs. We analyse the overall effect below.
4.7.3. Severity by Heads of Damage Analysis
Using data available from the Association of British Insurers (ABI) in the UK we can look at the average cost of each head of damage from their survey of current outstanding and incurred claims in the UK.
Translating the US categories to the UK is straightforward using the above reasoning. Additionally the UK has two more categories:
Windscreen – We have looked at some high-level data from Lexis Nexis and windscreen replacement due to increased sensor cost and technology such as heads up display is considerably more expensive for EVs than ICEVs. We have made a choice of 40%.
Replacement Vehicle – EVs are more expensive than ICEVs in terms of cost and hence replacement. However, like-for-like is not always authorised by the insurer. Here we have made a choice of 15% increase in cost for EVs against ICEVs.
From the ABI for claim costs, we have taken data as at the end of 2024 Q4. We have applied the percentage changes from our analysis from the HLDI data above to obtain average costs for EVs by heads of damage. Using GC Analytics exposure and claims analysis of UK motor insurers we obtained an average contribution of each head of damage.
This data is summarised in the Table 21.
We note that the average increase in cost is 1.5% with the damage and injury costs approximately cancelling out.
However, for larger claims the proportions will change and will be more skewed towards bodily injury costs and hence the distribution of the severity curve will change. Below we try to measure this change in the shape of the severity distribution.
We apply a Lognormal distribution to all heads of damage and a Pareto distribution to bodily injury claims to reflect the tail of the injury losses. The parameters of these distributions are derived from our analysis of Solvency II premium coefficient of variations, credit agency models and GC Analytics motor claims study.
We have built a simulation model where we analyse and simulate each head of damage separately. The model is then programmed to use logistic curves to derive dynamic weights depending on size of claims and apply these weights to derive a dynamically weighted total.
Figure 11 shows the logistic curves by heads of damage and shows how the bodily injury cost increases with claim size.

Figure 11. Logistic dynamic weights by heads of damage.
Our approach entails simulating the claims and determining the weights based on the total unweighted amount. Subsequently, we apply the curves in Figure 11 to derive a weight that corresponds to the size of the claim. These weights are then normalised to produce a new set of weights for each simulation.
The results presented in Table 22 illustrate a comparison between static weights, which maintain the same proportion across all simulations and dynamic weights, which adjust according to the size of the claim.
Table 23 shows the summary of the frequency and severity analysis.
Table 22. Change in distribution of EVs compared to ICEVs

Table 23. Frequency and severity summary

Using static weights the mean of the severity distribution is 1.6% higher for EVs than for ICEVs. However, when dynamically weighting the heads of damage, we observe that the tail of the distribution is more skewed towards bodily injury claims which have a bigger reduction for EVs and leads to a reduction in the tail of the distribution and consequently the mean. Conversely, for the smaller claims the damage costs are higher for EVs and the distribution at the lower percentiles is higher for EVs than ICEVs.
4.8. Severity Summary
We have analysed severity and average size of claims from accident data and from insurance data. The findings from the accident data using 4,000 accidents and using number of units involved as a proxy for severity show a 7.9% increase in severity for EVs. This regression analysis shows that there are several nuances by road time, time of day and accident conditions.
Using insurance data the severity of claims differs substantially by heads of damage and size of claim. Analysing this we have observed that property damage costs have higher costs compared to ICEVs. However, for bodily injury costs EVs have a significant reduced loss cost. This change in claims distribution by heads of damage means that claim costs could increase for smaller claims but reduce for larger claims. We have shown the change in distribution of claims using a dynamically weighted method which shifts the distribution up at lower percentiles and down at higher percentiles.
5. Conclusions and Discussion
The analysis of accident frequency and severity between EVs and ICEVs provides valuable insights for insurers, analysts and automotive professionals. These differences are shaped by technology, driving conditions and driver behaviour, influencing both the frequency and severity of claims.
The transition to EVs brings a shift in risk characteristics that necessitates adjustments in risk assessment frameworks. Understanding these changes is crucial for insurers aiming to provide accurate pricing, for manufacturers developing safer vehicles and for regulators shaping road safety policies.
EVs exhibit lower accident frequency overall, especially in adverse conditions such as poor visibility, wet roads and nighttime driving, likely due to ADAS and stability controls. However, they show higher accident frequency in some scenarios such as in pedestrian incidents and rear-end collisions, emphasising the need for targeted safety enhancements.
With regards to severity, our analysis shows severity tends to be slightly higher than that of ICEVs on average when using number of units in the collision. Extending the analysis and using quantum of claims by heads of damage shows that average claim size differs by head of damage and type of claim. Damage related costs increase and this can be attributed to factors such as vehicle weight, repair costs and battery-related risks. Injury related costs are shown to decrease and this can be attributed to better safety technology, larger cars and adaptive braking. This effectively changes the shape of the distribution of motor claims for EVs.
The findings highlight that while EVs tend to be safer on average and in certain conditions, they introduce unique risks that must be managed through tailored interventions. Addressing higher pedestrian accident risks through improved awareness systems and adjusting vehicle design can further enhance safety outcomes.
Combining the frequency and severity effects, this analysis shows that there is a significant reduction in overall costs associated with EV claims. This reduction is observed across the entire distribution of claims, with less of a reduction in smaller damage claims and more of a reduction in larger bodily injury claims. The interplay between frequency and severity is important for underwriting and reserving as EV adoption increases.
5.1. Implications for (Re)Insurance
The insights from this study have substantial implications for the insurance and reinsurance sectors. Understanding the accident frequency and severity differences between EVs and ICEVs enables insurers to refine underwriting, enhance pricing models and innovate new products to reflect evolving risks.
-
Underwriting and Pricing: The relative values for accident frequency and severity between EVs and ICEVs provides a starting point for risk differentiation. Additionally, insurers may need to refine traditional rating factors to account for evolving EV risks, such as the impact of software updates and battery health on vehicle performance. Pricing models could try to incorporate granular risk variables such as time of day, road type and speed limits to improve accuracy.
-
Usage-Based Insurance (UBI): Leveraging telematics data (e.g. acceleration patterns, braking behaviour) could refine risk assessment and incentivise safer EV driving. Factors such as urban versus rural driving should be integrated into risk evaluation.
-
Cost Considerations: EVs tend to have higher repair costs due to specialised components, including batteries and advanced safety systems. The availability of replacement parts and the need for manufacturer-certified repair facilities may further extend repair times and claims costs. Insurers should design policies that reflect these higher costs, possibly introducing tailored coverage for battery replacement and repair expenses. EVs on the other hand tend to have lower injury costs and these can be further investigated as the type of injuries may change.
-
Claims Management: Given the increased frequency of pedestrian and rear-end collisions, claims teams should prepare for shifts in claim patterns. Adjusting liability assessments and repair protocols for EV-specific damages, including battery-related incidents, will be crucial for efficient claims processing. Enhancing training for claims adjusters in handling EV-specific accidents can improve efficiency and customer satisfaction.
-
Reinsurance Structuring and Capital Modelling: The transition to an EV-dominated fleet will not only impact primary insurance but also reinsurance structures and capital modelling. The change in the risk profile with frequency reducing and severity increasing for smaller claims and reducing for larger claims could necessitate changes in risk retention strategies. The inflation profile will likely change as well with more demand for sensor and battery technologies. This may lead to an evolving risk landscape of EVs and adjustments in reinsurance structures.
5.2. Applications for Actuaries
The findings of this study on the factors influencing accident frequency and severity of vehicles by fuel type, particularly focusing on EVs, provide valuable insights for actuaries in the insurance industry. This section outlines how actuaries can leverage the research outcomes to enhance their risk assessment models, pricing strategies and overall understanding of the evolving automotive landscape.
5.2.1 Enhancing Risk Assessment Models
Actuaries play a critical role in assessing risk and determining insurance premiums. The insights from this study can significantly enhance the accuracy of risk assessment models in several ways:
Enhancing modelling by heads of damage: The study’s findings indicate that EVs generally exhibit lower accident frequency and severity compared to ICEVs. For instance, the data revealed that EVs had a 15–20% lower accident frequency rate than ICEVs over the study period. The claim sizes impact heavily depends on the heads of damage. Heads of damage associated with property damage may increase by 15–25% and conversely heads of damage associated with bodily injury may reduce by 20–40%. These ranges will change by size of claim and modelling the interaction between size of claim and head of damage becomes important. Modelling different bodily injury types in EVs compared to ICEVs could be another consideration to enhance accuracy in underwriting models. Actuaries can incorporate this information into their risk models by differentiating and carefully modelling out different heads of damage and claim size. They should incorporate variables that differentiate between vehicle fuel types. This shift in severity distribution means that actuaries need to investigate the need to reduce their reserves for larger claims while preparing for an increase in smaller claims, which could affect cash flow management. By assigning lower-risk factors to EVs based on empirical data, actuaries can refine their pricing models to reflect the actual risk associated with different vehicle types. This differentiation can lead to a more accurate assessment of premiums, potentially resulting in a reduction in premiums for EV owners compared to their ICEV counterparts.
Integrating Environmental Factors: As EV adoption and technology improves, the claim profile changes considerably. The study highlights the influence of environmental conditions (e.g. time of day, weather and road type) on accident outcomes. For example, accidents involving EVs were found to be 28% more likely to occur during poor visibility with fog and haze weather conditions compared to ICEVs. Actuaries can enhance their models by incorporating these variables, allowing for a more nuanced understanding of risk. For instance, they can adjust premiums based on the likelihood of accidents occurring under specific conditions, such as increased risk during heavy rain or snow, which could lead to a 5–10% adjustment in premiums based on historical data.
5.2.2 Informing Pricing Strategies
The findings of the study can directly inform pricing strategies for insurance products:
-
Dynamic Pricing Models using ADAS: With the increasing adoption of telematics and data analytics, actuaries can develop dynamic pricing models that adjust premiums based on real-time driving behaviour and vehicle performance. They can also make the case for the benefit for more technology and ADAS features within cars. It may be possible to cross reference features to make and model and to record any extra options or technology the car has. The study’s insights into the safety profile of EVs can be integrated into these models, allowing insurers to offer competitive rates for EV owners who demonstrate safe driving habits. For example, insurers could implement a 15–25% discount for drivers who consistently exhibit safe driving behaviours, as monitored through telematics.
-
Targeted Marketing Strategies: Understanding the lower-risk profile of EVs enables actuaries to support targeted marketing strategies for insurance products. Insurers can create tailored offerings for EV owners, highlighting the benefits of lower premiums and enhanced coverage options. This approach not only attracts EV drivers but also fosters customer loyalty by aligning products with their specific needs. For instance, marketing campaigns could emphasise a lower premium for EVs, appealing to environmentally conscious consumers.
-
Incentives for Safe Driving: The study underscores the role of advanced safety features in reducing accident severity. Actuaries can collaborate with insurers to design incentive programmes that reward safe driving behaviours among EV owners. For example, discounts on premiums could be offered to drivers who utilise ADAS features effectively, thereby promoting safer driving practices and reducing overall claims. A potential incentive could be a 10–20% premium reduction for drivers who engage in safe driving practices, as evidenced by telematics data.
5.2.3 Supporting Regulatory Compliance and Reporting
As the automotive landscape evolves, actuaries must stay informed about regulatory changes and reporting requirements. The findings of this study can assist actuaries in several ways:
-
Compliance with Safety Regulations: The insights into the safety performance of EVs can help actuaries ensure compliance with emerging regulations related to vehicle safety and insurance. By understanding the implications of these regulations, actuaries can provide guidance to insurers on how to adjust their policies and practices accordingly. For instance, if regulations mandate lower premiums for EVs due to their safety profile, actuaries can help insurers comply by adjusting their pricing models.
-
Reporting to Stakeholders: Actuaries are often required to report findings to stakeholders, including regulators, company management and investors. The data-driven insights from this study can be used to support actuarial reports, demonstrating a thorough understanding of the risks associated with different vehicle types. This transparency can enhance stakeholder confidence in the insurer’s risk management practices.
5.2.4 Anticipating Future Trends
The study provides a foundation for actuaries to anticipate future trends in the automotive and insurance industries:
-
Monitoring EV Adoption Rates: As EV adoption continues to rise, actuaries should monitor trends in vehicle registrations and accident data. By staying informed about the increasing market share of EVs, actuaries can proactively adjust their risk models and pricing strategies to reflect the changing landscape. For instance, if EVs account for 50% of new registrations by 2025, actuaries may need to reassess their risk models to account for the growing proportion of lower-risk vehicles in the market.
-
Evaluating the Impact of Autonomous Vehicles: The study highlights the importance of ongoing research into emerging technologies, such as autonomous vehicles. Actuaries should consider the potential impact of these technologies on accident frequency and severity. For example, if autonomous vehicles reduce accident rates by 40%, actuaries will need to adjust their models to reflect this significant change in risk dynamics.
-
Adapting to Technological Advancements: The integration of advanced safety features in EVs presents both opportunities and challenges for actuaries. By understanding how these technologies influence accident dynamics, actuaries can adapt their models to account for the changing risk landscape. This adaptability will be crucial as new technologies continue to emerge and reshape the insurance industry.
5.3. Wider Professional Relevance
This research extends beyond insurance professionals, offering insights for policymakers, vehicle manufacturers and urban planners.
-
Policymakers can leverage these findings to shape road safety initiatives, focusing on EV-specific risks such as pedestrian awareness and rear-end collision prevention.
-
Automotive Engineers can refine vehicle design, incorporating improved pedestrian detection and braking responsiveness to mitigate common EV accident scenarios.
-
Fleet Managers can optimise fleet composition by understanding EV risk patterns, ensuring safer deployment strategies and targeted driver training.
5.4. Summary and Future Research
This study presents a comprehensive analysis of accident frequency and severity for EVs compared to ICEVs using Norwegian data from 2020 to 2023. EVs generally demonstrate lower accident frequency, though severity is slightly higher in certain contexts. The presence of advanced safety technologies contributes to better performance in poor visibility and nighttime conditions, but targeted improvements are needed to address pedestrian safety and rear-end collisions.
The findings suggest that while EVs reduce some traditional risks, they introduce new ones that must be accounted for in risk modelling. Insurers must continue adapting pricing strategies, claims processes and coverage structures to ensure EV-specific risks are appropriately managed. Policymakers and automotive professionals must work together to create an ecosystem that supports both road safety and insurance sustainability.
Future research should explore additional influencing factors such as driver demographics, environmental conditions and technological advancements to further enhance understanding of EV risk profiles. Furthermore, as EV adoption increases, longitudinal studies tracking insurance claims trends over time will be essential to identify emerging risks and refine underwriting models.
By fostering cross-disciplinary collaboration, this research can contribute to safer roads, better risk management and innovative insurance solutions in an increasingly electrified transportation landscape. Continued monitoring of EV accident trends will allow insurers, regulators and manufacturers to remain agile in their approach, ensuring a balance between innovation and safety in the evolving mobility sector.
6. Disclaimer
The views expressed in this publication are those of invited contributors and not necessarily those of Guy Carpenter.
The data and analysis provided by Guy Carpenter herein or in connection herewith are provided “as is,” without warranty of any kind whether express or implied. The analysis is based upon data provided by the company or obtained from external sources, the accuracy of which has not been independently verified by Guy Carpenter. Neither Guy Carpenter, its affiliates nor their officers, directors, agents, modellers or subcontractors (collectively, “Providers”) guarantee or warrant the correctness, completeness, currentness, merchantability or fitness for a particular purpose of such data and analysis. The data and analysis is intended to be used solely for the purpose of the company internal evaluation and the company shall not disclose the analysis to any third party, except its reinsurers, auditors, rating agencies and regulators, without Guy Carpenter’s prior written consent. In the event that the company discloses the data and analysis or any portion thereof, to any permissible third party, the company shall adopt the data and analysis as its own. In no event will any Provider be liable for loss of profits or any other indirect, special, incidental and/or consequential damage of any kind howsoever incurred or designated, arising from any use of the data and analysis provided herein or in connection herewith.
There are many limitations on actuarial analyses, including uncertainty in the estimates and reliance on data. As with any actuarial analysis, the results presented herein are subject to significant variability. While these estimates represent our best professional judgement, it is probable that the actual results will differ from those projected. The degree of such variability could be substantial and could be in either direction from our estimates.
The views expressed in this publication are those of invited contributors and not necessarily those of the Institute and Faculty of Actuaries. The Institute and Faculty of Actuaries do not endorse any of the views stated, nor any claims or representations made in this publication and accept no responsibility or liability to any person for loss or damage suffered as a consequence of their placing reliance upon any view, claim or representation made in this publication. The information and expressions of opinion contained in this publication are not intended to be a comprehensive study, nor to provide actuarial advice or advice of any nature and should not be treated as a substitute for specific advice concerning individual situations. On no account may any part of this publication be reproduced without the written permission of the Institute and Faculty of Actuaries.
Acknowledgements
The authors would like to acknowledge a number of data providers that were used and are referenced below. We would like to especially recognise the Norwegian Public Roads Administration (NPRA) for providing and interacting on their data sources.
We would like to thank the motor and broking experts at Guy Carpenter including our colleagues in the Scandinavian teams for their review and challenge which helped shaped the analysis.
We would like to thank Carol Parfitt for her comprehensive review and challenge.
We would like to thank the technical review of the London GC Analytics team.
We would like to thank Oliver Wyman for their guidance and suggestions.
We would like to acknowledge the use of LenAI, an internal MMC large language model, to facilitate and aid research, review and editing.
Funding statement
This work received no specific grant from any funding agency, commercial or not-for-profit sectors.
Competing interests
Amit Parmar is an MD and Lead Actuary at Guy Carpenter, Reinsurance Broker. Conor Woods is a trainee actuary at Guy Carpenter. Guy Carpenter is a reinsurance intermediary and trades with insurance companies that write motor insurance business.
The authors declare that there are no competing interests related to this study. All research was conducted independently, and there are no financial, personal or professional relationships that could be perceived as influencing the outcomes of this work. The findings and conclusions presented in this paper are solely those of the authors and do not reflect any external influences.
Appendix
We now discuss the OLM models that have been fitted and the rationale behind selection of the baseline model.
A.1. Baseline OLM
The values in Tables A1 and 17 represent the linear predictors. For any of these factors, if f is true, then
 ${X_f} = 1$
and we multiply these factors by their respective coefficient to get the linear predictor
${X_f} = 1$
and we multiply these factors by their respective coefficient to get the linear predictor
 $\mu $
, by using:
$\mu $
, by using:
 $$\mu = {\beta _0} + {\beta _1}{X_1} + {\beta _2}{X_2} + \ldots + \;{\beta _n}{X_n}$$
Where
 ${\beta _0}\;$
is the intercept and baseline and in our case 0, and where
${\beta _0}\;$
is the intercept and baseline and in our case 0, and where
 ${\beta _i}$
is the coefficient of the variable i. In this case if i denoted medium speed and the crash was on a medium road and an EV then
${\beta _i}$
is the coefficient of the variable i. In this case if i denoted medium speed and the crash was on a medium road and an EV then
 ${X_i} = 1\;\& \;{\beta _i} = 1.59215$
.
${X_i} = 1\;\& \;{\beta _i} = 1.59215$
.
For ordered logit models there are also thresholds which separate the categories denoted by
 ${\tau _1},{\tau _2}, \ldots, {\tau _{k - 1}}$
for k categories.
${\tau _1},{\tau _2}, \ldots, {\tau _{k - 1}}$
for k categories.
Our model has the following thresholds on Table A1:
Table A1. OLM threshold values

The probability of being in the first category is given by:
 $P\left( {Y = 1} \right) = {1 \over {1 + {e^{ - (\mu - {\tau _{1)}}}}}}$
The probability of being in the second category is given by:
 $P\left( {Y = 2} \right) = {1 \over {1 + {e^{ - (\mu - {\tau _{2)}}}}}} - P\left( {Y = 1} \right)$
The probability of being in the third category is given by:
 $P\left( {Y = 3} \right) = {1 \over {1 + {e^{ - (\mu - {\tau _{3)}}}}}} - P\left( {Y = 2} \right) - P\left( {Y = 1} \right)$
And for our fourth probability,
 $P\left( {Y = 4} \right) = 1 - P\left( {Y = 3} \right) - P\left( {Y = 2} \right) - P\left( {Y = 1} \right)$
The average of the estimated units involved is
 $$Estimated\;Scenario\;units = \;\mathop \sum \limits_{k = 1}^4 k \times P\left( {Y = k} \right)$$
So clearly the linear predictors for
 $\mu $
have an effect on the estimated units, which is statistically significant. There impacts however are not linear and vary depending on the interaction of the other parameters.
$\mu $
have an effect on the estimated units, which is statistically significant. There impacts however are not linear and vary depending on the interaction of the other parameters.
In testing the model on the 15% test set we get a confusion matrix presented below in Table A2.
Table A2. Baseline OLM confusion matrix
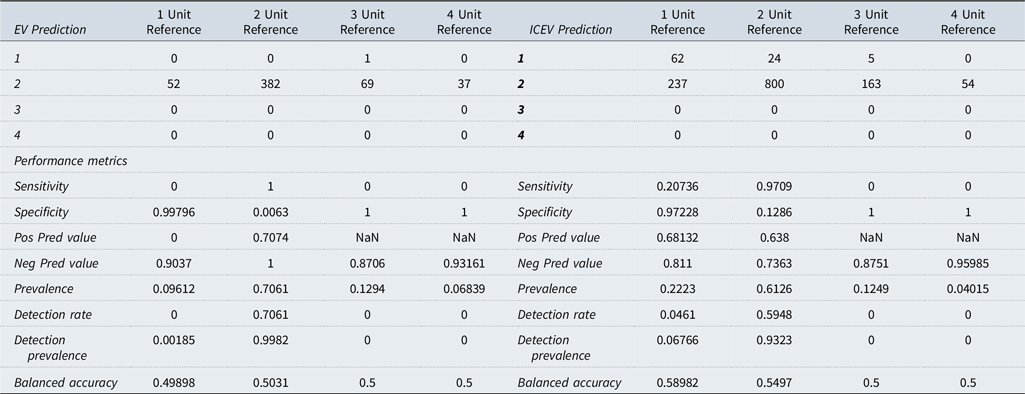
There is an abundance of two-unit accidents with the EV model predicting 99.97% of accidents as 2-unit collisions and ICEV model predicting 93.2% as 2-unit collisions.
To avoid this bias towards 2-unit accidents we fit a weighted model to give weight to the underrepresented number of units, namely, 1, 3 and 4.
A.2. Weighted OLM
The aim of this model is to place less emphasis on the 2-unit collisions and more on the less represented collisions (1, 3 and 4)
We add another column with the respective weight given to each accident. We give higher-unit collisions greater weight in order to give them more representation. This model produced the following confusion matrix and prediction metrics in Table A3 and OLM output in Table A4.
Table A3. Weighted OLM confusion matrix

Table A4. Regularised OLM output

This model places reduced overdependence on 2-unit collisions but has overcompensated and overfits on the less represented classes. As seen in the EV model it predicts 29.4% as 4-unit accidents while it is only 6.84%, Similarly for the ICEV model it predicts 25.2% while it is only 40.0%.
In order to not let the dominant class overshadow our predictions and also to not overfit the model on the less represented classes we consider a third model type.
A.3. Regularised OLM approximation using multinomial regression
A third model was introduced, a multinomial regression model utilising elastic net functions (Zou & Hastie, Reference Zou and Hastie2003). Elastic net functions allow more flexibility in predicting the number of units and gives more weight to the outliers and penalises results too far from the mean. This approach helps to balance the emphasis on the most common outcomes, two-unit collisions, while also ensuring that less frequent outcomes (like 1, 3 and 4-unit collisions) are adequately represented in the model.
This model was created and run using the “glmnet()” function in Rstudio (Hastie et al., Reference Hastie, Qian and Tay2025). This function approximates the ordered logit by transforming the ordinal outcome of number units in an accident into a series of binary outcomes using a cumulative logit approach.
This approach involves converting our data into a matrix and our ordered outcome of units to multiple binary outcomes. We then fit a regularised multinomial logistic regression model and set our alpha to 0.5, which utilises elastic net of lasso effect and ridge regression with the same weights as the previous model.
This places higher emphasis on the underrepresented data classes, but also places a penalty on misclassification and since 2-unit collisions is the most common it tries to predict them accurately too.
This approach uses cv.glmnet() which uses cross validation to obtain the best regularisation strength. This method is a strong approximation of an ordered logit model with ridge regularisation.
It predicts our EV crashes with middling accuracy at 53.6% in place of 70.61% and 6.84% for baseline and weighted, respectively. For ICEVS it has accuracy of 56.58% in place of 64.09% and 40.97% for baseline and weighted respectively. Apart from just accuracy it has better performance on the underrepresented classes (1, 3 and 4).
Clearly the baseline OLM has the highest accuracy, but this is once again due to the dominance of 2-unit collisions.


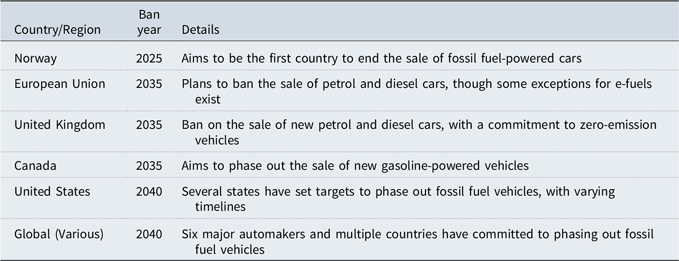


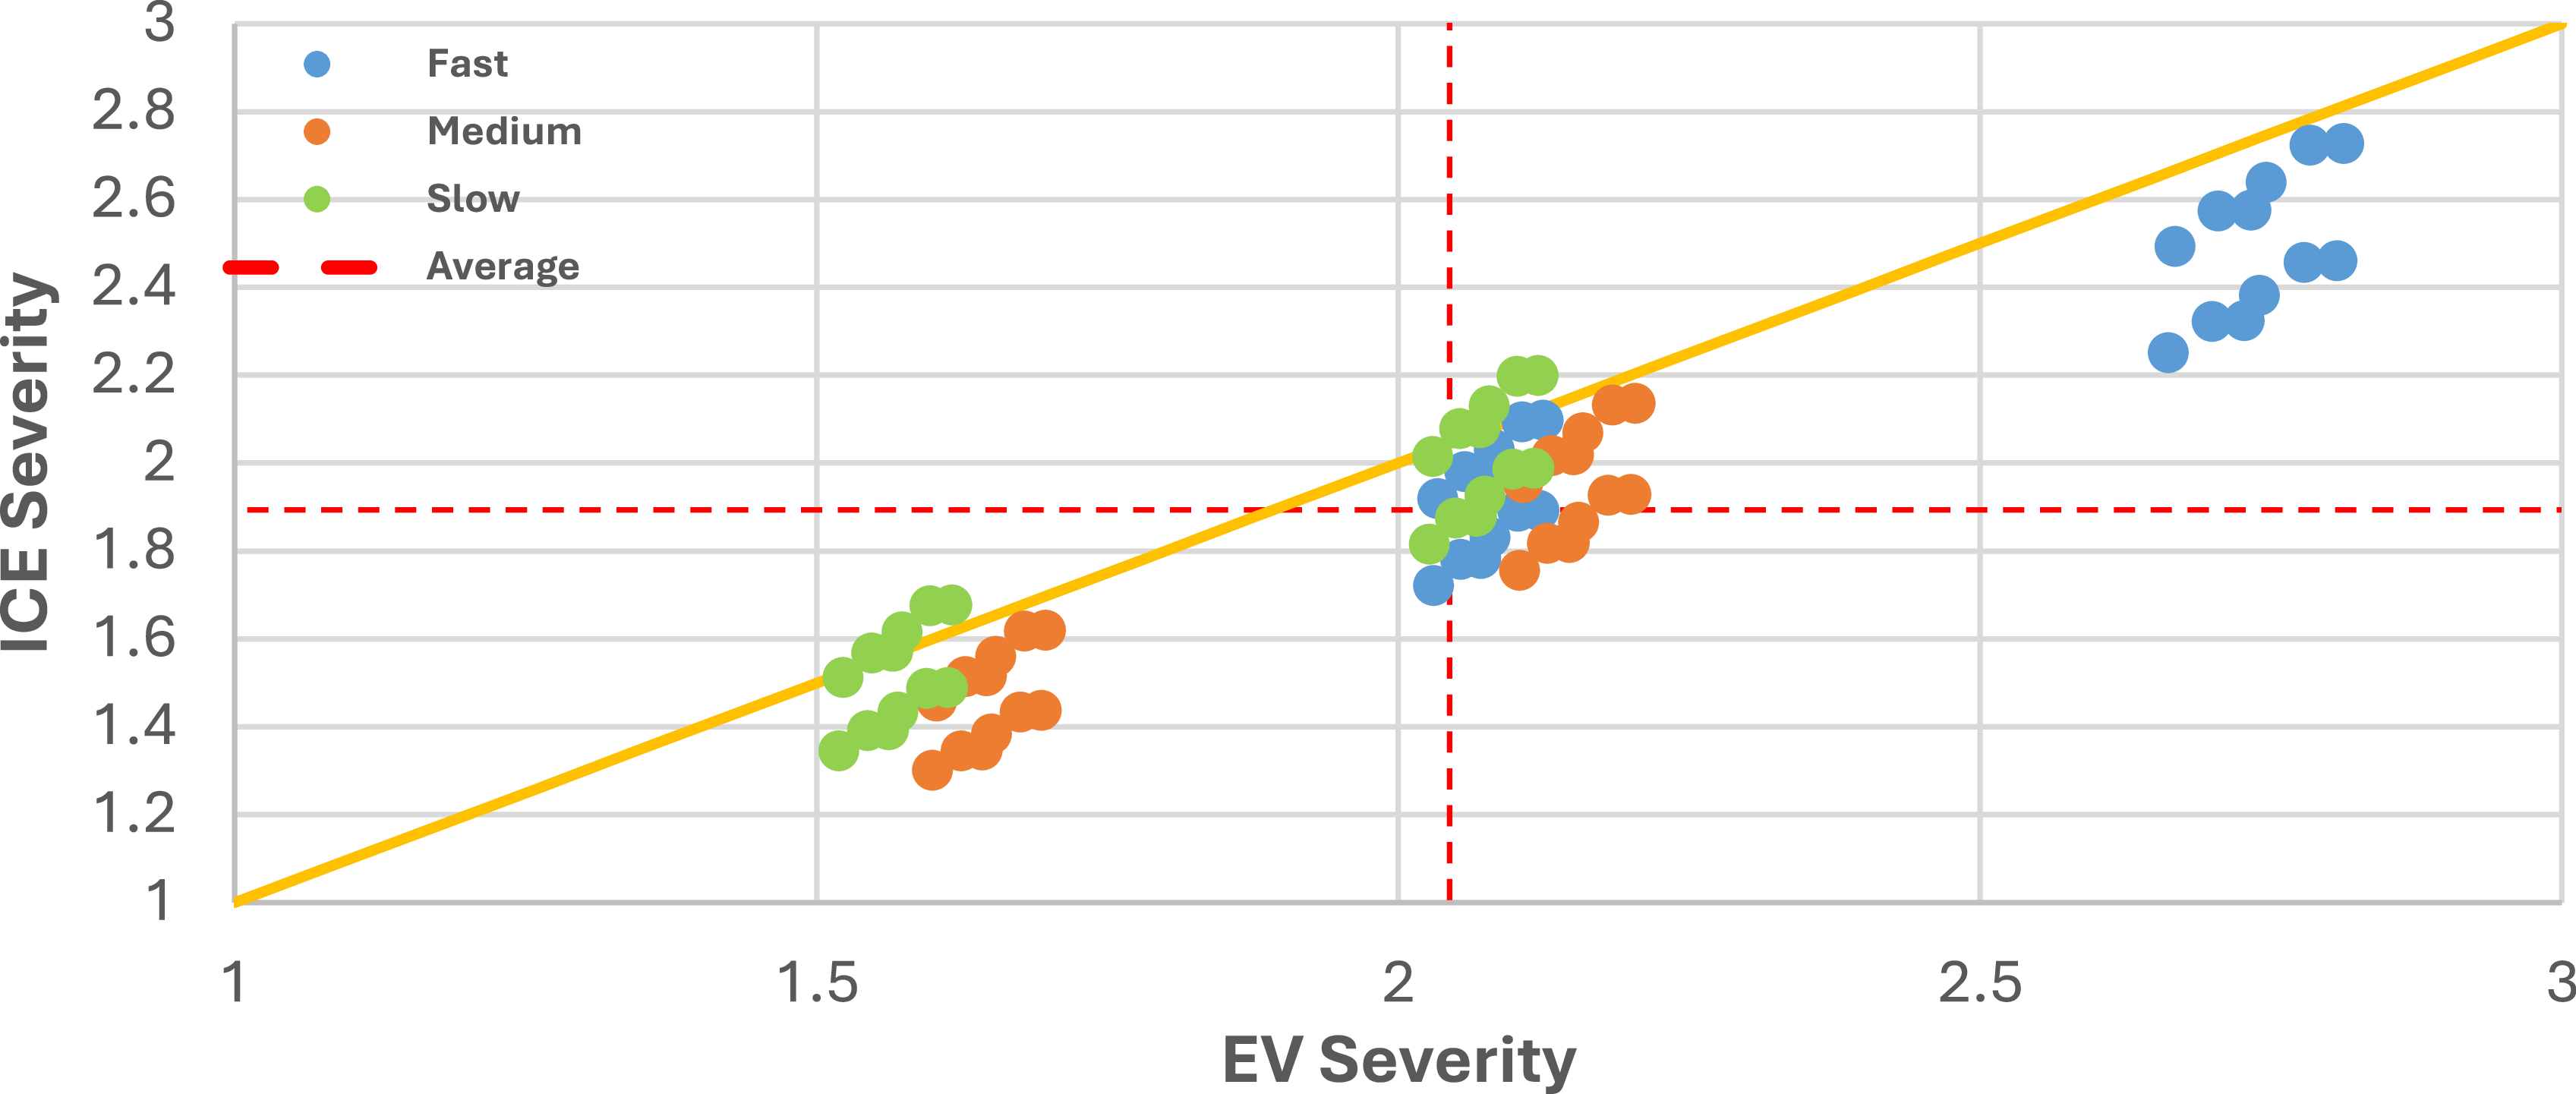


 Open access