


Introduction
Bones are a vital part of the body as they provide structure, support, and protection, enable mobility, store minerals, and produce red and white blood cells. They have a complex structure and are “alive,” being constantly refreshed and remodeled in response to external influences over the lifetime of the individual (e.g. Robling et al. Reference Robling, Castillo and Turner2006; Kini and Nandeesh Reference Kini, Nandeesh, Fogelman and van den Wall2012; Fahy et al. Reference Fahy, Deter, Pitfield, Miszkiewicz and Mahoney2017; Allen and Burr Reference Allen and Burr2019). There is an increasing emphasis on understanding the cellular metabolism and cross talk between bone cells (e.g. Bolamperti et al. Reference Bolamperti, Villa and Rubinacci2022; Choi et al. Reference Choi, Umemoto, Mizuno and Park-Min2024; Delaisse et al. Reference Delaisse, Andersen, Kristensen, Jensen, Andreasen and Søe2020; Kenkre and Bassett Reference Kenkre and Bassett2018; Zhang et al. Reference Zhang, Guan, Wang, Feng, Zou and Gao2024). Choi et al. (Reference Choi, Umemoto, Mizuno and Park-Min2024), Fahy et al. (Reference Fahy, Deter, Pitfield, Miszkiewicz and Mahoney2017), and Kini and Nandeesh (Reference Kini, Nandeesh, Fogelman and van den Wall2012) present detailed discussions of bone formation, remodeling, and metabolism and some information relevant for this paper is summarized below.
Dense cortical bone is formed on the outside by the periosteum, a fibrous connective tissue shaft, and by the endosteum, a membranous structure on the inside of the bone. There is rapid formation of bone mass in fetuses and infants, slowing somewhat until age 11 (female) or 12 (male). Adolescence is accompanied by a growth spurt until about age 18, followed by a minor increase in bone mass until age 25–30. Bone is a living tissue, responsive to external signals by a lifelong process of remodeling in which osteoclasts (bone “resorption-cells”) continuously remove discrete packages from the old bone, and osteoblasts (bone “construction-cells”) replace them by new packages (Choi et al. Reference Choi, Umemoto, Mizuno and Park-Min2024; Miszkiewicz and Mahoney Reference Miszkiewicz and Mahoney2016; Robling et al. Reference Robling, Niziolek, Baldridge, Condon, Allen, Alam, Mantila, Gluhak-Heinrich, Bellido, Harris and Turner2008). The newly deposited packages are in part made from resorbed material which slows their carbon turn-over by exchange with the food chain. This process controls modeling of bone and repair of (micro) damages (Fernández-Tresguerres-Hernández-Gil et al. Reference Fernández-Tresguerres-Hernández-Gil, Alobera-Gracia, del-Canto-Pingarrón and Blanco-Jerez2006; Fraher Reference Fraher1993). The average lifespan of a remodeled unit in humans is 2-8 months, mostly taken up by bone formation. The local balance between resorption and formation determines whether there is locally a net deposition or a removal of bone tissue. This allows radial growth of long-bones such as the femur where the periosteum deposits bone on the outside and the endosteum resorbs on the inside, creating the bone marrow cavity. The bone remodeling balance in humans is positive up to the third decade, when maximum bone mass is normally reached (Boksey and Coleman Reference Boskey and Coleman2010; O’Flaherty Reference O’Flaherty2000). Up until the age of ∼50, there are only small variations and after that resorption becomes predominant (Fahy et al. Reference Fahy, Deter, Pitfield, Miszkiewicz and Mahoney2017; Fraher Reference Fraher1993).
The isotopic composition of new bone tissue reflects the conditions under which the tissue formed. The rapidly changing 14C concentrations in atmospheric CO2, caused by atmospheric nuclear weapons tests done during the 1950s and 1960s, entered the food chain via photosynthesis and provide an isotopic tracer that allows us to study the natural incorporation and replacement of carbon in bones and in other tissues such as cartilage, tendons, muscles, and in lipids over the last ca. 70 years. Remodeling rates may vary between bones of a single individual because of differences in surface to volume ratio and (local) mechanical stress, and between individuals due to differences in age, sex, health, and living conditions (Fahy et al. Reference Fahy, Deter, Pitfield, Miszkiewicz and Mahoney2017; Parfitt Reference Parfitt2002). For cortical bone, which makes up ca. 75% of the bone mass, a turnover rate of 2–4% per year in the age range 20 to 80 years has been estimated by Hedges et al. (Reference Hedges, Clement, Thomas and O’Connell2007) based on bomb radiocarbon tracer measurements. On the inside of the cortical bone, the trabecular bone forms a honeycomb-like network of trabecular plates and rods. Although this spongeous bone makes up only 25% of the bone mass, its surface represents 60% of the total bone surface and its metabolic rate is about four times higher than that of cortical bone (Schini et al. Reference Schini, Vilaca, Gossiel, Salam and Eastell2023). Fahy et al. (Reference Fahy, Deter, Pitfield, Miszkiewicz and Mahoney2017) estimated, from osteon population density, that cortical bones remodel at a rate of approximately 7.7% per year and trabecular ilium bones remodel at approximately 17.7% per year. In-vivo 13C tracer studies by Smeets et al. (Reference Smeets, Horstman, Vles, Emans, Goessens, Gijsen, van Kranenburg and van Loon2019) and Hendriks et al. (Reference Hendriks, Weijzen, Goessens, Zorenc, Gijsen, Kramer, van den Bergh, Poeze, Blokhuis and van Loon2023, see their Figure 5), reveal synthesis of various musculoskeletal proteins, at quite variable rates, measurable in hours. Detailed studies of bones obtained in the course of joint replacement surgeries can provide life histories to match their isotopic information, and, thereby, further our understanding of bone remodeling and of how isotopic signals are incorporated into various tissues under natural conditions. Moreover, such bones offer the interesting possibility to compare stressed with adjacent non-stressed tissues.
Since bones are quite durable, they are often all that remains after death, and thus of great importance in forensic, archaeological, and palaeo-environmental studies because of the information they contain regarding the living conditions of the human or the animal they once supported (Bocherens et al. Reference Bocherens, Billiou, Mariotti, Patou-Mathis, Otte, Bonjean and Toussaint1999; Fahy et al. Reference Fahy, Deter, Pitfield, Miszkiewicz and Mahoney2017; Pollard et al. Reference Pollard, Ditchfield, Piva, Wallis, Falys and Ford2012; Reynard and Hedges Reference Reynard and Hedges2008; Ubelaker Reference Ubelaker2014). Knowledge of the turnover rates in different bones will provide access to isotopic information from different periods of an individual’s life (e.g. Lamb et al. Reference Lamb, Evans, Buckley and Appleby2014). Combined with an understanding of how isotopic signals are incorporated, this will provide a more detailed picture of the individual in forensic studies, and aid in the reconstruction of human lifestyle and environmental conditions from archaeological bones.
We report here the 14C concentrations of various fractions of bone and tissue obtained in an osteoarthritic hip joint replacement and discuss their implications for bone and tissue turnover rates.
Samples and preparation
Samples
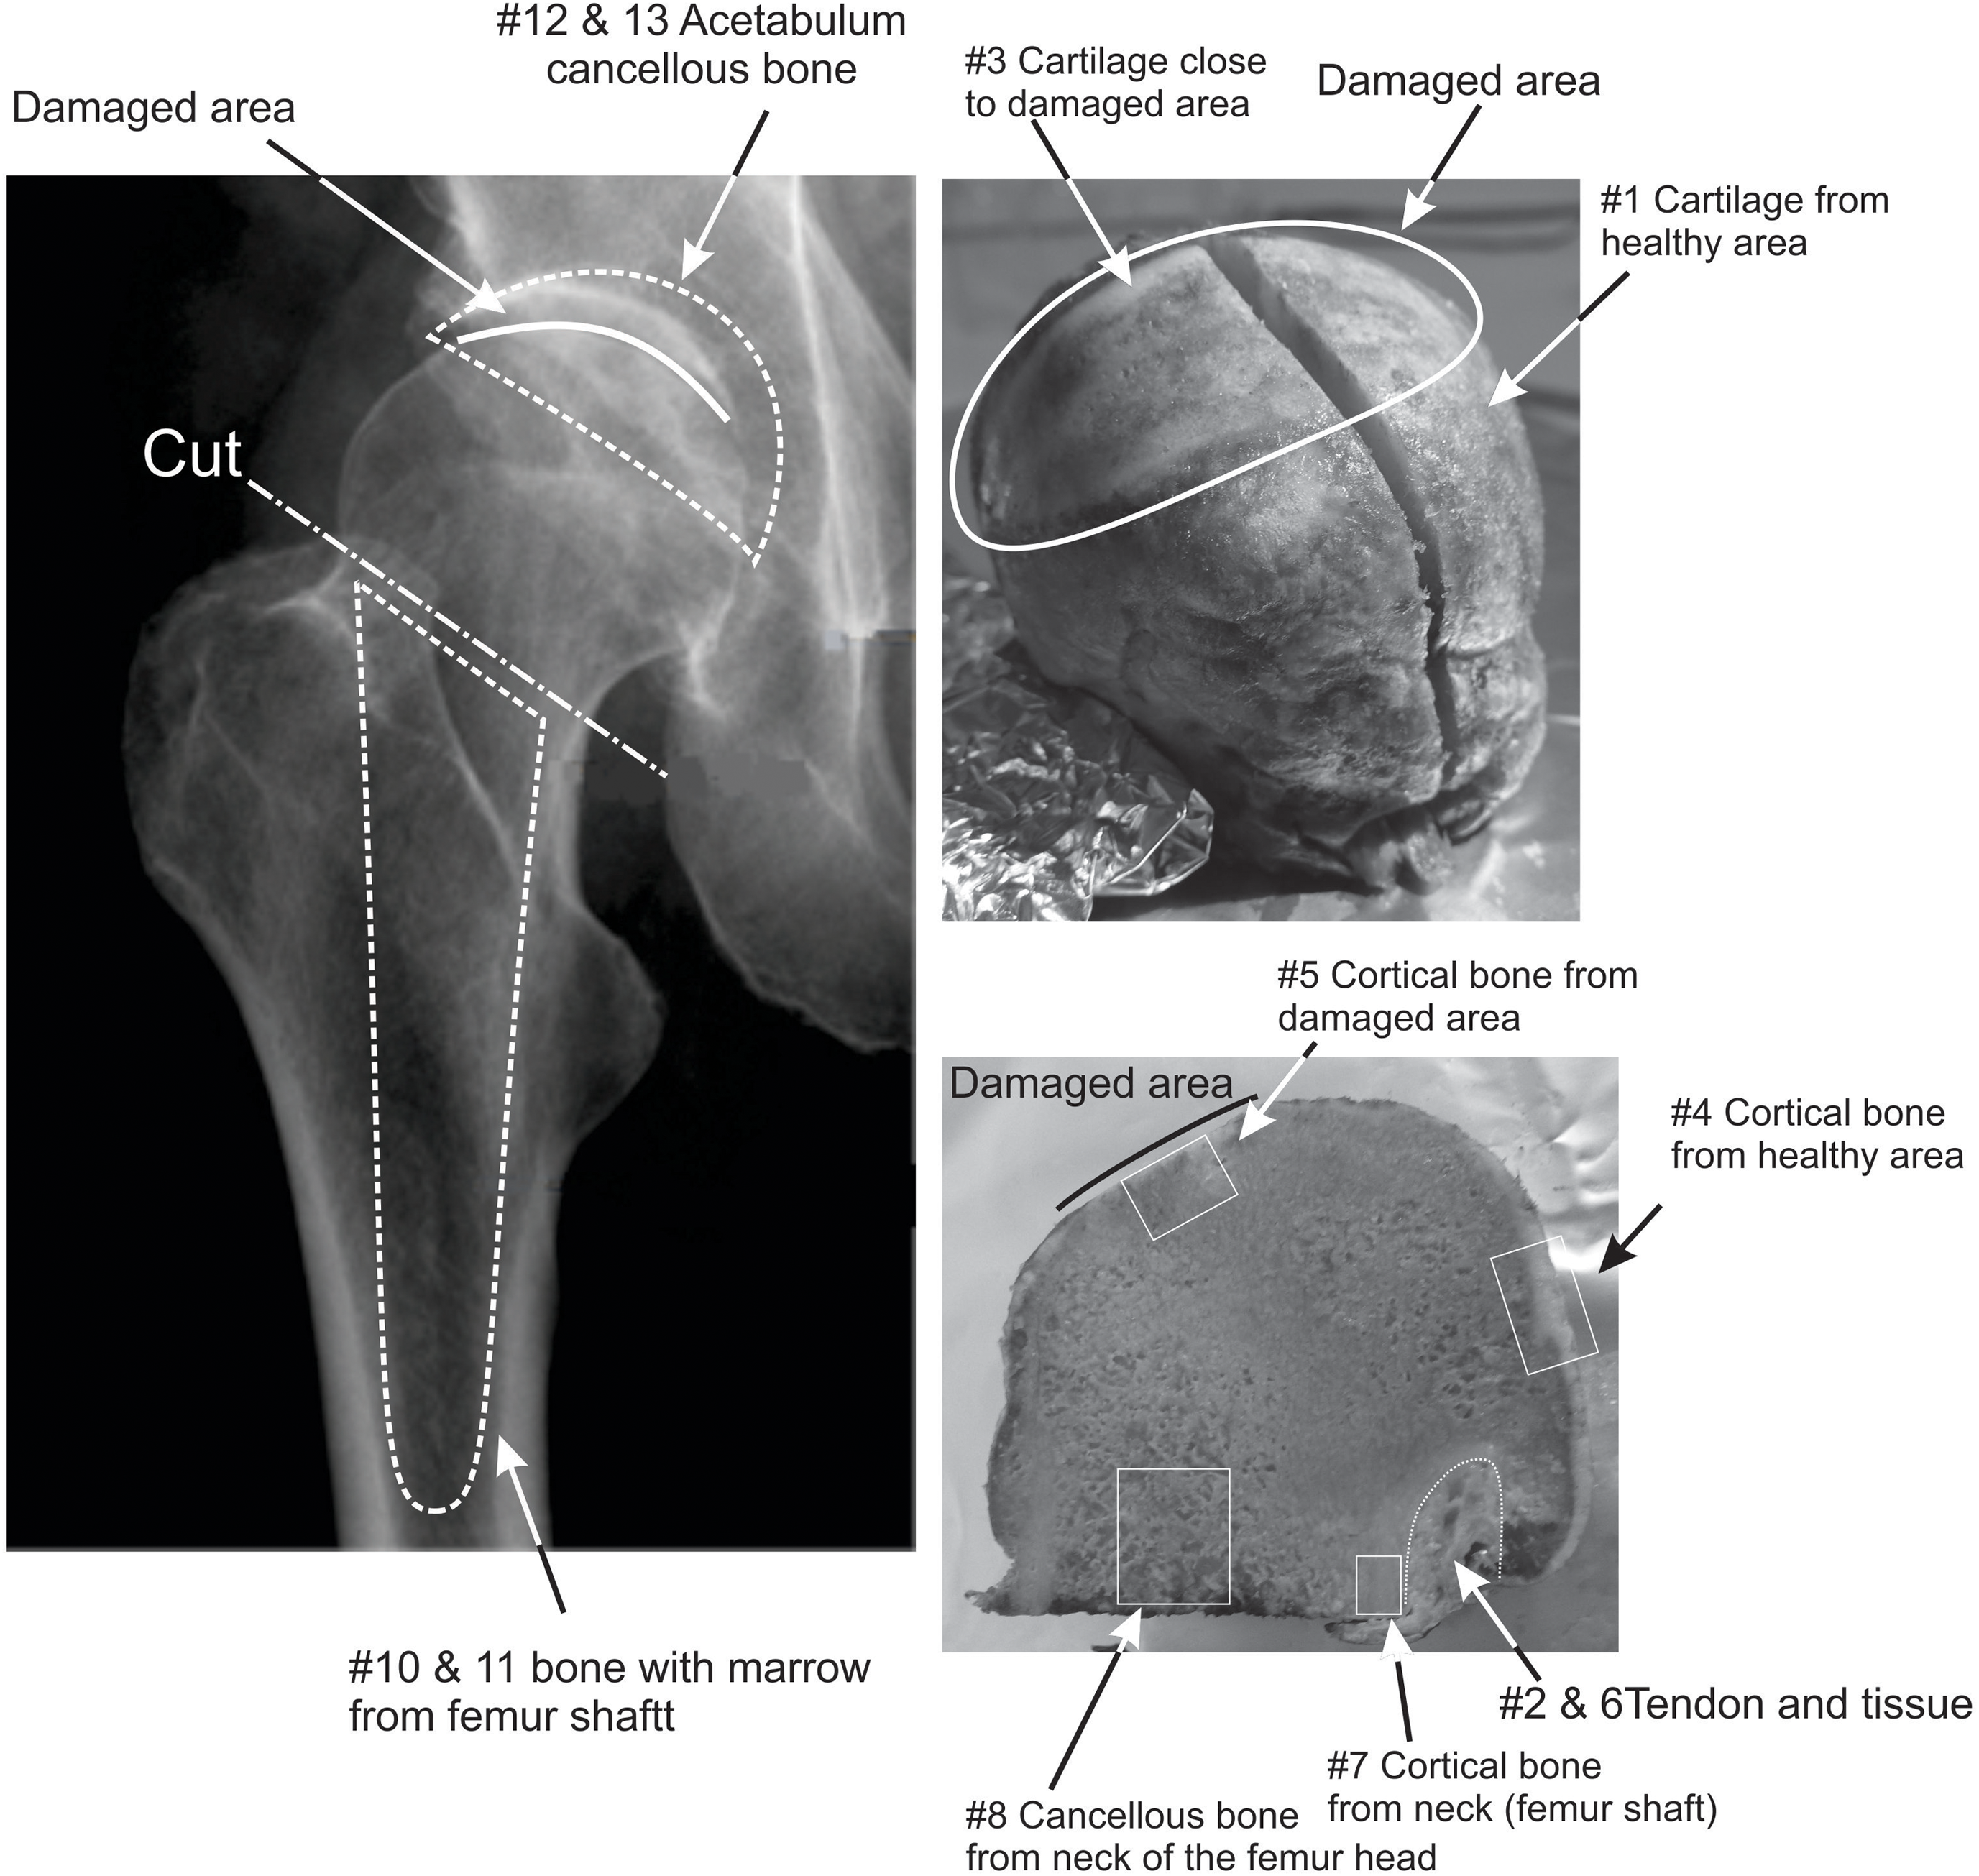
The samples were obtained in April 2017 from a hip replacement surgery performed on a healthy Caucasian male born in 1944. Three distinct samples were obtained (Figure 1): the head of the femur, material removed from the inside of the femur shaft where the artificial hip joint would be inserted, and material from the acetabulum (hipbone) where the counter part of the hip joint was fixed. The samples were stored at –18°C until further subsampling in April 2018. The femur head sample consists of the ball itself and a short length (∼5 mm) of femur neck, with tissue and tendon attached to the neck. The femur head is covered by cartilage and shows clear signs of degradation where cartilage was eroded along a band of ∼5 × 2 cm and the bone surface looks worn and polished (Figure 1). The inside of the femur head is made of uniform spongeous, cancellous bone filled with a yellowish lipid. The material from the femur shaft and the acetabulum consists of a mixture of cancellous and cortical bone fragments, marrow, blood, and plasma. In addition to the samples recovered from surgery, beard, hair, and nail samples were collected shortly before the operation to provide a recent base line. The beard sample represents about 2 weeks of growth. The hair sample was about 3 cm in length and was split into two halves: a root half which represents the most recent growth and a tip half which would be 3–6 weeks old. We estimate that the nail sample took about 6 months to reach the end of the nail where it could be sampled.

Figure 1. Schematic of the samples. The three primary samples were separated into subsamples of bone, cartilage, and tissue. Bone and cartilage were taken from the damaged, polished part of the femur head and from the adjacent healthy area. The bone spur (#9) is not shown on these photographs.
Sampling and preparation
The femur head was sampled in different areas, as shown in Figure 1, to compare healthy cortical bone of ball and neck, away from the polished bone area, with “stressed” polished bone and with cancellous bone. Samples of ca. 1 g of bone were taken with a cutting disc. A scalpel was used to scrape “stressed” cartilage edging the polished area and cartilage distant from it. In addition, tendon, and muscle tissue were collected with a scalpel. A calcified area of cartilage on the ball near the damaged area (a “spur”) was sampled separately. The mixed material from the femur shaft and the acetabulum was split manually into “mostly cortical bone fragments” and “rest.”
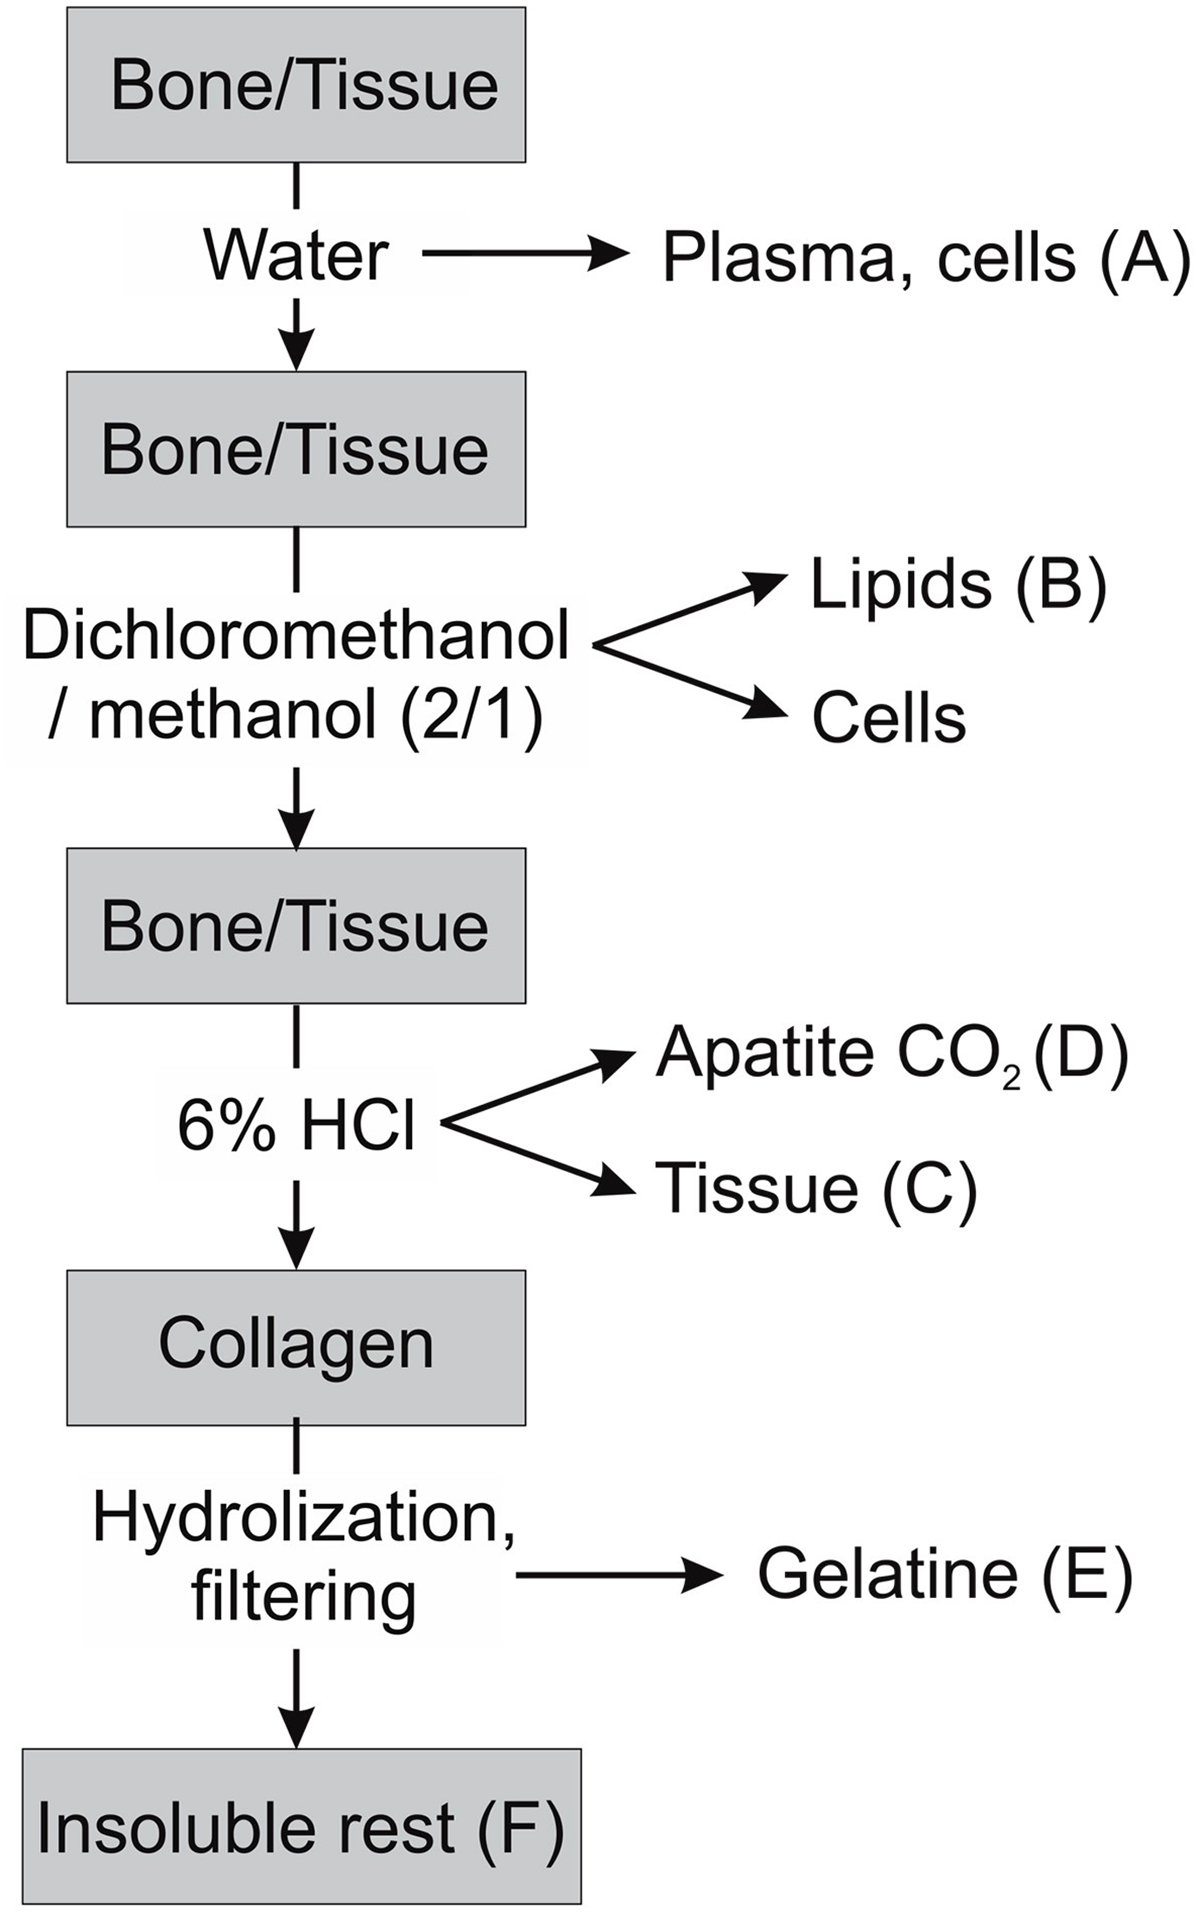
To obtain defined fractions for isotopic analysis, the physically separated samples were cleaned and chemically fractionated. We aimed to obtain many different physical and chemical fractions, in order to look for differences in turnover time that may indicate different tissue and bone regeneration rates. We subjected bone, cartilage, tendon, muscle tissue, and bone marrow to a water extraction followed by a lipid extraction with a dichloromethane (DCM)-methanol mixture (2:1) at room temperature to obtain a water soluble and a lipid fraction following the schematic shown in Figure 2. The samples were initially placed in demineralized water for two days to extract and collect a water-soluble fraction (A). They were then placed in reagent tubes with ∼6 mL of DCM-methanol (2:1) overnight to extract lipids (fraction B). After removal of the lipid extracts, the samples were subjected to Soxhlet extraction with a solvent sequence of DCM, acetone, and methanol to ensure complete removal of fats and lipids (6 × 15 min boiling DCM, 3 × 15 min boiling acetone, 6 × 15 min boiling methanol). After this, the bone samples looked generally white and clean. Some hard bone pieces were selected from the mixed material from femur shaft and acetabulum each as “bone” sample. These were most likely fragments of cortical bone. Tissue fibers remaining on the bone surface were scraped off. The bone and cartilage samples were then treated at room temperature with 15% H2O2 solution for two hours to oxidize and remove remaining organic coatings and washed with demineralized water. Tissue and cartilage samples were next treated with 1% HCl to remove carbonates, washed, and dried (fraction C). The bone samples were demineralized with 6%HCl in a closed evacuated ampoule at room temperature and the evolved CO2 was collected as sample of the bone apatite carbonate (fraction D). After demineralization, the collagen was gelatinized at pH = 3 (Longin Reference Longin1971) and the gelatin was filtered through a prebaked quartz filter and freeze-dried (fraction E). The quartz filters were retained as samples of the non-hydrolysable fraction of the collagen (fraction F). No NaOH treatment, generally used in bone dating to remove contaminants, was given as these bone samples were fresh. The control samples of hair and beard were cleaned with the Soxhlet extraction described above and an HCl rinse; a nail was given an acetone rinse followed by a 1% HCl rinse.

Figure 2. Schematic of the extraction procedure.
The gelatin and tissue samples were combusted using an Elementar micro cube elemental analyzer and graphitized in the presence of hydrogen over an iron catalyst as described by Seiler et al. (Reference Seiler, Grootes, Haarsaker, Lélu, Rzadeczka-Juga, Stene, Svarva, Thun, Værnes and Nadeau2019). The lipid fractions were combusted in closed quartz tubes at 900ºC together with copper oxide and silver. The CO2 obtained from the hydrolyzation of the bio-apatite and the closed combustion of the lipids was graphitized using Zn over an iron catalyst (Seiler et al. Reference Seiler, Grootes, Haarsaker, Lélu, Rzadeczka-Juga, Stene, Svarva, Thun, Værnes and Nadeau2019). The graphite samples were measured on the AMS system of the National Laboratory for Age Determination in Trondheim, Norway (Nadeau et al. Reference Nadeau, Vaernes, Svarva, Larsen, Gulliksen, Klein and Mous2015) according to the protocol described in Seiler et al. (Reference Seiler, Grootes, Haarsaker, Lélu, Rzadeczka-Juga, Stene, Svarva, Thun, Værnes and Nadeau2019). The Δ14C were calculated according to Stuiver and Polach (Reference Stuiver and Polach1977). Stable isotope ratios were measured using a Thermo Delta V Advantage equipped with a Flash 2000 elemental analyzer.
Results
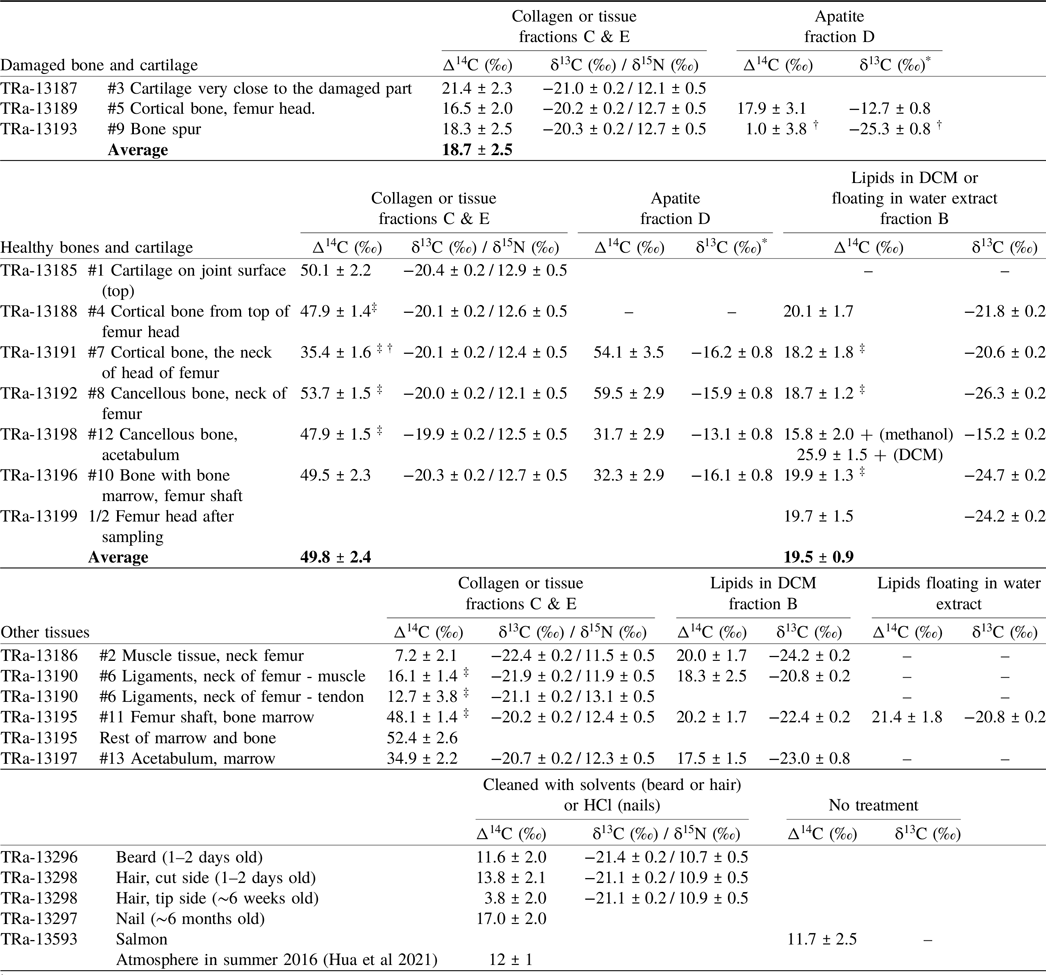
The results in Table 1 and Figure 3 show clear differences in 14C concentration between healthy and damaged bone and between the different tissues and fractions. Nine duplicate measurements of cleaned fractions, spread over 6 months, show a scatter of differences in 14C concentration in agreement with the reported measurement uncertainties in the range of 2–3‰, except for one case where a sample target performed poorly and gave a low ion current. This means that differences above 6‰ may be considered statistically significant.
Table 1. 14C results of the different samples and fractions. The sample #s refer to the samples indicated in Figure 1

† Very small sample
* δ13C results from the AMS system
‡ Average of two measurments
+ Was not included in the average

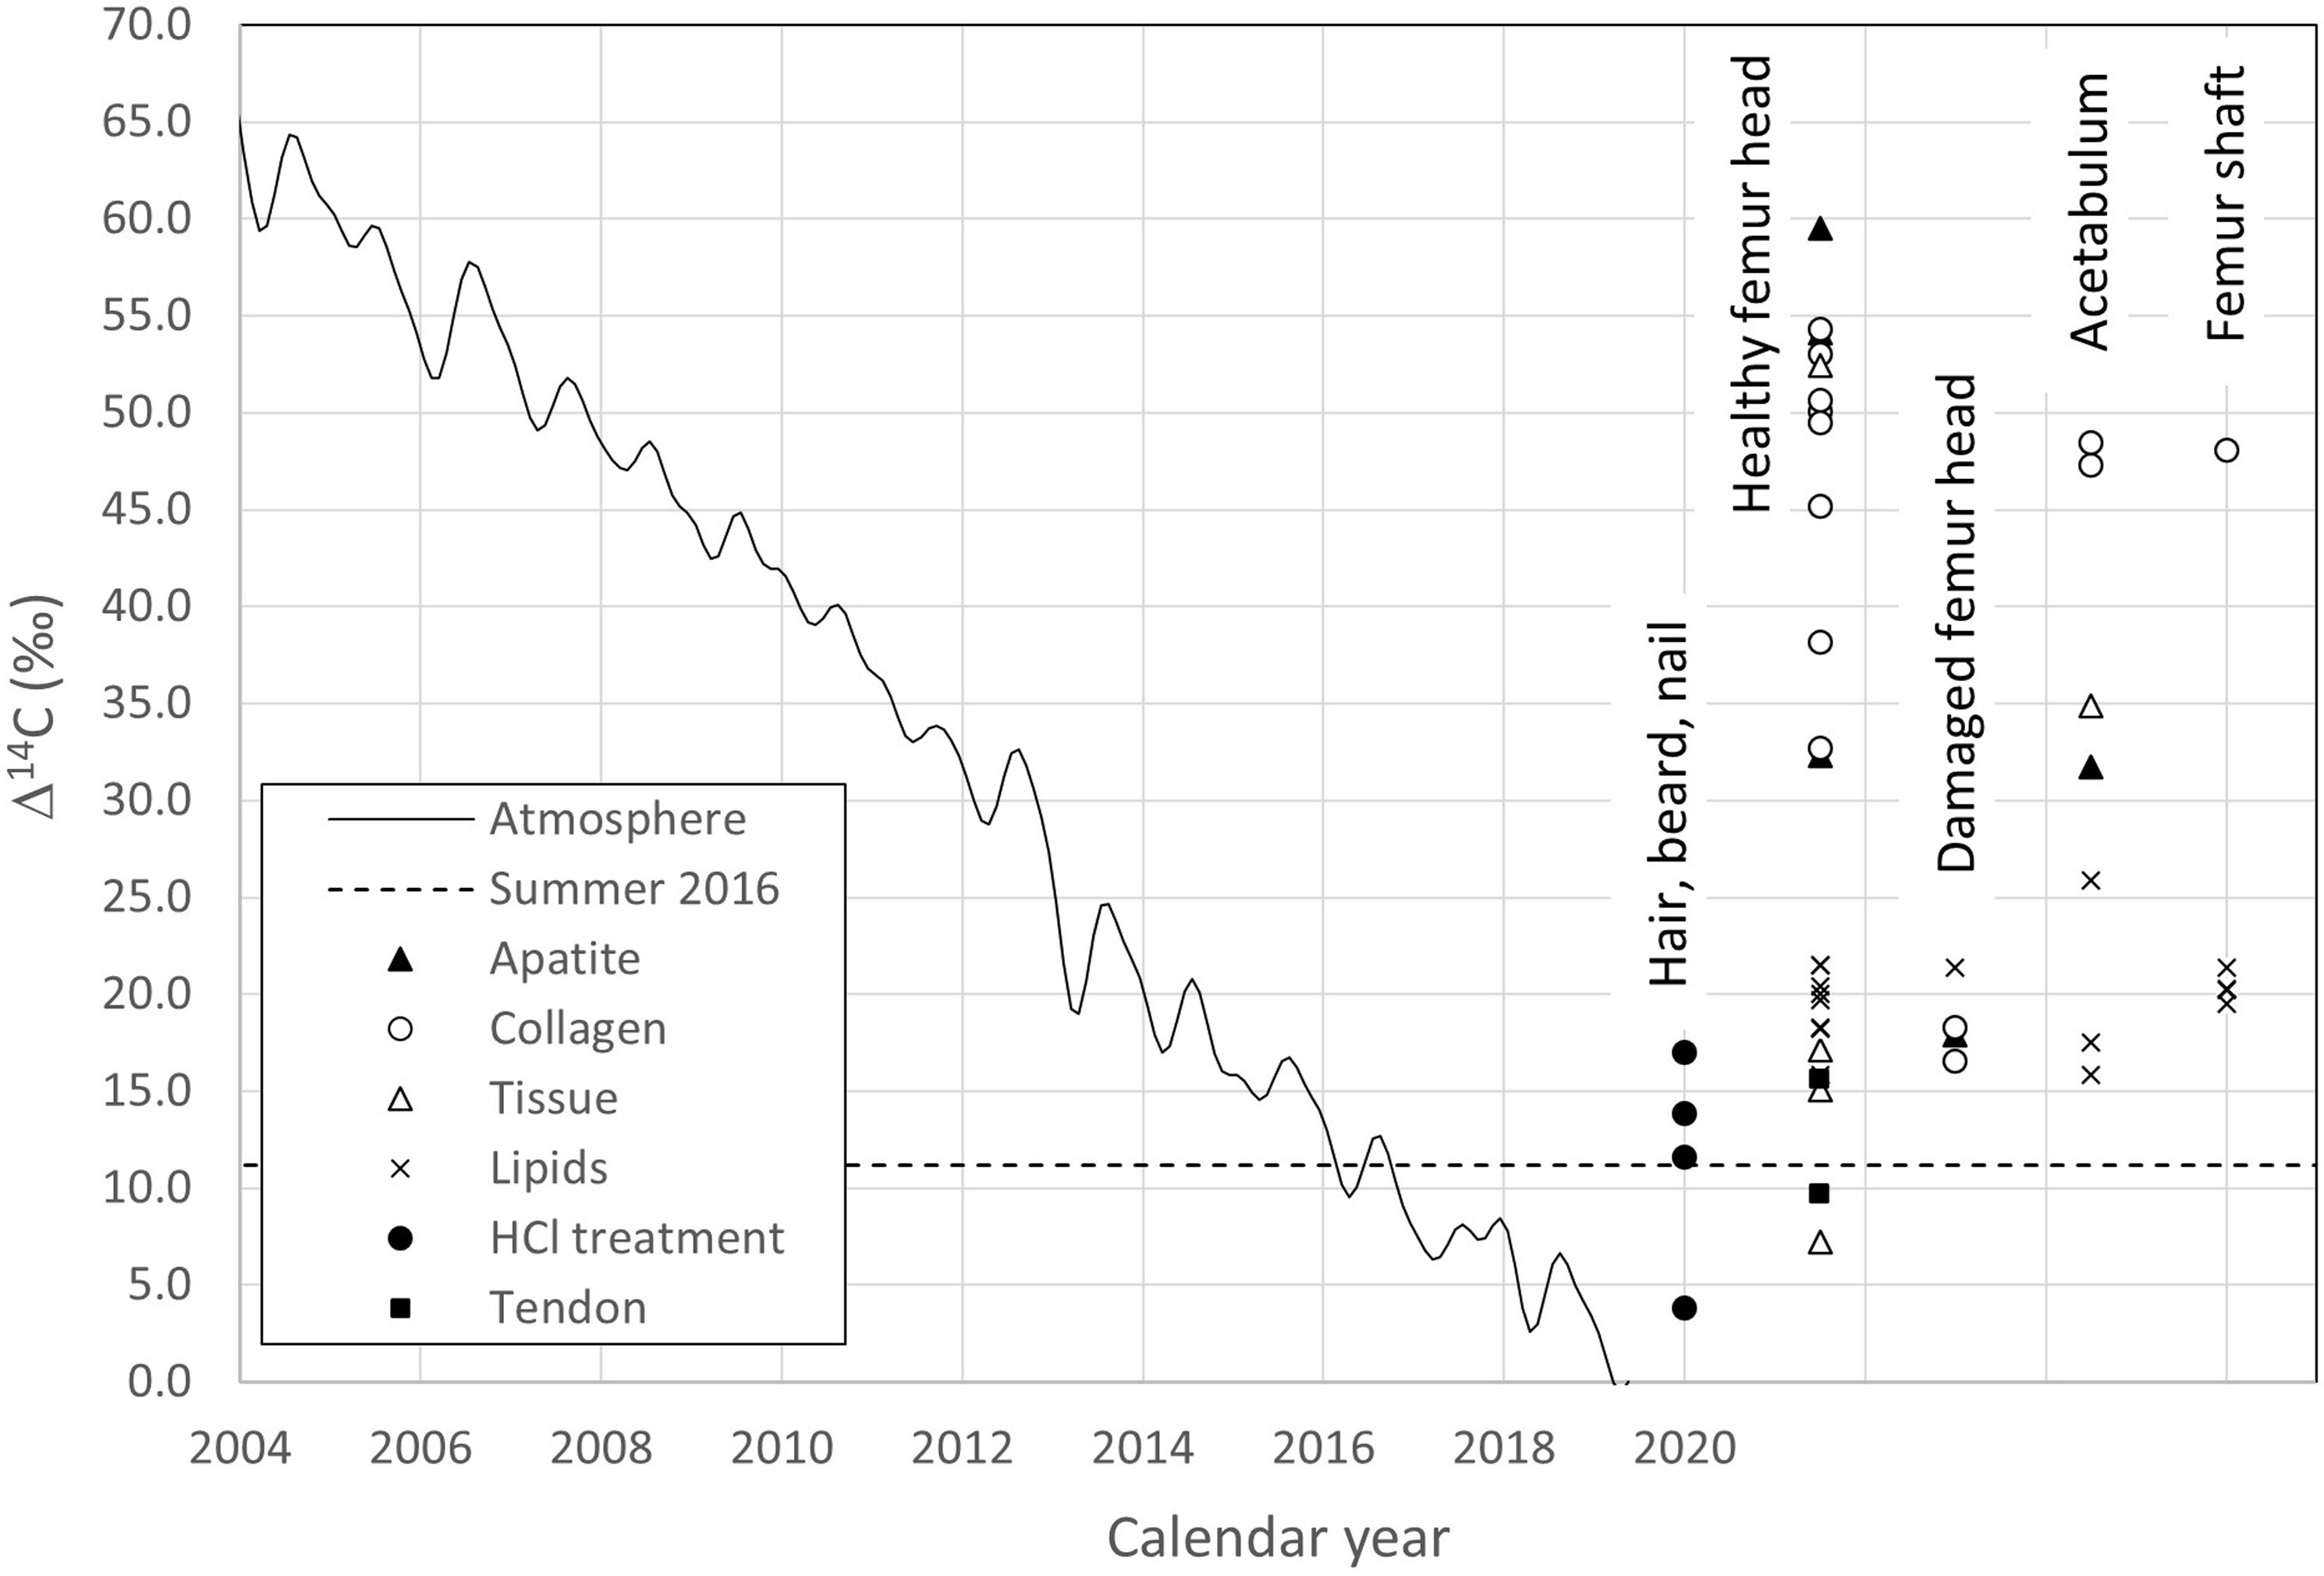
Figure 3. 14C results of the different fractions according to their location. Healthy femur head: samples #1, 2, 4, 6, 7, 8. Damaged femur head: samples # 3 & 5. Acetabulum: samples # 12 & 13, Femur shaft: samples # 10 & 11. The results can be compared to the 14C content of the atmosphere through time (continuous curve).
Table 1 shows three distinct groups. One group has Δ14C values scattering around 50‰ and includes collagen of the healthy cortical and cancellous bone and healthy cartilage as well as apatite from the neck of the femur. A second has Δ14C values around 33‰ for cortical bone collagen from the neck of the femur and cancellous bone apatite. A third has Δ14C values around 19‰ for the collagen and apatite fractions of the damaged bone, the bone spur, stressed cartilage, as well as the lipids. These latter values are only slightly higher than those observed in short lived materials (hair, nails) and the 2016 atmosphere. The higher 14C content of the first group corresponds to that of the atmosphere during the summer months of the years 2005–2009, the second to the years 2011 and 2012, while Δ14C of the damaged area agrees with the summer atmosphere of 2013 and 2014. Tissue, tendon, hair, and nail samples show even lower Δ14C values in the range of 12–20‰, similar to the summer atmosphere of 2015 and 2016. Δ14C values for the tissue obtained from the material removed from the femur shaft are similar to those of the femur bone collagen, except the neck. The acetabulum “tissue” shows a Δ14C value close to that of its apatite and the femur neck collagen.
The δ13C and δ15N values, measured separately on an EA/Delta V Advantage isotope ratio mass spectrometer system, show as expected, a clear difference in δ13C between apatite and organic samples but are otherwise unremarkable.
The water-soluble fractions were measured but did not lead to interpretable results. The Δ14C values range from –118‰ to +5.4‰ with no apparent logic. We assume that these fractions were contaminated during the drying process as large quantities of water had to be removed to obtain the samples.
Turnover modeling
The higher 14C concentration, at constant stable isotope composition, in fractions expected to have a longer turnover time, clearly points to the influence of higher atmospheric bomb-14C in the food consumed in the past. Bone remodeling leads to a continuous reworking of bone material under uptake of some fresh carbon with less bomb 14C and removal of some carbon taken up earlier. The observed correspondences with the atmosphere of 2005–2009, 2011–2012, and 2013–2014 reflect the average 14C concentration resulting from this remodeling process at different replacement rates and not real ages.
A simple growth and regeneration model was made to assess the external regeneration rates of the different fractions independently. It is important to note that this represents the regeneration rate from food only. This we call “replacement” from now on. It is different from the complete regeneration which also uses desorbed tissue. The 14C content of the atmosphere was near that of the standard atmosphere (Δ14C = –23‰) around 1954 when the subject was 10 years old. It had been relatively constant in the previous 10 years when compared to the following 65 years, until sampling. We, therefore, decided to “build” the bone model from 1954 onward. Assuming that the bone was 40% of its final size at the start of 1954 with a Δ14C of –23‰, we added a growth spurt of 10% of the final size per year in the years 1954–1958 and then 5% for 1959 and 1960 to reach 100% of the final bone mass at 17 years of age (Kini and Nandeesh Reference Kini, Nandeesh, Fogelman and van den Wall2012). With the varying atmospheric 14C input due to nuclear testing (Figure 3), this led to a composite bone carbon Δ14C of 72‰ in January 1961. Then, for each subsequent year, we replaced a certain constant percentage of the carbon with material having the Δ14C of the atmosphere of that year. As the main food ingested was grown during the summer months, we have used Δ14C of the average Northern Hemisphere NH1 summer months (May–August) for each year (Hua et al. Reference Hua, Turnbull, Santos, Rakowski, Ancapichún, De Pol-Holz, Hammer, Lehman, Levin, Miller, Palmer and Turney2022). The percentage of bone carbon replaced was iterated to reach the Δ14C of the different healthy fractions in April 2017 (Table 2).
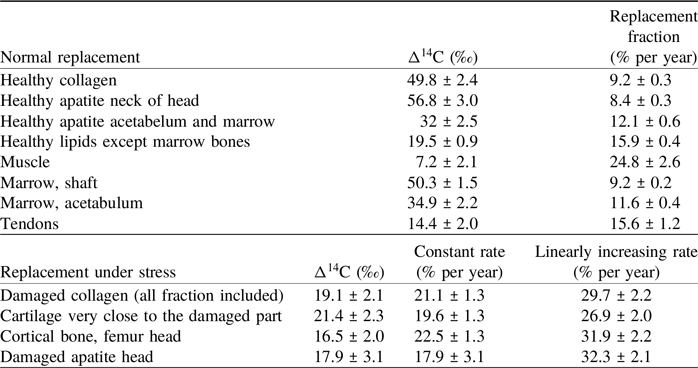
Table 2. Δ14C of the main fractions and the corresponding replacement rates in % per year. The replacement rates were calculated according to the model described in the text. Their uncertainties were calculated by fitting a normal distribution to 1000 Monte Carlo simulations for each rate

This modeled replacement rate is quite insensitive to the early growth assumptions and the 14C content of the atmosphere that went from –23‰ to +391‰ between 1954 and 1962, because the amount of material from these years still in the bone is very small (∼0.05%). Although we would expect a decrease in bone regeneration rates after 50 years of age (Fraher Reference Fraher1993; O’Flaherty Reference O’Flaherty2000), we did not include it in our model, as one set of results from one individual would not allow us to resolve more variables.
The replacement rates listed in Table 2 are based on atmospheric 14C values. The time needed for the carbon to progress from the atmosphere to the subject’s metabolism is hidden in these values. The subject has a relatively stable diet and lives in Northern Europe. Fast growth samples such as beard, hair, and nail can provide a good indication of the mean time for carbon from photosynthesis to the subject’s metabolism. Their Δ14C values of 11.6 ± 2.0‰, 13.8 ± 2.1‰, and 17.0 ± 2.0‰, respectively, are similar to atmospheric 14C values in the summers of 2015 and 2016. The significantly lower value of 3.8±2.0‰ for the hair tips may indicate a contamination by shampoo residues (Brock and Cook Reference Brock and Cook2017; De La Torre et al. Reference De La Torre, Ormsby, Fuller and Santos2014) despite Soxhlet cleaning.
It is reasonable to assume that metabolic uptake of carbon from fruits, vegetables, and dairy reflects the carbon content of the atmosphere from a few weeks, in summer and fall, to about a year prior to consumption in winter, spring, and early summer. A delay of more than a year between plant growth and consumption is possible for food products such as bread, meat, and dairy. Diet related discrepancies are expected to be small, because the fish consumption of the subject has been limited to one or two fish based meals per week. We have measured, in 2018, the Δ14C of a typical fish sample at Δ14C = 11.7 ± 2.5‰, which is statistically not significantly different from its contemporaneous atmosphere. We have, therefore, decided to neglect a dietary reservoir effect. Furthermore, we assume that the contribution of greenhouse grown fruits, where partly fossil CO2 may be injected, is also negligible.
The replacement rates and their uncertainties were calculated using a Monte Carlo approach where sets of 1000 values were randomly generated according to a normal distribution of the radiocarbon measurements. The distribution of the corresponding exchange rates was then fitted with a normal distribution to obtain the rate and its uncertainty.
The replacement rates of the damaged tissues were divided in two periods, first the “healthy” replacement rate for this tissue obtained from the corresponding healthy tissue was used until and including 2010 as the subject started to have problems with his hip 6–7 years prior to the operation. A second replacement rate was then obtained for the period 2010–2017. We built two different models, one with a constant “stressed” replacement rate and a second with a linearly increasing “stressed” replacement rate. Two sets of 1000 random values, for the healthy exchange rate and the 14C value of the damaged tissues, were used to determine the exchange rates of the damaged tissues. A normal distribution was fitted to the results to obtain the rates and their uncertainties.
Discussion
Turnover modeling allows us to estimate the carbon replacement rates that led to the measured 14C concentrations in bone collagen and apatite, in cartilage and tissues.
Group 1: The external regeneration rate of collagen from healthy bone and cartilage (group 1) with Δ14C values around 50‰ (Table 1), is estimated to be 9.2 ± 0.3% per year (Table 2). The apatite from cortical and cancellous bone of the femur neck has Δ14C values from 54.1‰ to 59.5‰, which indicates a regeneration of 8.4 ± 0.3% per year for the carbonate fraction of the bone. These replacement rates are in the range given by Fernández-Tresguerres-Hernández-Gil et al. (Reference Fernández-Tresguerres-Hernández-Gil, Alobera-Gracia, del-Canto-Pingarrón and Blanco-Jerez2006; 5–10%/yr), Cavalli and Brandi (Reference Cavalli and Brandi2011; 8–10%/yr) and Fahy et al. (Reference Fahy, Deter, Pitfield, Miszkiewicz and Mahoney2017; ∼7.7%/yr cortical and ∼17.7%/yr trabecular bone). They are significantly higher than the 2-to-4% per year collagen turnover rates reported by Hedges et al. (Reference Hedges, Clement, Thomas and O’Connell2007). Their study of mid-shaft samples from the Melbourne Femur Collection shows significant variability in 14C content for individuals of similar age, as may be expected for samples of a living tissue, constantly remodeling in response to external influences. Load differences between femur mid-shaft and head may have resulted in different replacement rates. Diet-related reservoir ages may have contributed to the 14C variability of the collection, as marine reservoir ages for the Southern Ocean were quite large and varied strongly over the atmospheric bomb 14C spike. It should be pointed out that the Δ14C values show the local replacement of tissue carbon by carbon taken up from nutrition. The actual remodeling activity of osteoclasts and osteoblasts is much faster, with lifespans of remodeled units in the order of 2–8 months, but remodeling, partly, recycles resorbed material (Miszkiewicz and Mahoney Reference Miszkiewicz and Mahoney2016; Robling et al. Reference Robling, Niziolek, Baldridge, Condon, Allen, Alam, Mantila, Gluhak-Heinrich, Bellido, Harris and Turner2008). The 14C concentrations thus show the combined effect of carbon replacement and recycling.
Group 2: Cortical bone collagen from the neck of the femur and cancellous bone apatite from the acetabulum and femur shaft with Δ14C values from 31.7‰ to 32.3‰, indicate a faster regeneration of 12.1 ± 0.6% per year. The faster replacement rates of group 2 are in line with literature estimates (Fahy et al. Reference Fahy, Deter, Pitfield, Miszkiewicz and Mahoney2017) and may be due to a higher stress at the neck of the femur, where the forces on the ball joint are transmitted to the femur shaft, and to the higher surface-to-volume ratio of trabecular bone and its role in the body’s mineral management (O’Flaherty Reference O’Flaherty2000; Ravazzano et al. Reference Ravazzano, Colaianni, Tarakanova, Xiao, Grano and Libonati2024).
The higher 14C concentration of the apatite carbon of the sponge-like bone tissue that fills the head of the femur indicates a low replacement of about 8% per year. The filling with just clear yellow bone marrow supports its isolation from active remodeling processes.
Group 3: The low Δ14C values of collagen and apatite of the damaged bone and cartilage (Δ14C values from 17.5‰ to 21.4‰) indicate increased regeneration. The constant replacement rate model from 2011 to 2017 leads to a replacement rate of 20% per year for both apatite and collagen fractions. It is also possible to reproduce the observed Δ14C of 2017, if we assume that the replacement rate in the damaged bone increased linearly with time from 9.3% in 2010 to reach 30% per year in 2017. The constant “damaged rate” implies a jump from the healthy rate to the “damaged” rate while a linear increase is more gradual, and probably more reasonable. However, a linear increase might underestimate the “damaged” rate during the early years (2010–2014), which results in a larger final value. The real replacement rate of the damaged tissue, therefore, probably lies between the modeled values of ∼20 and ∼30% and reflects a strong effort at local damage repair.
Cartilage replacement rates of ∼9% (“healthy”) and ∼20% (“stressed”) per year are quite similar to those for the cortical bone collagen and contrast with reports of no or slow replacement of collagen in articular cartilage (Goldring and Marcu Reference Goldring and Marcu2009; Heinemeier et al. Reference Heinemeier, Schjerling, Heinemeier, Møller, Krogsgaard, Grum-Schwensen, Petersen and Kjaer2016; Jørgensen et al. Reference Jørgensen, Schjerling, Krogsgaard, Petersen, Olsen, Kjær and Heinemeier2021; Våben et al. Reference Våben, Heinemeier, Schjerling, Olsen, Petersen, Kjaer and Krogsgaard2020; Zhang et al. Reference Zhang, Couppé, Scheijen, Schalkwijk, Kjaer, Peter Magnusson and Svensson2020). The cartilage samples were not enzymatically cleaned with hyaluronidase and trypsin (Heinemeier et al. Reference Heinemeier, Schjerling, Heinemeier, Møller, Krogsgaard, Grum-Schwensen, Petersen and Kjaer2016) and thus contained not only collagen but also glycosaminoglycans (GAG’s) and other noncollageneous substances. The replacement rates, calculated for this mixture, thus, probably reflect the fast turnover of the GAG’s reported by Heinemeier et al. (Reference Heinemeier, Schjerling, Heinemeier, Møller, Krogsgaard, Grum-Schwensen, Petersen and Kjaer2016). This fits results of in-vivo 13C tracer studies by Smeets et al. (Reference Smeets, Horstman, Vles, Emans, Goessens, Gijsen, van Kranenburg and van Loon2019) and Hendriks et al. (Reference Hendriks, Weijzen, Goessens, Zorenc, Gijsen, Kramer, van den Bergh, Poeze, Blokhuis and van Loon2023, see their Figure 5), that reveal synthesis of various musculoskeletal proteins, measurable in hours, at rates in the range of 0.02 to 0.1% per hour. Such rates fit osteon lifetimes and indicate the enriched-13C tracer results are not significantly affected by the osteoclast-osteoblast carbon recycling that determines the natural 14C response. Cartilage proteins are synthesized quickly but the results for the enzymatically-cleaned articular cartilage collagen indicate these proteins may not become incorporated in the long-lived collagen matrix. The difference in replacement rates between the “healthy” and “stressed” cartilage, however, indicates an attempt at local damage repair, even if we cannot assess which component of the cartilage was actively replaced. We cannot eliminate the possibility that the higher replacement rate is also due to the higher loading of the damaged area.
The 14C concentration of the various lipid isolates is, on average, slightly above the Δ14C of short-lived materials (hair, nails) and the 2016 atmosphere. This suggests a replacement rate of at 15.9 ± 0.9% per year. The carbon of these lipid fractions may thus have had a mean residence time of 6 to 7 years. The lower muscle 14C value (7.2 ± 2.1‰) corresponds to a regeneration rate of 25% per year. Such a high turnover rate is more difficult to assess as the Monte Carlo simulation no longer follows a normal distribution in this range, so its real uncertainty (Table 2) is probably larger but no more than doubled.
Conclusion
Various fractions of bone material and tissues, obtained during a hip replacement surgery in 2017, show material- and location-dependent 14C concentrations, that range from close to atmospheric to levels of bomb-14C found in the period 2005–2009. The 14C concentrations plus the decreasing atmospheric bomb-14C signal, used in a bone regeneration model, allow an estimate of the rate at which bone remodeling replaces tissue carbon with carbon from food. Most “healthy” samples showed replacement rates around 9% per year while cortical bone collagen from the femur neck and cancellous bone apatite from acetabulum and femur shaft turn over at around 12% per year. The lower 14C values of bone collagen and apatite from the damaged area indicate a locally doubled or tripled carbon replacement rate. As the damaged area is in the part of the joint which has the highest load, we cannot exclude that the increased replacement rate is also caused by this factor.
While the demonstration of locally variable bone turnover is generally valid, the numerical values, of course, reflect only one bone. More hips and knees will be needed for further studies. The results show, however, the responsiveness of bone to external influences and the detailed information a bone may contain. They also provide a caveat for the sampling of a bone for 14C dating and for forensic and medical studies. Different parts of a bone may remodel at different rates and thus archive (slightly) different environmental information. A suite of several bone samples, both organic (collagen) and inorganic (apatite), will be needed to fully utilize this information.
Acknowledgments
The authors wish to thank the team of the Lubinus Clinicum for their care and collaboration. The team of the National Laboratory for Age Determination participated in the sample preparation and measurement of the results. Their involvement and helpful comments are gratefully acknowledged.

 Open access