

Houston, along with much of southeast TX, has been impacted repeatedly over the last decade with multiple major weather events. Communities are at risk almost year-round for these varying, hard-hitting events from freezes and floods, to tornadoes, wind storms, and damaging hurricanes, including the Memorial Day Flood (May 2015), the Tax Day Flood (April 2016), Hurricane Harvey (August 2017), Tropical Storm Imelda (2019), Valentine’s Week Winter Storm and Freeze (February 2021), Hurricane Nicholas (September 2021), the Southeast Harris Tornado (January 2023), and the Derecho (May 2024). 1 Although much is done in terms of emergency planning and preparedness to mitigate adverse health outcomes for residents (e.g., improved drainage of rainwater, mandatory backup generators for nursing homes, proactive outreach to vulnerable residents immediately following a storm), a recent storm shows the need for further improvement or creativity in readiness strategies to alleviate preventable health events.
At 4am CDT on July 8th, Hurricane Beryl made landfall near Matagorda, TX, with maximum wind speeds of 80 mph. 2 Beryl moved quickly through coastal areas of southeast TX, with the eyewall and strongest winds impacting the Houston metropolitan area later that morning (8 am-11 am). As Beryl moved across Houston, the sustained winds speeds decreased to tropical storm force; however, hurricane wind gusts were observed throughout the city. The high winds created power outages at a mass scale in the city and its surrounding area. During the week following Beryl, many Houston residents still did not have power while experiencing maximum temperatures in the 90s and heat indices reaching over 100. While hot, these temperatures were below normal Heat Advisory criteria for Houston and below those occurring the week prior to Beryl. 3
The Houston Health Department and partners analyzed syndromic data to evaluate the health impact of the power outage on the community to inform future public health interventions.
Methods
Emergency department (ED) data from the health department’s syndromic surveillance system were extracted for conditions often monitored during major weather events. 4 –Reference Waddell, Jayaweera and Mirsaeidi 6 The system ingests near real-time, de-identified health care visit data from over 150 onboarded facilities, ranging from community clinics to major hospitals across the southeast region of Texas. Records with relevant chief complaint and/or discharge diagnosis fields were included in this analysis for the following kinds of ED visits: heat-related illness (HRI), carbon monoxide (CO) poisoning, acute cardiac condition (i.e., acute myocardial infarction or cardiac arrest), stroke, dialysis, and medication refills. Total ED visit volume was considered. Only records with both the patient and healthcare facility location in the Houston-area were included (i.e., patient and facility county were listed as Harris, Fort Bend, or Montgomery County).
Due to lack of access to a direct data source, the estimated percent of power outages data was scraped from a local news outlet’s power outage tracker dashboard.Reference Kanik, Stiefel and Haseman 7 Because Harris County covers most of the Houston-area, the estimated percent for this county was used as a representative.
Pre-storm baseline statistics for the 14 days prior to Beryl were calculated from the daily ED visit counts for each health outcome. Daily counts of the health outcomes from Day 0 (Beryl hit Houston)-Day 14 post-Beryl were then statistically compared to calculated baseline values using the t test. Three-day moving averages of the syndromic health outcome counts were plotted over the daily percent of power outages for graphical interpretation. SAS Enterprise Guide 8.2 was used for all calculations. 8 This research study is considered exempt from IRB review because it involved data that pose no greater than minimal risk to participants and do not involve any sensitive or identifiable personal information.
Results
Figure 1 displays the 3-day moving average of each health outcome from 14 days prior of Beryl’s landfall to 14 days post-landfall and the estimated percent of power outages for Harris County. Because the volume of total ED visits far exceeds those of the individual health outcomes explored, its time series is not shown in Figure 1.
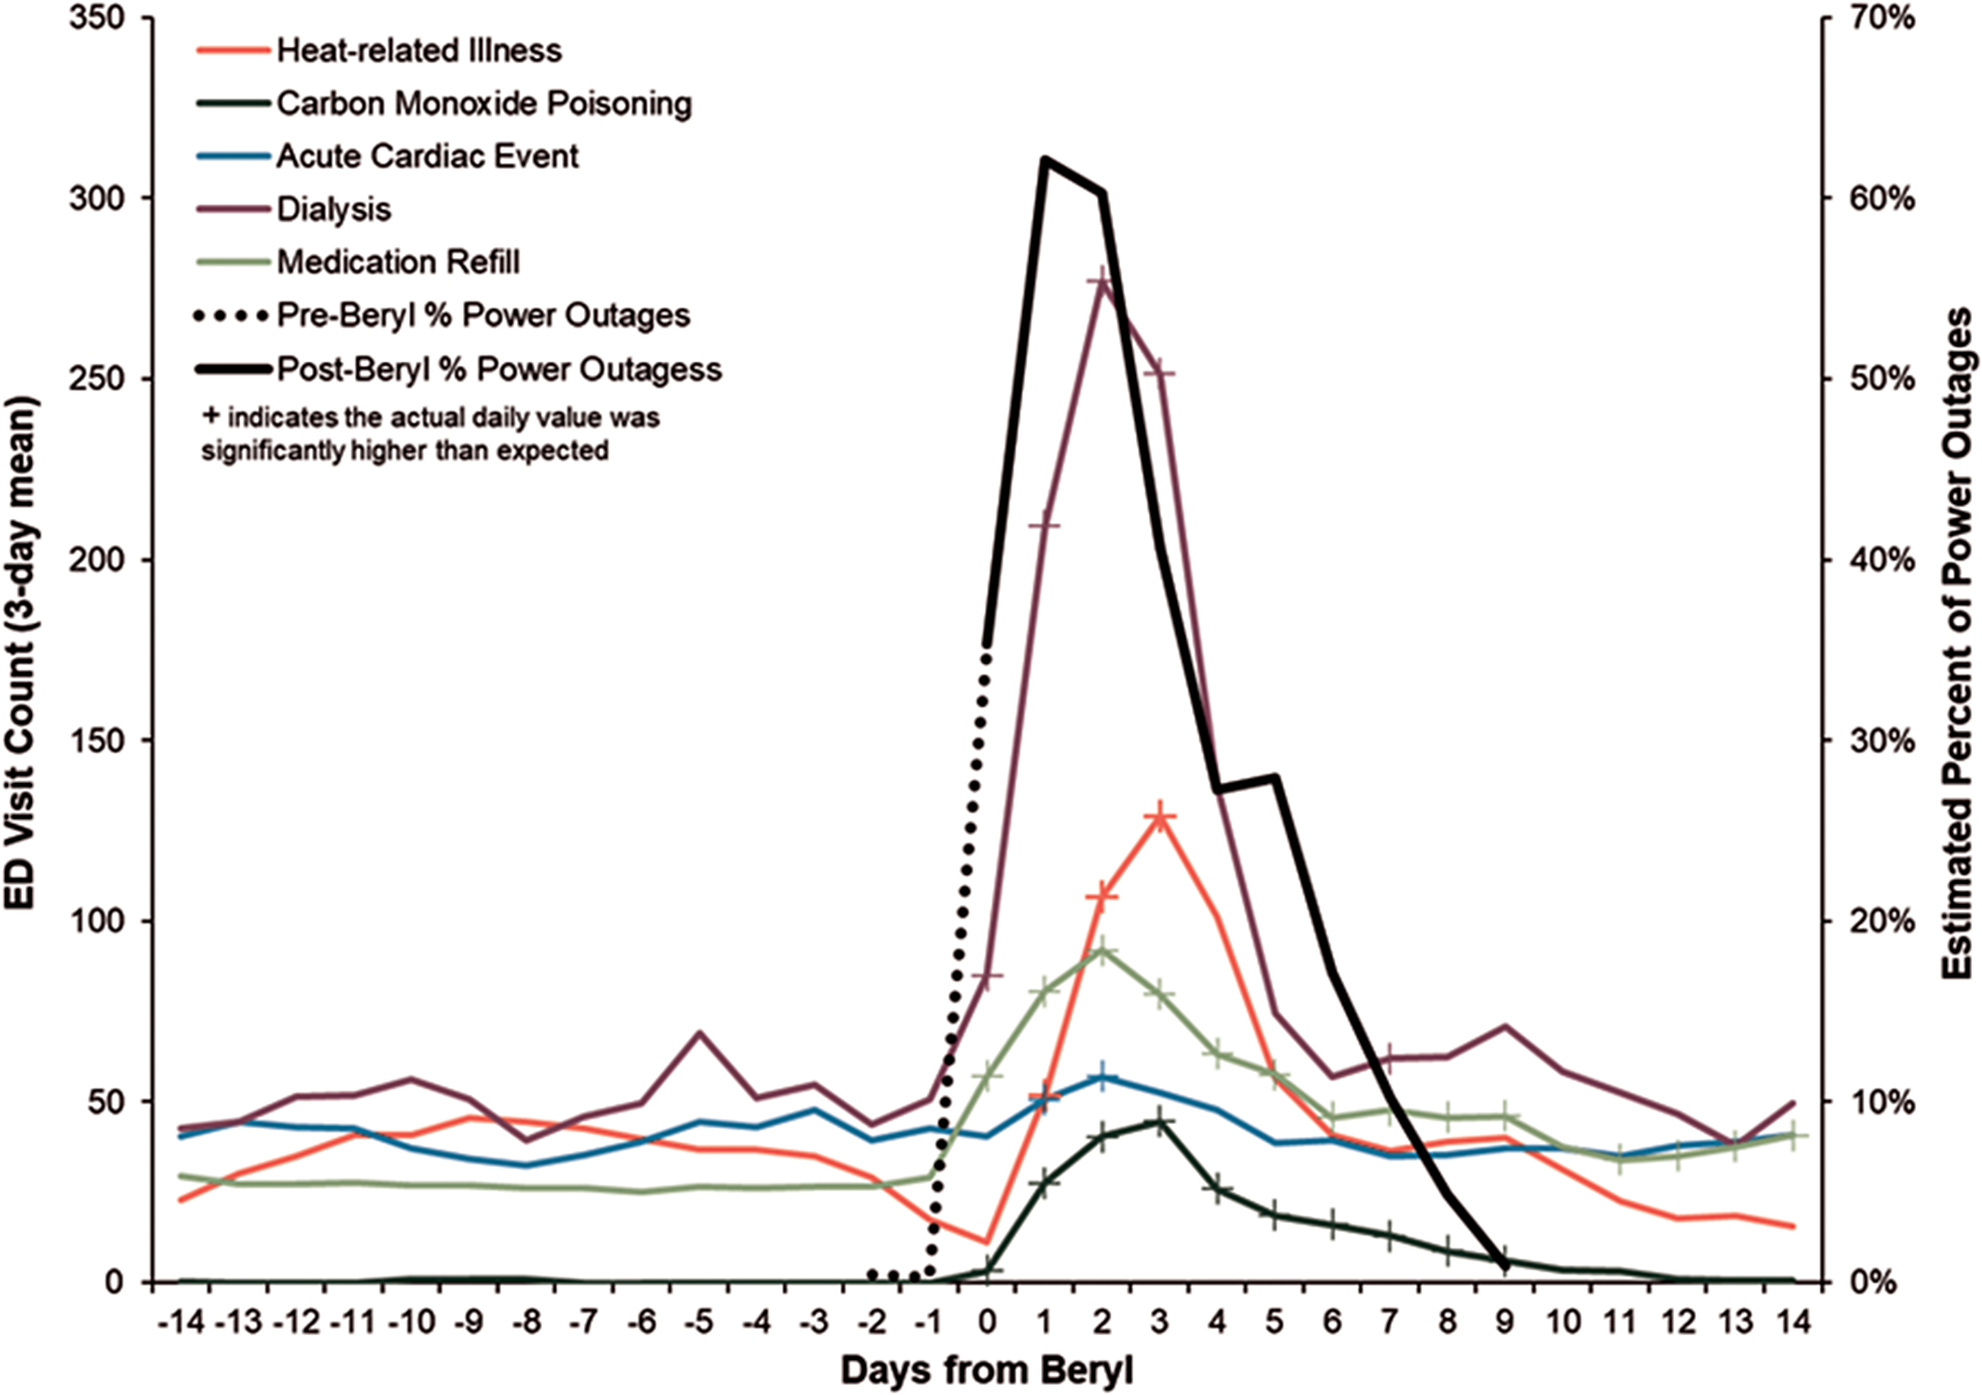
Figure 1. Daily ED visit volume and estimated percent of power outages for the Houston area, pre- and post-Beryl.
The daily total ED visit volume was significantly higher than expected on Day 1 and Day 2. The daily HRI visit volume was significantly higher than expected on Day 1, Day 2, and Day 3. The daily CO poisoning ED visit volume was significantly higher than expected on Days 1-9. The daily acute cardiac event ED volume was significantly higher on Day 1 and Day 2. The daily dialysis ED visit volume was significantly higher than expected on Days 0-3 and Day 7. The daily medication refill ED visit volume was higher than expected on Days 0-14, except for Day 10, where volume was within expected range. Comparisons were significant at P values less than 0.05 (for days that had significantly higher ED volume, P values ranged from <0.0001-0.0497). The daily stroke ED visit volume stayed within the expected range for each day in the post-Beryl timeframe.
The daily estimated percent of power outages in Harris County was highest on Day 1 (62%), followed by Day 2 (60%). The estimated percent continued to decline daily and by Day 9 post-Beryl, the percent of power outages was estimated at <1%.
Discussion
The results from this analysis are consistent with a call to public health officials to develop practice-based recommendations and increase targeted strategies for at-risk individuals using historical surveillance data.Reference Randazza, Hess and Bostrom 5 Houston experienced statistically significant increases in ED use up to 14 days post-Beryl, but most markedly on days coinciding mass power outages (Days 0 through 3). Based on these findings, the Houston Health Department intends to mitigate:
-
• heat-related illnesses by messaging to the public to prepare for the possibility of extended loss of power and to pre-identify and utilize cooling centers, including knowing their options for transportation to the center; and messaging during the event to utilize cooling centers, to move outdoors to shade over staying in a hot house (i.e., an indoor residence may not be the coolest place), to conduct any outdoor activities during times of the day where temperatures are lower (i.e., early morning or evening), to pre-hydrate hours before planning to work outdoors and to continue to hydrate while working outdoors, and to never be alone while in a hot environment.
-
• acute cardiac episodes by targeted messaging to providers of cardiac care patients of the increase of cardiac events seen after Beryl and to the public to be especially cautious working in debris removal during the heat.
-
• dialysis and medication refill emergencies by providing targeted messaging to providers to create contingency plans for patients in advance of disasters with patients, including those needing power for treatment;Reference Shakour, Mithani and Kopp 9 to hospitals to prepare temporary triage facilities for influxes in these kinds of emergencies; to emergency medical services to prepare for an increased volume in calls and ad-hoc medical requests (e.g., supplying oxygen tanks to patients instead of taking directly to the hospital); and to the public to prepare for extended power outage disruption of routine medical care and pharmacy access.
-
• carbon monoxide poisoning by providing targeted messaging to the public regarding the number of poisonings that occur across the city any time there are power outages, encouraging use and/or installation of monitors in homes, and proper usage of generators.
Author contribution
Kelsey Caton: completed the analyses and led the writing; Loren Hopkins: conceived, led the writing, and supervised the study; Lance Wood: assisted with the study and analysis; Angela Blanchard: assisted with the study; Janeana White: assisted with the study and analysis; Stephen Williams: supervised the study; David Persse: supervised the study.
Funding statement
This research received no specific funding.
Competing interests
The authors declare none.


 Open access