Introduction
The new mineral barronite, ideally (□1.5Ba0.5)2(UO2)2Si5O12(OH)·2H2O, is named after the exploration geologist Keith Barron (born 1962), the winner of the Thayer Lindsay award (2008) for his discovery of the famous Au–Ag deposit of Fruta del Norte in Ecuador, owner of the second world’s largest sapphire mine of Rock Creek, Montana, USA, and actively exploring gold, copper, base metal and uranium in Switzerland, Argentina, Ecuador, Guyana and France. The new mineral and its name have been approved by the Commission on New Minerals, Nomenclature and Classification of the International Mineralogical Association (IMA 2024-053, symbol Barr). Two cotype specimens are deposited in (1) the collections of the Department of Mineralogy and Petrology, National Museum in Prague, Cirkusová 1740, 19300 Praha 9, Czech Republic, under the catalogue number P1P27/2024 (polished section used for initial WDS analysis to confirm the dominance of Ba over K) and in the Muséum cantonal des sciences naturelles (Naturéum), Département de géologie, Université de Lausanne, Switzerland, under the catalogue number MGL 087280 & 087281 (several fragments for final EPMA-WDS, structure determination by 3D ED, powder X-ray diffraction, spectroscopy methods and optics).
Here, we report on the description of the new mineral, including its crystal-structure determination and refinement from the 3D electron diffraction data.
Occurrence
Barronite was found by one of the authors (CS) on the specimens originating from the Menzenschwand/Krunkelbach uranium deposit, Black Forest Mts. (Schwarzwald), Baden-Würtemberg, Germany (47°50’19.60”N, 8°2’43.38”E). This locality is a famous occurrence of supergene minerals, in which more than 40 uranium-bearing mineral species have been reported. Barronite is the ninth new mineral to be described from Menzenschwand, the other being metauranocircite (Gaubert, Reference Gaubert1904), joliotite (Walenta, Reference Walenta1976), arsenuranospathite (Walenta, Reference Walenta1978), uranosilite (Walenta, Reference Walenta1983), uranotungstite (Walenta, Reference Walenta1985), arsenovanmeersscheite (Walenta and Theye, Reference Walenta and Theye2007), nielsbohrite (Walenta et al., Reference Walenta, Hatert, Theye, Lissner and Roeller2009) and heisenbergite (Walenta and Theye, Reference Walenta and Theye2012). For details on the history of mining, geology and mineralogy of this deposit, see Markl and Wolfsried (Reference Markl and Wolfsried2011).
Barronite is of supergene origin; its formation is the result of the oxidation–hydration of uraninite/pitchblende in the supergene zone in situ along with other uranyl silicates and, also most probably, phosphates/arsenates (Göb et al., Reference Göb, Wenzel, Bau, Jacob, Loges and Markl2011; Plášil, Reference Plášil2014; Steciuk et al., Reference Steciuk, Škoda, Dillingerová and Plášil2022). The large amount of baryte in the gangue explains the abundance of supergene minerals containing barium. In particular, the Menzenschwand deposit is famous for the abundance of metauranocircite and billietite. Disequilibrium 234U–230Th radiometric age determination of supergene uranium minerals date the formation to 250–350 Ka (Hofmann and Eikenberg, Reference Hofmann and Eikenberg1991), whereas the lower intercept of U–Pb dating on metauranocircite gave an age of 1.7 Ma (Pfaff et al., Reference Pfaff, Romer and Markl2009).
Physical and optical properties of barronite
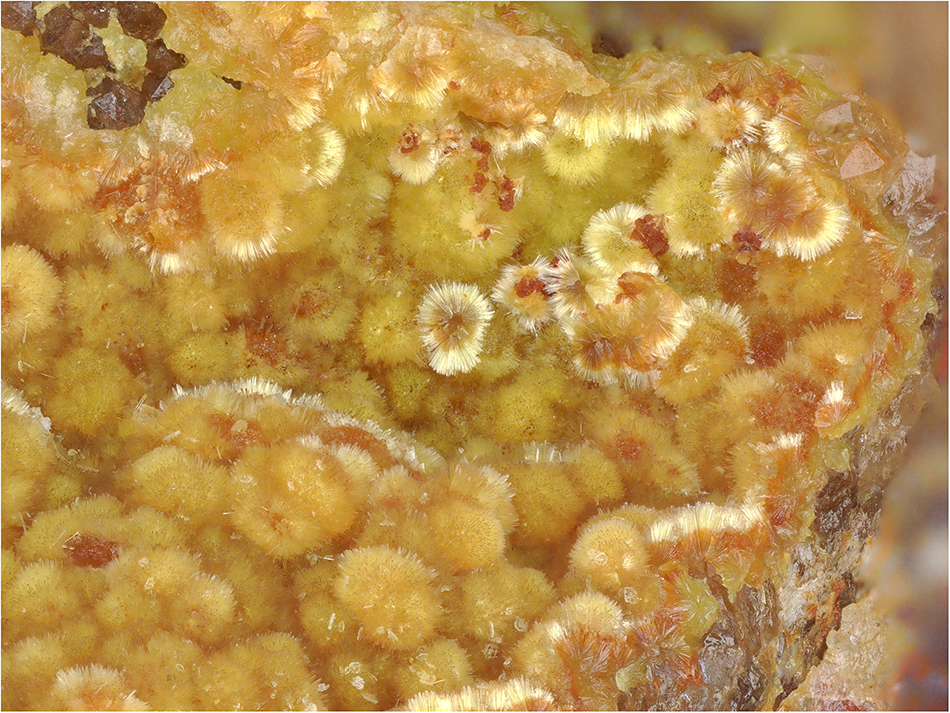
Barronite occurs in globular/acicular aggregates consisting of long-prismatic crystals, having maximally 0.3 mm in length, in vugs of gangue dominantly composed of baryte and quartz (Fig. 1). Some of the crystals have a brown-orangish tint, caused by the presence of Fe–Si-gels growing on them. Crystals have a pale yellow colour and colourless pale yellow streak. It is non-fluorescent in SW and LW ultraviolet light. The Mohs hardness is estimated at 1–2 by analogy with weeksite. Barronite is brittle; with perfect prismatic cleavage, distinct on {100}. The fracture is uneven. Optically, barronite is biaxial (+), with α = 1.599(2), β = 1.607(2), γ = 1.617(3) (measured at 589 nm light), 2V (meas.) = 86° (based on the extinctions using the spindle-stage) and 2V (calc.) = 84° (calculated after Wright, Reference Wright1951). Dispersion is distinct r>v. Pleochroism is distinct in hues of pale yellow, X<Y<Z. Optical orientation is X = b, Y ˄ a ≈ 3° in the obtuse angle β.

Figure 1. Needle-like crystals of barronite that are forming acicular aggregates in the vug of quartz-baryte gangue. Specimen MGL 087281, field of view 2.95 mm (photo by Carsten Slotta).
Chemical composition and density
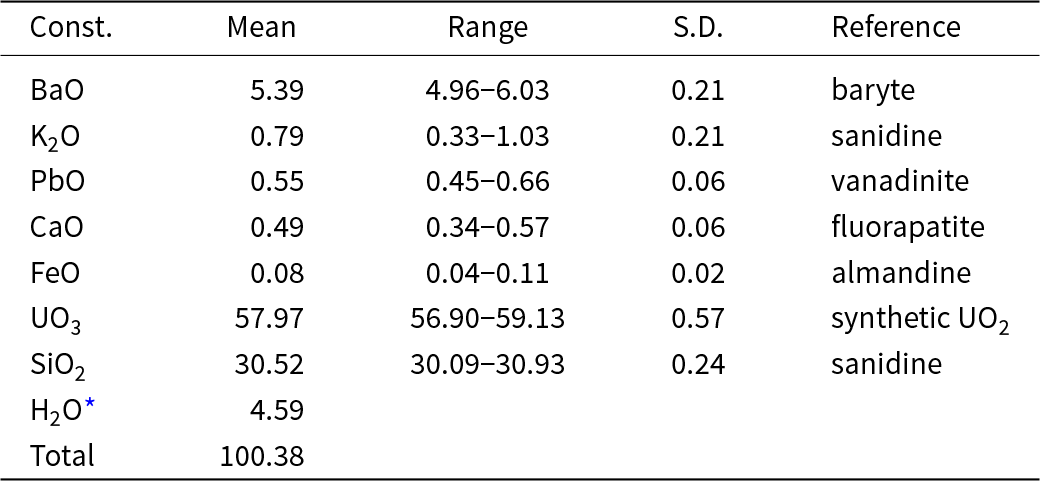
Electron probe microanalyses (13 points on a homogeneous aggregate of crystals) were performed at the Masaryk University in Brno (Czech Republic) on a Cameca SX-100 electron microprobe operating in WDS mode. Analytical conditions were 15 kV accelerating voltage, 4 nA beam current and 15 μm beam diameter. Raw X-ray intensities were corrected for matrix effects with a ϕρ(z) algorithm X-PHI (Merlet, Reference Merlet1994). The K content was corrected for spectral interferences of the KKα line with UMβ using an empirical overlap correction. The content of H2O was not determined directly due to the scarcity of pure material. The H2O content was calculated based on 1 OH and 2 H2O was derived from the structure refinement. The crystal structure, infrared and Raman spectroscopy data confirm the presence of OH groups and H2O and the absence of B–O, C–O and N–O bonds in the mineral. Analytical data are given in Table 1.
Table 1. Chemical composition (wt.%) of barronite

* calculated by stoichiometry (H = 5 apfu); S.D. = standard deviation
The empirical formula (calculated based on 19 O atoms) is (□1.369Ba0.345K0.165Ca0.086Pb0.024Fe0.011)Σ2.000(U0.996O2)2Si4.989O12(OH)·2H2O. The calculated density for the empirical formula (Z = 4) and unit-cell parameters obtained from powder X-ray diffraction data is 3.63 g.cm–3. The ideal formula is: Ba0.5(UO2)2Si5O12(OH)·2H2O, which requires BaO 7.71, UO3 57.543, SiO2 30.22 and H2O 4.53, total 100.00 wt.%.
Infrared and Raman spectroscopy
The Attenuated Total Reflectance (ATR) spectra of barronite were recorded by using a micro FTIR LUMOS II spectrometer (Bruker) equipped with a germanium ATR crystal (n = 4.0). Spectra were collected in the 450–4000 cm−1 range by co-addition of 250 scans with a resolution of 4 cm−1 using a DLaTGS detector. The spectrum was processed by ATR correction algorithm, in OPUS software, using the mean refractive index of barronite.
The Raman spectra were obtained from loose crystals using a Labram HR Evolution spectrometer. This dispersive, edge-filter-based system is equipped with an Olympus BX 41 optical microscope, a diffraction grating with 600 grooves per millimetre and a Peltier-cooled, Si-based charge-coupled device (CCD) detector. After careful tests with different lasers (473, 532 and 633 nm), the 532 nm Nd:YAG diode pumped laser with a nominal power of 50 mW attenuated to 10% by a neutral density filter was selected for spectra acquisition to minimise analytical artifacts. The Raman signal was collected in the range of 80–4000 cm–1 with a 100× objective (NA 0.9) in confocal mode, and beam diameter was ∼1 µm and the axial resolution ∼2 µm. No visual damage to the analysed surface was observed at these conditions after the excitation. Wavenumber calibration was done using the Rayleigh line and low-pressure Ne-discharge lamp emissions. The wavenumber accuracy was ∼0.5 cm–1 and the spectral resolution was ∼2 cm–1. Band fitting was done after appropriate background correction, assuming combined Lorentzian-Gaussian band shapes using the Voigt function.
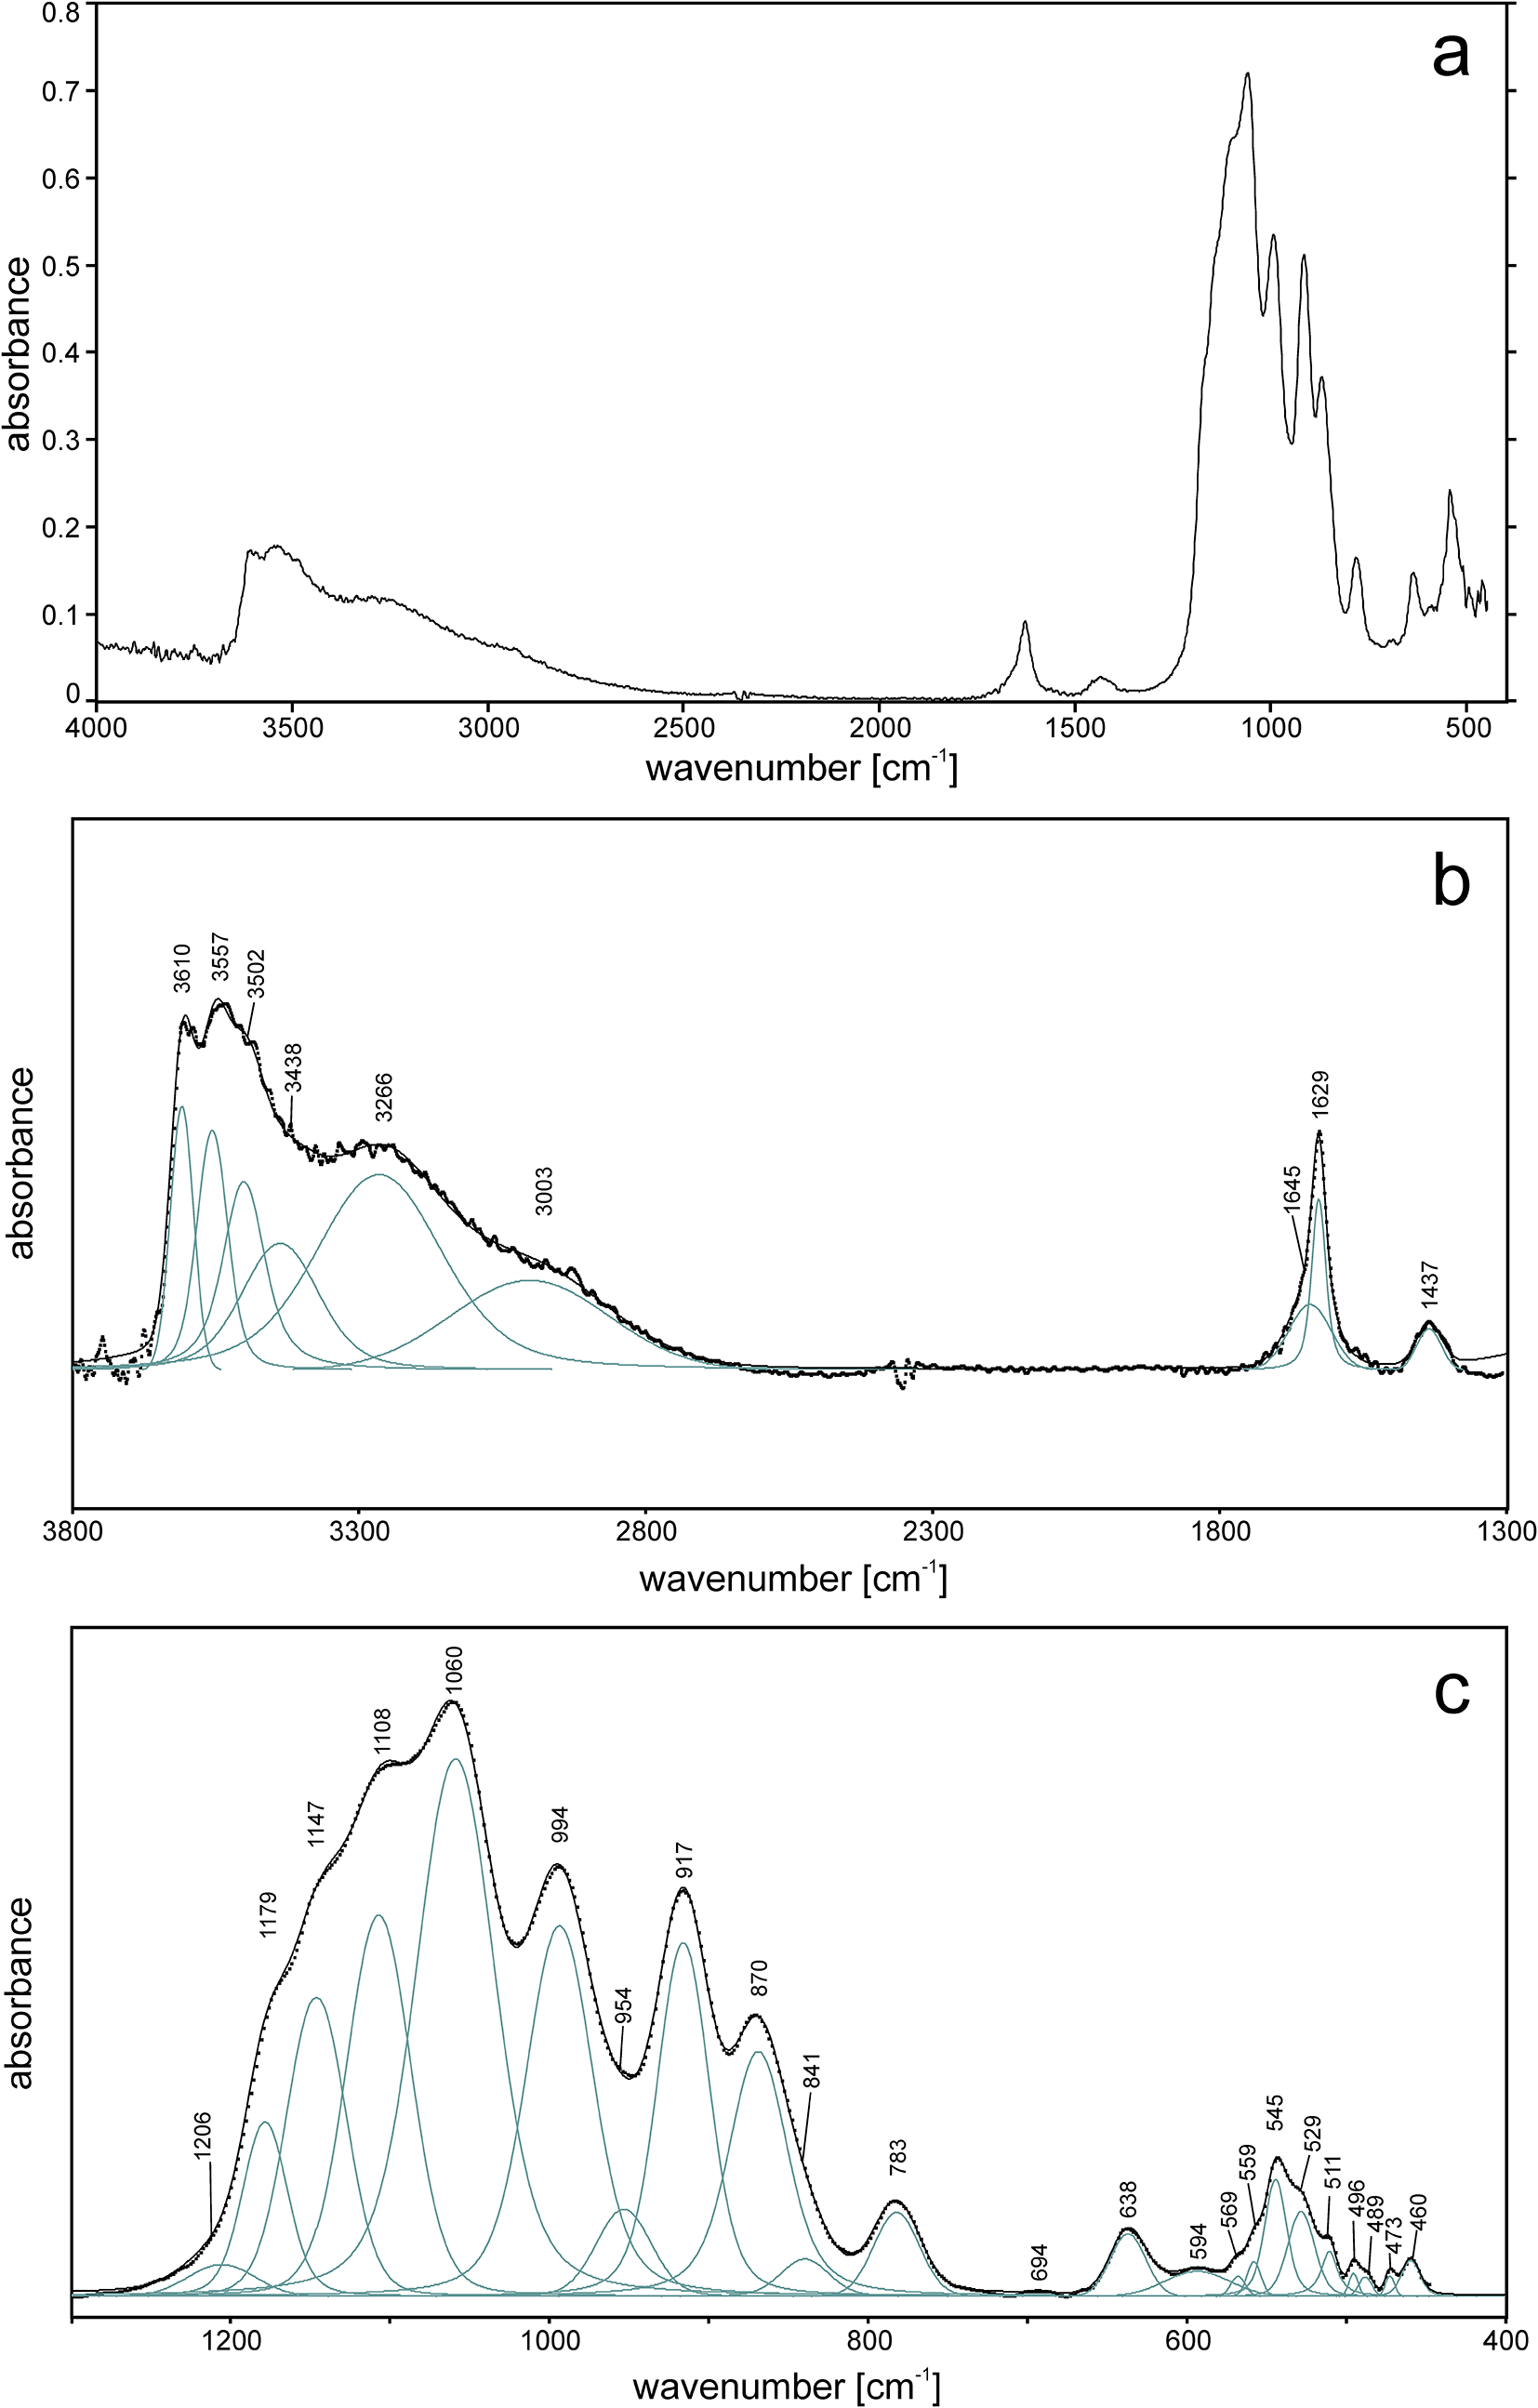
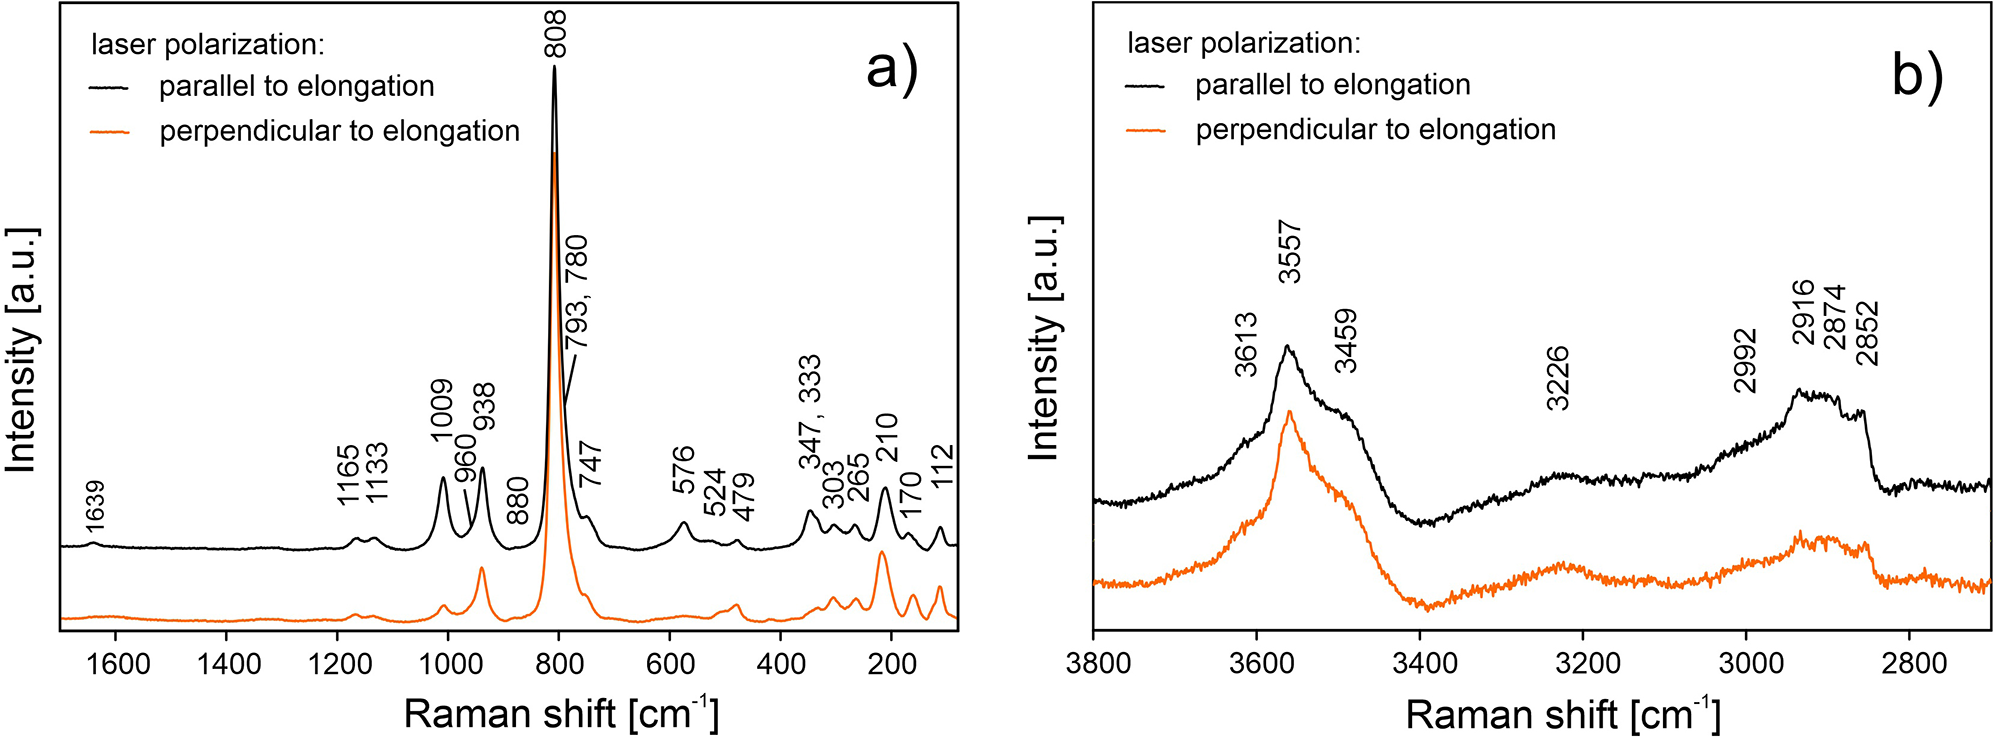
The ATR corrected IR spectrum is shown in Fig. 2a, deconvoluted absorption bands in the IR spectra (Fig. 2b,c) and Raman bands (Fig. 3a, b) of barronite were assigned as follows: observed overlapping bands at 3610, 3557, 3502, 3438 and 3266 cm–1 (IR), and 3613, 3557, 3459 and 3226 cm–1 (Raman) corresponds to O−H stretching vibrations. According to the empirical relation between the energy of vibration and the corresponding bond length (Libowitzky, Reference Libowitzky1999), O–H···O (H···Acceptor) bond lengths vary approximately in the range from 1.85 to 2.4 Å. The broad band at 3003 cm–1 (IR) and several overlapping bands at 2992–2852 cm–1 (Raman) could be attributed to the stretching mode of SiO3O−H. Similar vibrations were observed in haiweeite (Frost et al., Reference Frost, Čejka, Weier, Martens and Kloprogge2006). The vibrations at 1645 and 1629 cm–1 (IR) and 1639 cm–1 (Raman) correspond to the H2O bending mode. The IR band at 1437 cm–1 and Raman bands at 1165, 1133 and 1009 cm–1 are attributed to Si–OH bending modes of SiO3OH (Čejka Reference Čejka1999; Frost et al., Reference Frost, Čejka, Weier, Martens and Kloprogge2006; Colmenero et al., Reference Colmenero, Plášil and Sejkora2019), and a band at 938 cm–1 corresponds to antisymmetric stretching vibrations of SiO4 groups. These bands are also visible in the IR spectrum at 1206, 1179, 1147, 1108, 1060 and 994 cm–1. The bands at 917 and 870 (IR) correspond to the split triply degenerated ν3 antisymmetric stretching vibrations of UO2, and a prominent Raman band at 808 cm–1 and probably some shoulders (Raman) are attributed to ν1 symmetric stretching vibrations of UO2, partially overlapping symmetric stretching vibrations of SiO4 at 750–600 cm–1 (IR) and ∼750 cm–1 (Raman). Using the empirical relationship of Bartlett and Cooney (Reference Bartlett and Cooney1989) between vibration energies of ν3 (UO2)2+ and ν1 (UO2)2+ and the corresponding U–O bond lengths, we have calculated the approximate U–O bond lengths as follows (in Å): 1.77 (from 917 cm–1), 1.81 (870 cm–1) and 1.80 (808 cm–1). These values are in line with the structure refinement. The region between 600–500 cm–1 comprises bending modes of SiO4 and water libration modes, whereas bending modes of UO2 are tentatively assigned to the Raman band at 265 cm–1, by analogy with weeksite (Frost et al., Reference Frost, Čejka, Weier, Martens and Kloprogge2006).

Figure 2. ATR-corrected FTIR spectrum of barronite. (a) Entire collected spectrum; (b) spectral fit in the range 3800–1300 cm–1; (c) spectral fit in the range 1300–400 cm–1. For (b, c), the measured spectrum is shown by dots. The black curve matching to dots is a result of spectral fit as a sum of individual Voigt peaks shown below the curve.

Figure 3. Raman spectra of barronite collected in two perpendicular crystal orientations shown in (a) the 1700–80 cm–1 region and (b) the 3800–2700 cm–1 region.
Crystallography and crystal structure of barronite
Powder X-ray diffraction data
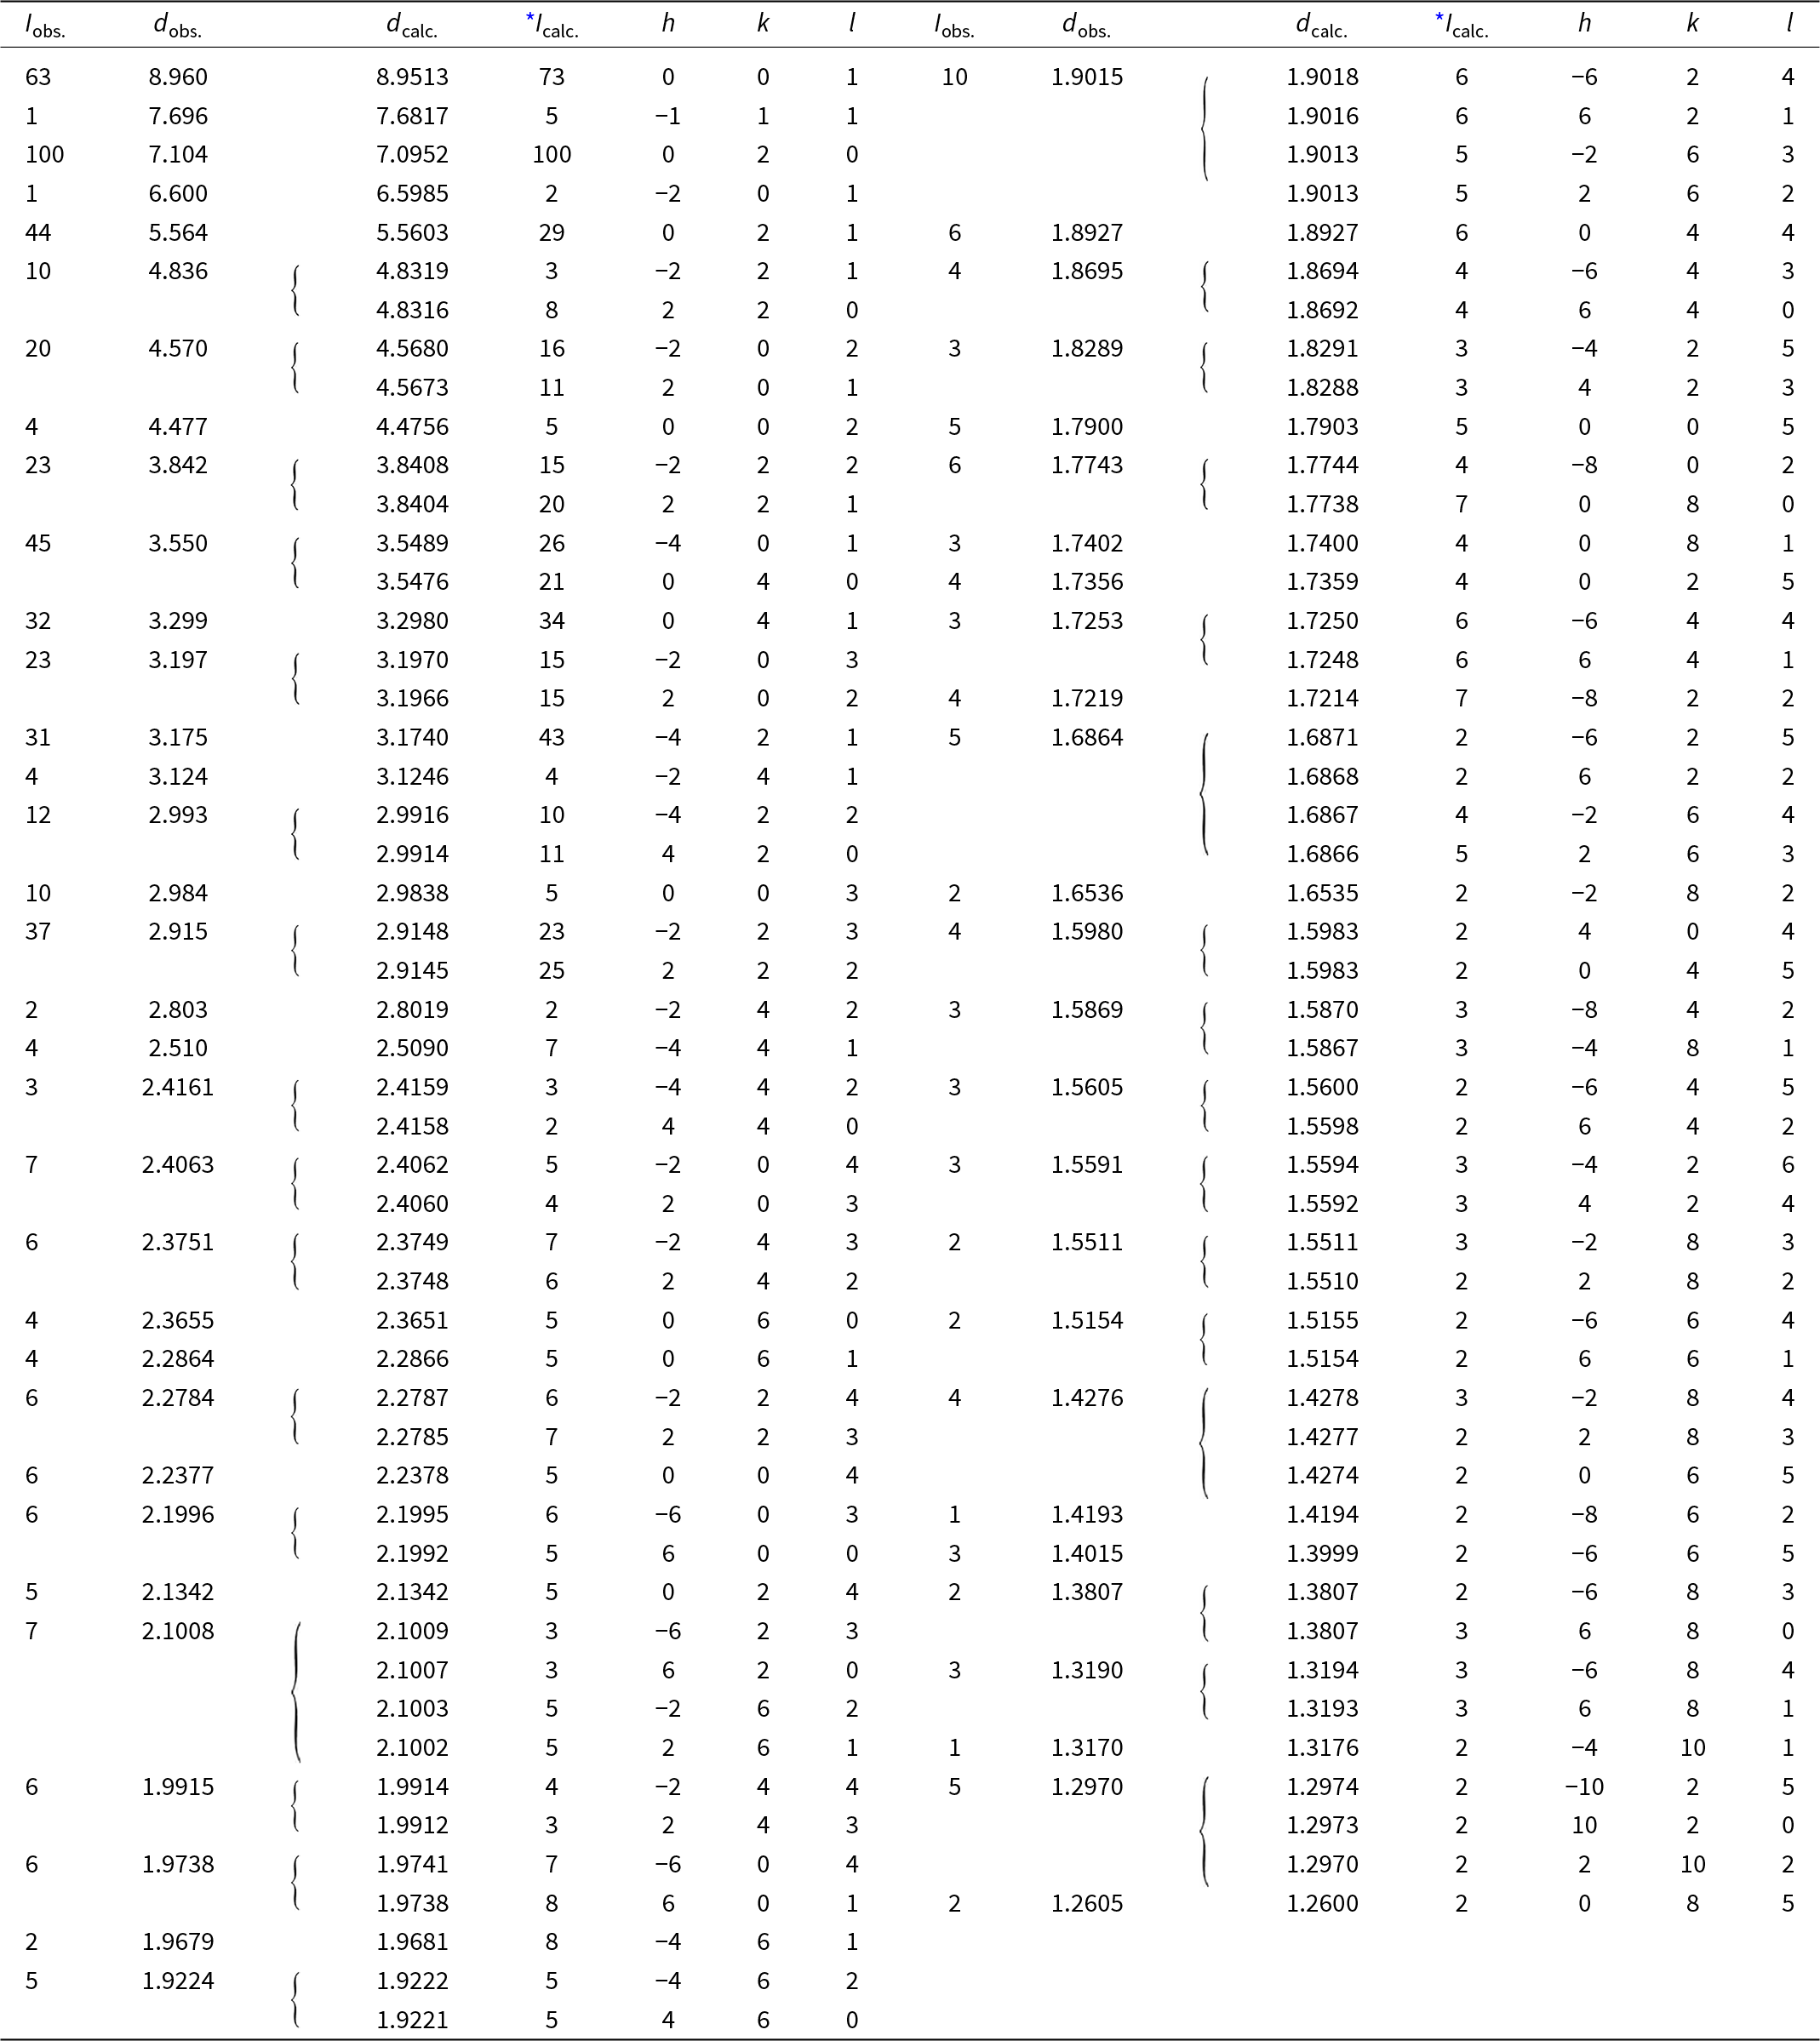
Powder X-ray diffraction data were collected at room temperature using a PANalytical Empyrean diffractometer (λ = 1.54184 Å) equipped with a focusing Göbel mirror (producing high-intensity CuKα1,2 beam), capillary holder and solid-state PIXcel3D detector. The instrument was operating at 45 kV and 40 mA. Barronite crystals were crushed mildly in acetone and loaded into a 0.3 mm capillary. The powder data were collected in the Debye-Scherrer geometry in the range 3–90°2θ, integrated step 0.015° and a counting time of 50 s per step (total experiment duration was ca. 72 hours). Visual inspection following data collection found no evidence of sample dehydration or damage. Positions and intensities of diffractions were found and refined using the Pearson VII profile-shape function of the ZDS program package (Ondruš, Reference Ondruš1993). The unit-cell parameters of barronite were refined by the least-squares program of Burnham (Reference Burnham1962). The powder X-ray diffraction data of barronite are provided in Table 2. The refined unit-cell parameters (298 K) (for the space group C2/m) are a = 14.1955(13) Å, b = 14.1904(8) Å, c = 9.6296(8) Å, β = 111.634(5)°, with V = 1803.1(3) Å3 (Z = 4). The refined unit cell volume obtained from the data collected at 298 K is slightly larger than that obtained from the 3D ED at 95K (1788.2 Å3) and is actually close to the one of the natural weeksite (∼1808 Å3; Fejfarová et al., Reference Fejfarová, Plášil, Yang, Čejka, Dušek, Downs, Barkley and Škoda2012).
Table 2. Powder X-ray diffraction data (d in Å) for barronite; the six strongest diffractions are reported in bold

* Icalc. – intensity calculated using the software PowderCell2.3 (Kraus and Nolze, Reference Kraus and Nolze1996) on the basis of the structural model given in the later Tables on Atom positions and isotropic displacement parameters.
Single-crystal 3D electron diffraction
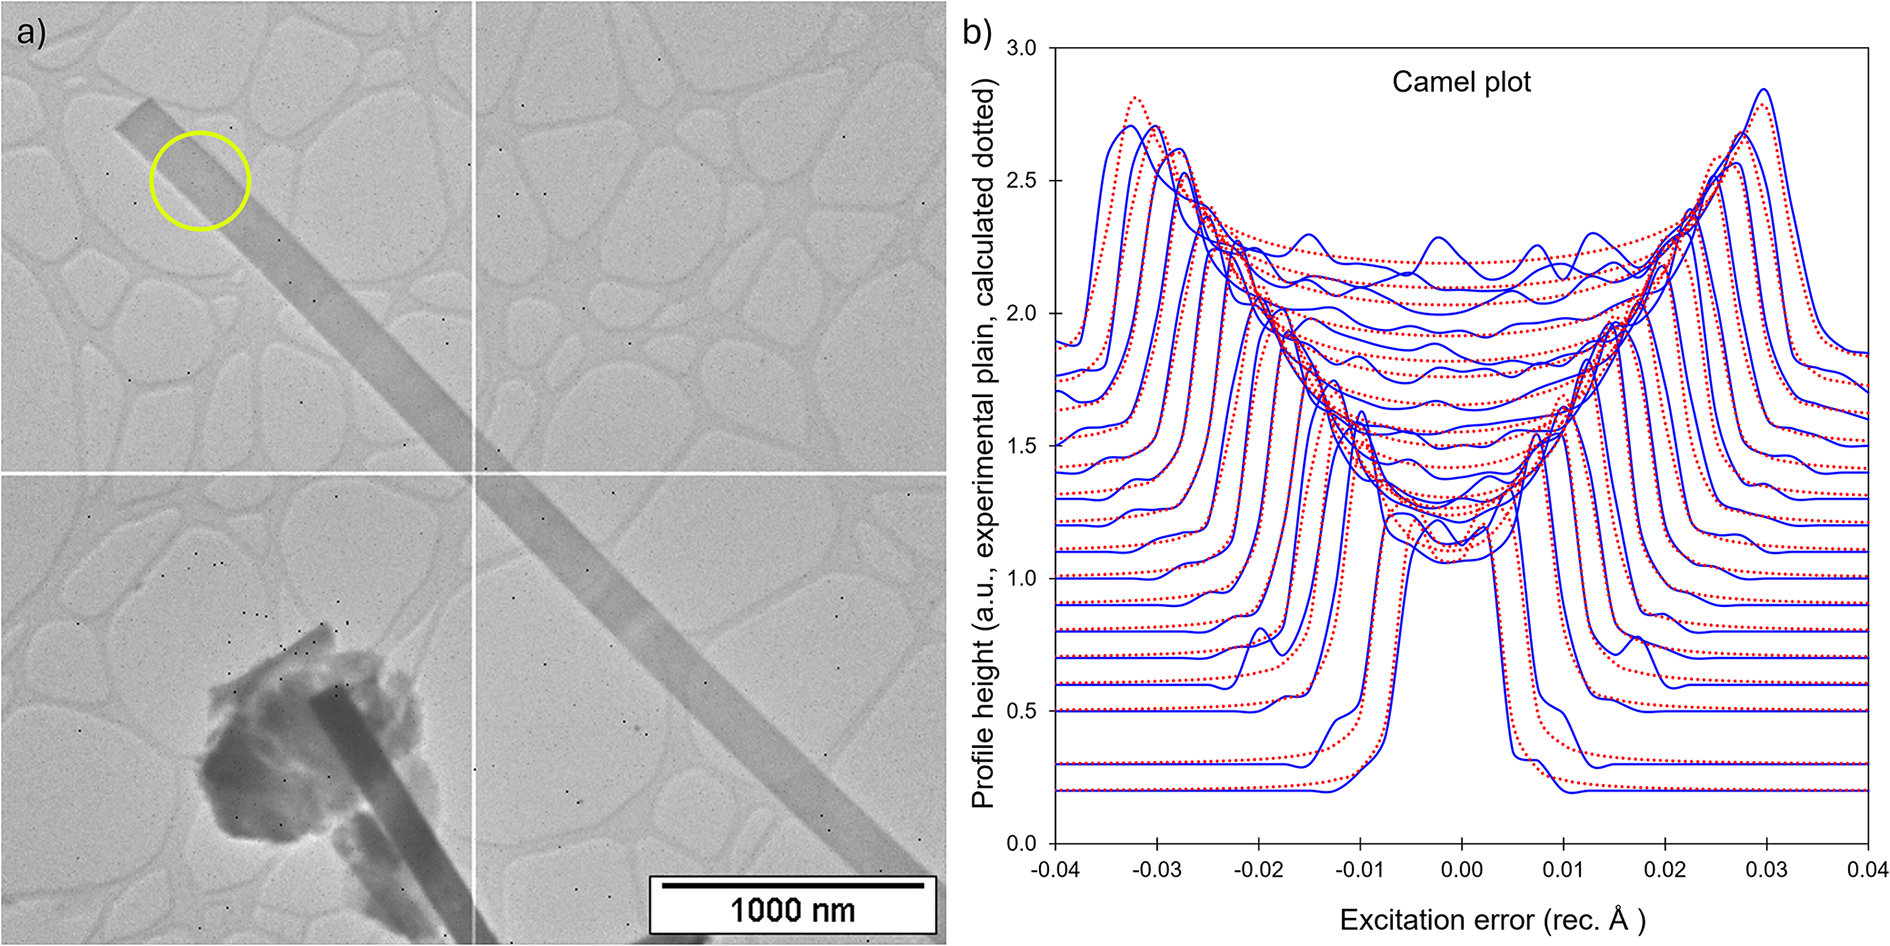
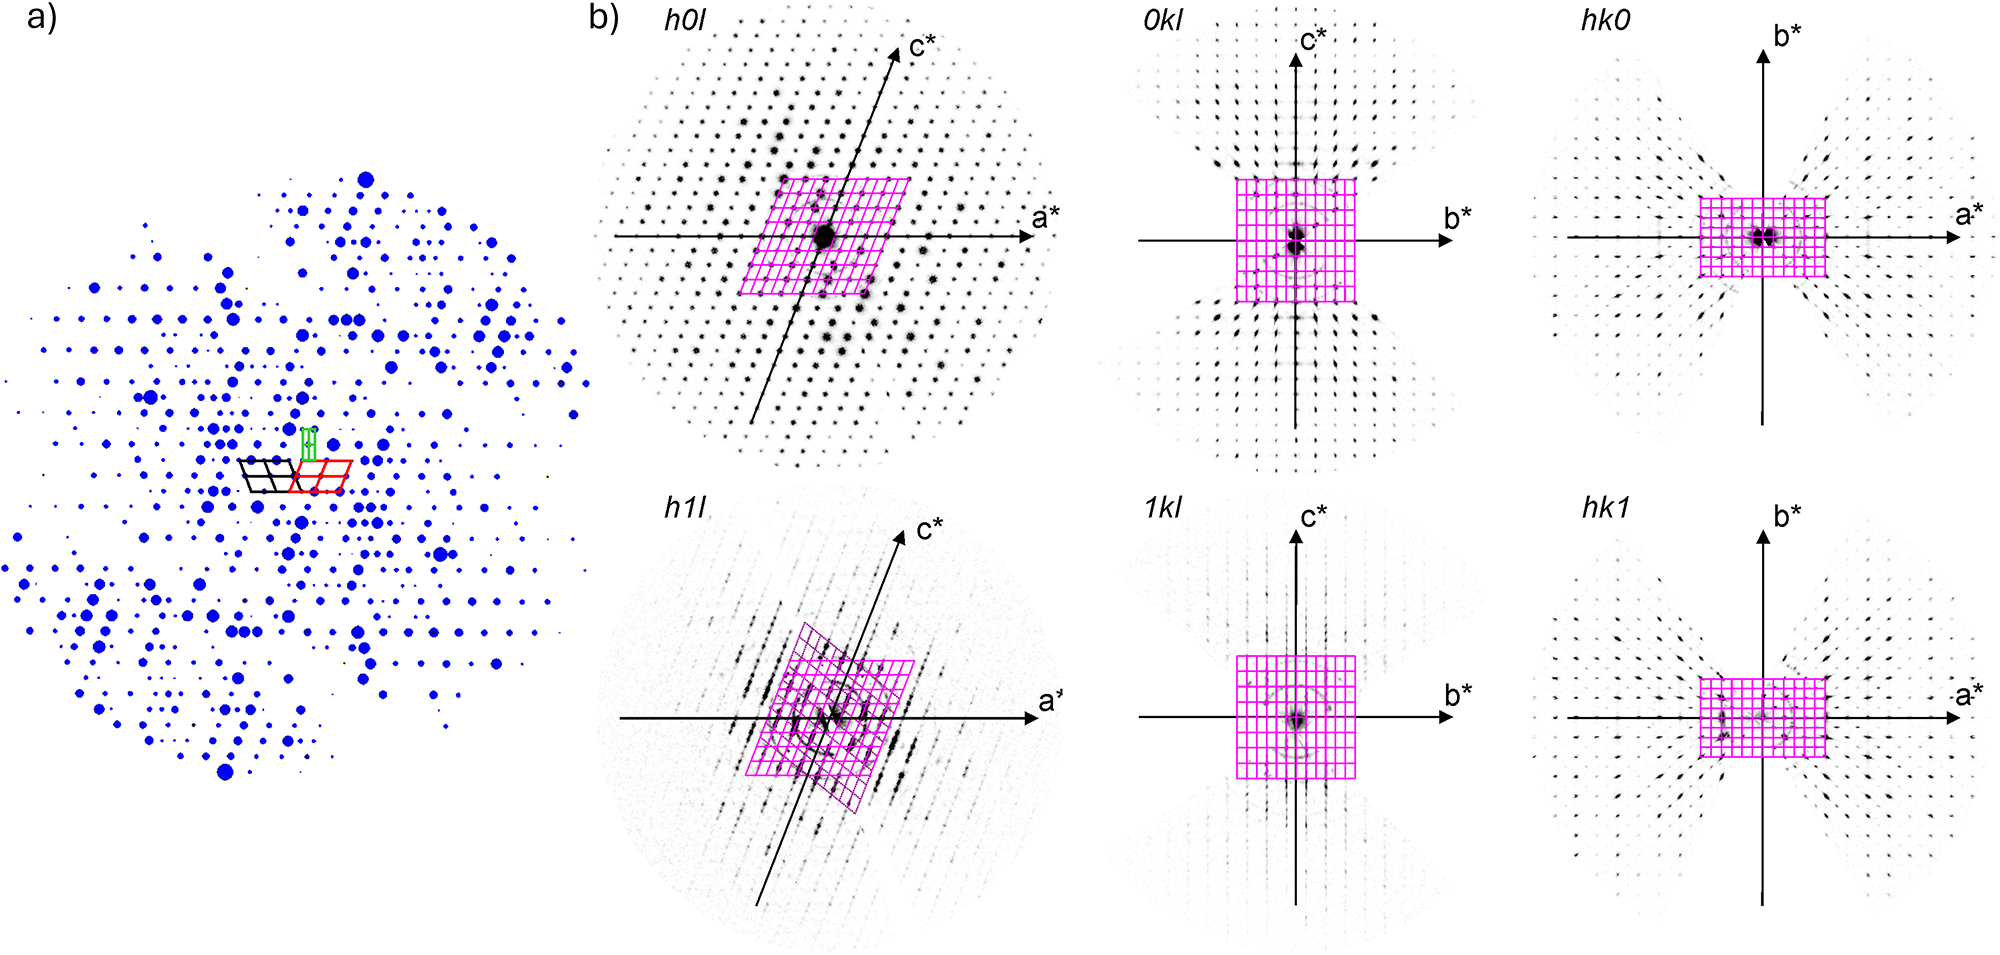
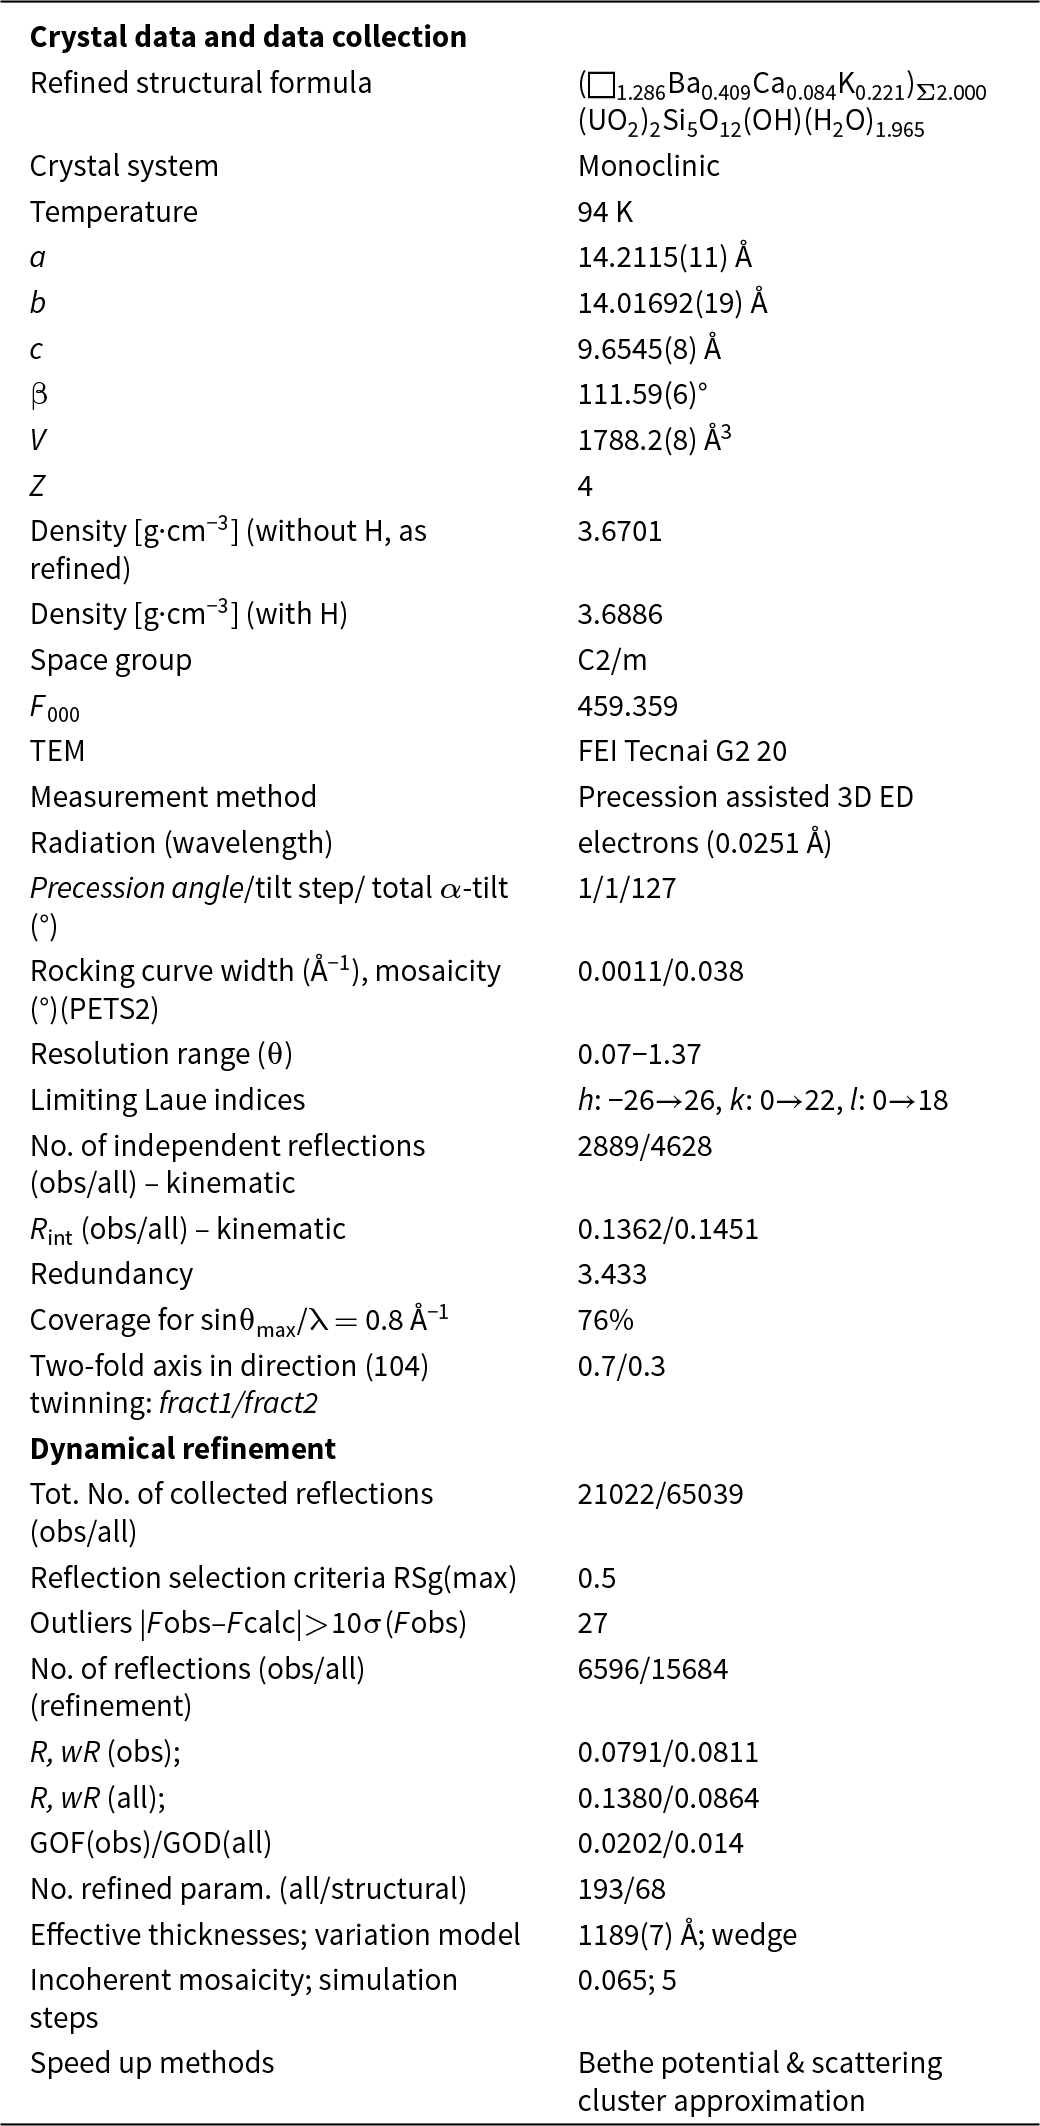
Because barronite crystals are thin, long, relatively small and intergrown in parallel aggregates (Fig. 4a), no useful single-crystal X-ray data could be acquired. Therefore, 3-dimensional electron diffraction techniques (3D ED) were used (Gemmi and Lanza, Reference Gemmi and Lanza2019; Gemmi et al., Reference Gemmi, Mugnaioli, Gorelik, Kolb, Palatinus, Boullay, Hovmöller and Abrahams2019). Aggregates of barronite crystals were gently crushed in acetone and deposited on a Cu-grid coated by a thin film of holey amorphous carbon. 3D ED data were collected with a FEI Tecnai G2 20 transmission electron microscope (TEM) (acceleration voltage of 200 kV, LaB6) equipped with a side-mounted hybrid single-electron detector ASI Cheetah M3, 512 × 512 pixels with high sensitivity and a fast readout. To preserve the hydrated structure of the mineral under the high vacuum in the TEM, the grid was plunged into liquid nitrogen and transferred to the TEM using a Gatan cryo-transfer holder. The PEDT (precession electron diffraction tomography) technique was chosen to reduce the dynamical effects further, using the precession device Nanomegas Digistar (Vincent and Midgley, Reference Vincent and Midgley1994) and a precession semi-angle of 1°. Data sets were all collected at 94 K on several single crystals in stepwise mode with the tilt step of the goniometer set to 1° on the accessible tilt range allowed by the preparation (Fig. 4a). To limit the beam-induced damage to the crystals, low illumination settings were used. 3D ED data reduction was performed using the computer program PETS2 (Palatinus et al., Reference Palatinus, Brázda, Jelínek, Hrdá, Steciuk and Klementová2019; Brázda et al., Reference Brázda, Klementová, Krysiak and Palatinus2022; Khouchen et al., Reference Khouchen, Klar, Chintakindi, Suresh and Palatinus2023). The structure analysis was performed from the best data set, associated with the lowest Rocking curve width and apparent mosaicity of the crystal (Fig. 4b). For each 3D ED data set, the data reduction yielded two hkl-type files. The first one assumes the kinematical approximation (for structure solution and the so-called kinematical refinement) with Rint(obs/all) = 0.1362/0.1451 and 76% coverage for sinθmax/λ = 0.8Å–1 (Laue class mmm). The second was for the dynamical refinement in which all frames of the data set were refined independently. The data coverage was limited due to the strong preferential orientation on the grid along [010]. The structure was solved assuming the kinematical approximation using Superflip (Palatinus and Chapuis, Reference Palatinus and Chapuis2007; Palatinus, Reference Palatinus2013) implemented in Jana2020 (Petříček et al., Reference Petříček, Palatinus, Plášil and Dušek2023). The refinement considering the dynamical theory of diffraction was carried out through DYNGO and Jana2020 (Palatinus et al., Reference Palatinus, Corrêa, Steciuk, Jacob, Roussel, Boullay, Klementová, Gemmi, Kopeček, Domeneghetti, Cámara and Petříček2015a, Reference Palatinus, Petříček and Correâ2015b). Based on the 3D ED data, the following monoclinic unit cell (at 94K) was obtained: a = 14.2115(11) Å, b = 14.0169(19) Å, c = 9.6545(8) Å, β = 111.59(6)°, with V = 1788.2(8) Å3 (Z = 4). A projection of the reciprocal space along [010] shows a two-fold axis twinning along (104), as was observed in the related structure of weeksite (Fejfarová et al., Reference Fejfarová, Plášil, Yang, Čejka, Dušek, Downs, Barkley and Škoda2012) (Fig. 5a). It is a typical example of twinning due to reticular merohedry (diffraction type II; Petříček et al., Reference Petříček, Dušek and Plášil2016). Sections through the reciprocal space indicated the space group C2/m, later confirmed by the structure analysis (Fig. 5b). The high quality of the 3D ED data collected on barronite is represented on the Rocking curve plot profile (Fig. 4b) with a sharply observed profile (blue on Fig. 4b), very low values for the Rocking curve width = 0.0011 Å–1 and the apparent mosaicity = 0.038° and high-angular resolution data. The structure was solved ab initio from a data set with 76% completeness up to the resolution of sin(θmax)/λ = 0.8 Å–1. The completeness is limited due to the [010] preferred orientation of the crystals on the grid and the incomplete rotation of the goniometer. The model was then refined using the dynamical theory of electron diffraction, which is necessary to reach fine structural details from 3D ED data. The two cationic sites in the cavity formed by the uranyl and silicon framework are assumed to be occupied by a mixture of Ba, Ca and K with a ratio set according to the chemical analysis. The overall occupancies of the two sites were refined with set ratios between cations. Partially occupied oxygen sites (OH and H2O) were added to the cavity during the refinement. The dynamical refinement converged towards R(obs)/wR(obs) = 0.0791/0.0811, R(all)/wR(all) = 0.1380/0.0864 for 6596/15684 observed/all reflections and 193 refined parameters. Those values are very satisfactory for electron diffraction data collected on inorganic material with heavy atoms and twinning present. Additional details about the parameters used in the refinement are given in Table 3. The distribution of (OH) and H2O over the O sites was deduced from the bond valence analysis. At this stage of development, the dynamical refinement of twinned 3D ED data still represents a challenge despite the data’s very high quality and resolution. In this work, it does not affect the model much. However, the Fourier-difference map (difference electrostatic potential map) remains uncertain, explaining why H atom positions could not be resolved. Positional parameters are presented in Table 4, interatomic distances in Table 5 and the bond-valence analysis in Table 6. The barronite structure is shown in Figs 6 and 7. The structure obtained from 3D ED is provided as a CIF in Supplementary materials and was deposited in the CCDC database under the deposition number 2417188.

Figure 4. (a) Needle-like single crystal of barronite selected for structure characterisation. The green circle represents the nanobeam size of ∼370 nm for collecting 3D ED data. (b) Plots of the rocking-curve profiles (Camel plot) of the experimental 3D ED data at 94 K. The lowest blue curve is the averaged observed rocking curve in the range of 0.2 to 0.3 Å−1 and the next ones are obtained by steps of 0.1 Å−1. The red curves are the calculated ones from the Rocking curve width = 0.0011 Å–1, apparent mosaicity = 0.0382°, and precession semi-angle = 1 °. Reflections are involved in the Camel plot for I > 10*σ(I).

Figure 5. Reciprocal space sections reconstructed from 3D ED data collected on a barronite single crystal at 94 K. (a) the outline of the unit cells of barronite (red and black = monoclinic cells related by twinning; green = orthorhombic super-cell); the size of the spots (diffractions) is related to their observed intensities obtained from 3D ED. (b) Precession-like reconstructions of different hkl-slices.

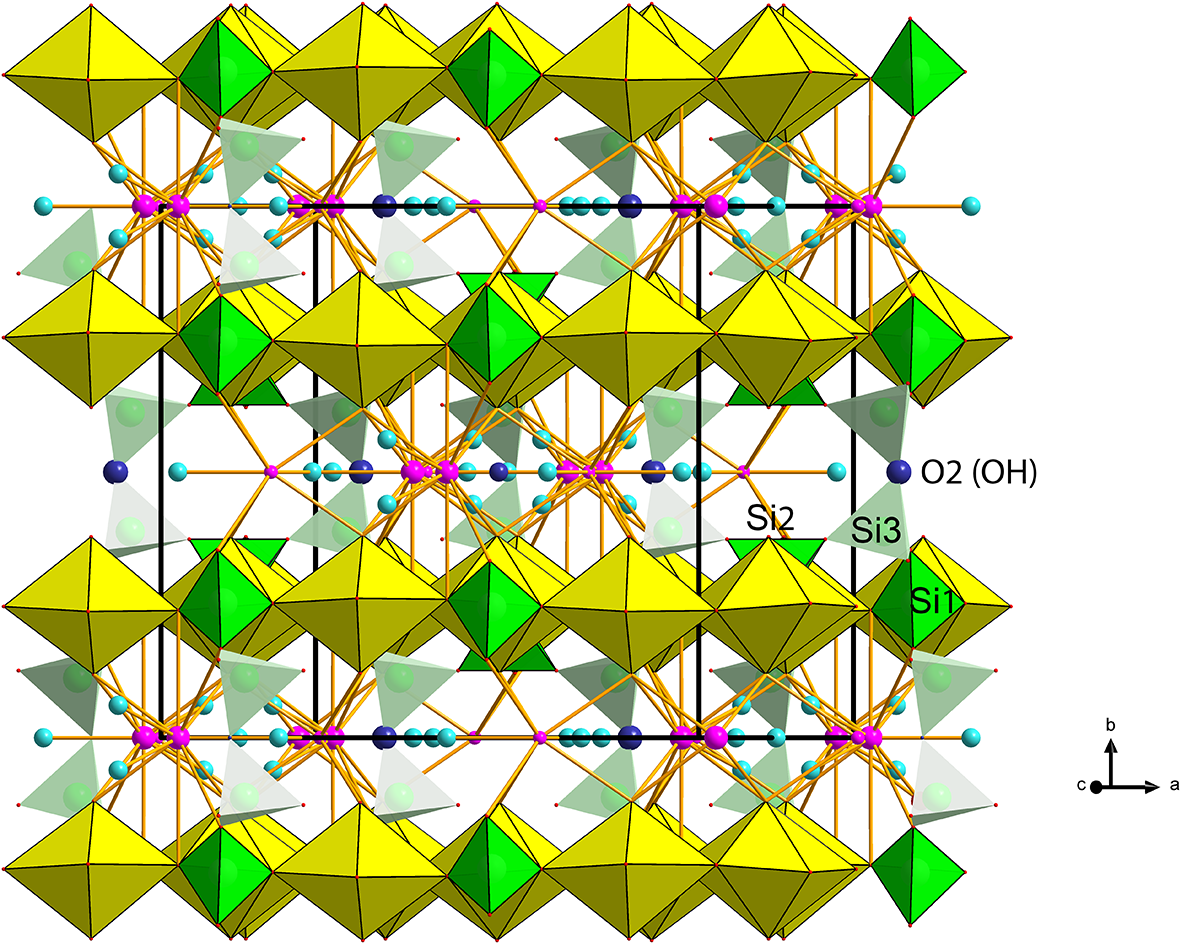
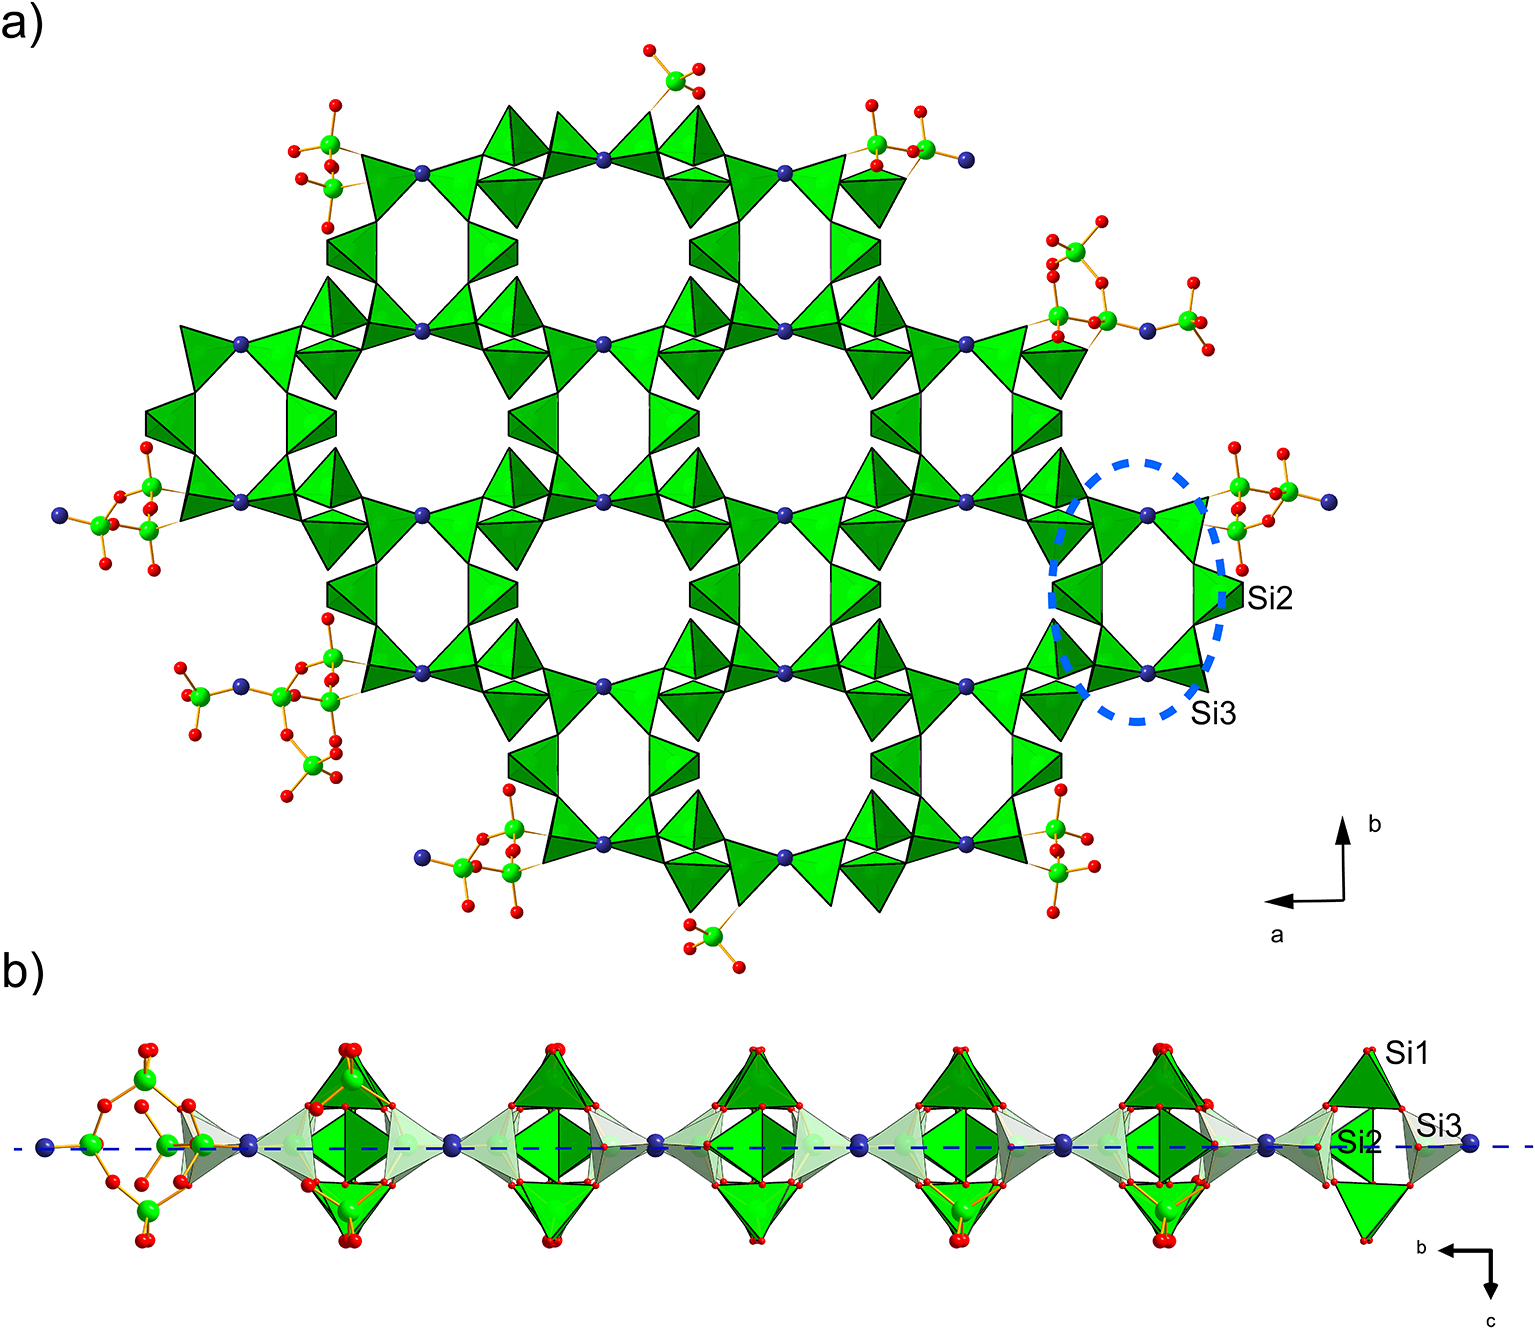
Figure 6. Polyhedral representation of the crystal structure of barronite. The UO7 bipyramids are in yellow, Si-tetrahedra in green, Ba-sites in purple, H2O in light blue, and the O2 atom of the (OH)– in an indigo colour. Unit-cell edges are outlined in solid black lines.

Figure 7. Infinite sheet of Si-tetrahedra (green), composed of six-membered rings (blue dashed line) of vertex-sharing (O2 atom = OH, in indigo colour) Si3 and 2×Si2 tetrahedra (a), while Si1 tetrahedra are staggered ‘out-of-the plane’ (indicated by long dashed blue line) of those rings (b). The smaller 6-membered rings host only H2O, while larger rings belong to the cavities with alkaline earth and alkali cations in the weeksite-type structures.
Table 3. Summary of data collection conditions and refinement parameters for barronite

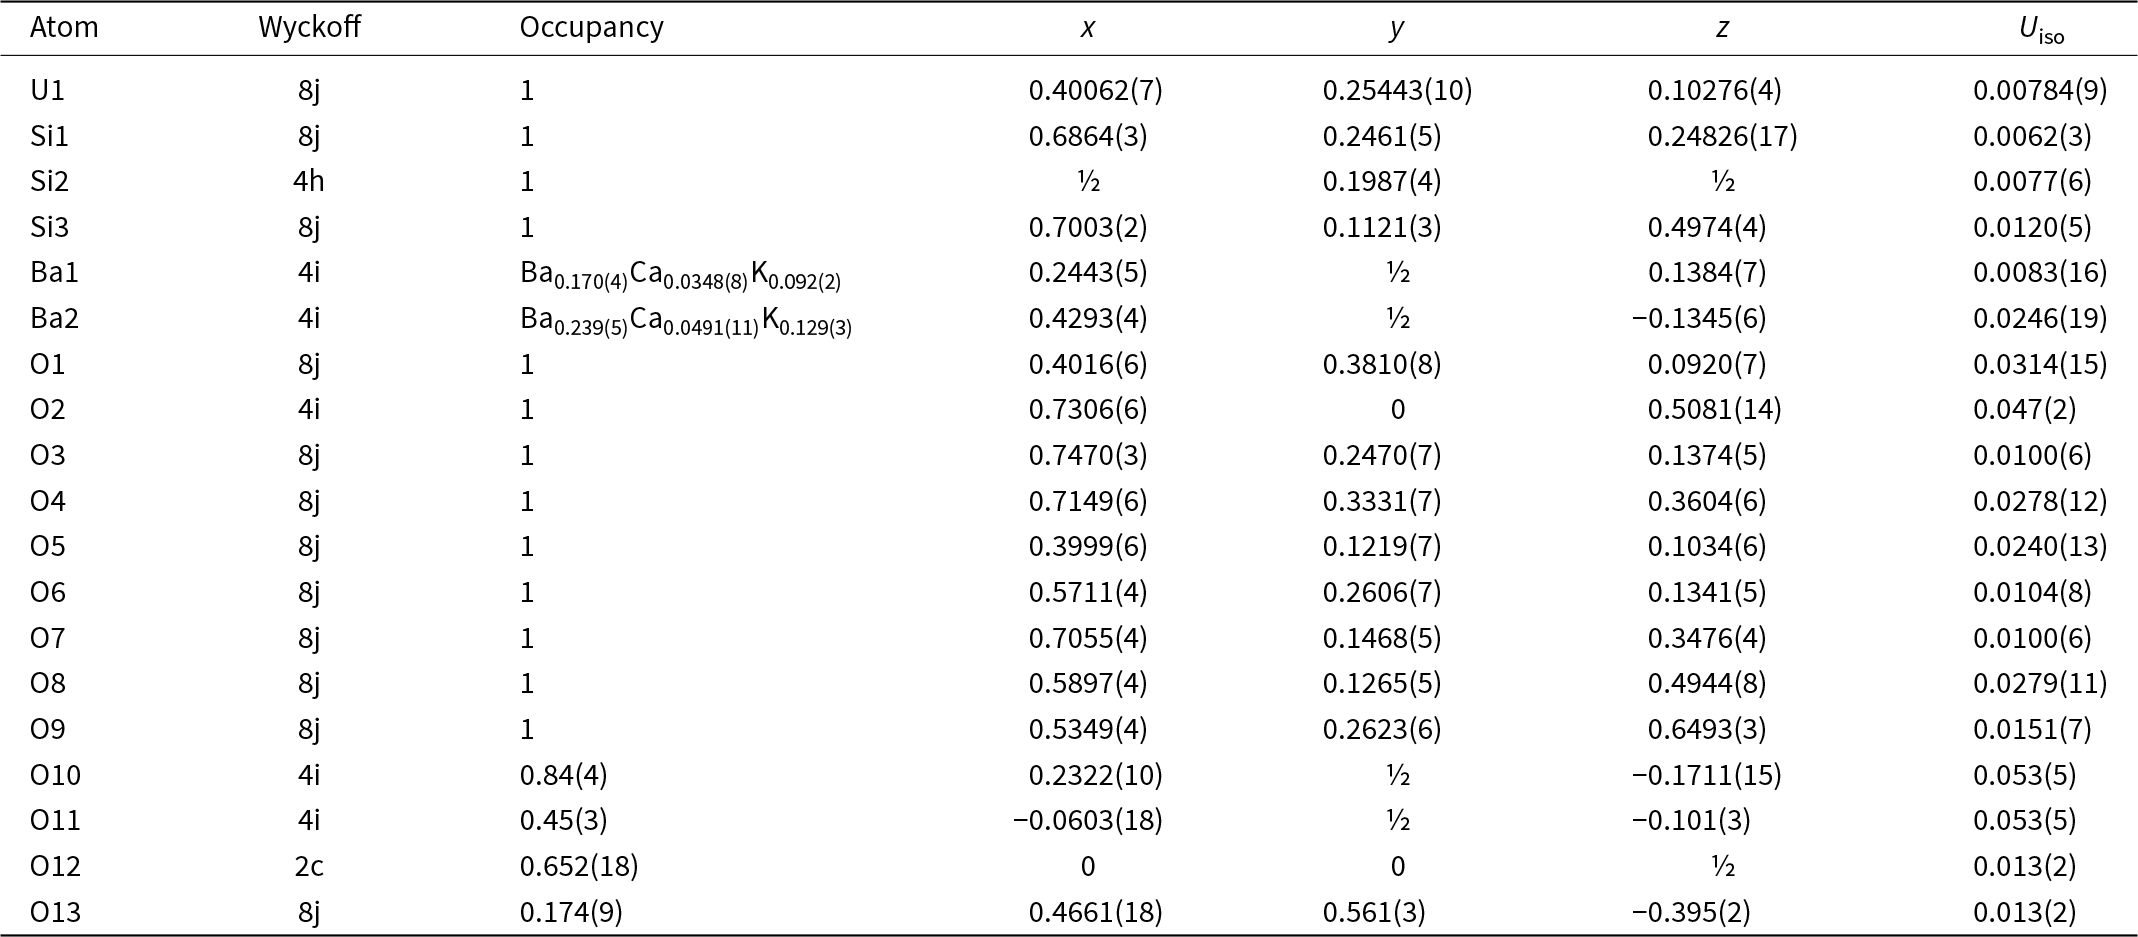
Table 4. Atom positions and isotropic displacement parameters (in Å2) for barronite

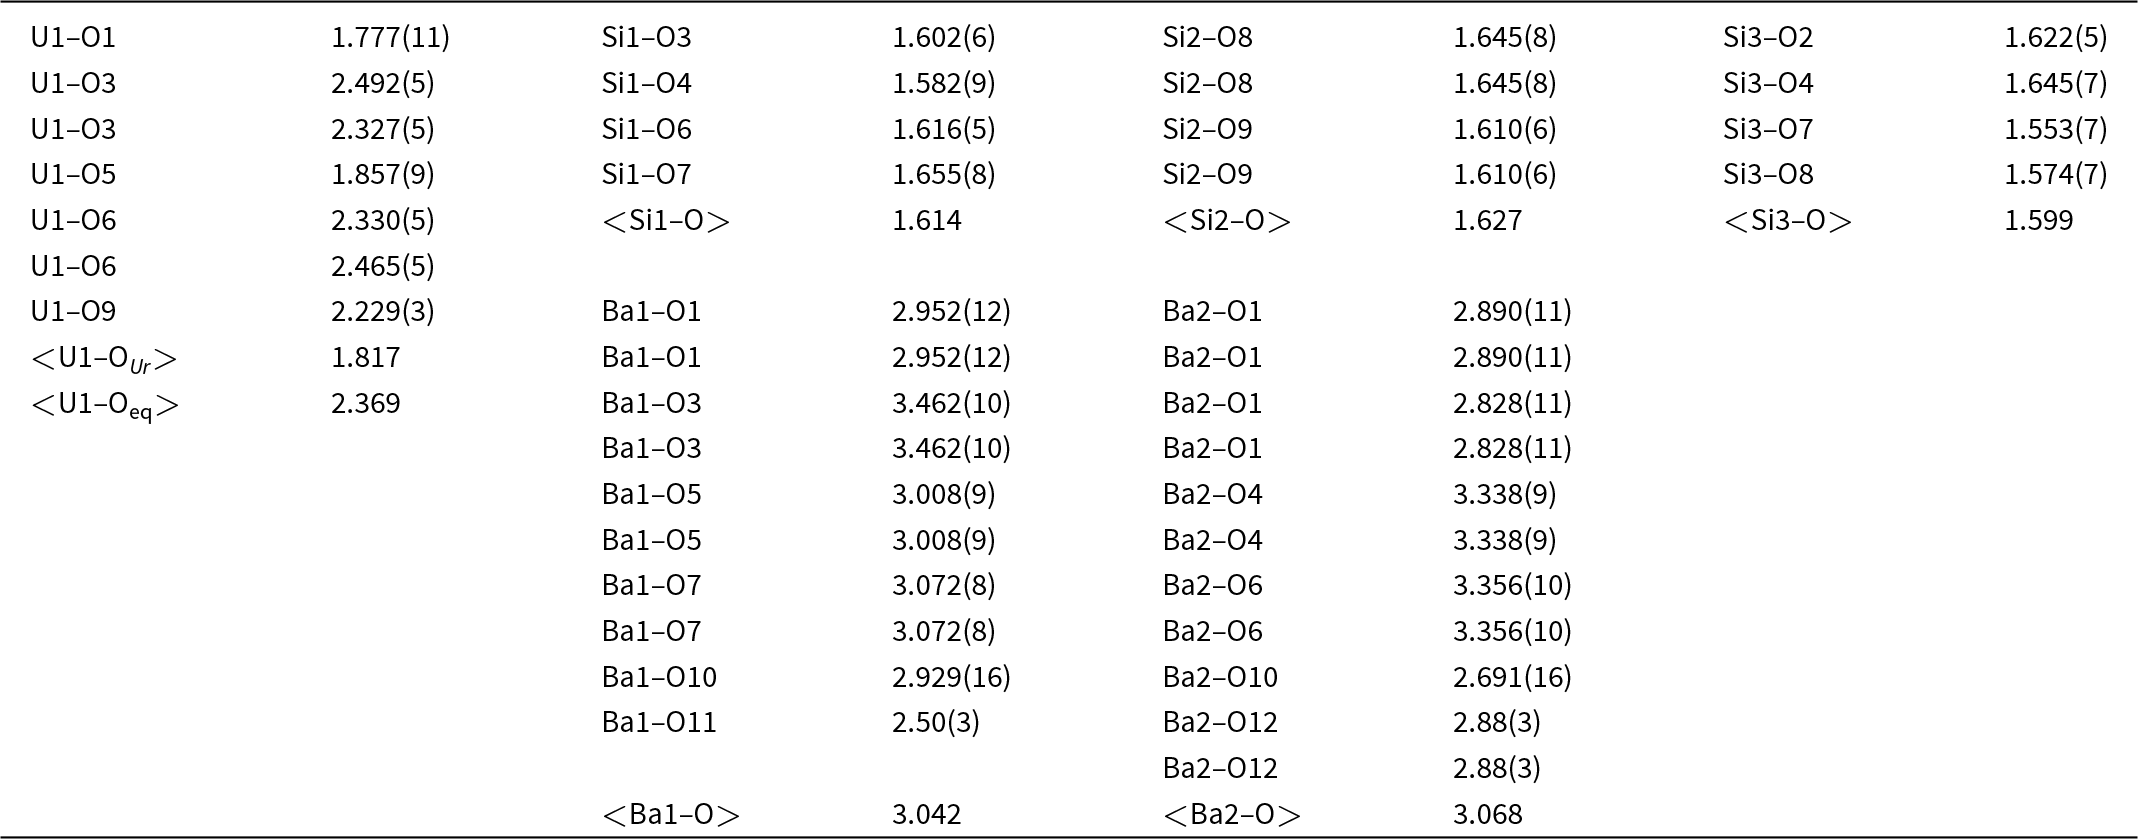
Table 5. Selected interatomic distances (in Å) in barronite

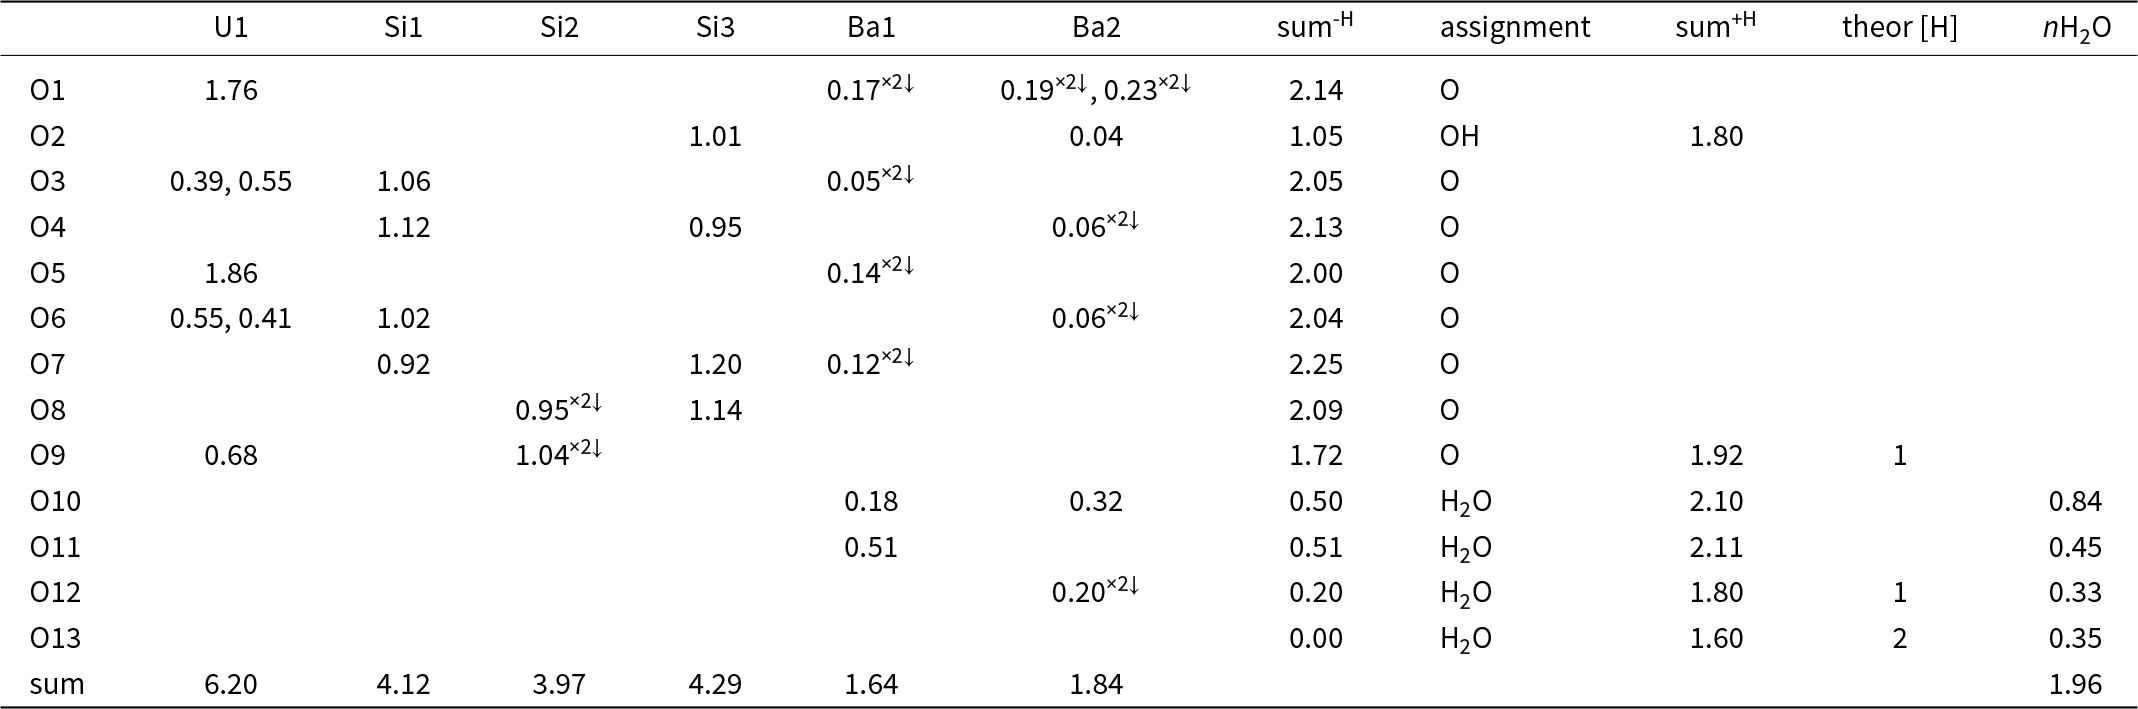
Table 6. Bond-valence analysis of the barronite structure (in valence units, vu)

Notes: Bond-valence parameters are from Gagné and Hawthorne (Reference Gagné and Hawthorne2015). sum-H – the sum of the BV without the contribution of the H-bonds; sum+H – the sum of the BV including assumed H-bonds (considering the theoretical H-bond strength of 0.8 vu for the D–H bond; after Brown, Reference Brown2002); theor [H] – theoretical number of additional weak H-bonds that the O atom could accept (considering the theoretical H-bond strength of 0.2 vu for the H–A bond; after Brown, Reference Brown2002); nH2O – number of H2O molecules/cell, considering site-multiplicities and Z = 4. Site occupancies at the Ba1 and Ba2 sites were not taken into consideration.
Description of the barronite crystal structure
In the structure of barronite, there are one U site, three Si sites, two M sites (occupied dominantly by Ba, less by K and Ca), and thirteen O sites; of the O sites, one is (OH)– and four are H2O. The U atom is strongly bonded (at ∼1.8 Å) to two O atoms (O1, O5), forming a uranyl ion, (UO2)2+. This moiety is further coordinated by five O ligands in the equatorial plane, thus forming a uranyl pentagonal bipyramid (UPB) (Table 5); this is the most frequent coordination of hexavalent uranium in the solid state (Lussier et al., Reference Lussier, Lopez and Burns2016). UPBs share equatorial edges to form chains parallel to [100], which share edges with (Si1)O4 tetrahedra. The remaining (‘free’) vertex of the uranyl pentagonal bipyramid is then linked to a (Si2)O4 tetrahedron. The uranyl silicate chains are linked to crankshaft-like chains of vertex-sharing SiO4 tetrahedra, resulting in layers connected through vertex-sharing between Si(3)O3(OH) tetrahedra to form an open framework. In the channels of this framework structure, two independent M sites are occupied dominantly by divalent (Ba2+, Ca2+) and monovalent cations (K+). Three O sites hosted by H2O (based on bond-valence analysis, Table 6) are bonded to M sites, whereas one is only weakly bonded in the channels. The two most important differences between the barronite and weeksite structure are that, in barronite (1) the dominant cation in the channels is Ba2+ and (2) a shared vertex between two neighbouring (symmetrically related) Si3 tetrahedra is protonated, forming a SiO3OH group. The protonation of the silicate tetrahedron is apparent from the bond-valence analysis (Table 6). The structural formula obtained from the results of the refinement and the bond-valence considerations is (Ba0.41K0.22Ca0.08)Σ0.71Σcharge = 1.2+(UO2)2Si5O12(OH)·1.96H2O (Z = 4). This formula has a 0.2 charge excess; however, note that the cation content in the Ba sites can suffer from a small inaccuracy due to the twinned data, the multiple substitutions on the Ba sites, and possible nano compositional variations as compared with the microprobe analysis. Moreover, the O↔OH substitution at O2Si3 (Table 6) provides another charge-balancing mechanism. Molecular water content might also be somewhat variable, depending on the amount of metal cations distributed over the sites in the channels.
Structural complexity of barronite
The structural complexity of barronite was determined as the Shannon information content per atom (I G) and per unit cell (I G,total). This approach was developed by Krivovichev (Reference Krivovichev2012, Reference Krivovichev2013, Reference Krivovichev2014, Reference Krivovichev2016, Reference Krivovichev2017): the complexity of a crystal structure can be quantitatively characterised by the amount of Shannon information, which is measured in bits (binary digits) per atom (bits/atom) and per unit cell (bits/cell), respectively. The concept of Shannon information, also known as Shannon entropy, used herein originates from information theory. The amount of Shannon information reflects the diversity and relative proportion of different objects, e.g. the number and relative proportion of different sites in an elementary unit cell of a crystal structure. The information-based structural complexity values were calculated using the software package TOPOS (Blatov et al., Reference Blatov, Shevchenko and Proserpio2014). The chemical complexity (after Siidra et al., Reference Siidra, Zenko and Krivovichev2014) is estimated by considering the chemical formula as a message, where symbols correspond to different chemical elements.
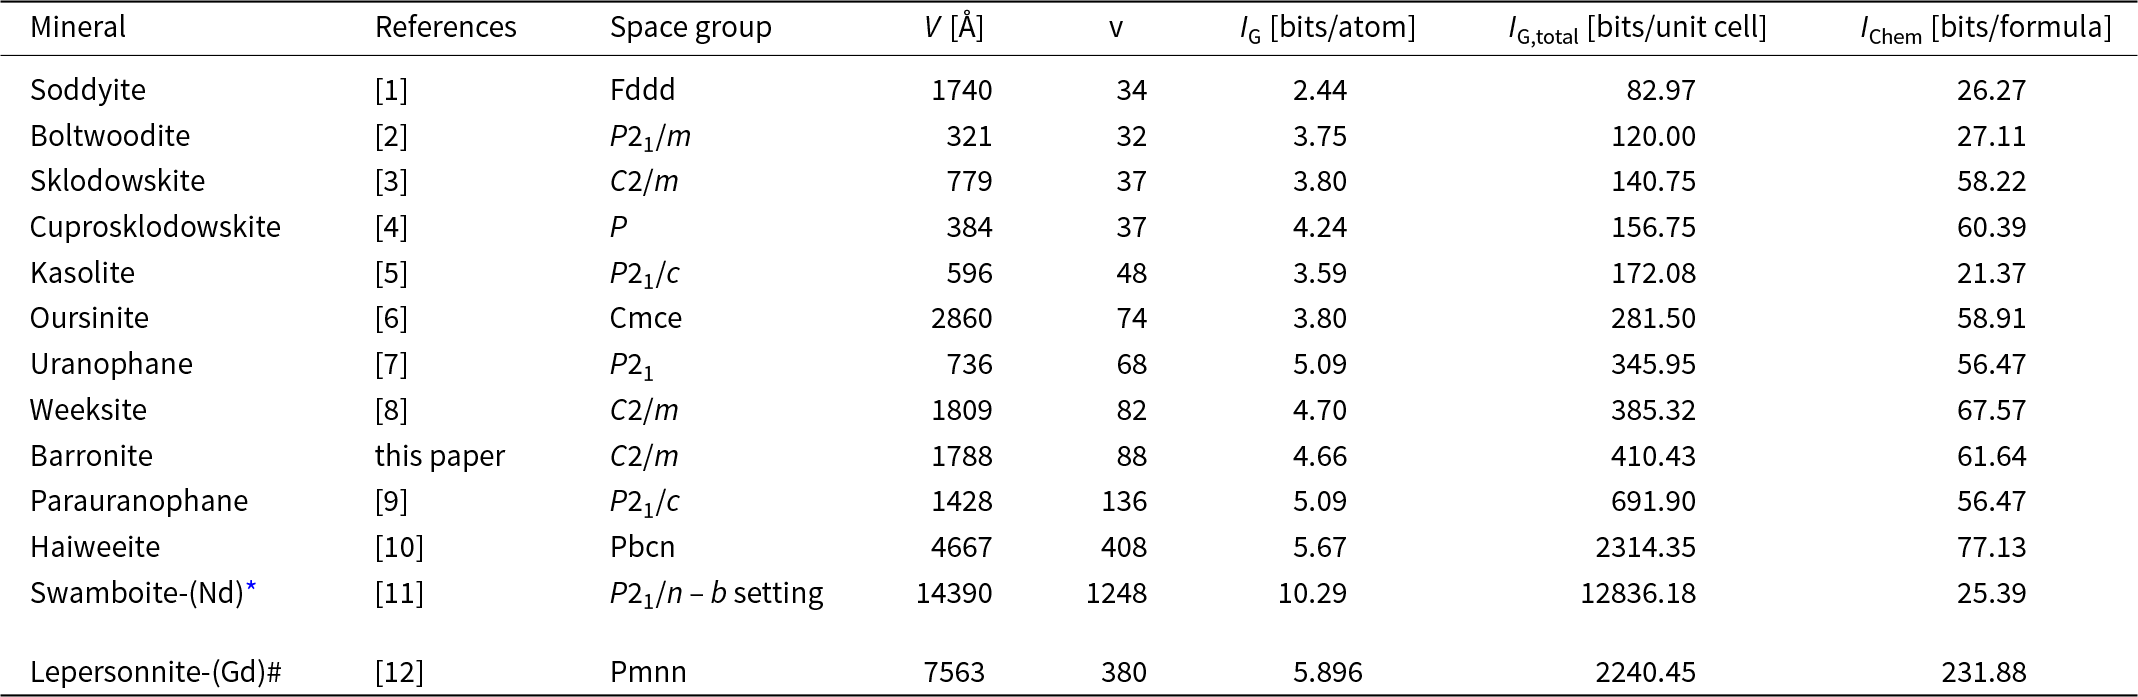
Calculated values for the structural complexity of barronite in comparison with other uranyl silicate minerals are reported in Table 7. Barronite, with a complexity of 410.4 bits/unit-cell, belongs to the intermediate–complex structures (following the classification of Krivovichev, Reference Krivovichev2013), and is very similar in those measures to then structurally similar weeksite, but it is of a smaller magnitude due to the lower H2O content in barronite.
Table 7. Uranyl silicate minerals and their complexity measures including H atoms

References: [1] – Demartin et al. (Reference Demartin, Gramaccioli and Pilati1992), [2] – Burns (Reference Burns1998), [3] – Ryan and Rosenzweig (Reference Ryan and Rosenzweig1977), [4] – Rosenzweig and Ryan (Reference Rosenzweig and Ryan1975), [5] – Fejfarová et al. (Reference Fejfarová, Dušek, Plášil, Čejka, Sejkora and Škoda2013), [6] – Kubatko and Burns (Reference Kubatko and Burns2006), [7] – Ginderow (Reference Ginderow1988), [8] – Fejfarová et al. (Reference Fejfarová, Plášil, Yang, Čejka, Dušek, Downs, Barkley and Škoda2012), [9] – Viswanathan and Harneit (Reference Viswanathan and Harneit1986), [10] – Plášil et al. (Reference Plášil, Fejfarová, Čejka, Dušek, Škoda and Sejkora2013), [11] – Plášil et al. (Reference Plášil, Petříček, Locock, Škoda and Burns2018), [12] – Plášil et al. (Reference Plášil, Steciuk, Sejkora, Kampf, Uher, Ondrejka, Škoda, Dolníček, Philippo, Guennou, Meisser, Rohlíček and Mees2025).
* – referring to the superstructure (commensurate modulation); the space group transformed into a standard setting via matrix (–0.5, 0, –0.5| 0, –1, 0| –0.5, 2, 0.5)
# – updated formula of lepersonnite-(Gd), which is a carbonate-silicate, is [Ca0.5Gd0.5(H2O)18(OH)1.5][Gd(UO2)12(SiO3OH)2(CO3)4(OH)10O2(H2O
Discussion
The content of molecular water in the weeksite-type structures
Based on the results of the crystal structure refinement from 3D ED data, barronite contains ∼2 H2O (1.965) in the channels of its microporous structure. It is straightforward to compare this value with previous results of the structure studies on both natural weeksite (Fejfarová et al., Reference Fejfarová, Plášil, Yang, Čejka, Dušek, Downs, Barkley and Škoda2012) and synthetic analogues (Nazarchuk et al., Reference Nazarchuk, Tagirova, Siidra, Charkin, Dmitriev, Kalmykov, Kasatkin and Plášil2025). The natural weeksite specimen studied by Fejfarová et al. (Reference Fejfarová, Plášil, Yang, Čejka, Dušek, Downs, Barkley and Škoda2012) provided enough pure material that allowed a thermogravimetric study. The observed mass loss up to ∼660°C was ∼6.7 wt.% which corresponds quite well with the content of 4 H2O in the structure of natural weeksite. Recently, Nazarchuk et al. (Reference Nazarchuk, Tagirova, Siidra, Charkin, Dmitriev, Kalmykov, Kasatkin and Plášil2025) reported on new structure data for natural weeksite, its synthetic counterpart (K-dominant) and isotypic Rb- and Cs-dominant synthetic phases. Unfortunately, the direct determination of the H2O content was not possible. We can comment on the values obtained from the crystal structure refinements only. The refinements of all phases were affected by the nature and behaviour of the H2O in weeksite-type channels. It is, up to a significant extent, ‘zeolitic’. The H2O content in the synthetic weeksite was deduced to be less than observed in the natural weeksite, of ∼2.5 H2O. In the Rb and Cs analogues, they inferred content of 2.34 and 2.20 H2O atoms per formula unit (apfu), which is in line with the presence of cations with larger ionic radii than K: [8]Rb+ = 1.667 Å, [8]Cs+ = 1.878 Å vs. [8]K = 1.495 Å (Hawthorne and Gagné, Reference Hawthorne and O.C2024). From the point of view of a clear relationship between the size of the cations hosted within cavities and decreasing H2O content while keeping the size of the channels/cavities unchanged (or to a lower extent), the H2O content found by the current study in barronite, is striking. Divalent barium is much smaller ([7] = 1.427 Å and [8] = 1.450 Å) than Rb and Cs and one would await a higher amount of H2O bonded in the structure. The unit-cell volume obtained for barronite at 298 K is very similar to those of natural weeksite. The volume obtained at the low temperatures from the 3D ED data, ∼1788 Å3, is much more convincing for the presence of much smaller cations in the channels. If it is just a relic of the methodology (TEM analysis in the high vacuum under the electron beam and the real water content of H2O in barronite is somewhat higher), or if it is caused by something else, we cannot reliably decide without further studies.
The presence of Ba2+ atoms in the weeksite-type structures – implications
Barronite is the first known mineral, or synthetic phase, of weeksite-type structures that contains divalent cations of alkaline earth metals. Previous studies on weeksite (Jackson and Burns, Reference Jackson and Burns2001; Fejfarová et al., Reference Fejfarová, Plášil, Yang, Čejka, Dušek, Downs, Barkley and Škoda2012) have reported that it can contain certain amounts of barium, with up to 3.7 wt.% BaO. Weeksite-type structures are also probably capable of hosting strontium, which has a smaller ionic radius compared to barium in the currently investigated structure of barronite. According to Hawthorne and Gagné (Reference Hawthorne and O.C2024), the ionic radius of Sr2⁺ is [7] = 1.273 Å and [8] = 1.292 Å, whereas for Ba2⁺ it is [7] = 1.427 Å and [8] = 1.450 Å. Additionally, potassium, which is primarily found in weeksite (Fejfarová et al., Reference Fejfarová, Plášil, Yang, Čejka, Dušek, Downs, Barkley and Škoda2012), has an ionic radius of [7] = 1.495 Å and [8] = 1.528 Å. We conclude that microporous framework structures of the weeksite type could be effective for immobilising the fission product radionuclide strontium-90 (90Sr). This particular isotope is significant within spent nuclear fuel due to its high activity, though it has a relatively short half-life of ∼30 years (Ewing, Reference Ewing2015), making it less relevant for long-term nuclear fuel storage. However, barronite and weeksite-type phases may still be important when considering the possible interactions between nuclear fuel and water solutions that contain dissolved silicon in the early stages of the temporary disposal.
Supplementary material
The supplementary material for this article can be found at https://doi.org/10.1180/mgm.2025.10081.
Acknowledgements
The helpful and constructive edits of Anthony Kampf, Oleg Siidra and Peter Leverett are greatly appreciated.
Financial statement
This study was supported by the CzechNanoLab Research Infrastructure supported by MEYS CR (LM2023051) (JP). Additionally, we acknowledge the support by the Ministry of Culture of the Czech Republic (long-term project DKRVO 2024–2028/1.II.b; National Museum, 00023272) for JS and ZD and OP VVV project (Geobarr CZ.02.1.01/0.0/0.0/16_026/0008459) to RS.
Competing interests
The authors declare none.