


1. Introduction
Plasma-activated water (PAW) is an innovative technology that has attracted growing interest in recent years due to its distinctive properties and potential applications in a variety of fields. As an emerging and advanced technology, cold plasma has recently attracted the attention of researchers for its use in medical treatment (Kim & Kim 2021), wastewater treatment (Wang et al. 2018), seed germination, microbial deactivation (Liao et al. 2017; Xu et al. Reference Xu, Garner, Tao and Keener2017; Jangra et al. Reference Meropoulis and Aggelopoulos2023), plant growth (Sivachandiran & Khacef 2017; Adhikari et al. 2020; Pańka et al. Reference Rathore, Tiwari and Nema2022; Priatama et al. 2022; Rathore et al. 2022) and food processing (Thirumdas et al. 2015; Perinban et al. 2019; Laroque et al. Reference Saber, Abahazem, Merbahi and Yousfi2022; Birania et al. 2022; Farooq et al. 2023).
The PAW production triggers many chemical reactions and generates reactive oxygen and nitrogen species, which are neither toxic nor contaminants for the environment (Lin et al. Reference Saber, Guedah, Abahazem, Merbahi and Yousfi2020). In agriculture, PAWs have been explored for their potential to stimulate crop growth, enhance disease resistance and treat plant pathogens (El-Reda et al. 2024). In addition, PAWs have been shown to be effective in environmental applications such as pollutant removal and wastewater treatment (Meropoulis & Aggelopoulos Reference Yang, Zhang, Li and Cheng2023). In biomedicine, PAWs have been studied for their antimicrobial properties against drug-resistant bacteria, viruses and fungi. They have also been shown to have potential in wound healing, reducing inflammation and as an anti-cancer therapy (Graves 2014; Keidar et al. 2019; Schweigert et al. 2023). The physical and chemical properties of PAWs are key to their effectiveness in these various applications (Shen et al. 2016; Ikawa et al. 2016; Guragain et al. 2021; Wang & Salvi 2021; Rathore et al. 2022; Chou et al. 2023).
Plasma-activated water can be produced using a plasma device placed above or below the water surface. Several methods have been reported for generating PAW, including corona discharge (Hijosa-Valsero et al. 2013; Liu YaNan & Zhang Han 2018), dielectric barrier discharge (Wang et al. Reference Wang, Wang, Guo, Guo and Li2008; Sontti & Atta Reference Sontti and Atta2018) and microwave irradiation (Hirt & Nichols 1981). Corona discharge, the focus of this study, is an electrical phenomenon in which an intense electric field ionizes a gas, producing ions and free radicals that react with the surrounding molecules. This technique is used in various types of reactors, each with specific configurations adapted to particular applications, including water treatment. Among these reactors, those with a tip-plan configuration are distinguished by their tip-shaped electrode placed in front of a flat surface, creating a localized and very intense electric field. This field promotes the production of free radicals and ozone, which are particularly effective in water treatment.
The potential applications of PAW produced using air as the working gas have attracted a great interest in various fields. However, the limited understanding of the physical and chemical properties of PAW has limited the development of technologies exploiting this substance. While many studies have focused on the effects of cold plasma on the physical properties of water (total dissolved solids (TDS), conductivity), the energy efficiency of plasma treatment remains largely unexplored. Direct measurement of useful power is challenging due to the complexity of the plasma discharge and experimental conditions.
To address this, we developed an innovative approach by measuring the current and voltage during plasma treatment. These measurements were then used to solve the equivalent electrical circuit model of the corona discharge. This allowed us to calculate the useful power and energy efficiency of the process. The electrical model provided an accurate estimation of energy consumption, offering insights into the energy dynamics of the treatment process.
This analysis not only enables the monitoring and control of energy used during plasma treatment but also facilitates the optimization of operating conditions to improve energy efficiency.
2. Experimental apparatus
Figure 1 illustrates the experimental set-up for treating distilled water using plasma discharge. In this system, a high-voltage DC power supply, capable of generating voltages over $15\,\rm \,\rm kV$
, is connected to a pointed electrode used to generate the plasma. The distance
$15\,\rm \,\rm kV$
, is connected to a pointed electrode used to generate the plasma. The distance $d$
between the pointed electrode and the surface of the water to be treated can be adjusted using a gap adjustment device. A grounded electrode is placed in the water to complete the circuit.
$d$
between the pointed electrode and the surface of the water to be treated can be adjusted using a gap adjustment device. A grounded electrode is placed in the water to complete the circuit.

Figure 1. Experimental set-up.
The water to be treated is positioned under the pointed electrode, to ensure that the generated plasma is directed onto its surface. A $10\,{\rm M}\Omega$
resistor is connected in series with the power supply to limit the current, while the applied voltage
$10\,{\rm M}\Omega$
resistor is connected in series with the power supply to limit the current, while the applied voltage $V_{a}$
is measured using a high-voltage probe (Tektronix P6015A). The discharge current
$V_{a}$
is measured using a high-voltage probe (Tektronix P6015A). The discharge current $i_{d}$
is measured through a
$i_{d}$
is measured through a $50\,\Omega$
measuring resistor
$50\,\Omega$
measuring resistor $R_\textrm{mes}$
, which is connected between the immersed electrode and the power supply ground. This configuration enables the instantaneous discharge current to be displayed on a digital oscilloscope with a bandwidth of
$R_\textrm{mes}$
, which is connected between the immersed electrode and the power supply ground. This configuration enables the instantaneous discharge current to be displayed on a digital oscilloscope with a bandwidth of $100\,\rm MHz$
and a sampling rate of
$100\,\rm MHz$
and a sampling rate of $1\,\rm GHz$
.
$1\,\rm GHz$
.
This device enables precise control over the experimental conditions for plasma water treatment, particularly by adjusting the distance between the pointed electrode and the water surface to optimize plasma formation.
3. Results
3.1. Cold plasma treatment of distilled water
In this study, we treated a $20\,\rm mL$
volume of distilled water using a cold plasma based on corona discharge with a tip–plane configuration. During treatment, a voltage of
$20\,\rm mL$
volume of distilled water using a cold plasma based on corona discharge with a tip–plane configuration. During treatment, a voltage of $7.17\,\rm kV$
was applied with a distance of
$7.17\,\rm kV$
was applied with a distance of $2\,\rm mm$
between the tip and the water surface. The main objective was to study water properties such as TDS and conductivity in order to optimize the electrical parameters of our reactor.
$2\,\rm mm$
between the tip and the water surface. The main objective was to study water properties such as TDS and conductivity in order to optimize the electrical parameters of our reactor.
Figure 2 presents the evolution of conductivity (EC) for different exposure times, with a water volume of $20\,\rm mL$
, a distance between the tip and the water surface of
$20\,\rm mL$
, a distance between the tip and the water surface of $2\,\rm mm$
and an applied voltage of
$2\,\rm mm$
and an applied voltage of $7.17\,\rm kV$
. At each exposure time, the conductivity increases due to the elevated production of reactive oxygen species and reactive nitrogen species in distilled water. These active species, such as ozone (O3), superoxide ion (O-), atomic oxygen (O) and hydroxyl radical (OH·), are generated when the applied electric field ionizes the ambient air and distilled water. These substances, unstable and highly oxidative, increase the ion concentration in the water, leading to an increase in electrical conductivity (Mahdikia et al. 2021; Wang & Salvi 2021; Chou et al. 2023; Yang et al. Reference Yang, Zhang, Li and Cheng2023; El-Reda et al. 2024).
$7.17\,\rm kV$
. At each exposure time, the conductivity increases due to the elevated production of reactive oxygen species and reactive nitrogen species in distilled water. These active species, such as ozone (O3), superoxide ion (O-), atomic oxygen (O) and hydroxyl radical (OH·), are generated when the applied electric field ionizes the ambient air and distilled water. These substances, unstable and highly oxidative, increase the ion concentration in the water, leading to an increase in electrical conductivity (Mahdikia et al. 2021; Wang & Salvi 2021; Chou et al. 2023; Yang et al. Reference Yang, Zhang, Li and Cheng2023; El-Reda et al. 2024).
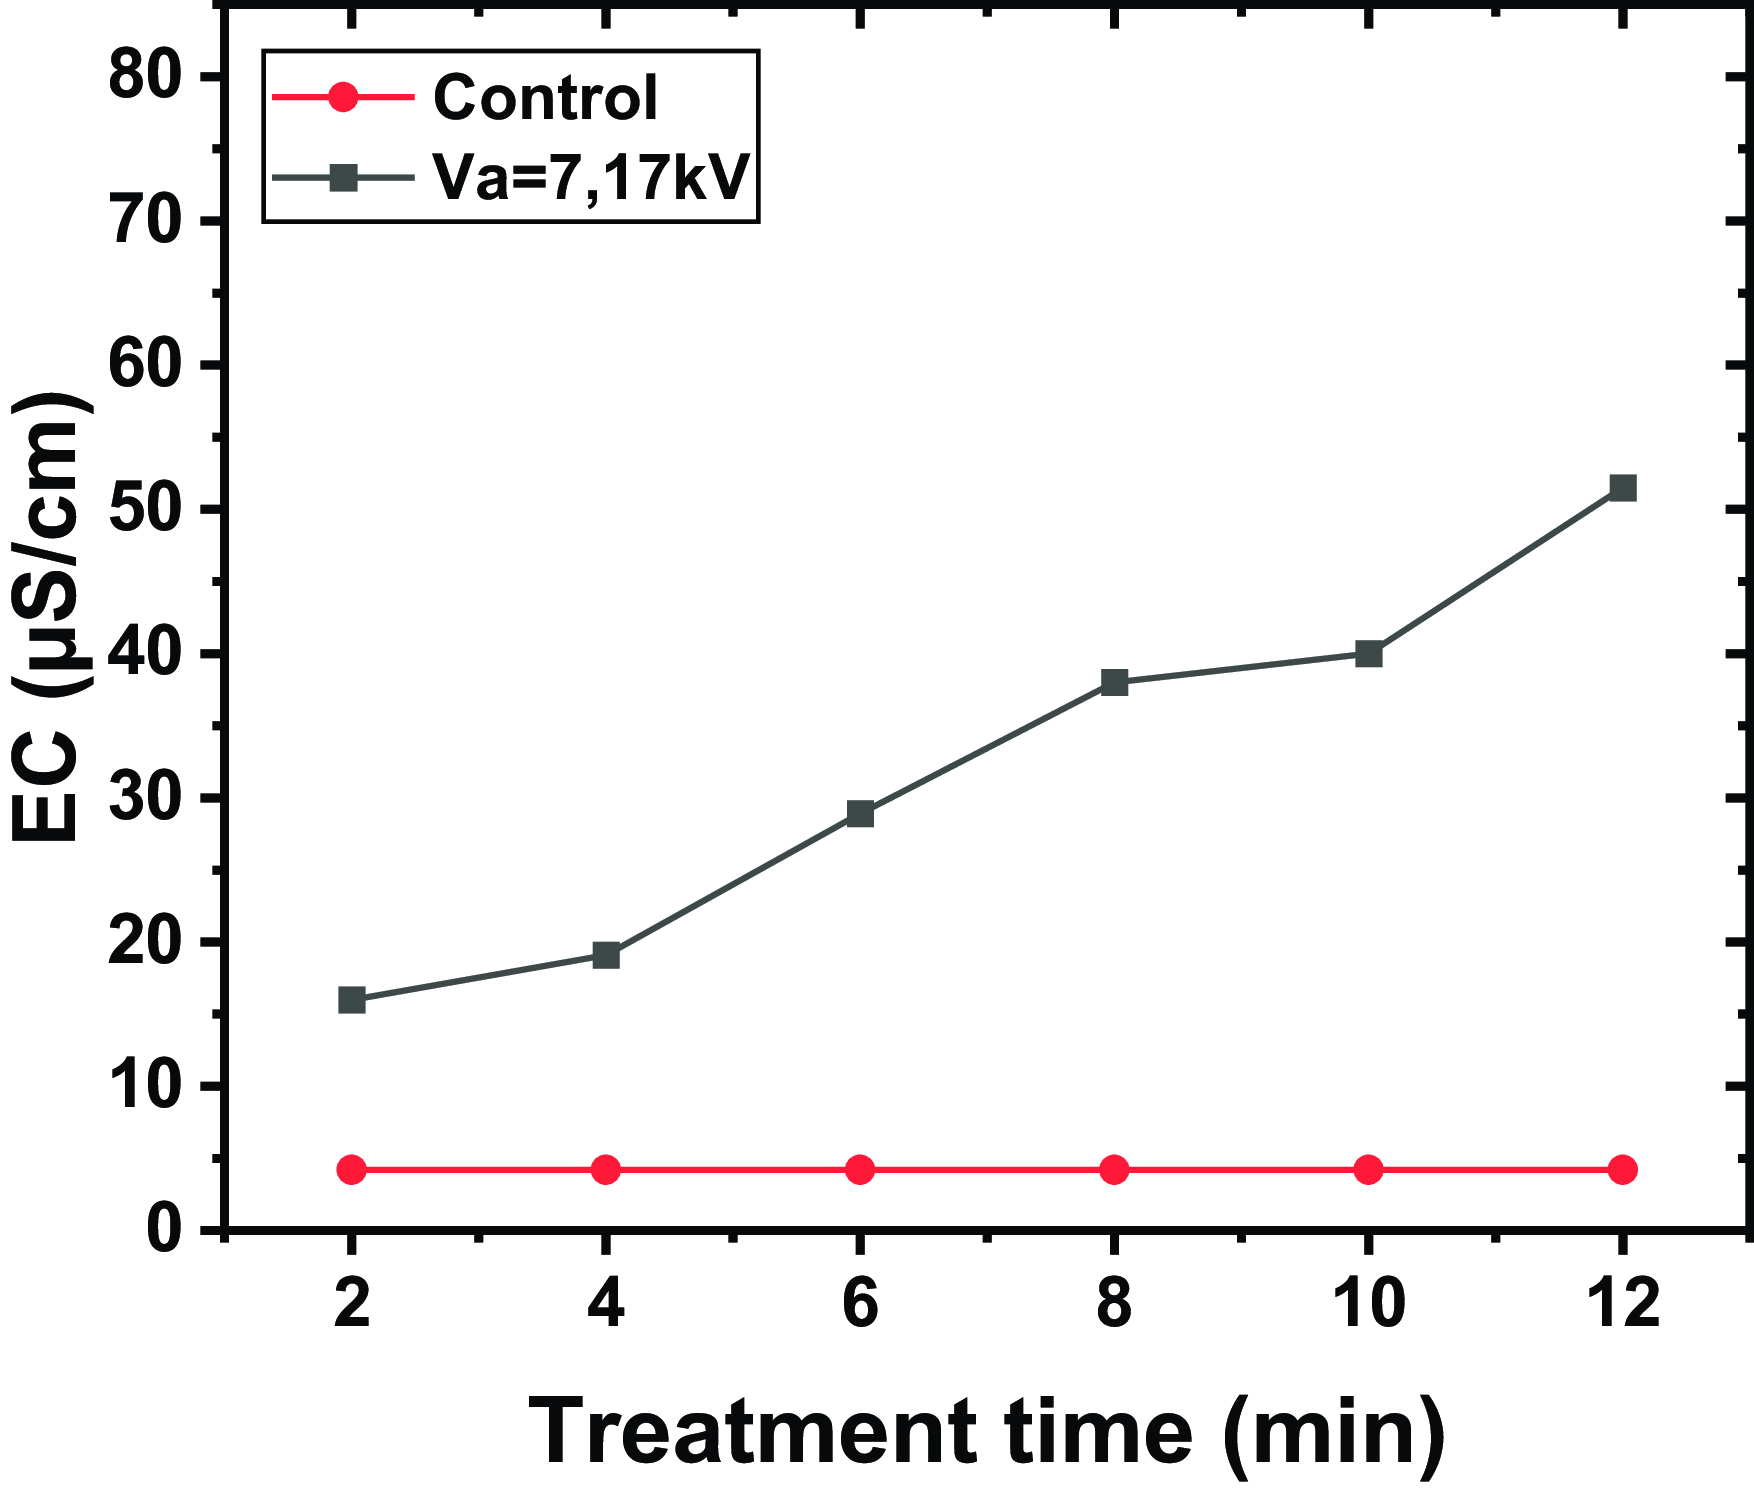
Figure 2. The EC for different exposure times, with a volume of water $V=20\,\rm mL$
, a distance between the tip and the water surface
$V=20\,\rm mL$
, a distance between the tip and the water surface $d=2\,\rm mm$
and an applied voltage
$d=2\,\rm mm$
and an applied voltage $V_{a}=7.17\,\rm kV$
.
$V_{a}=7.17\,\rm kV$
.
The increase in conductivity depends on the exposure time to plasma. For instance, after 2 min of exposure, the conductivity increases by 10 µS cm−1 compared with untreated water, while after 12 min, it increases by 45 µS cm−1. Prolonged plasma exposure generates a greater number of charges in the medium, thus enhancing the conductivity of the water. This highlights the crucial importance of the exposure time in the plasma treatment process to achieve the desired water properties.
Here TDS represents the combined content of all inorganic and organic substances dissolved in a liquid in molecular, ionized or microgranular form (Lukes et al. 2005; Bruggeman & Schram 2010; Locke & Shih 2011). In our study, distilled water, which initially has a very low TDS content due to the absence of minerals and impurities, shows a significant change in this parameter when subjected to plasma treatment. The introduction of new ionic species into the liquid leads to a progressive increase in TDS.
Figure 3 illustrates the evolution of TDS for different exposure durations, with a water volume of $20\,\rm mL$
, a distance between the tip and water surface of
$20\,\rm mL$
, a distance between the tip and water surface of $2\,\rm mm$
and an applied voltage of
$2\,\rm mm$
and an applied voltage of $7.17\,\rm kV$
. The results indicate a marked increase in TDS with plasma exposure time compared with untreated water (control). This rise is attributed to the formation and dissolution of ionic species generated by the plasma, including H+, NO3−1; and other derivatives of reactive oxygen species and reactive nitrogen species. These species, formed by the ionization of water and surrounding gases, interact with the liquid phase, thus increasing the concentration of dissolved ions.
$7.17\,\rm kV$
. The results indicate a marked increase in TDS with plasma exposure time compared with untreated water (control). This rise is attributed to the formation and dissolution of ionic species generated by the plasma, including H+, NO3−1; and other derivatives of reactive oxygen species and reactive nitrogen species. These species, formed by the ionization of water and surrounding gases, interact with the liquid phase, thus increasing the concentration of dissolved ions.
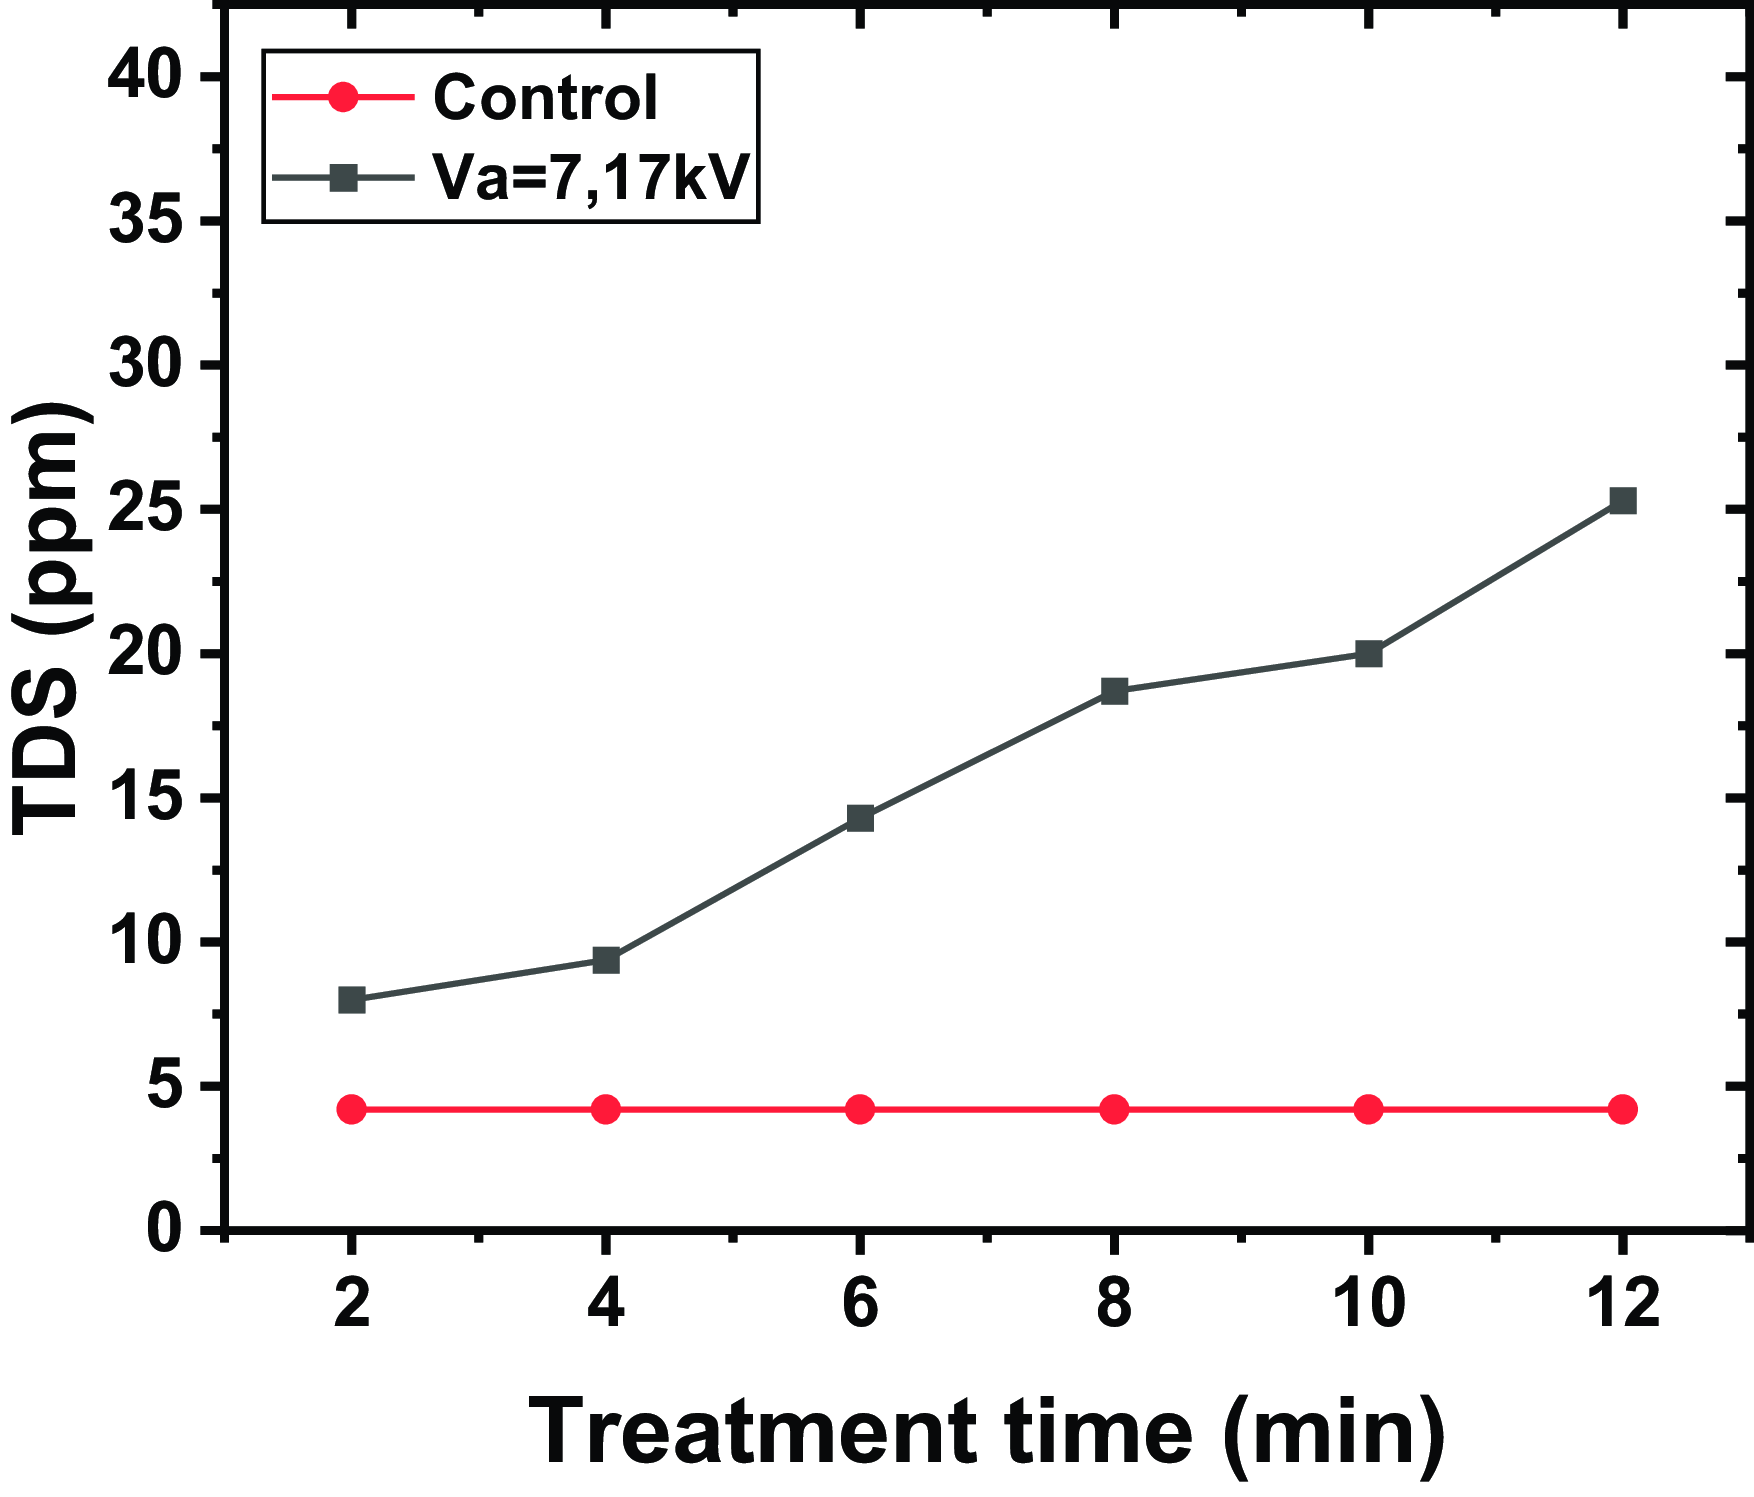
Figure 3. Evolution of TDS for different exposure durations, with a water volume of $20\,\rm mL$
, a distance between the tip and water surface of
$20\,\rm mL$
, a distance between the tip and water surface of $2\,\rm mm$
and an applied voltage of
$2\,\rm mm$
and an applied voltage of $7.17\,\rm kV$
.
$7.17\,\rm kV$
.
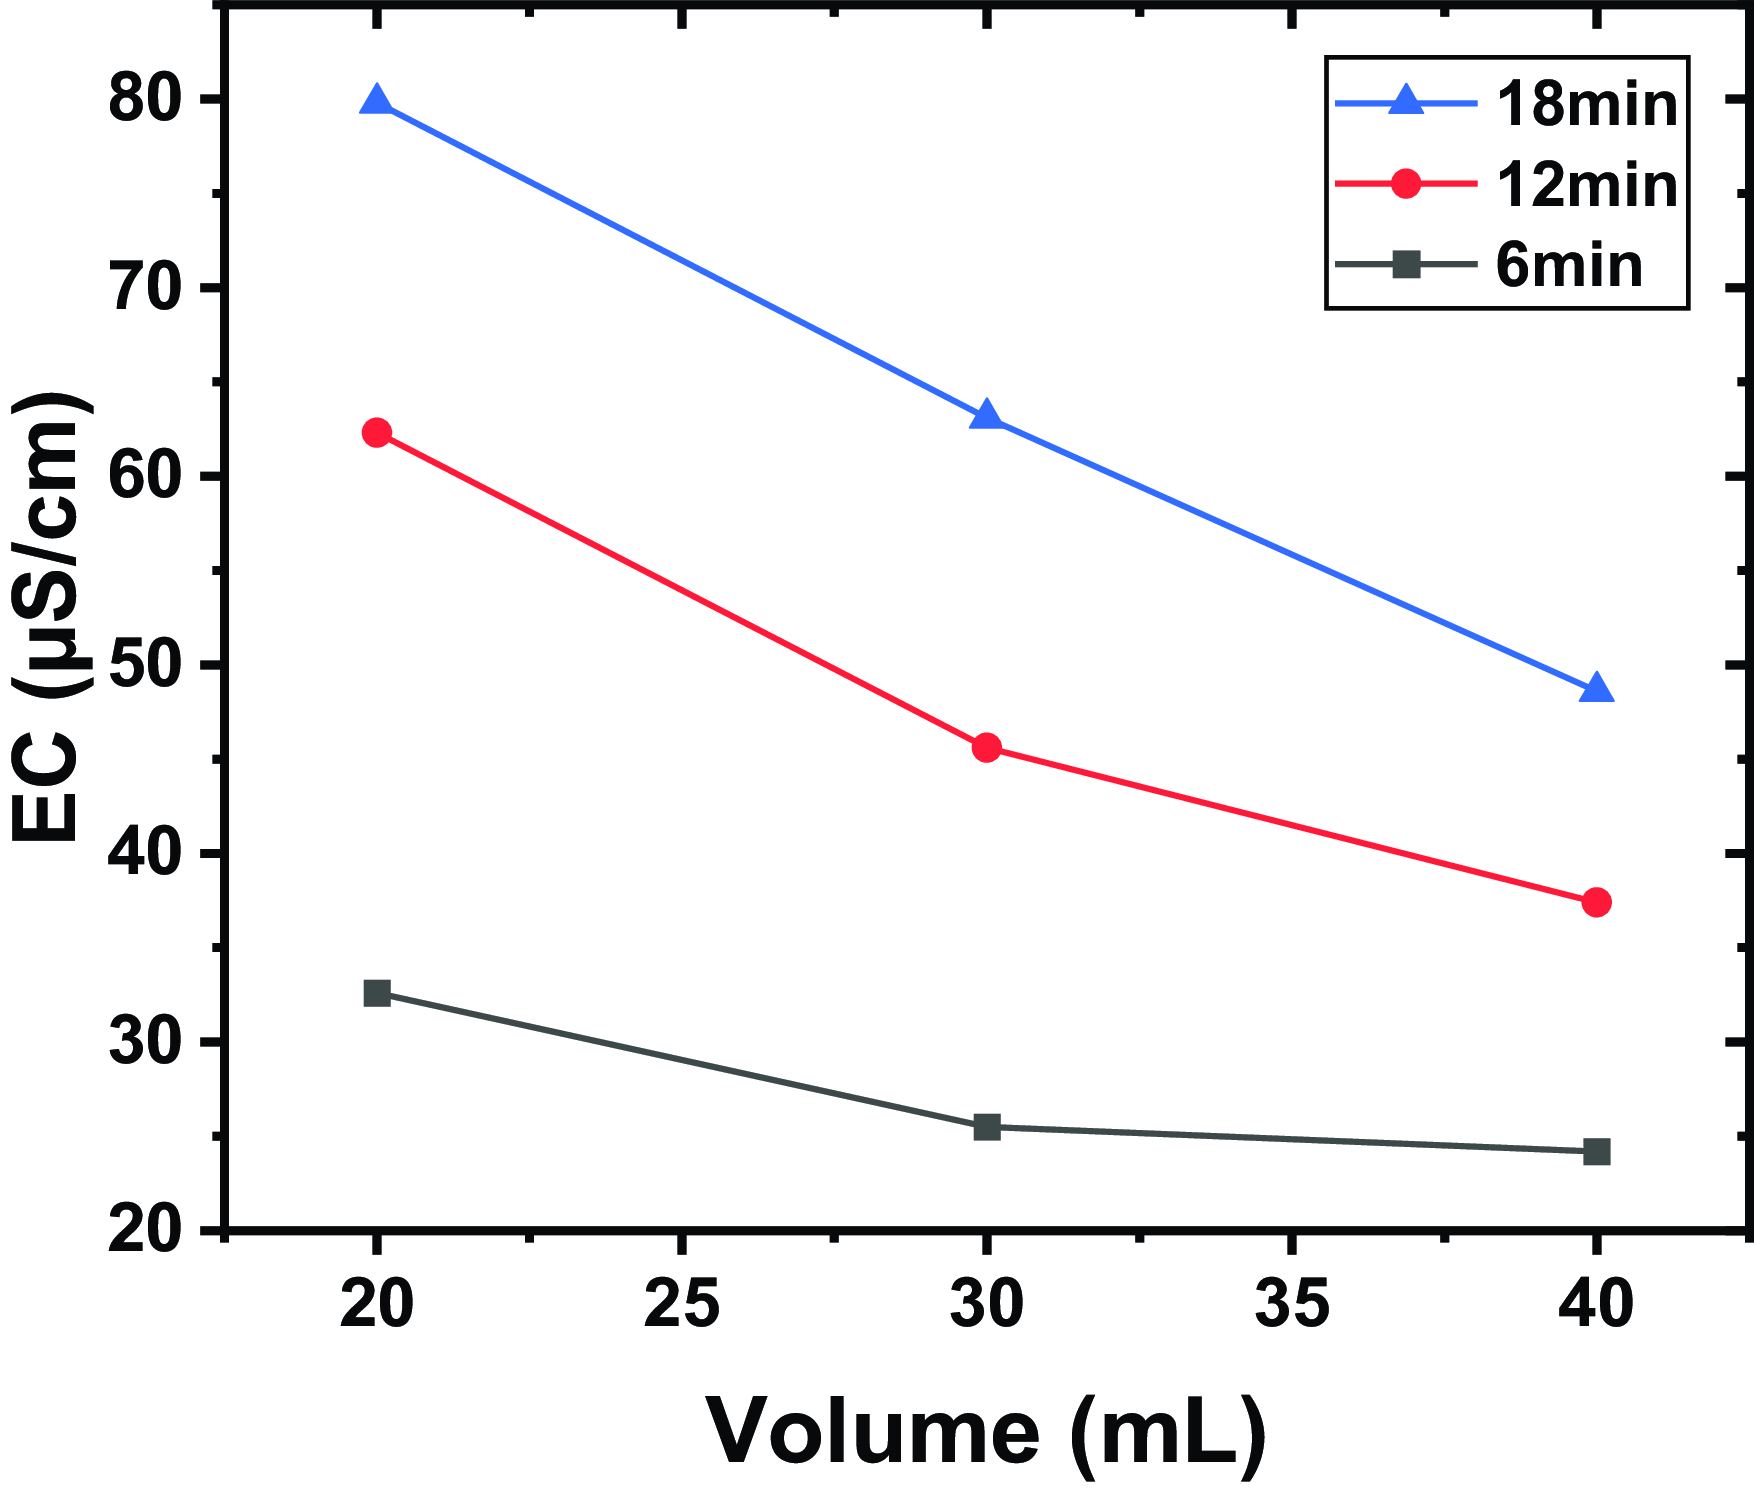
Figure 4. The EC for different volumes and for different exposure times, a distance between the tip and the water surface of $2\,\rm mm$
, and an applied voltage of
$2\,\rm mm$
, and an applied voltage of $7.17\,\rm kV$
.
$7.17\,\rm kV$
.
The increase in TDS is directly related to the increase in electrical conductivity, a relationship that is well known in aqueous solutions. Indeed, the higher the concentration of dissolved ions, the greater the conductivity of the water. This linear correlation between EC and TDS, commonly observed in aqueous environments, is confirmed by our experimental results. They demonstrate the effectiveness of plasma in modifying the physicochemical properties of distilled water, which can be exploited in various applications, such as sterilization, modification of solutions for industrial processes and chemical activation of water for specific uses. Here we have
 \begin{align*}\textit{TDS}=k\times EC\end{align*}
3.2. Plasma effect on different volumes of distilled water
Figure 4 shows the EC for different volumes (measured in millilitres) and for different exposure times, a distance between the tip and the water surface of $2\,\rm mm$
, and an applied voltage of
$2\,\rm mm$
, and an applied voltage of $7.17\,\rm kV$
. The results show that electrical conductivity decreases with increasing water volume for a given treatment time. Furthermore, for a given volume of water, electrical conductivity is higher for longer treatment times. This suggests that plasma is more effective in smaller volumes of water. Indeed, plasmas produce various free radicals and ions when they interact with water. These reactive species, such as hydronium ions (
$7.17\,\rm kV$
. The results show that electrical conductivity decreases with increasing water volume for a given treatment time. Furthermore, for a given volume of water, electrical conductivity is higher for longer treatment times. This suggests that plasma is more effective in smaller volumes of water. Indeed, plasmas produce various free radicals and ions when they interact with water. These reactive species, such as hydronium ions ( ${\rm H}_{3} {\rm O}^{+}$
), hydroxyls (
${\rm H}_{3} {\rm O}^{+}$
), hydroxyls ( ${\rm OH}^{-}$
), peroxides (
${\rm OH}^{-}$
), peroxides ( ${\rm H}_{2} {\rm O}_{2}$
) and others, contribute to increasing the conductivity of water. As the volume of water treated increases, the ionic species generated by the plasma are distributed over a larger volume of water. This dilution reduces the concentration of ions per unit volume, which lowers the overall conductivity of the treated water. Plasma treatment is often most effective at the water surface. In a larger volume of water, the proportion of water in direct contact with the plasma relative to the total volume decreases, which can reduce the effectiveness of the treatment and, consequently, the conductivity.
${\rm H}_{2} {\rm O}_{2}$
) and others, contribute to increasing the conductivity of water. As the volume of water treated increases, the ionic species generated by the plasma are distributed over a larger volume of water. This dilution reduces the concentration of ions per unit volume, which lowers the overall conductivity of the treated water. Plasma treatment is often most effective at the water surface. In a larger volume of water, the proportion of water in direct contact with the plasma relative to the total volume decreases, which can reduce the effectiveness of the treatment and, consequently, the conductivity.
Figure 5 shows evolution of TDS for different volumes and for different exposure times, a distance between the tip and the water surface of $2\,\rm mm$
and an applied voltage of
$2\,\rm mm$
and an applied voltage of $7.17\,\rm kV$
. We observe that for a given exposure time, there is a decrease in TDS as the volume increases. This variation can be explained by the fact that as the volume of water treated increases, the dissolved species generated or modified by the plasma are distributed over a larger volume. This dilution reduces the concentration of dissolved solids per unit volume, thereby lowering the measured TDS. Additionally, as the volume of water treated increases, the efficiency of the plasma may decrease because the power density (energy per unit volume) applied to the water is reduced. This limits the amount of reactive species generated and, consequently, the efficiency of the degradation or transformation of dissolved solids.
$7.17\,\rm kV$
. We observe that for a given exposure time, there is a decrease in TDS as the volume increases. This variation can be explained by the fact that as the volume of water treated increases, the dissolved species generated or modified by the plasma are distributed over a larger volume. This dilution reduces the concentration of dissolved solids per unit volume, thereby lowering the measured TDS. Additionally, as the volume of water treated increases, the efficiency of the plasma may decrease because the power density (energy per unit volume) applied to the water is reduced. This limits the amount of reactive species generated and, consequently, the efficiency of the degradation or transformation of dissolved solids.
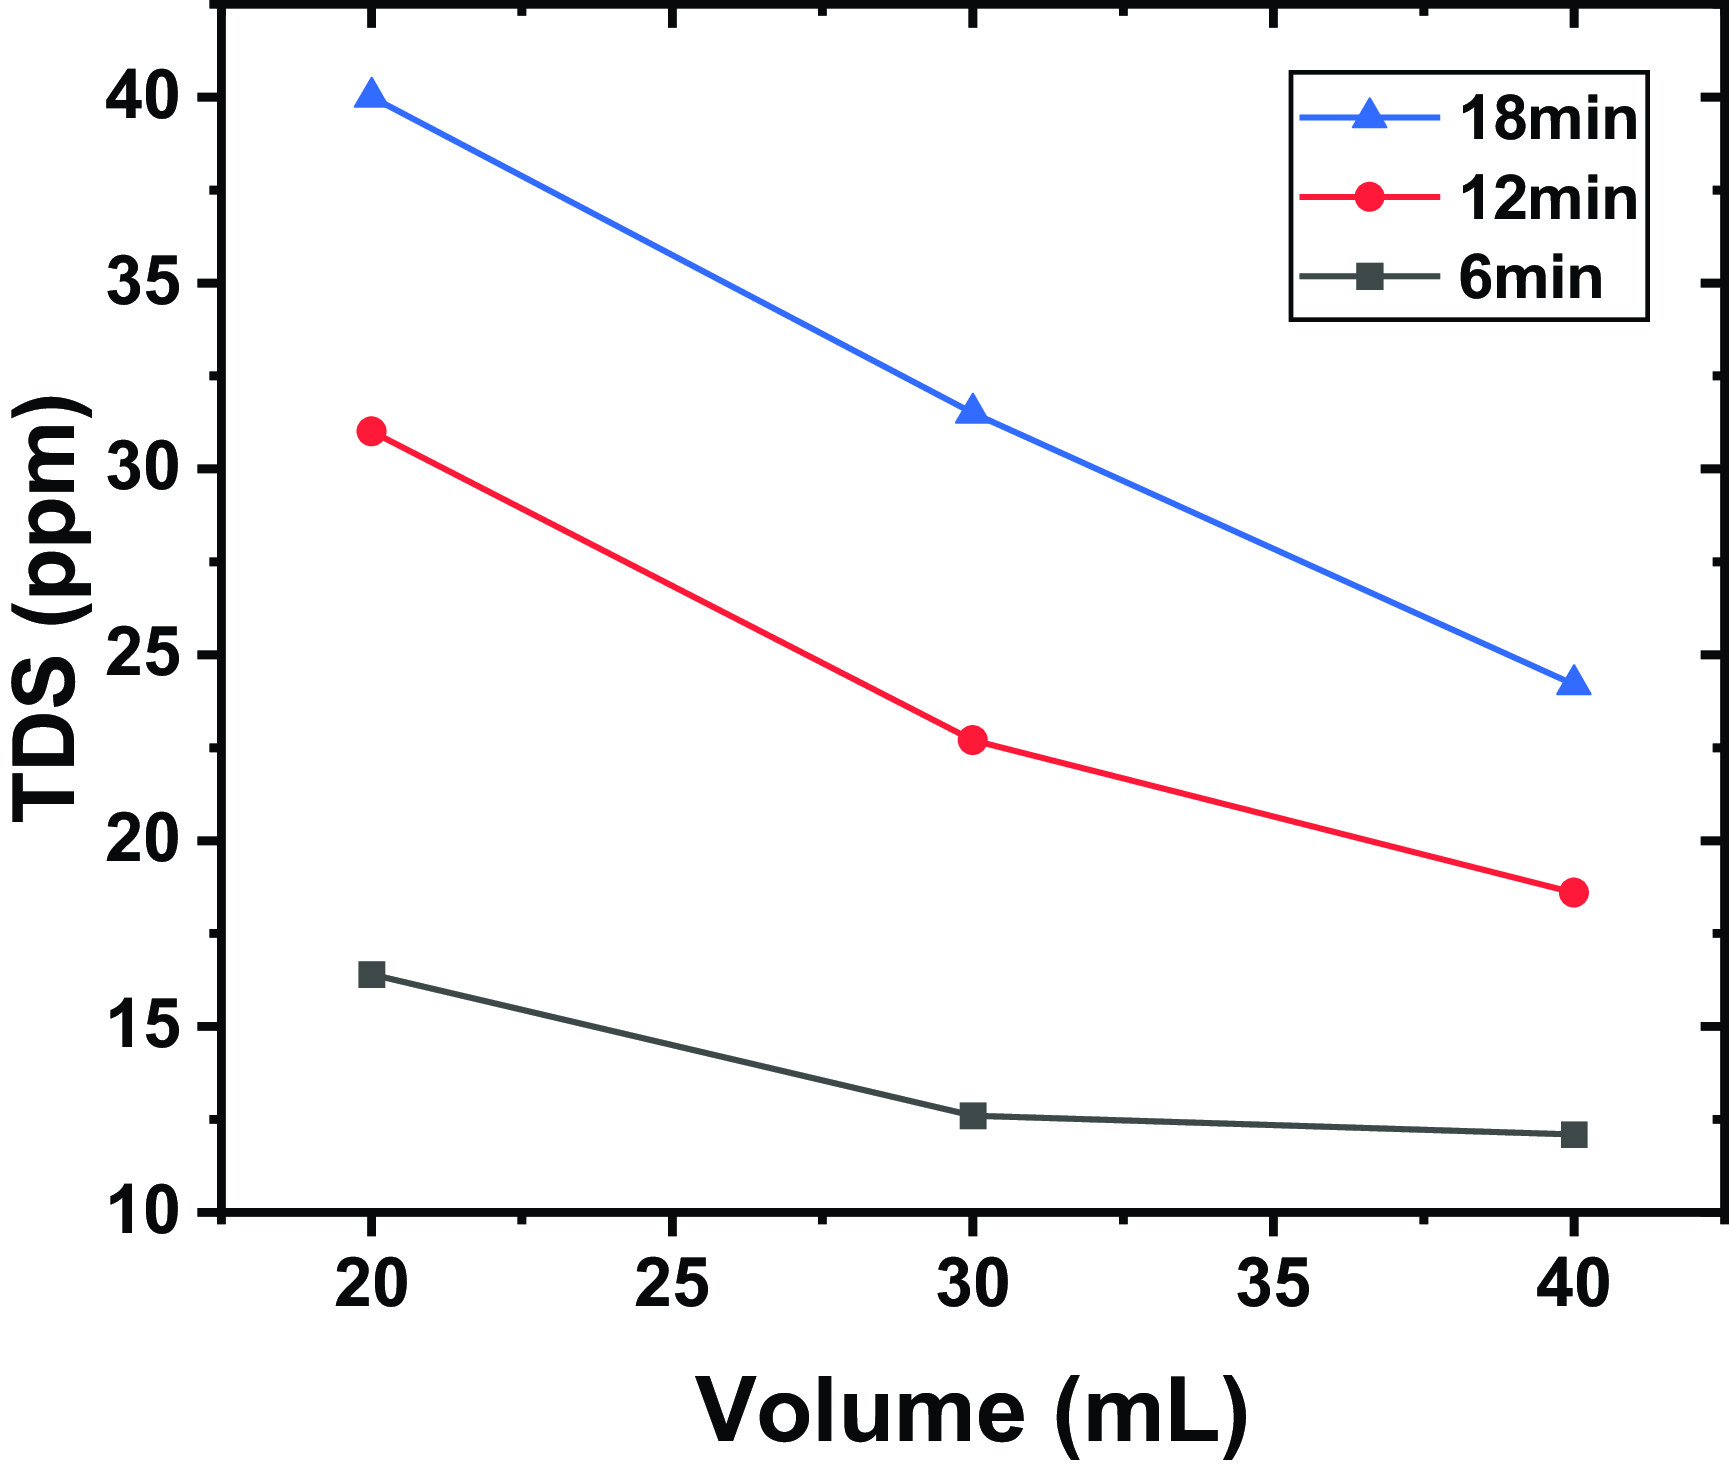
Figure 5. Evolution of TDS for different volumes and for different exposure times, a distance between the tip and the water surface of $2\,\rm mm$
, and an applied voltage of
$2\,\rm mm$
, and an applied voltage of $7.17\,\rm kV$
.
$7.17\,\rm kV$
.
3.3. Effect of applied voltage on water treatment
Figure 6 shows the EC for different applied voltages and exposure times, a distance between the tip and the water surface of $2\,\rm mm$
and a volume of
$2\,\rm mm$
and a volume of $20\,\rm mL$
. The electrical conductivity is presented as a function of treatment time for three applied voltage levels: 5.75 kV (black line with squares),
$20\,\rm mL$
. The electrical conductivity is presented as a function of treatment time for three applied voltage levels: 5.75 kV (black line with squares), $7.17\,\rm kV$
(red line with circles) and
$7.17\,\rm kV$
(red line with circles) and $8.32\,\rm kV$
(blue line with triangles). The results indicate that electrical conductivity increases with the application of higher voltages and with treatment time. The curves show that higher voltages (
$8.32\,\rm kV$
(blue line with triangles). The results indicate that electrical conductivity increases with the application of higher voltages and with treatment time. The curves show that higher voltages ( $8.32\,\rm kV$
) lead to a faster and more significant increase in electrical conductivity compared with lower voltages (
$8.32\,\rm kV$
) lead to a faster and more significant increase in electrical conductivity compared with lower voltages ( $5.75\,\rm kV$
and
$5.75\,\rm kV$
and $7.17\,\rm kV$
). For instance, at 18 min of treatment, the electrical conductivity at
$7.17\,\rm kV$
). For instance, at 18 min of treatment, the electrical conductivity at $8.32\,\rm kV$
reaches 79.5 µS cm−1, while at
$8.32\,\rm kV$
reaches 79.5 µS cm−1, while at $7.17\,\rm kV$
, it reaches 51.5 µS cm−1. In contrast, at
$7.17\,\rm kV$
, it reaches 51.5 µS cm−1. In contrast, at $5.75\,\rm kV$
, the conductivity only reaches 7 µS cm−1. The control sample of non-treated water has a conductivity of 4.2 µS cm−1. This variation can be explained by several physical and chemical mechanisms linked to the behaviour of plasma and the reactive species it generates.
$5.75\,\rm kV$
, the conductivity only reaches 7 µS cm−1. The control sample of non-treated water has a conductivity of 4.2 µS cm−1. This variation can be explained by several physical and chemical mechanisms linked to the behaviour of plasma and the reactive species it generates.
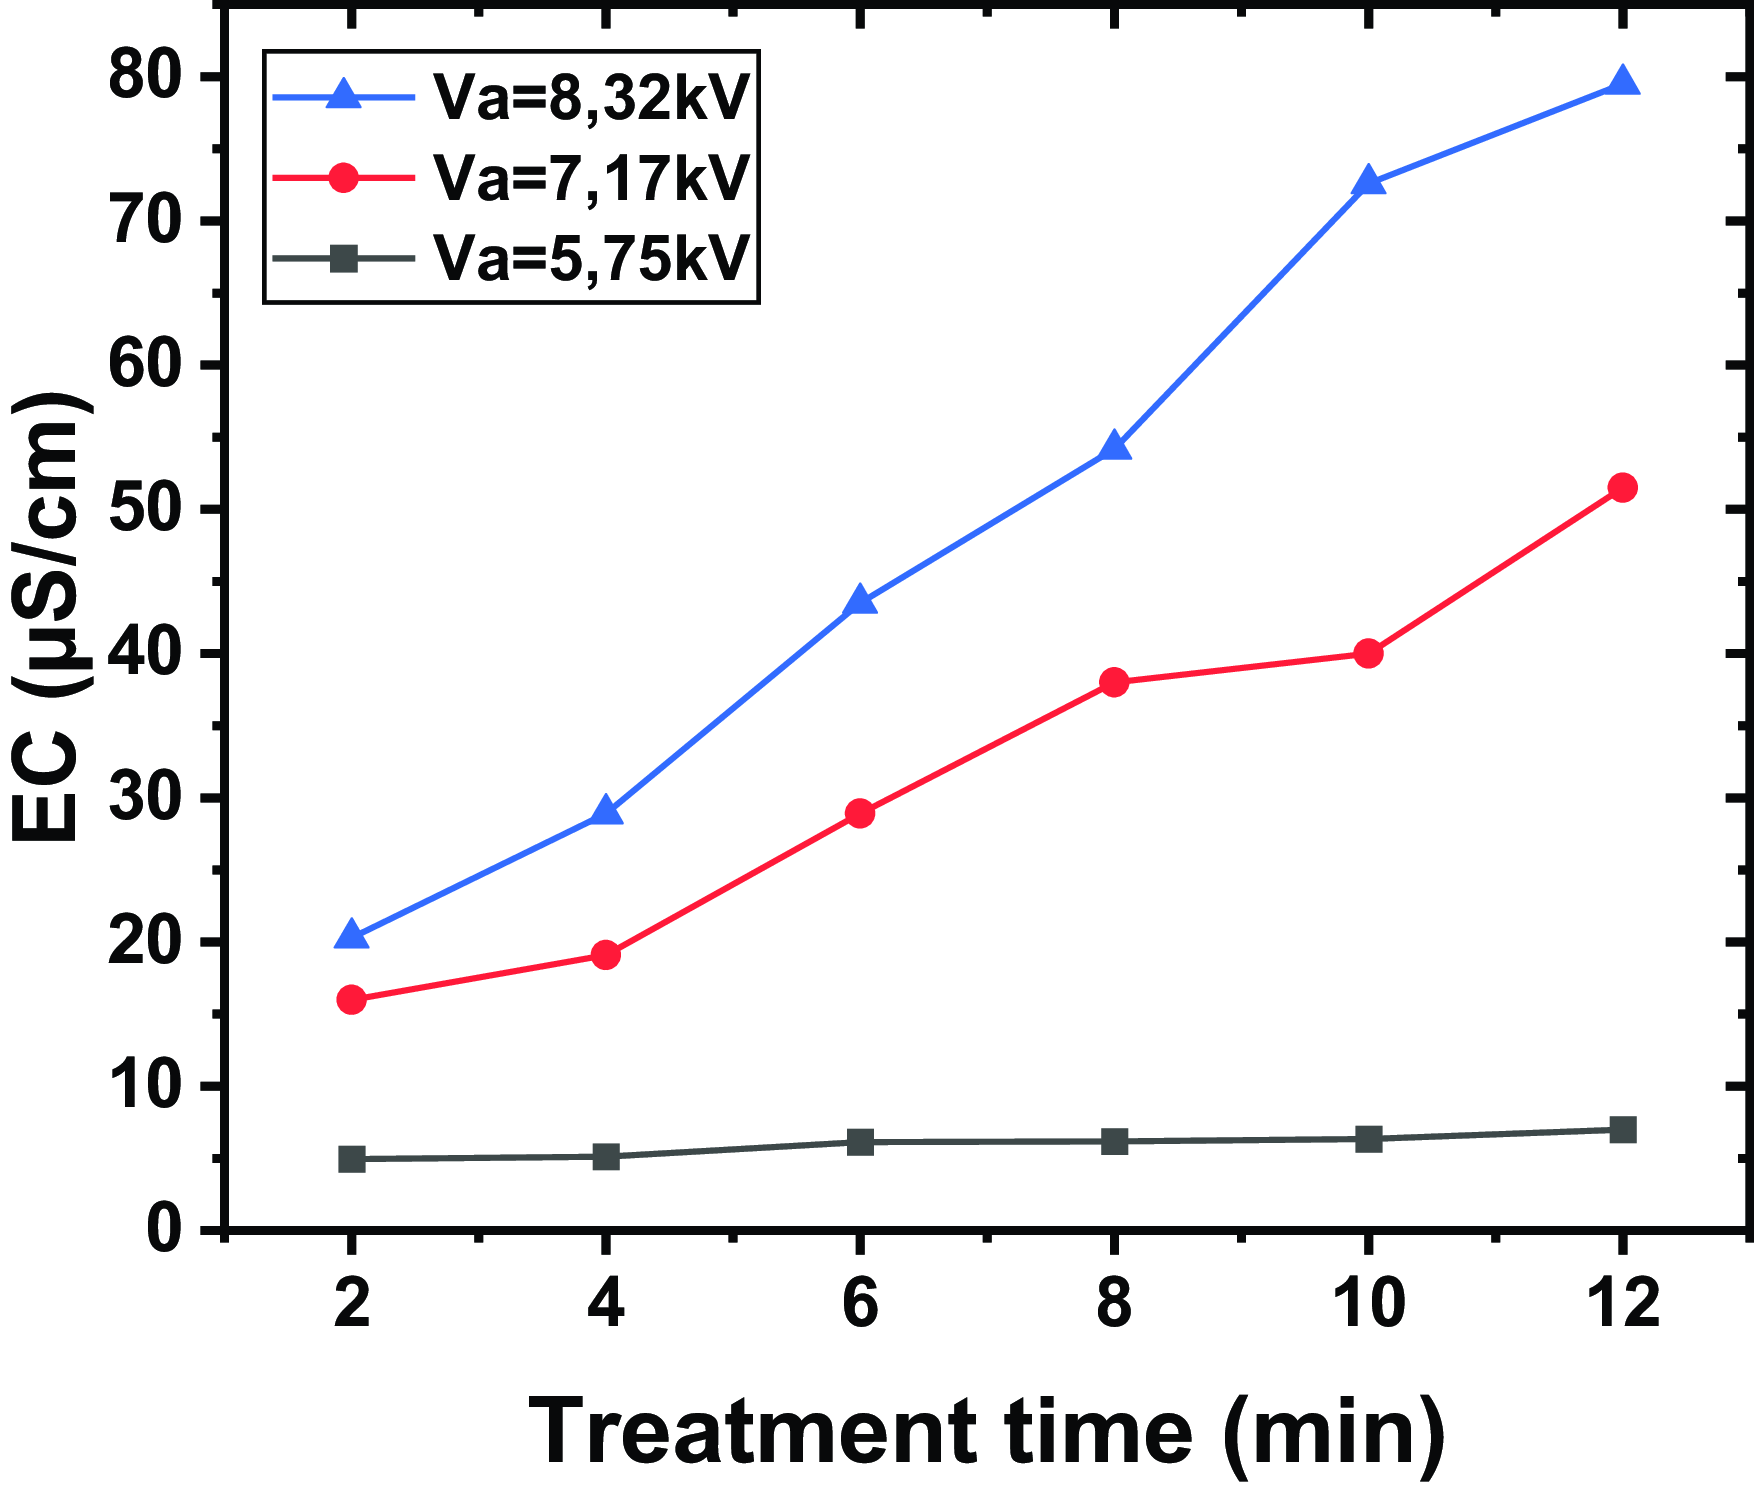
Figure 6. The EC for different applied voltages and exposure times, a distance between the tip and the water surface of $2\,\rm mm$
and a volume of
$2\,\rm mm$
and a volume of $20\,\rm mL$
.
$20\,\rm mL$
.
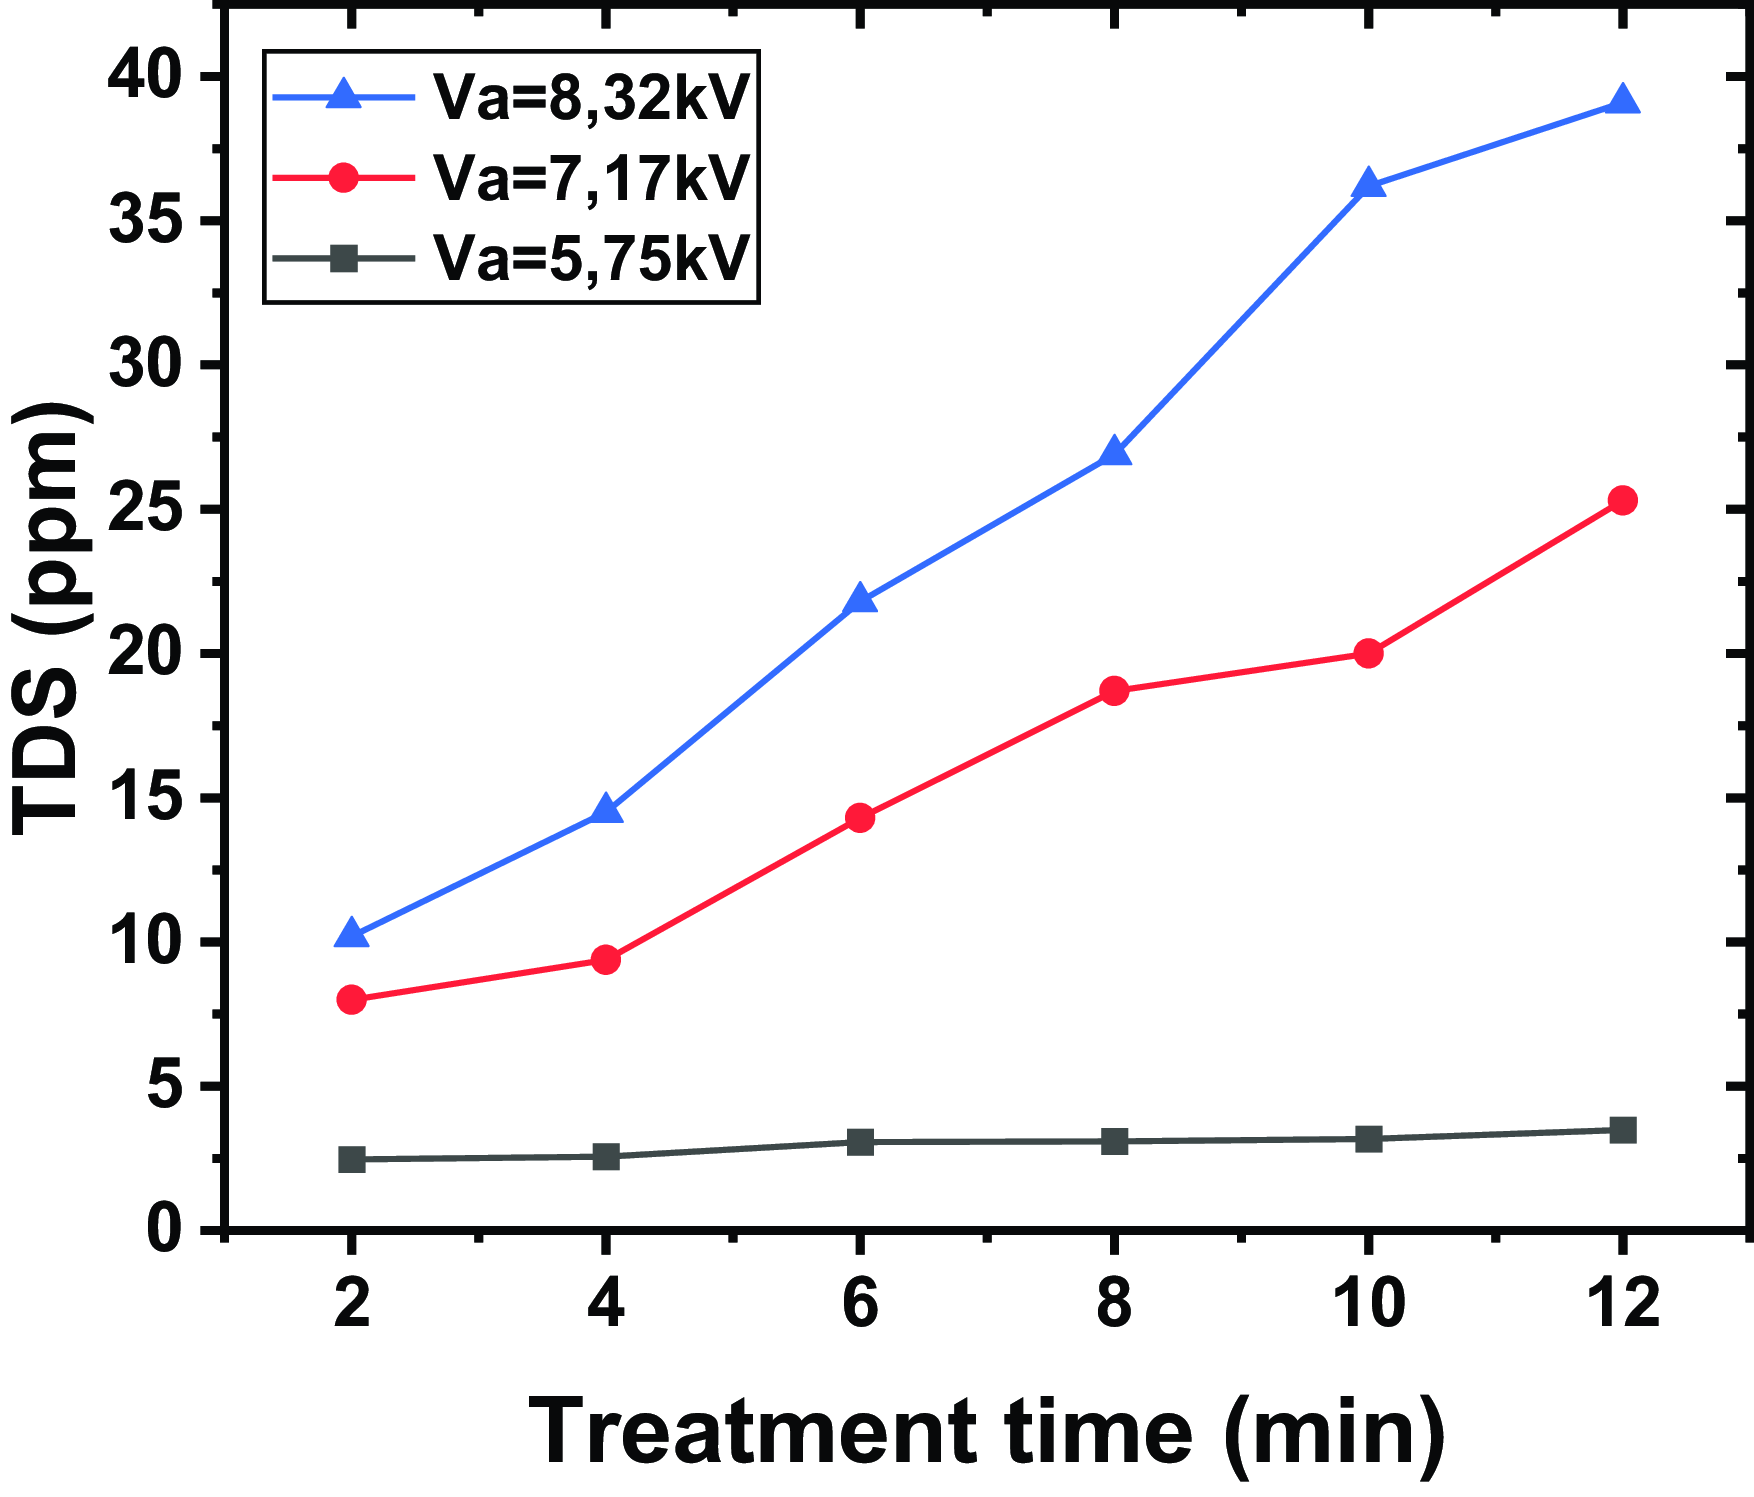
Figure 7. Evolution of TDS for different applied voltages and for different exposure times, a distance between the tip and the water surface of $2\,\rm mm$
and a volume of
$2\,\rm mm$
and a volume of $20\,\rm mL$
.
$20\,\rm mL$
.
Higher voltage increases plasma energy, which enhances the efficiency of free radical and ion generation. These reactive species can ionize more water molecules, increasing the water’s conductivity. At higher voltages, the interactions between the plasma and the water surface are more intense, encouraging the formation of more reactive species on the surface, which then diffuse into the water, further increasing conductivity.
Figure 7 shows the evolution of TDS for different applied voltages and for different exposure times, a distance between the tip and the water surface of $2\,\rm mm$
and a volume of
$2\,\rm mm$
and a volume of $20\,\rm mL$
. The results indicate that TDS increases with the application of higher voltages and with treatment time. The curves show that higher voltages (
$20\,\rm mL$
. The results indicate that TDS increases with the application of higher voltages and with treatment time. The curves show that higher voltages ( $8.32\,\rm kV$
) lead to a faster and more significant increase in TDS, compared with lower voltages (
$8.32\,\rm kV$
) lead to a faster and more significant increase in TDS, compared with lower voltages ( $5.75\,\rm kV$
and
$5.75\,\rm kV$
and $7.17\,\rm kV$
). For example, at 18 min of treatment, the TDS at
$7.17\,\rm kV$
). For example, at 18 min of treatment, the TDS at $8.32\,\rm kV$
reaches 39.1 p.p.m., while at
$8.32\,\rm kV$
reaches 39.1 p.p.m., while at $7.17\,\rm kV$
, it reaches 25.3 p.p.m. In contrast, at
$7.17\,\rm kV$
, it reaches 25.3 p.p.m. In contrast, at $5.75\,\rm kV$
, the TDS only reaches 3.49 p.p.m. The control sample of non-treated water has a TDS of 2.1 p.p.m.
$5.75\,\rm kV$
, the TDS only reaches 3.49 p.p.m. The control sample of non-treated water has a TDS of 2.1 p.p.m.
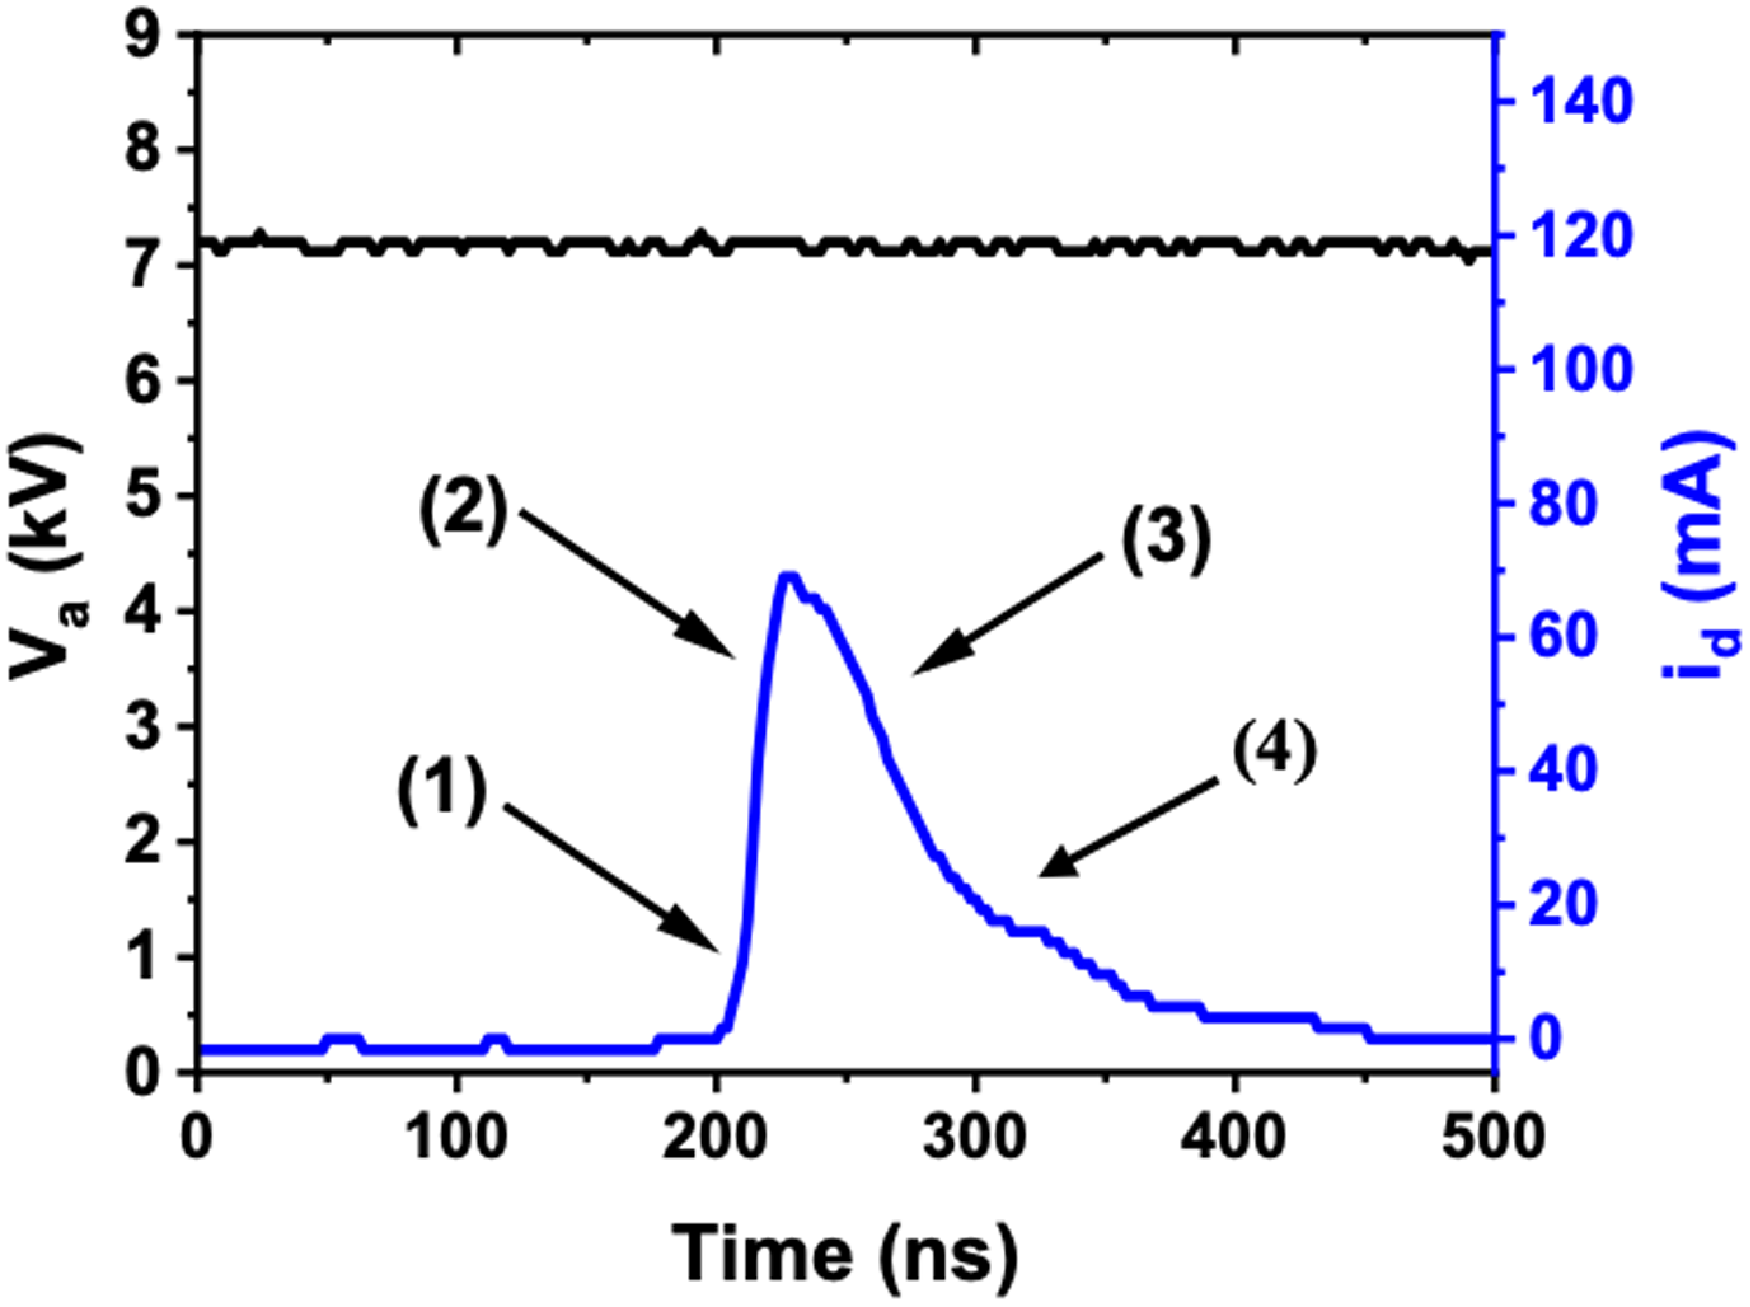
Figure 8. Evolution of discharge current and voltage during the treatment of distilled water, with an exposure time of 6 min, a volume of 20 mL, an applied voltage of 7.17 kV and a distance between the tip and water surface of 2 mm.
This suggests that as the applied voltage increases, the energy of the electrons in the plasma also increases. This additional energy can cause water molecules to dissociate into free radicals (such as $\rm OH$
and
$\rm OH$
and $\rm H$
) and ions (such as
$\rm H$
) and ions (such as ${\rm H}^{+}$
and
${\rm H}^{+}$
and ${\rm OH}^{-}$
). These dissociated species can then react to form new dissolved compounds, increasing the TDS. A higher voltage can improve the efficiency of the plasma in producing reactive species.
${\rm OH}^{-}$
). These dissociated species can then react to form new dissolved compounds, increasing the TDS. A higher voltage can improve the efficiency of the plasma in producing reactive species.
3.4. Electrical study during distilled water treatment
Thus far, we have demonstrated the impact of cold plasma on the physical properties of distilled water, particularly on the TDS and conductivity. A significant increase in these properties was observed with the increase in treatment time and applied voltage (see figures 2 and 3). These results clearly indicate that the chemical activation of water, induced by plasma discharge, is an energy-intensive process. However, it is essential to further understand the underlying mechanism, particularly how energy is utilized during the treatment.
The aim of this part of the study is to analyse the electrical parameters associated with the corona discharge to determine the useful power and evaluate the energy efficiency of the plasma. For this, we combined experimental current and voltage measurements with an equivalent electrical model of the corona discharge, based on a tip–plane reactor developed in our previous work (Raouti et al. 2016; Saber et al. 2020).
Figure 8 presents the evolution of discharge current and voltage during the treatment of distilled water, with an exposure time of 6 min, a volume of 20 mL, an applied voltage of 7.17 kV and a distance between the tip and water surface of 2 mm. The figure shows three distinct phases of the corona discharge. In the first zone (zone 1), the current remains low because the applied voltage is not yet sufficient to sustain a continuous discharge. During this phase, a streamer begins to form at the electrode tip, leading to a gradual ionization of air and water molecules. In zone 2, when the voltage reaches a critical level, the streamer propagates vigorously towards the cathode electrode, resulting in a current peak. This phase is crucial as it corresponds to strong ionization of both air and distilled water, generating free ions and electrons, and increasing the water’s chemical reactivity. The majority of energy is dissipated during this phase, thus contributing significantly to the chemical activation of distilled water. Finally, in zone 3, once the streamer reaches its maximum speed, it rapidly dissipates, marking the end of the active phase and a sharp drop in current. The post-discharge phase (zone 4), with very low current, prepares the reactor for a new treatment cycle, as shown in the reference (Merbahi et al. 2008; Abahazem et al. Reference Abahazem, Merbahi, Eichwald, Yousfi and Ihlal2014). Overall, the current analysis shows that most of the energy is dissipated during the streamer propagation phase, which is responsible for the most intense chemical activation of water.
Figure 9 presents the evolution of useful power during the treatment of distilled water, with an exposure time of 6 min, a volume of 20 mL, an applied voltage of 7.17 kV and a distance between the tip and water surface of 2 mm. The useful power represents the energy actually consumed by the plasma to ionize water molecules and generate reactive species, thereby contributing to the chemical activation of the water. In this study, the useful power is determined from the current and voltage measurements, using an equivalent electrical model of the corona discharge for a tip–plane reactor, developed in our previous work (Saber et al. 2022). This model allows for precise estimation of the energy dissipated by Joule heating during the discharge, which is directly related to the ionization of water and the creation of reactive species responsible for the increase in TDS and conductivity of water.
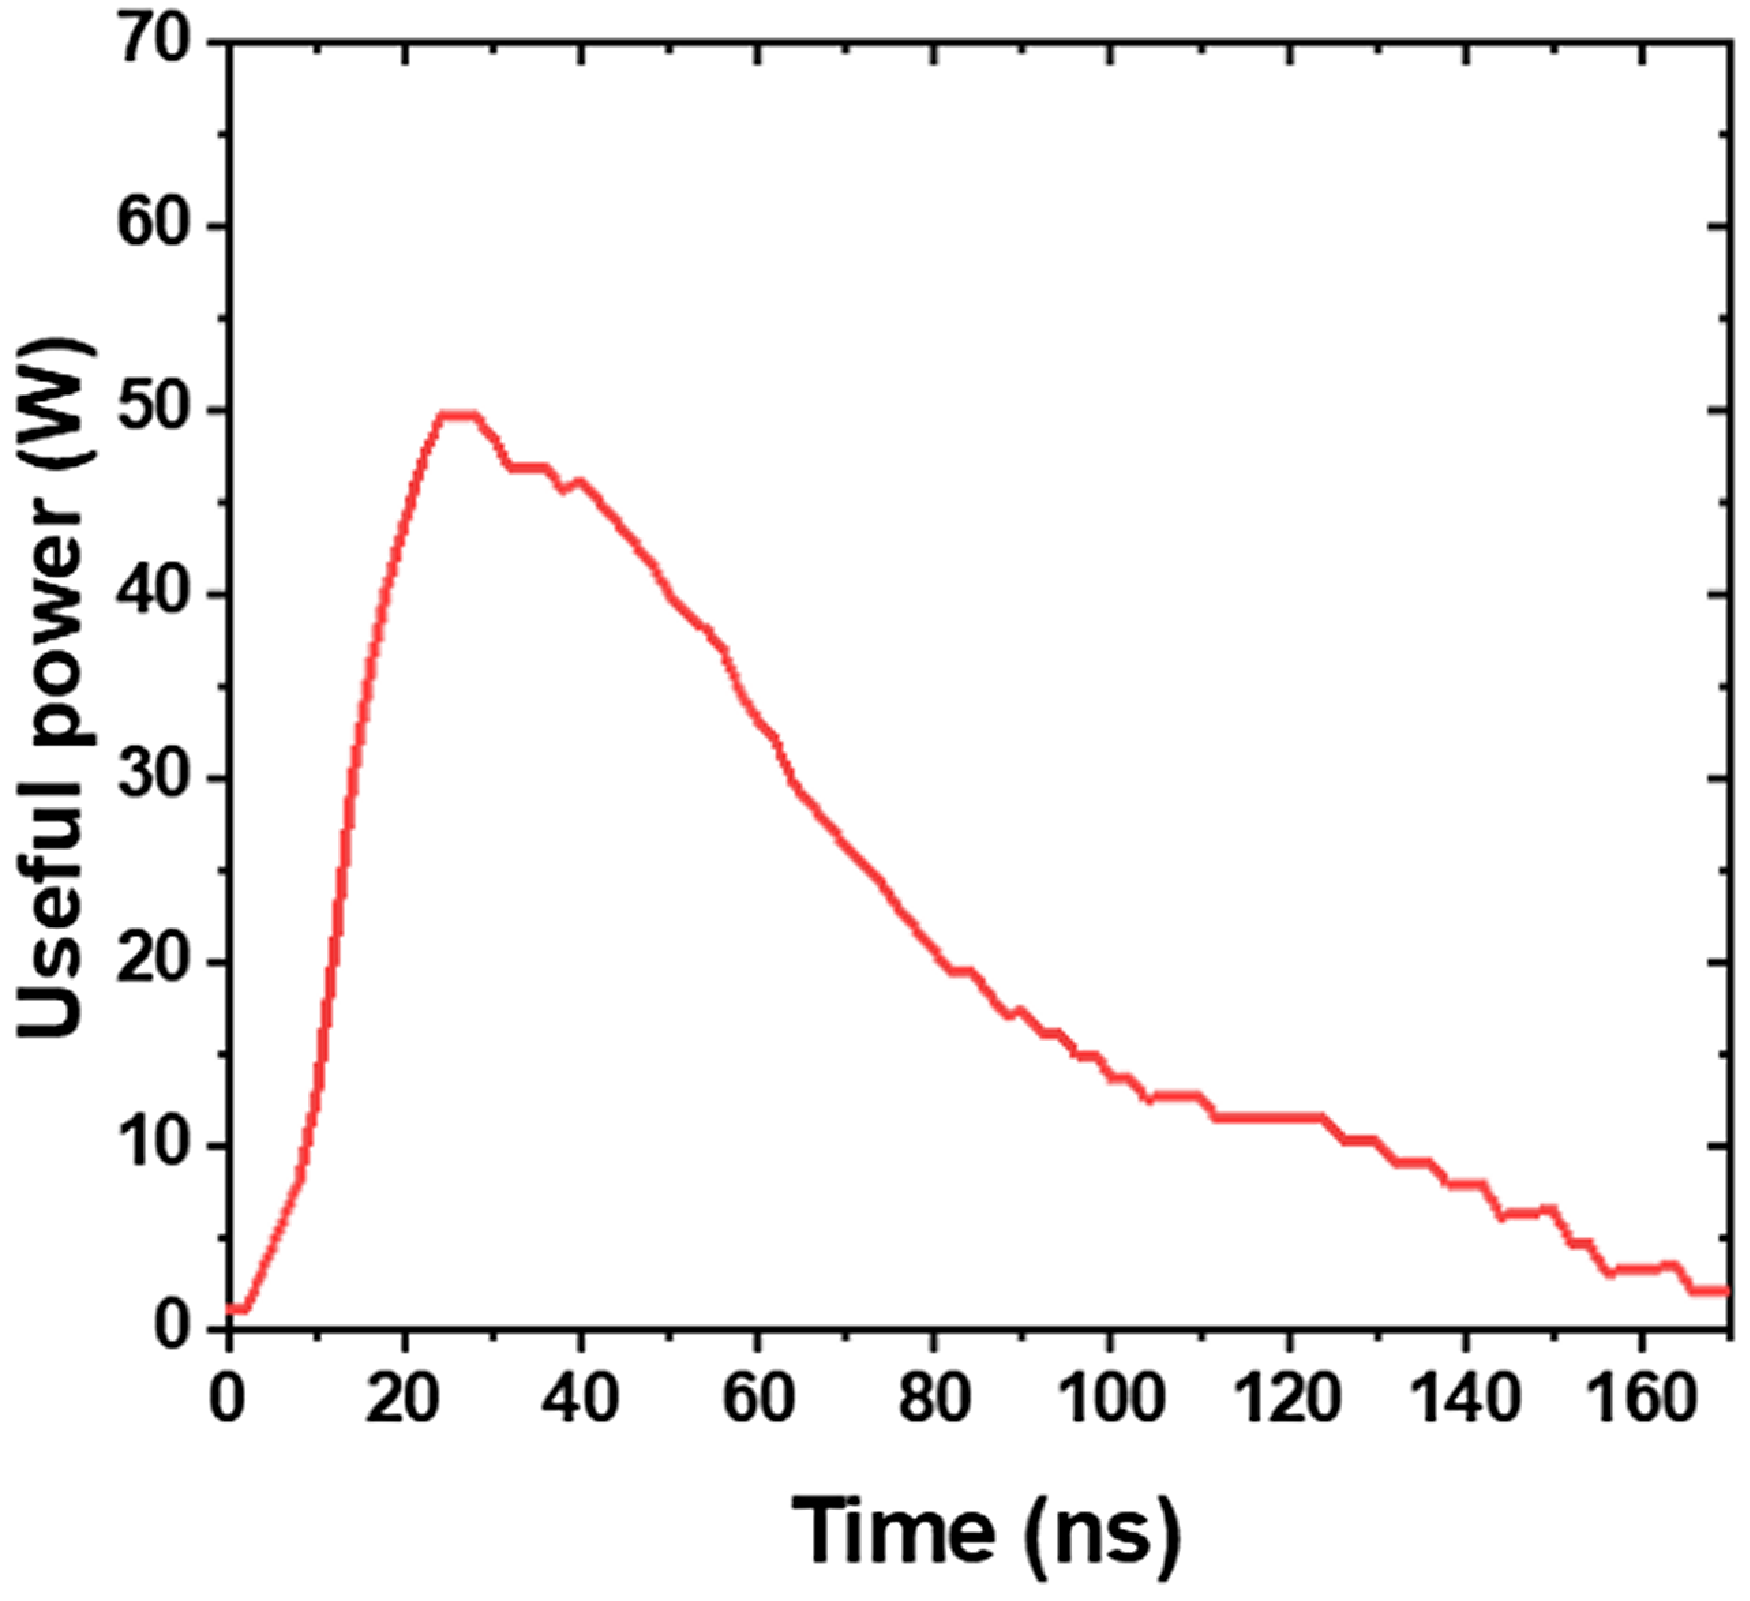
Figure 9. Evolution of useful power during the treatment of distilled water, with an exposure time of 6 min, a volume of 20 mL, an applied voltage of 7.17 kV and a distance between the tip and water surface of 2 mm.
The total power delivered to the reactor is obtained by instantaneously multiplying the measured voltage and current during the treatment (Saber et al. 2022). This total power includes both the useful power and energy losses in the system. The useful power corresponds to the fraction of this energy that is actually used for the chemical activation of water. As shown in figure 9, the curve of useful power follows a typical three-phase evolution. Initially, in the streamer formation phase (zone 1), the energy dissipated is low due to weak ionization. During the streamer propagation (zone 2), the dissipated energy increases, reaching its maximum. This phase corresponds to the intensification of ionization and the generation of reactive species in water. Finally, in the post-discharge phase (zone 4), the useful power decreases sharply as ionization and plasma intensity stabilize.
This curve reflects the dynamic use of energy during the treatment process. The majority of the energy is dissipated during the active phase, particularly during the streamer propagation, and this energy dissipation is directly linked to the chemical activation of the water.
Figure 10 presents the evolution of plasma energy efficiency during the treatment of distilled water, with an exposure time of 6 min, a volume of 20 mL, an applied voltage of 7.17 kV and a distance between the tip and water surface of 2 mm. It is a key parameter that measures the proportion of energy effectively used to improve the properties of water. It is defined as the ratio of useful power to the total power delivered to the reactor. This efficiency varies throughout the corona discharge process. As shown in figure 10, at the beginning of the discharge, the energy efficiency increases progressively as the streamer propagation phase develops. It reaches a maximum when the streamer reaches the cathode, which corresponds to the point where the energy is fully converted into chemical energy, thus maximizing the activation of water. After this phase, the efficiency gradually decreases and tends towards zero. This decrease is due to the reduction in ionization as the streamer stabilizes and the cessation of the discharge’s contribution to the chemical activation of water. The excess energy then dissipates as losses, mainly through heat from the components and electrical losses in the system.
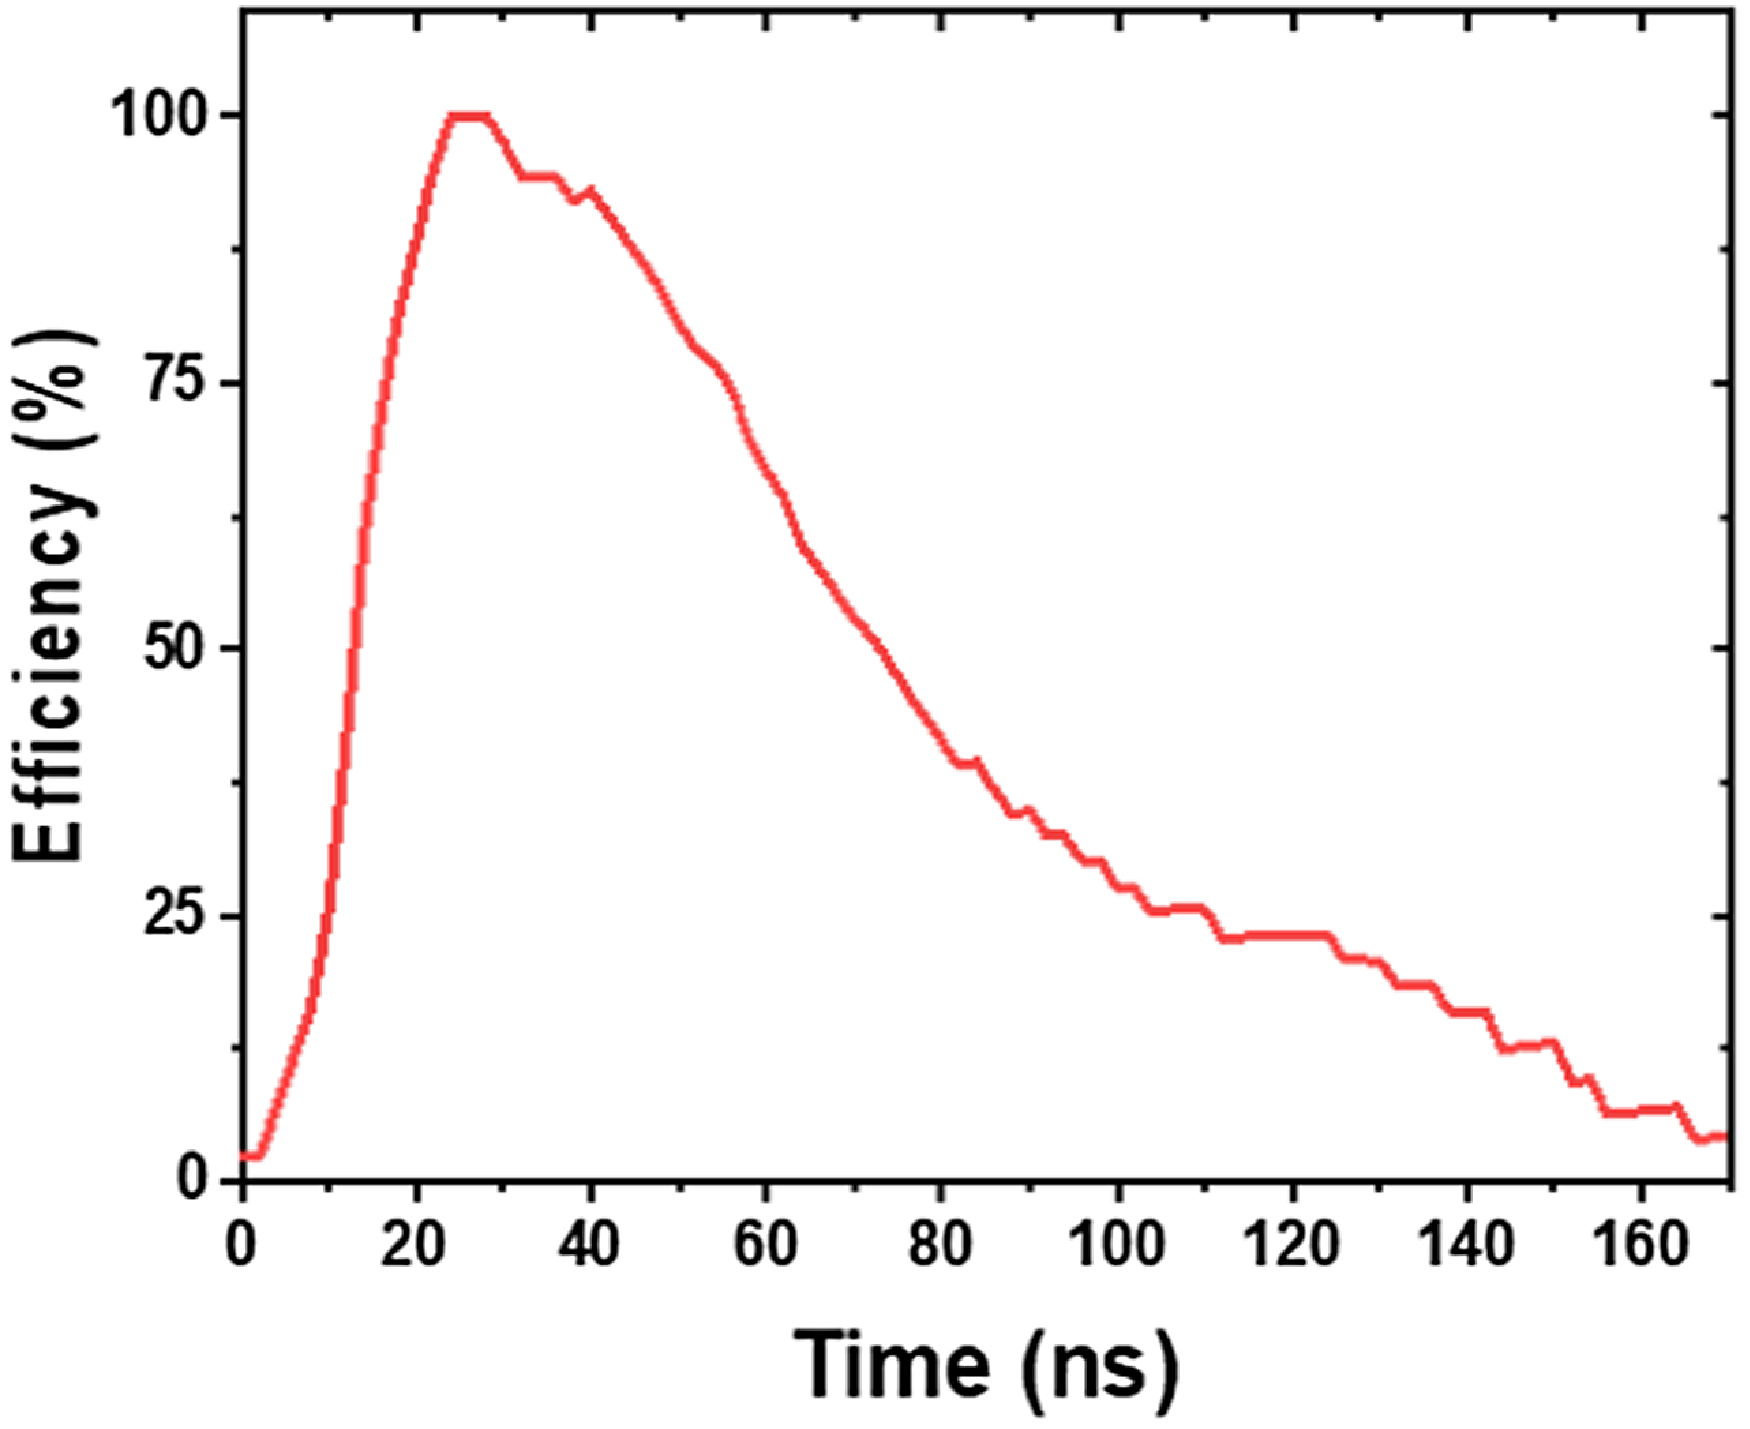
Figure 10. Evolution of plasma energy efficiency during the treatment of distilled water, with an exposure time of 6 min, a volume of 20 mL, an applied voltage of 7.17 kV and a distance between the tip and water surface of 2 mm.
Figure 11 presents the evolution of useful power during the treatment of distilled water, for different applied voltages, with an exposure time of 6 min, a volume of 20 mL and a distance between the tip and water surface of 2 mm. Increasing the applied voltage to the reactor, ranging from 5.75 kV to 8.32 kV, results in a significant increase in useful power. This increase is directly related to the expansion of the electric field, which strengthens with the increase in voltage. As the voltage increases, the electric field between the tip and the water surface expands, accelerating electrons. This increased electron acceleration leads to more intense ionization of both air and distilled water molecules, creating positive ions and free radicals. The formation of these reactive species plays a key role in the chemical activation of water, resulting in an increase in TDS and conductivity. The intensification of ionization improves the chemical reactivity of water and allows for more efficient conversion of electrical energy into chemical energy.
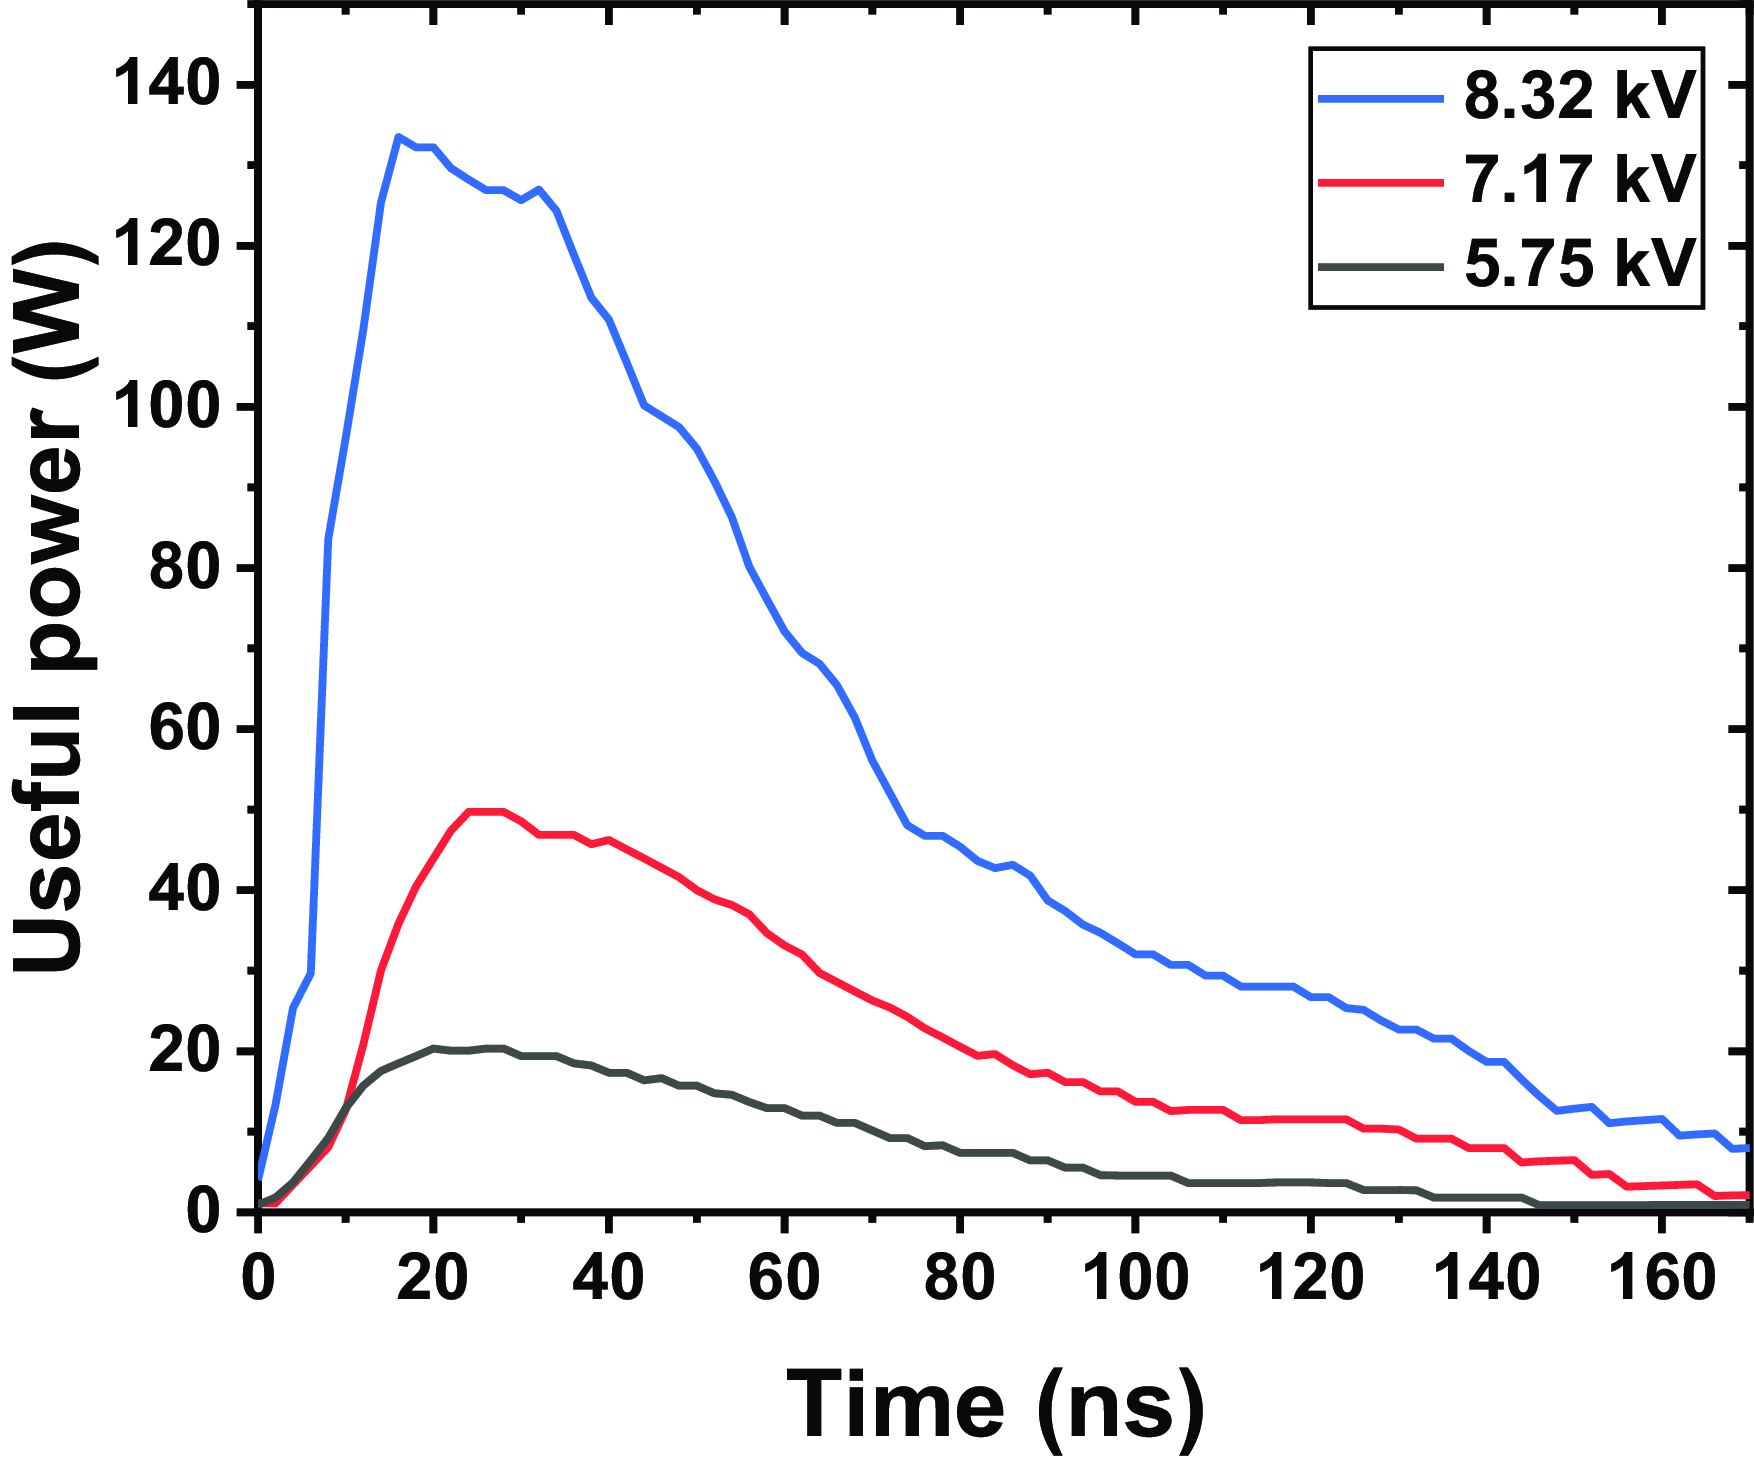
Figure 11. Evolution of useful power during the treatment of distilled water, for different applied voltages, with an exposure time of 6 min, a volume of $20\,\rm mL$
and a distance between the tip and water surface of
$20\,\rm mL$
and a distance between the tip and water surface of $2\,\rm mm$
.
$2\,\rm mm$
.
In conclusion, the direct relationship between applied voltage and useful power highlights the importance of controlling electrical parameters to optimize the energy efficiency of the process. The intensification of ionization enables a better conversion of electrical energy into chemical energy, which enhances the water properties while increasing energy dissipation in the process.
4. Conclusion
In this study, we examined the use of cold plasma for the treatment of distilled water, particularly focusing on the effects on TDS and conductivity. We observed significant increases in TDS and conductivity with exposure time and applied voltage, reflecting the enhanced creation of reactive species in the water. Specifically, after a 2 min treatment with a voltage of 7.17 kV, TDS increased from 2.1 to 8 p.p.m. and conductivity rose from 4.2 to 16 µS cm−1. With longer exposure times, these values reached 25 p.p.m. for TDS and 50 µS cm−1 for conductivity. Furthermore, we found that increasing the volume of treated water resulted in a decrease in TDS and conductivity, and higher applied voltages led to further improvements in these properties. In parallel, an important aspect of this work was the electrical analysis carried out during the treatment process. Using an equivalent electrical model of the corona discharge reactor, we were able to calculate the useful power generated during discharge, based on measurements of voltage and current. This enabled us to assess the energy efficiency of the plasma treatment and provided a detailed understanding of the energy dynamics involved. By analysing the electrical behaviour in real time, we were able to optimize the discharge conditions, adjusting voltage and exposure time to improve energy use efficiency.
The results highlight that precise control over the electrical parameters can lead to more efficient plasma treatments. This electrical study not only deepens our understanding of the power consumption and energy dynamics during plasma treatment, but also provides a framework for optimizing the plasma process in practical applications.
Acknowledgements
Editor Edward Thomas, Jr. thanks the referees for their advice in evaluating this article.
Author contributions
Conceptualization, K.S., A.H., H.G; methodology, K.S., A.H., H.G; software, K.S; validation, K.S., A.H., H.G., A.A., N.M.; formal analysis, K.S., A.H., H.G; investigation, K.S., A.H., H.G; resources, K.S., A.H., H.G; writing (original draft preparation), K.S., M.R.; writing (review and editing), K.S; visualization, A.A., N.M.; supervision, A.A., N.M; project administration, A.A., N.M.
Declaration of interests
The authors declare no conflict of interest.


 Open access