


Introduction
The onset of Marine Isotope Stage 16 (MIS 16; ca. 690–630 ka; Lisiecki and Raymo, Reference Lisiecki and Raymo2005; Elderfield et al., Reference Elderfield, Ferretti, Greaves, Crowhurst, McCave, Hodell and Piotrowski2012; Gibbard and Cohen, Reference Gibbard and Cohen2019) marks the end of the Mid–Late Pleistocene Transition (MLPT) that began ca. 900 kyr ago with the gradual transition from the ca. 41 kyr obliquity pacing of the Early Pleistocene and ended with the ca. 100 kyr eccentricity pacing that heralded the longer/colder glacial periods of the Late Pleistocene (Stein et al., Reference Stein, Hefter, Grützner, Voelker and Naafs2009; Dean et al., Reference Dean, Kennett, Behl, Nicholson and Sorlein2015; Ford et al., Reference Ford, Sosdian, Rosenthal and Raymo2016). While evidence for the timing of MIS 16 is abundant from the deep-ocean record (e.g., Lisiecki and Raymo, Reference Lisiecki and Raymo2005; Dean et al., Reference Dean, Kennett, Behl, Nicholson and Sorlein2015; Gibbard and Cohen, Reference Gibbard and Cohen2019), a well-constrained moraine record corresponding to this period is still lacking for both the alpine and continental glacial records in North America.
Deposits corresponding to advances of the Laurentide Ice Sheet (LIS) older than MIS 6 (190–130 ka; Gibbard and Cohen, Reference Gibbard and Cohen2019) in the U.S. midcontinent are designated as “pre-Illinoian” (e.g., Hallberg, Reference Hallberg1980, Reference Hallberg1986; Rovey and McLouth, Reference Rovey and McLouth2015). Tills related to pre-MIS 6 alpine glacial advances in the U.S. Rocky Mountains are designated as “pre-Bull Lake” (e.g., Schmidt and Mackin, Reference Schmidt and Mackin1970; Richmond, Reference Richmond, Sibrava, Bowen and G.M1986; Hall and Jaworowski, Reference Hall and Jaworowski1999; Gosse et al., Reference Gosse, Evenson, Klein, Sorenson and Easterbrook2003). Although ages for the pre-Illinoian tills described for the U.S. midcontinent have recently come into better focus (Balco and Rovey, 2010; Rovey and McLouth, Reference Rovey and McLouth2015; Rovey and Siemens, Reference Rovey and Siemens2021), age estimates for the pre-Bull Lake tills described for the U.S. Rocky Mountains remain ambiguous (Hall and Jaworowski, Reference Hall and Jaworowski1999; Gosse et al., Reference Gosse, Evenson, Klein, Sorenson and Easterbrook2003; Dahms et al., Reference Dahms, Egli, Brandova, de Castro Portes, Fabel, Harbor and Christl2018).
The Wind River Mountains (WRM) of Wyoming are central to the model of glacial succession in the Rocky Mountain region. The range contains the type localities for the allostratigraphic units that represent the three most recent Pleistocene glaciations (Pinedale, Bull Lake, Sacagawea Ridge) described in this region (see Blackwelder, Reference Blackwelder1915; Murphy and Richmond, Reference Murphy and Richmond1965; Richmond and Murphy, Reference Richmond and Murphy1965, Reference Richmond and Murphy1989; Richmond, Reference Richmond1973; Chadwick et al., Reference Chadwick, Hall and Phillips1997; Phillips et al., Reference Phillips, Zreda, Gosse, Klein, Evenson, Hall, Chadwick and Sharma1997). However, only the ages of the two most recent Late Pleistocene tills (Bull Lake, MIS 6; Pinedale, MIS 2) are well constrained by numeric ages (Laabs et al., Reference Laabs, Licciardi, Leonard, Munroe and Marchetti2020), while a satisfactory numeric age for till of the pre-MIS 6 Sacagawea Ridge glaciation remains elusive (Hall and Jaworowski, Reference Hall and Jaworowski1999; Gosse et al., Reference Gosse, Evenson, Klein, Sorenson and Easterbrook2003; Dahms et al., Reference Dahms, Egli, Brandova, de Castro Portes, Fabel, Harbor and Christl2018).
Previous age estimates for the Sacagawea Ridge till of the WRM have focused on an isolated outwash unit containing Lava Creek ash correlated to the Sacagawea Ridge type moraine at Dinwoody Lakes (Richmond and Murphy, Reference Richmond and Murphy1965, Reference Richmond and Murphy1989; Izett et al., Reference Izett, Pierce, Naeser and Jaworowski1992; Chadwick et al., Reference Chadwick, Hall and Phillips1997) and to those fragments of terrace WR7 along the Wind River near Bull Lake that contain Lava Creek ash, but are unconnected to Sacagawea Ridge till (Chadwick et al., Reference Chadwick, Hall and Phillips1997).
Estimates for the minimum-limiting ages of tills mapped as Sacagawea Ridge using cosmogenic exposure ages (10Be, 26Al, 36Cl) derived from boulders on Sacagawea Ridge moraines vary greatly, from ca. 135 ka to ca. 556 ka (Chadwick et al., Reference Chadwick, Hall and Phillips1997; Phillips et al., Reference Phillips, Zreda, Gosse, Klein, Evenson, Hall, Chadwick and Sharma1997; Gosse et al., Reference Gosse, Evenson, Klein, Sorenson and Easterbrook2003; Dahms et al., Reference Dahms, Egli, Brandova, de Castro Portes, Fabel, Harbor and Christl2018; Egli et al., Reference Egli, Dahms, Dumitrescu, Derachshan-Babaei, Christl and Tikhomirov2020). The uncertainty of previous age calculations is mainly due to poor geomorphic preservation of Sacagawea Ridge till units, differences in heights of boulders (reflecting variation in depths of burial and rates of moraine erosion), and the estimated rate(s) of boulder-surface weathering used for the cosmogenic exposure-age calculations, for which uncertainty increases with boulder age (Gosse and Phillips, Reference Gosse and Phillips2001; Gosse et al., Reference Gosse, Evenson, Klein, Sorenson and Easterbrook2003).
For this study, we report the analyses of new exposures of Lava Creek fall ash and reworked ash from the Airport Terrace above the Middle Popo Agie River in Lander, Wyoming (Figs. 1 and 2). A previous exposure of this ash was earlier identified as a sequence of Lava Creek A and B ashes (Hausel and Love, Reference Hausel, Love, Frost and Roberts1991; Jaworowski Reference Jaworowski1992, Reference Jaworowski, Keefer, Metzger and Godwin1993); but the locality was destroyed in the early 2000s prior to further confirmation. Our analyses of the new exposures allow us to (1) re-confirm that the ash is Lava Creek in origin, from the most recent eruption of the Yellowstone caldera complex; (2) show that only the Lava Creek ‘A’ component is present here; and (3) identify the terrace alluvium containing the ash as glacial outwash that originally graded to the terminus of the Sacagawea Ridge valley glacier in the Middle Popo Agie basin (Dahms et al., Reference Dahms, Egli, Brandova, de Castro Portes, Fabel, Harbor and Christl2018). Finally, we present exposure ages from boulders on previously identified Sacagawea Ridge moraines that, combined with the terrace–moraine correlation, more securely constrain the Sacagawea Ridge glaciation of the Wind River Mountains to MIS 16 (ca. 690–630 ka; Lisiecki and Raymo, Reference Lisiecki and Raymo2005; Gibbard and Cohen, Reference Gibbard and Cohen2019). The identification of an episode of alpine glaciation in the U.S. Rocky Mountains during MIS 16 coincides with evidence from Nebraska and western Iowa of the U.S. midcontinent (Balco and Rovey, 2010; Rovey and McLouth, Reference Rovey and McLouth2015) for an MIS 16 advance of the Laurentide Ice Sheet.
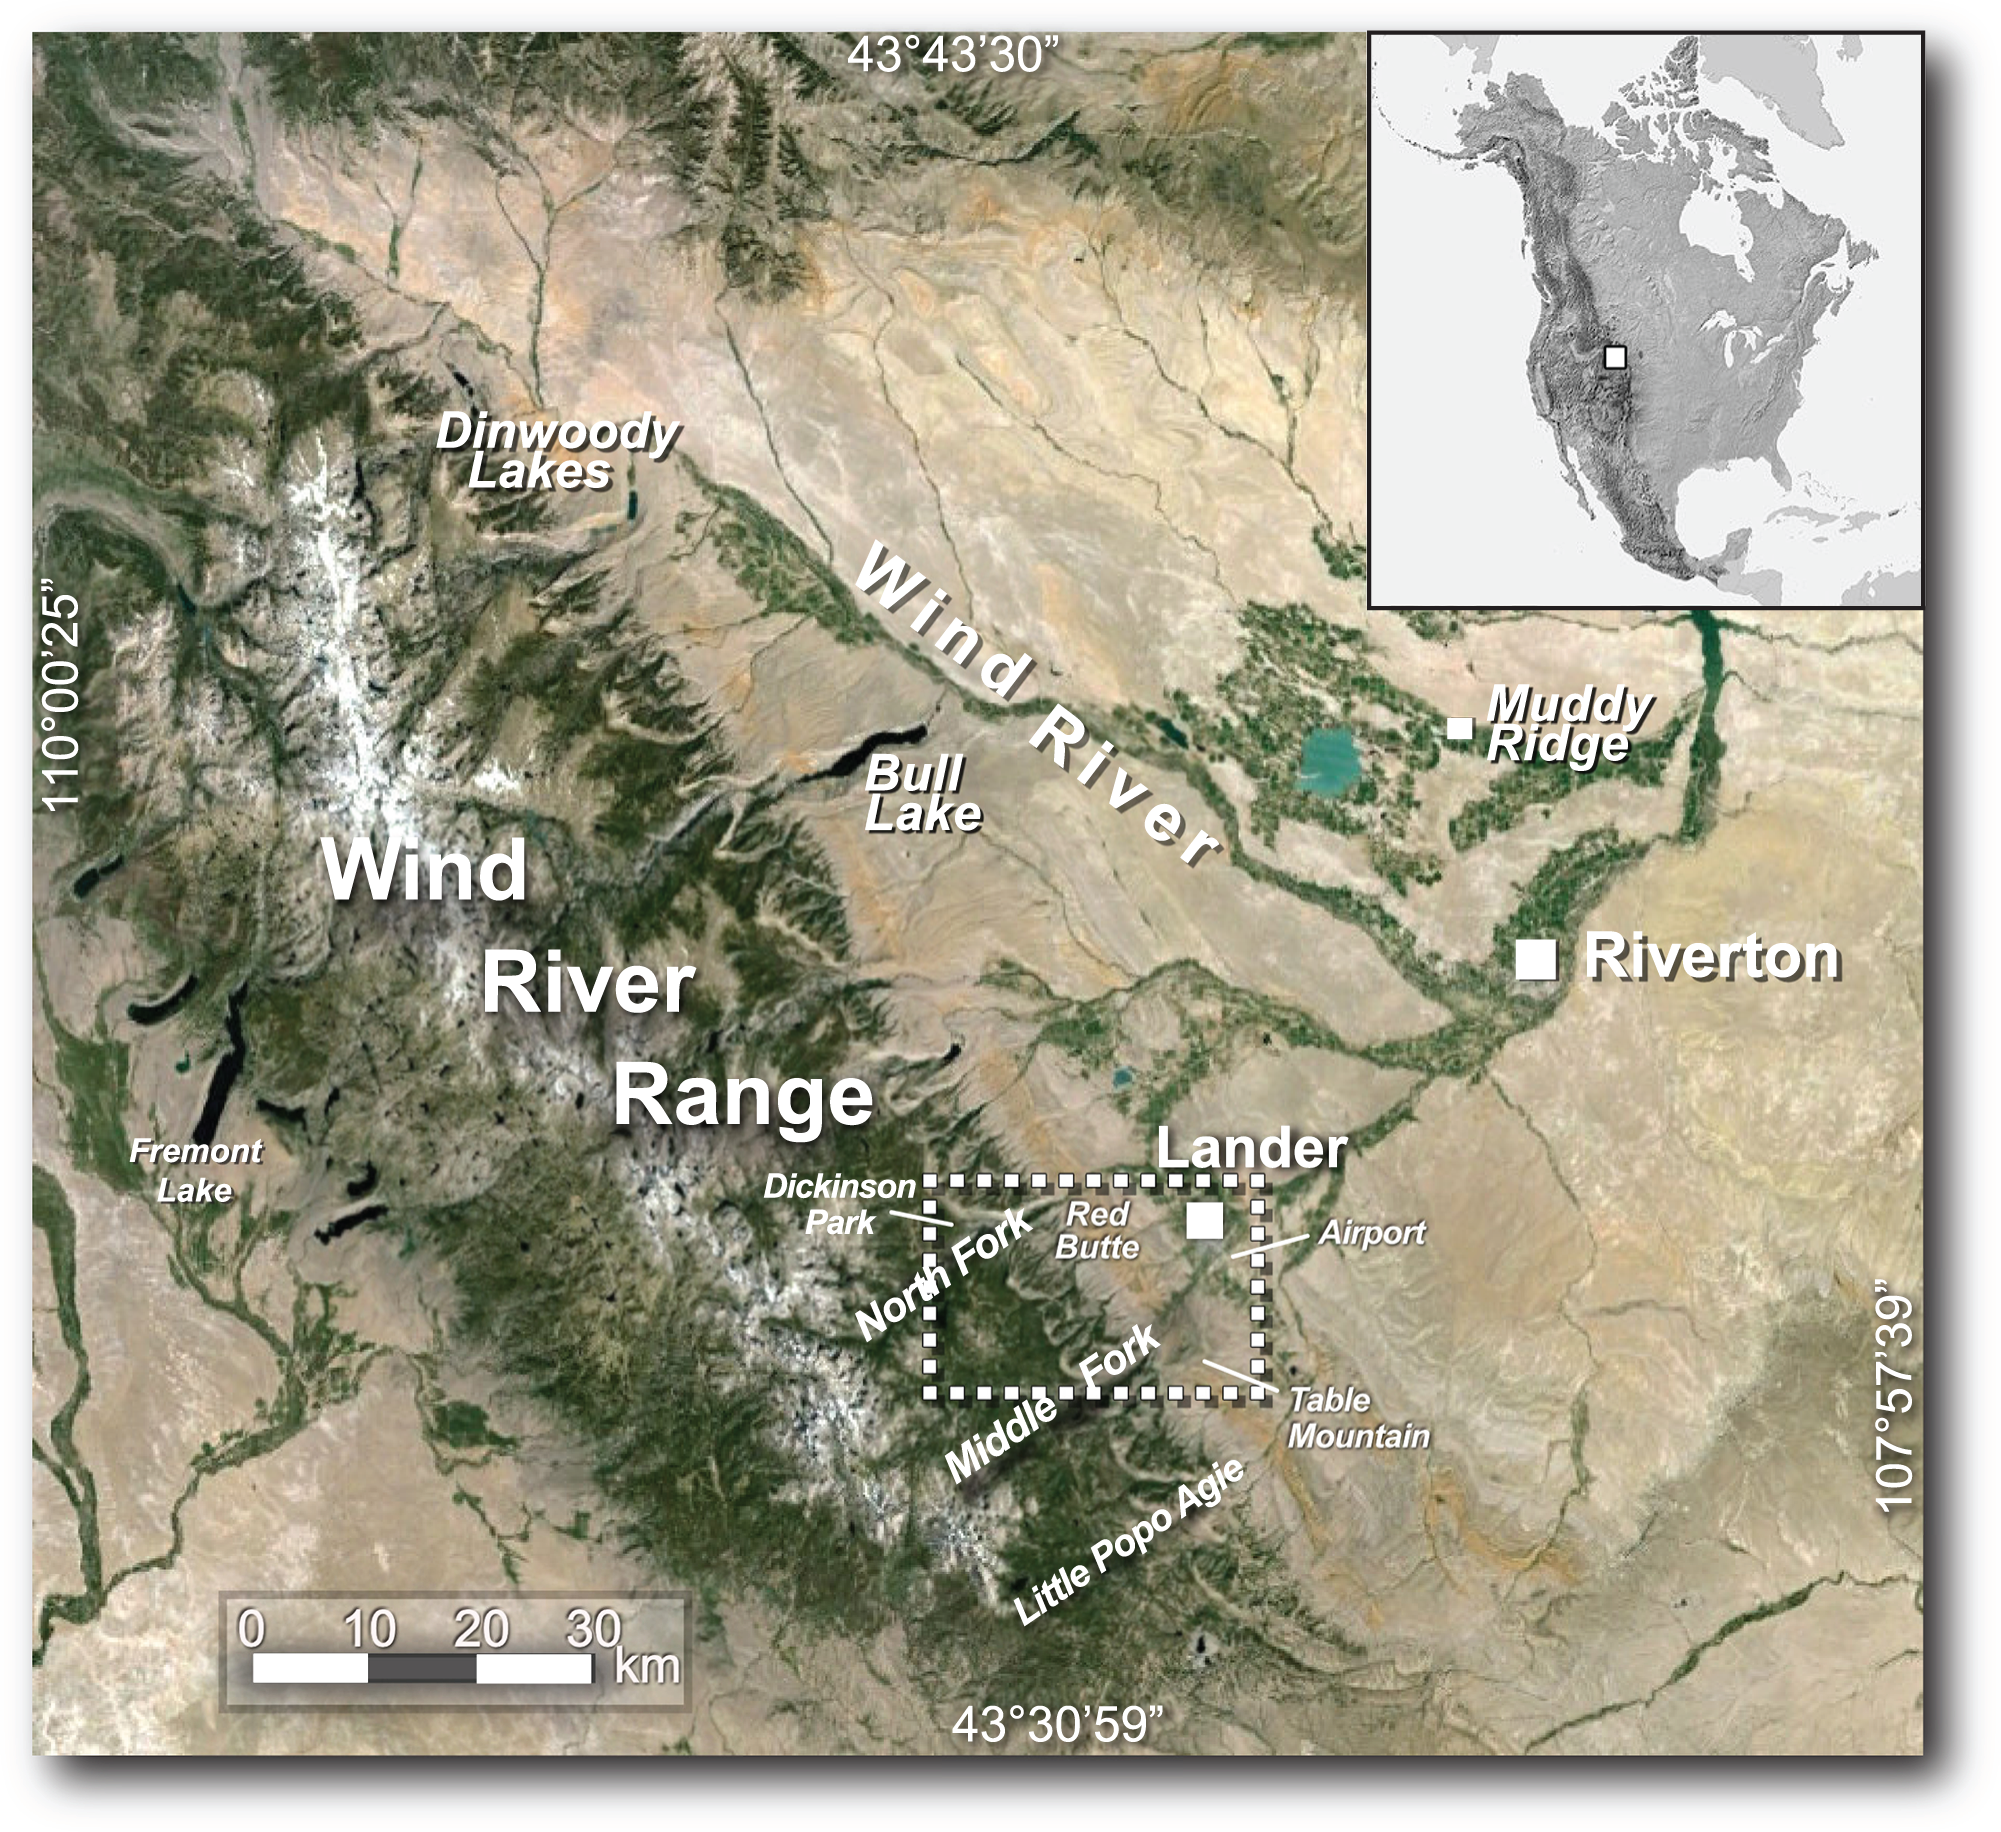
Figure 1. Location map of the study region of west-central Wyoming showing the Wind River Mountains and the Wind River with its tributary systems. Note the locations of the town of Lander and the three tributaries of the Popo Agie River at the southeastern slope of the mountains. Dashed white rectangle indicates the area of the Middle Popo Agie River covered in this study. Also note the localities of Dinwoody Lakes and Bull Lake along the Wind River as well as the Muddy Ridge locality.
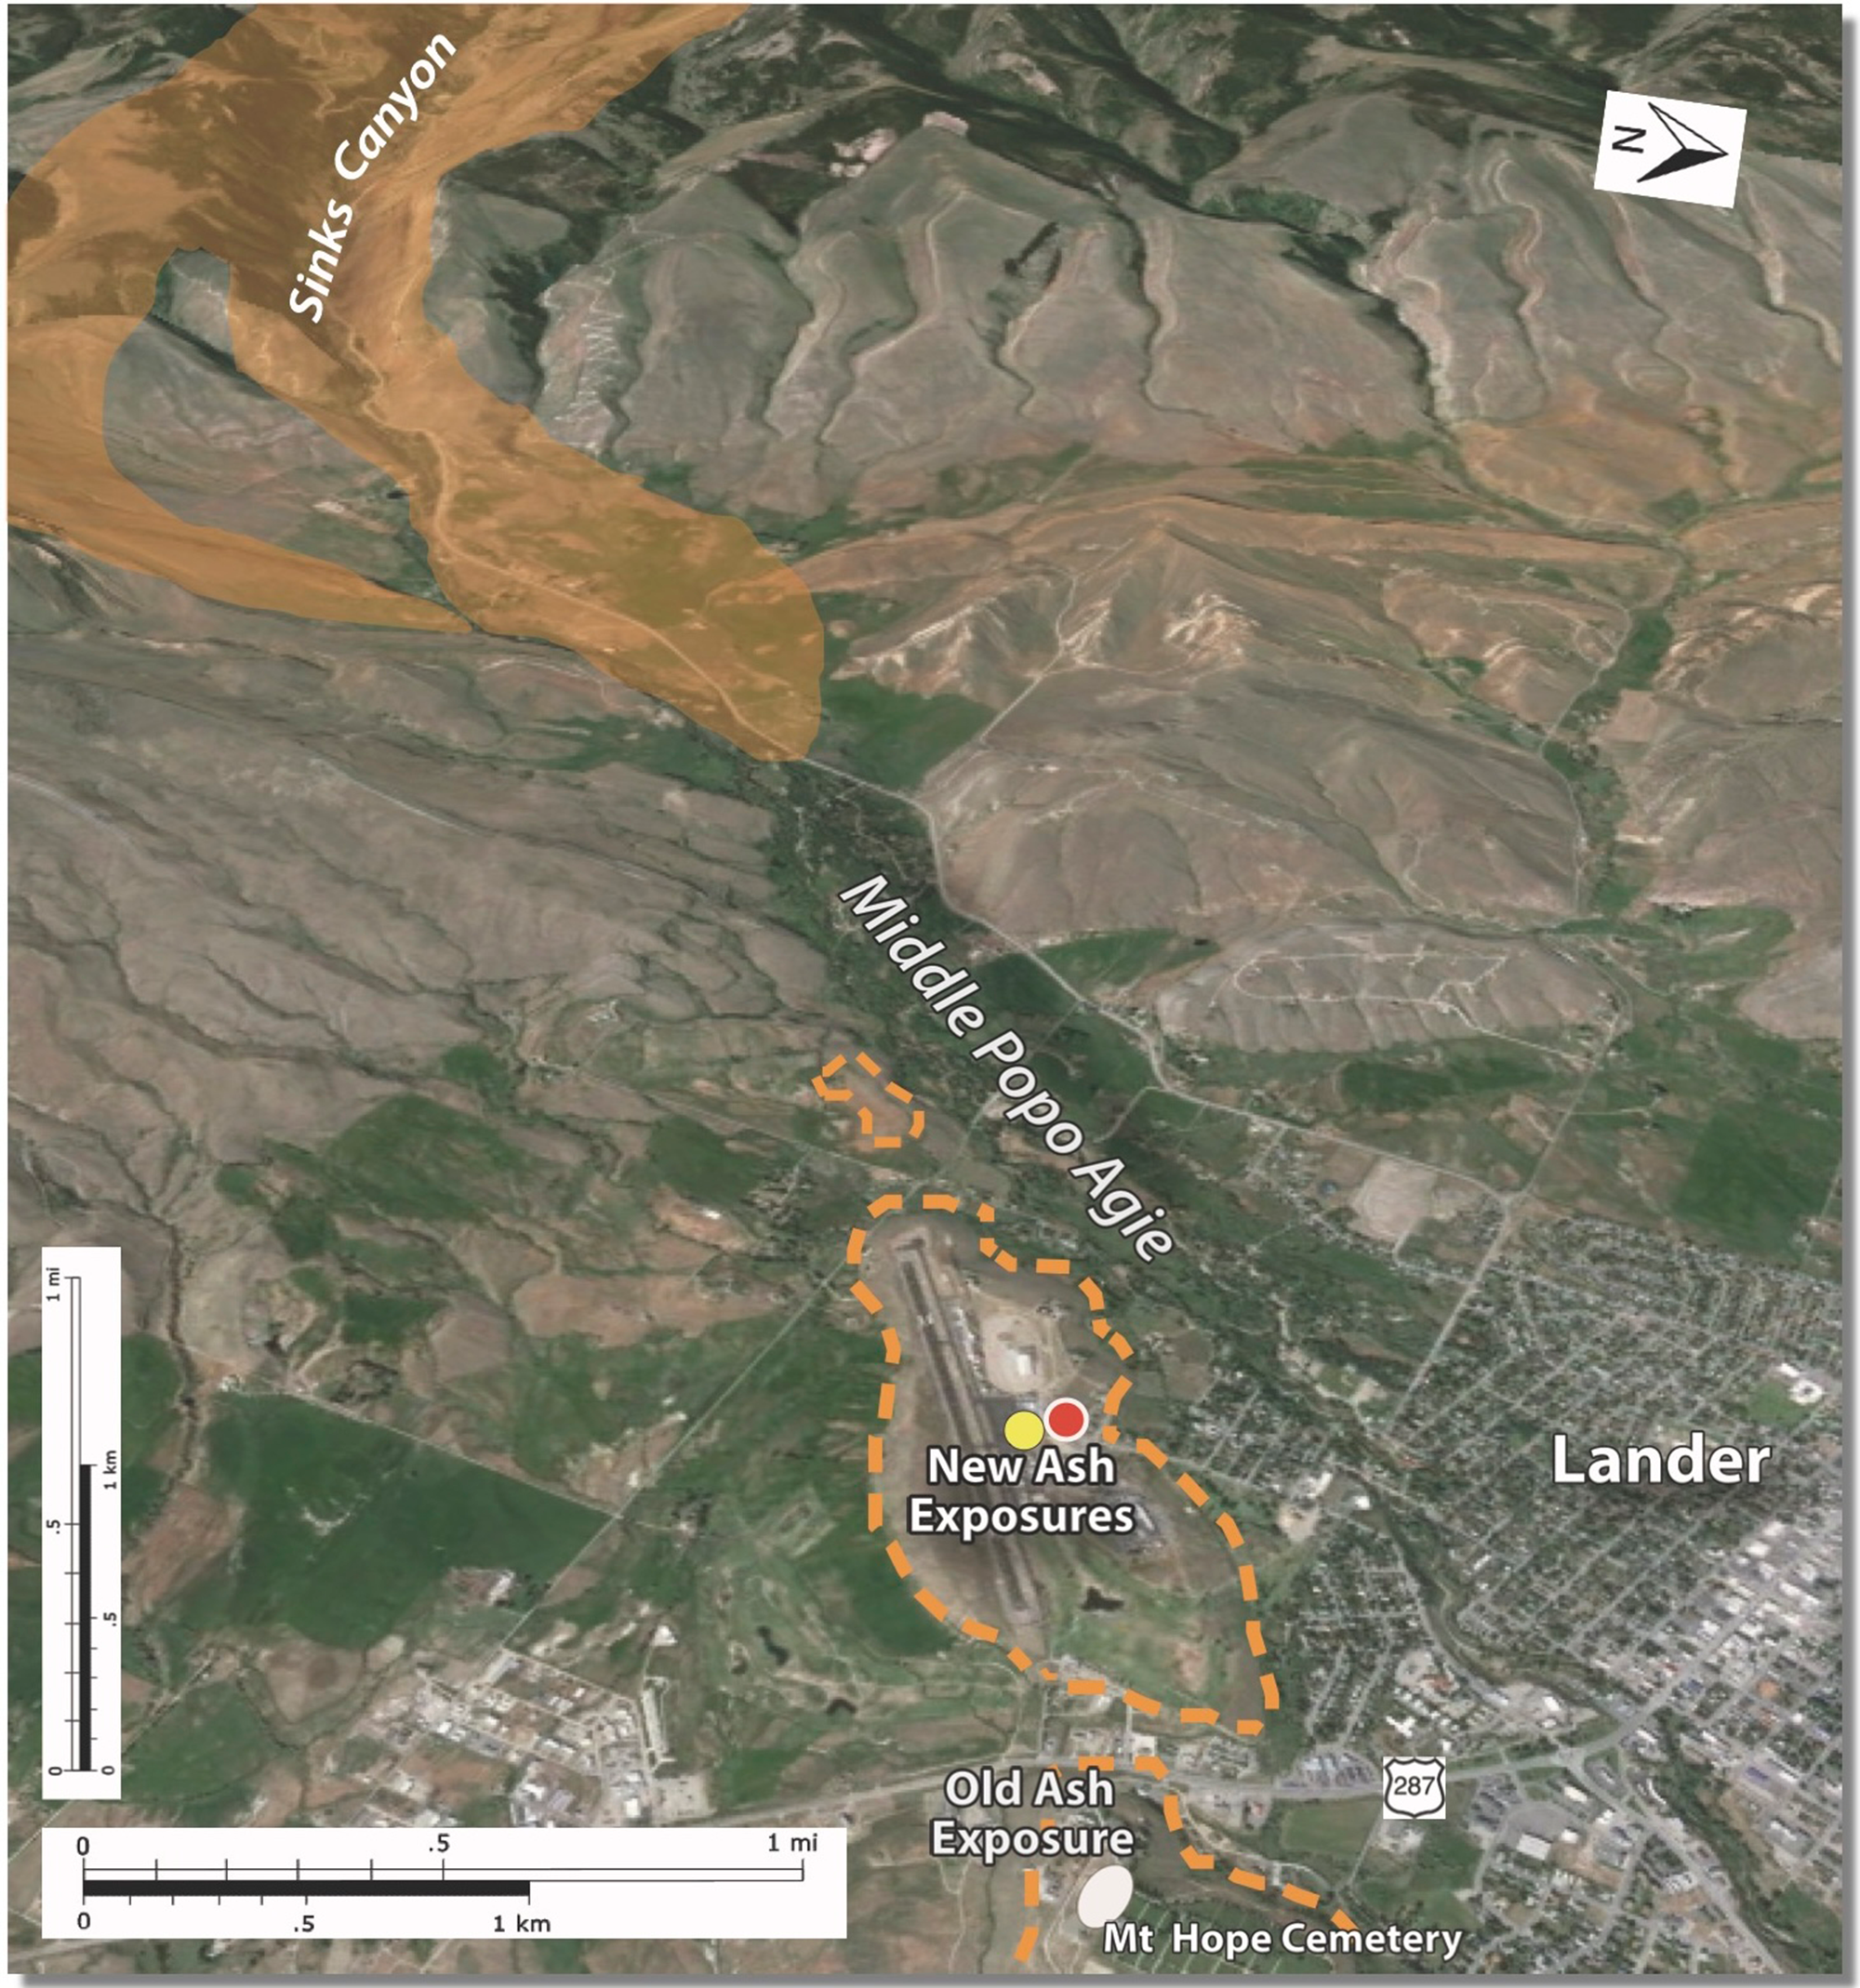
Figure 2. Southwesterly oblique view of the Middle Fork Popo Agie valley and Lander, showing the location and geographic context of the Lander Airport and the ash exposures. Extent of the Airport Terrace is shown in dashed orange. The yellow dot indicates the fall-ash outcrop. The red dot indicates the soil profiles exposing reworked ash. The white oval (bottom) shows the location of the previously reported (now destroyed) ash exposure (Hausel and Love, Reference Hausel, Love, Frost and Roberts1991; Jaworowski, Reference Jaworowski1992, Reference Jaworowski, Keefer, Metzger and Godwin1993) at the southwestern margin of Mt. Hope Cemetery. The orange shading approximates the extent of previously mapped deposits attributed to the Sacagawea Ridge glaciation (Dahms et al., Reference Dahms, Egli, Brandova, de Castro Portes, Fabel, Harbor and Christl2018).
Background
Yellowstone ash in the Wind River Basin
Several localities across the western United States represent regionally distributed ashfall deposits produced by major caldera eruptions. These include (but are not limited to) the Bishop Ash (Long Valley Caldera, California; Bailey et al., Reference Bailey, Dalrymple and Lanphere1976), two Bandelier ashes (Valles Caldera, New Mexico; Izett et al., Reference Izett, Obradovish, Naeser and Cebula1981; Smith, Reference Smith1987), the Mazama ash (Crater Lake, Oregon; Bacon, Reference Bacon1983), and the three Quaternary tuff/ashfall deposits of the Yellowstone Caldera, Wyoming (Christiansen, Reference Christiansen2001). The major Quaternary tuff and ashfall units traced to the Yellowstone Caldera have been differentiated by previous workers (see Christiansen, Reference Christiansen2001) as the Huckleberry Ridge (ca. 2.01 Ma), Mesa Falls (1.27 Ma), and Lava Creek (ca. 631 ka; Matthews et al., Reference Matthews, Vazquez and Calvert2015). Each is identified by its unique mineralogical and geochemical characteristics (Izett, Reference Izett1981; Izett et al., Reference Izett, Obradovish, Naeser and Cebula1981, Reference Izett, Pierce, Naeser and Jaworowski1992; Christiansen, Reference Christiansen2001; Matthews et al., Reference Matthews, Vazquez and Calvert2015). Ashfall deposits from these eruptions subsequently have been used to interpret chronostratigraphy and tectonic development across the western U.S. (e.g., Hildreth and Mahood, Reference Hildreth and Mahood1985; Gustavson et al., Reference Gustavson, Baumgartner, Caran, Holliday, Mehnert, Reeves and Morrison1991; Jaworowski, Reference Jaworowski1992, Reference Jaworowski, Keefer, Metzger and Godwin1993; Dethier, Reference Dethier2001; Lanphere et al., Reference Lanphere, Champion, Christianson, Izett and Obradovich2002; Anders et al., Reference Anders, Saltzman and Hemming2009).
The Lava Creek eruption of the Yellowstone Caldera is known to have yielded two ignimbrites, Lava Creek A and B, each underlain by ashfall deposits that extended far beyond the edges of the ignimbrites. Known outcrops of Lava Creek B ash are distributed over much of the western USA, whereas the known extent of Lava Creek A ashfall is limited to northern Wyoming. The western Wind River Basin alone contains at least six localities where ashfall deposits of Lava Creek A ash are directly overlain by Lava Creek B ash (Jaworowski, Reference Jaworowski1992, Reference Jaworowski, Keefer, Metzger and Godwin1993; Izett, Reference Izett1981; Izett et al., Reference Izett, Pierce, Naeser and Jaworowski1992). Early estimates of the original geographic extent of the Lava Creek A ashfall deposit (Izett, Reference Izett1981; Izett and Wilcox, Reference Izett and Wilcox1982; estimates still used today) were based on two localities: one in Bighorn County, Wyoming (3 cm of Lava Creek A under 2 m of Lava Creek B) and the other at the Muddy Ridge locality west of Shoshone, Wyoming (30 cm of Lava Creek A ashfall under 3 m of Lava Creek B ashfall; Izett and Wilcox, Reference Izett and Wilcox1982). Additionally, the ‘A’ component of the Lava Creek eruptive sequence is known to be differentially preserved in terraces along the major tributaries of the Wind River (Popo Agie, Little Wind, Muddy Creek), while Lava Creek B ash apparently is preserved only in the WR-7 terraces of the main Wind River (Jaworowski, Reference Jaworowski, Keefer, Metzger and Godwin1993; Chadwick et al., Reference Chadwick, Hall and Phillips1997). The cause of the differential preservation was thought to involve variations in discharge and competence between the Wind River and its tributaries, likely due to the tributaries’ positions as the constraining conduits for glacial meltwater discharged through their deep, narrow canyons (Jaworowski, Reference Jaworowski, Keefer, Metzger and Godwin1993).
Ash within the Airport Terrace at Lander was initially reported by Hausel and Love (Reference Hausel, Love, Frost and Roberts1991) from an exposure reported to exhibit both the Lava Creek A and B ashfalls (Fig. 3d). The ash was reported to be “… relatively pure, 5 to 10 feet thick … and interbedded with fluvial gravels on a terrace ca. 140 feet above the Middle Popo Agie River” (Hausel and Love, Reference Hausel, Love, Frost and Roberts1991, p. 181). Identification of this locality was later expanded upon by Jaworowski (Reference Jaworowski1992, Reference Jaworowski, Keefer, Metzger and Godwin1993). The original exposure was located on the southwestern margin of Mt. Hope Cemetery (Fig. 2; hereafter termed the Cemetery locality, Lander 7.5′ USGS quadrangle; NW1/4, NE1/4, Sec 20, T33N, R99W; 42°49′30.07″N; 108°42′41.01″W). Unfortunately, this locality was destroyed before its provenance as either Lava Creek A or B (or both) could be identified with certainty (Anders et al., Reference Anders, Saltzman and Hemming2009), although a ∼20-cm lens of ash is still occasionally encountered beneath the surface of the cemetery (Mt. Hope Cemetery staff, personal communication, September 2021). Reanalysis of a sample of the original ash by Anders et al. (Reference Anders, Saltzman and Hemming2009, Table 2, sample LLCA2) by major- and trace-element geochemistry reconfirmed the Cemetery ash as Lava Creek, but it was not positively identified as either A or B.
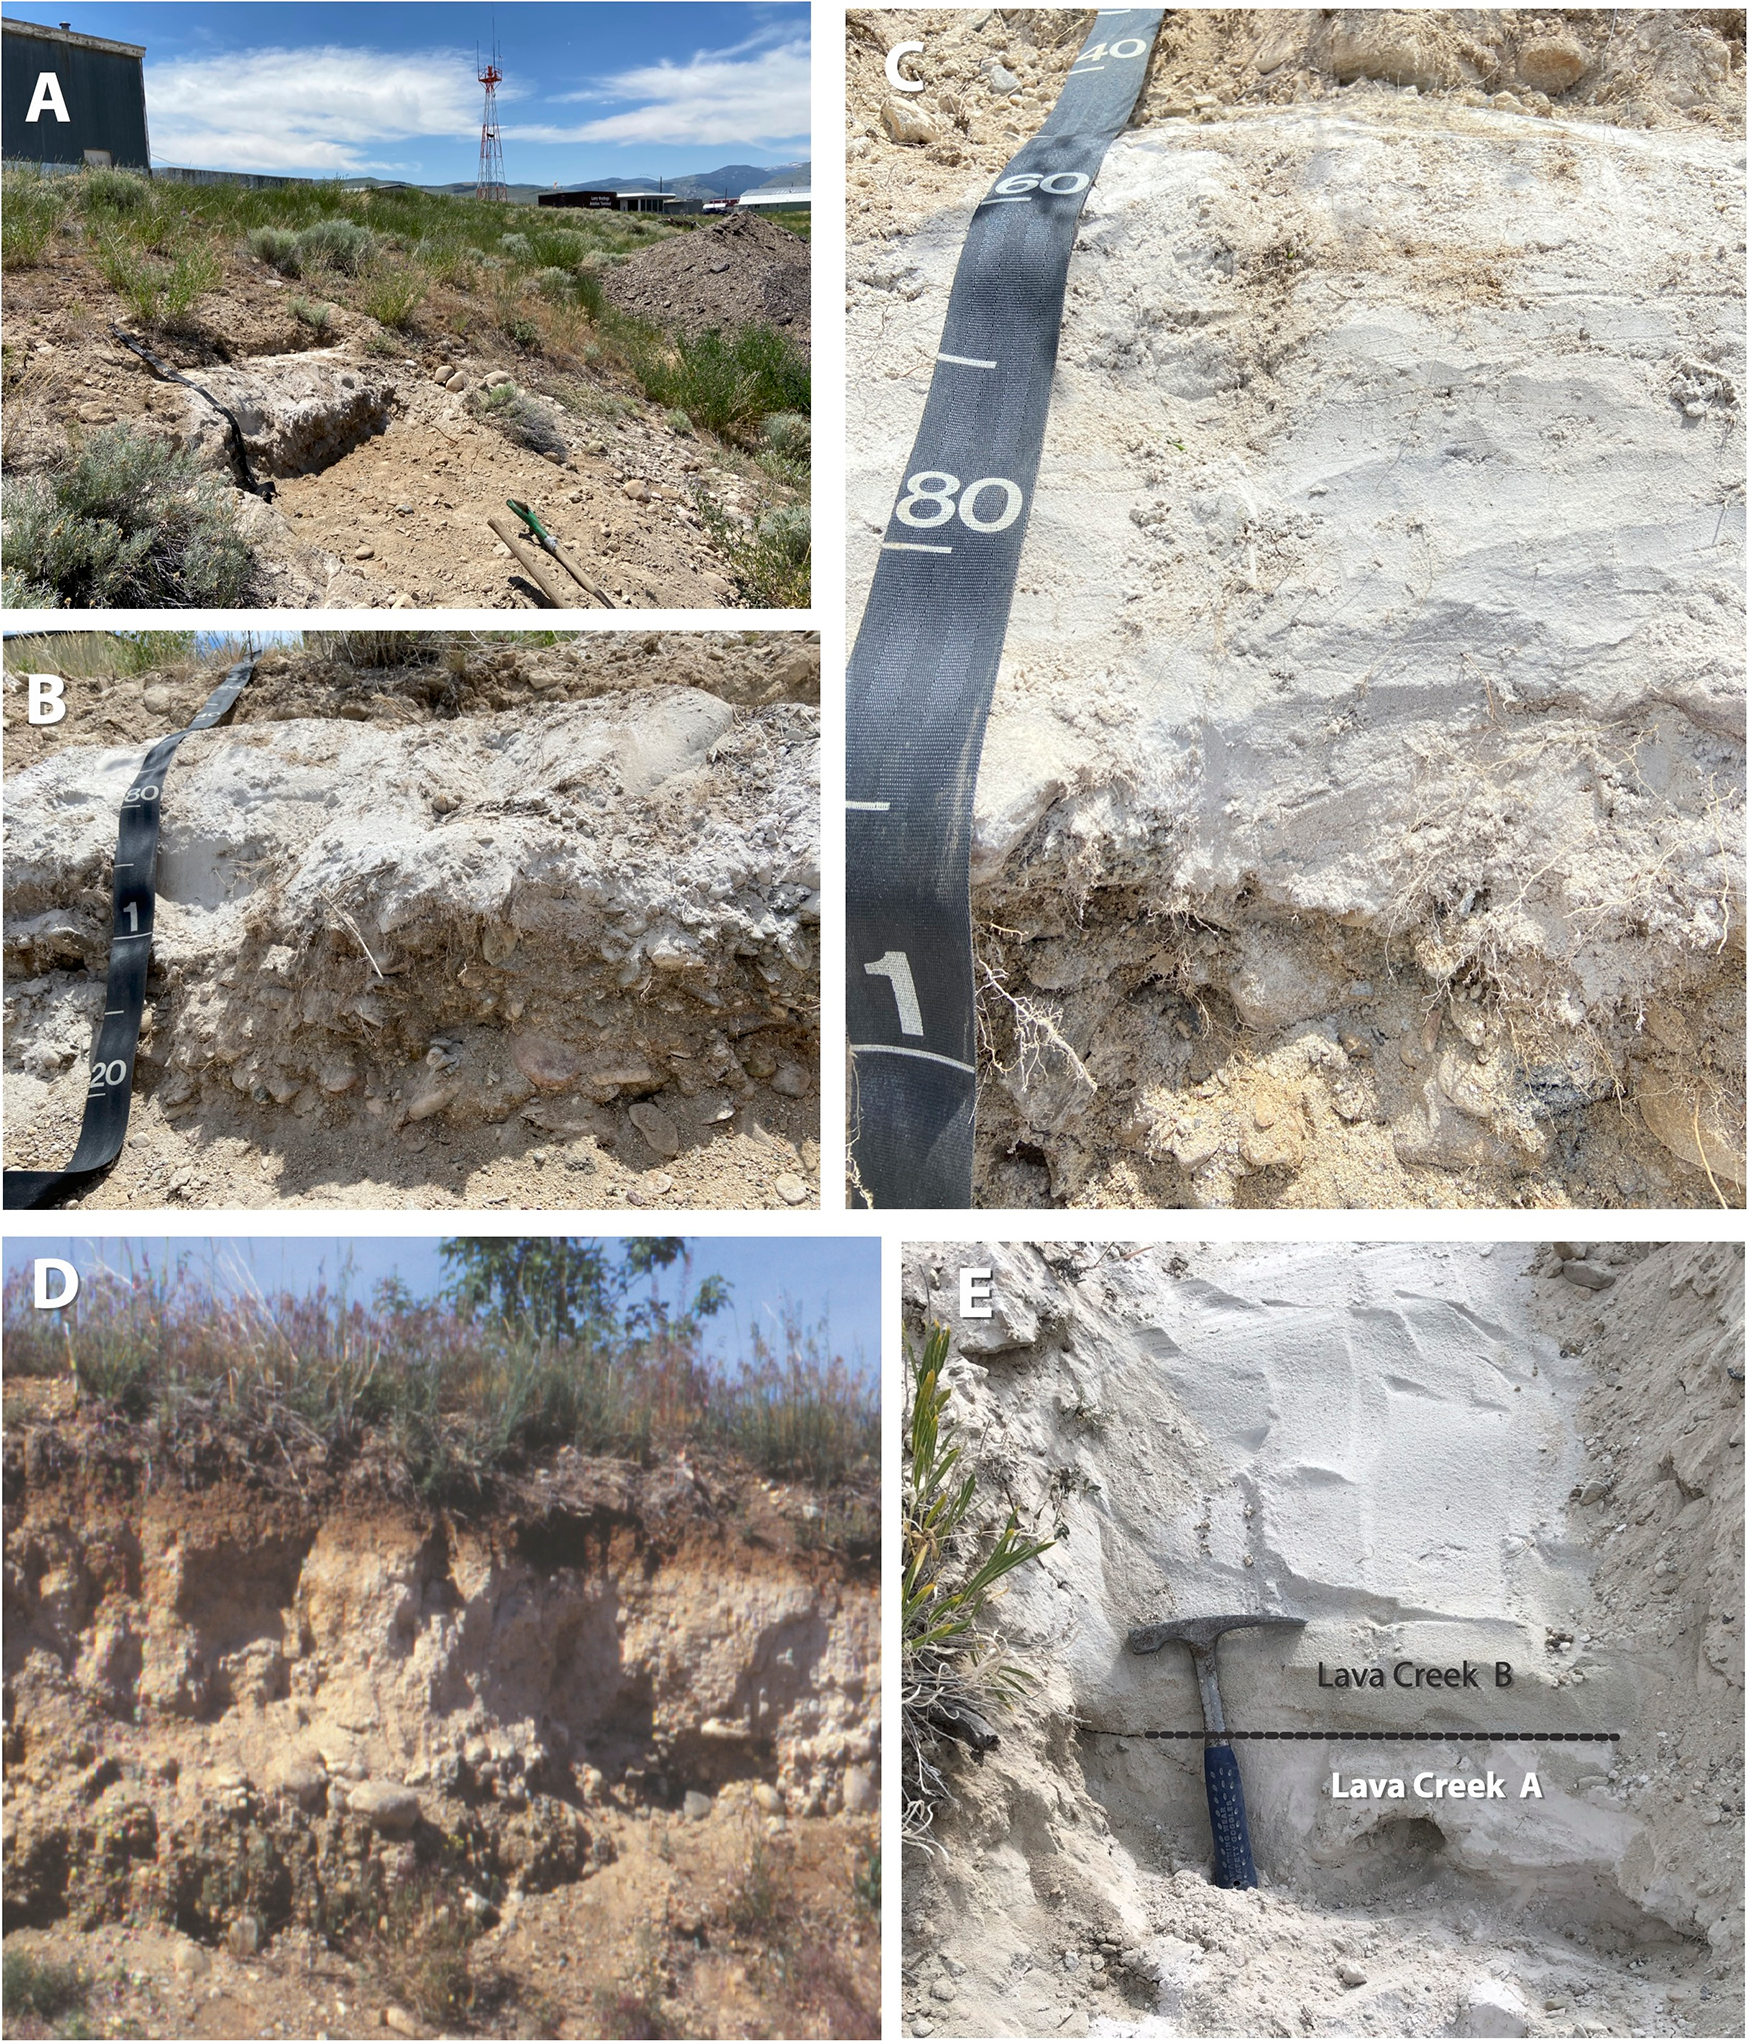
Figure 3. (A–C) Lava Creek fall-ash deposits exposed in the Lander Airport terrace (Figure 2, yellow dot). (A) View to SSW of the fall-ash locality along the south slope of the Lander Street Department storage area showing a corner of an airport hangar and light tower. (B) Close view of the fall ash enclosed in the terrace’s coarse cobble and gravel alluvium. (C) View of the fall ash showing lack of sedimentary structure, indicating this exposure probably has not been reworked. (D) Original ash exposure described by Hausel and Love (Reference Hausel, Love, Frost and Roberts1991) and Jaworowski (Reference Jaworowski, Keefer, Metzger and Godwin1993) at Mt. Hope Cemetery. Note the position of the ash within the outwash gravels matching that of the above airport fall ash. (E) View of the bottom ∼1 m of the ashfall deposit at Muddy Ridge. Rock hammer is ∼34 cm. Photo D courtesy of Mark Anders; photo E by William McIntosh.
Previous age estimates for Sacagawea Ridge tills
Before cosmogenic radionuclide (CRN) ages became readily available, the various age(s) assigned to Sacagawea Ridge tills relied entirely on relative geomorphic relations and weathering characteristics among moraines (Richmond and Murphy, Reference Richmond and Murphy1965; Murphy and Richmond, Reference Murphy and Richmond1965; Richmond, Reference Richmond1973; Dahms, Reference Dahms2004), and more specifically on correlations to the WR7 terraces along the Wind River (Richmond and Murphy Reference Richmond and Murphy1989; Izett et al., Reference Izett, Pierce, Naeser and Jaworowski1992; Chadwick at al., Reference Chadwick, Hall and Phillips1997) and to the Lower Roberts and Cottonwood terraces along the Bighorn River and Rock Creek in the northern Bighorn Basin (Palmquist, Reference Palmquist1983; Reheis, Reference Reheis1987), all of which exhibit deposits of Lava Creek ash. Even these correlations remained ambiguous, because they were not shown to grade to a moraine front. Chadwick et al. (Reference Chadwick, Hall and Phillips1997) later suggested the possibility that the Sacagawea Ridge map units near Bull Lake might even pre-date the Lava Creek ash.
Cosmogenic radionuclide exposure ages from boulders on moraine units mapped as Sacagawea Ridge also have remained ambiguous (e.g., Gosse, Reference Gosse1994; Phillips et al., Reference Phillips, Zreda, Gosse, Klein, Evenson, Hall, Chadwick and Sharma1997; Gosse et al., Reference Gosse, Evenson, Klein, Sorenson and Easterbrook2003) due mainly to the weathered nature of different boulder lithologies, uncertain boulder burial histories, and the uncertain nature of weathering rate estimates. Phillips et al. (Reference Phillips, Zreda, Gosse, Klein, Evenson, Hall, Chadwick and Sharma1997) reported a combined 36Cl–10Be exposure age of greater than 272 ka for a boulder at the Sacagawea Ridge type locality at Dinwoody Lakes and maximum 10Be and 36Cl exposure ages of 150–350 ka from boulders on Sacagawea Ridge moraines at the Bull Lake type area. Gosse (Reference Gosse1994) reported a 10Be exposure age of greater than 307 ka from another boulder at the Sacagawea Ridge type locality at Dinwoody Lakes. Later (Gosse et al., Reference Gosse, Evenson, Klein, Sorenson and Easterbrook2003) reported several 10Be and 26Al exposure ages that varied between 135 and 400 ka (without corrections for weathering rates) from boulders on moraines mapped as Sacagawea Ridge near Fremont Lake (Richmond, Reference Richmond and Beus1987). They noted, however, that a correction of 0.35 cm/ky for erosion of the moraine encompassing the oldest boulder would yield an age close to 650 ka. 10Be boulder exposure ages of ca. 521–556 ka were recently reported from two separate Sacagawea Ridge moraines near Lander using estimates of boulder surface erosion of 1–2 mm/ky (Dahms et al., Reference Dahms, Egli, Brandova, de Castro Portes, Fabel, Harbor and Christl2018; Egli et al., Reference Egli, Dahms, Dumitrescu, Derachshan-Babaei, Christl and Tikhomirov2020; see Discussion).
Methods
Field sampling
Ash samples
The new ash exposures are located about 1.7 km southwest of the Cemetery locality (Fig. 2, red and yellow dots) along the NW boundary of the Lander airport (Lander 7.5′ USGS quadrangle, SE1/4, SE1/4, SW1/4, NE1/4, Sec. 19, T33N, R99W; 42°49′0.46″N; 108°43′49.28″W). We refer to these localities as the Airport ash localities. Both ash exposures occupy similar stratigraphic positions to the original cemetery exposure (Hausel and Love, Reference Hausel, Love, Frost and Roberts1991).
The deposit of fall ash (Fig. 3a–c) is ∼25 cm thick and is exposed on the north-facing slope created by the excavation of a dump/storage area for the Lander Public Works department, about 20 m north of an airport hangar (Fig. 2, yellow dot). The fall ash is ∼120–150 cm below the present terrace surface and is located within a deposit of large (15–30+ cm) stream cobbles in a matrix of coarse sand/gravel. Sediments ranging from ∼5-cm pebbles to silt and sand lie directly above the ash at this location (Fig. 3b and c).
We removed two samples from the fall ash for age and geochemical analyses. The deposit appears to be intact with no clear evidence of reworking by slopewash re-layering or burrowing (see Fig. 3c). Sample #2021-04 was taken directly at the top of the ash surface (Fig. 3c, 50–60 cm) in an attempt to identify the possible presence of Lava Creek B ash here. Sample #138-143 was taken from midway within the fall ash, ∼10 cm below the surface sample and 5–10 cm above the base of the ash exposure (Fig. 3c, ∼80 cm).
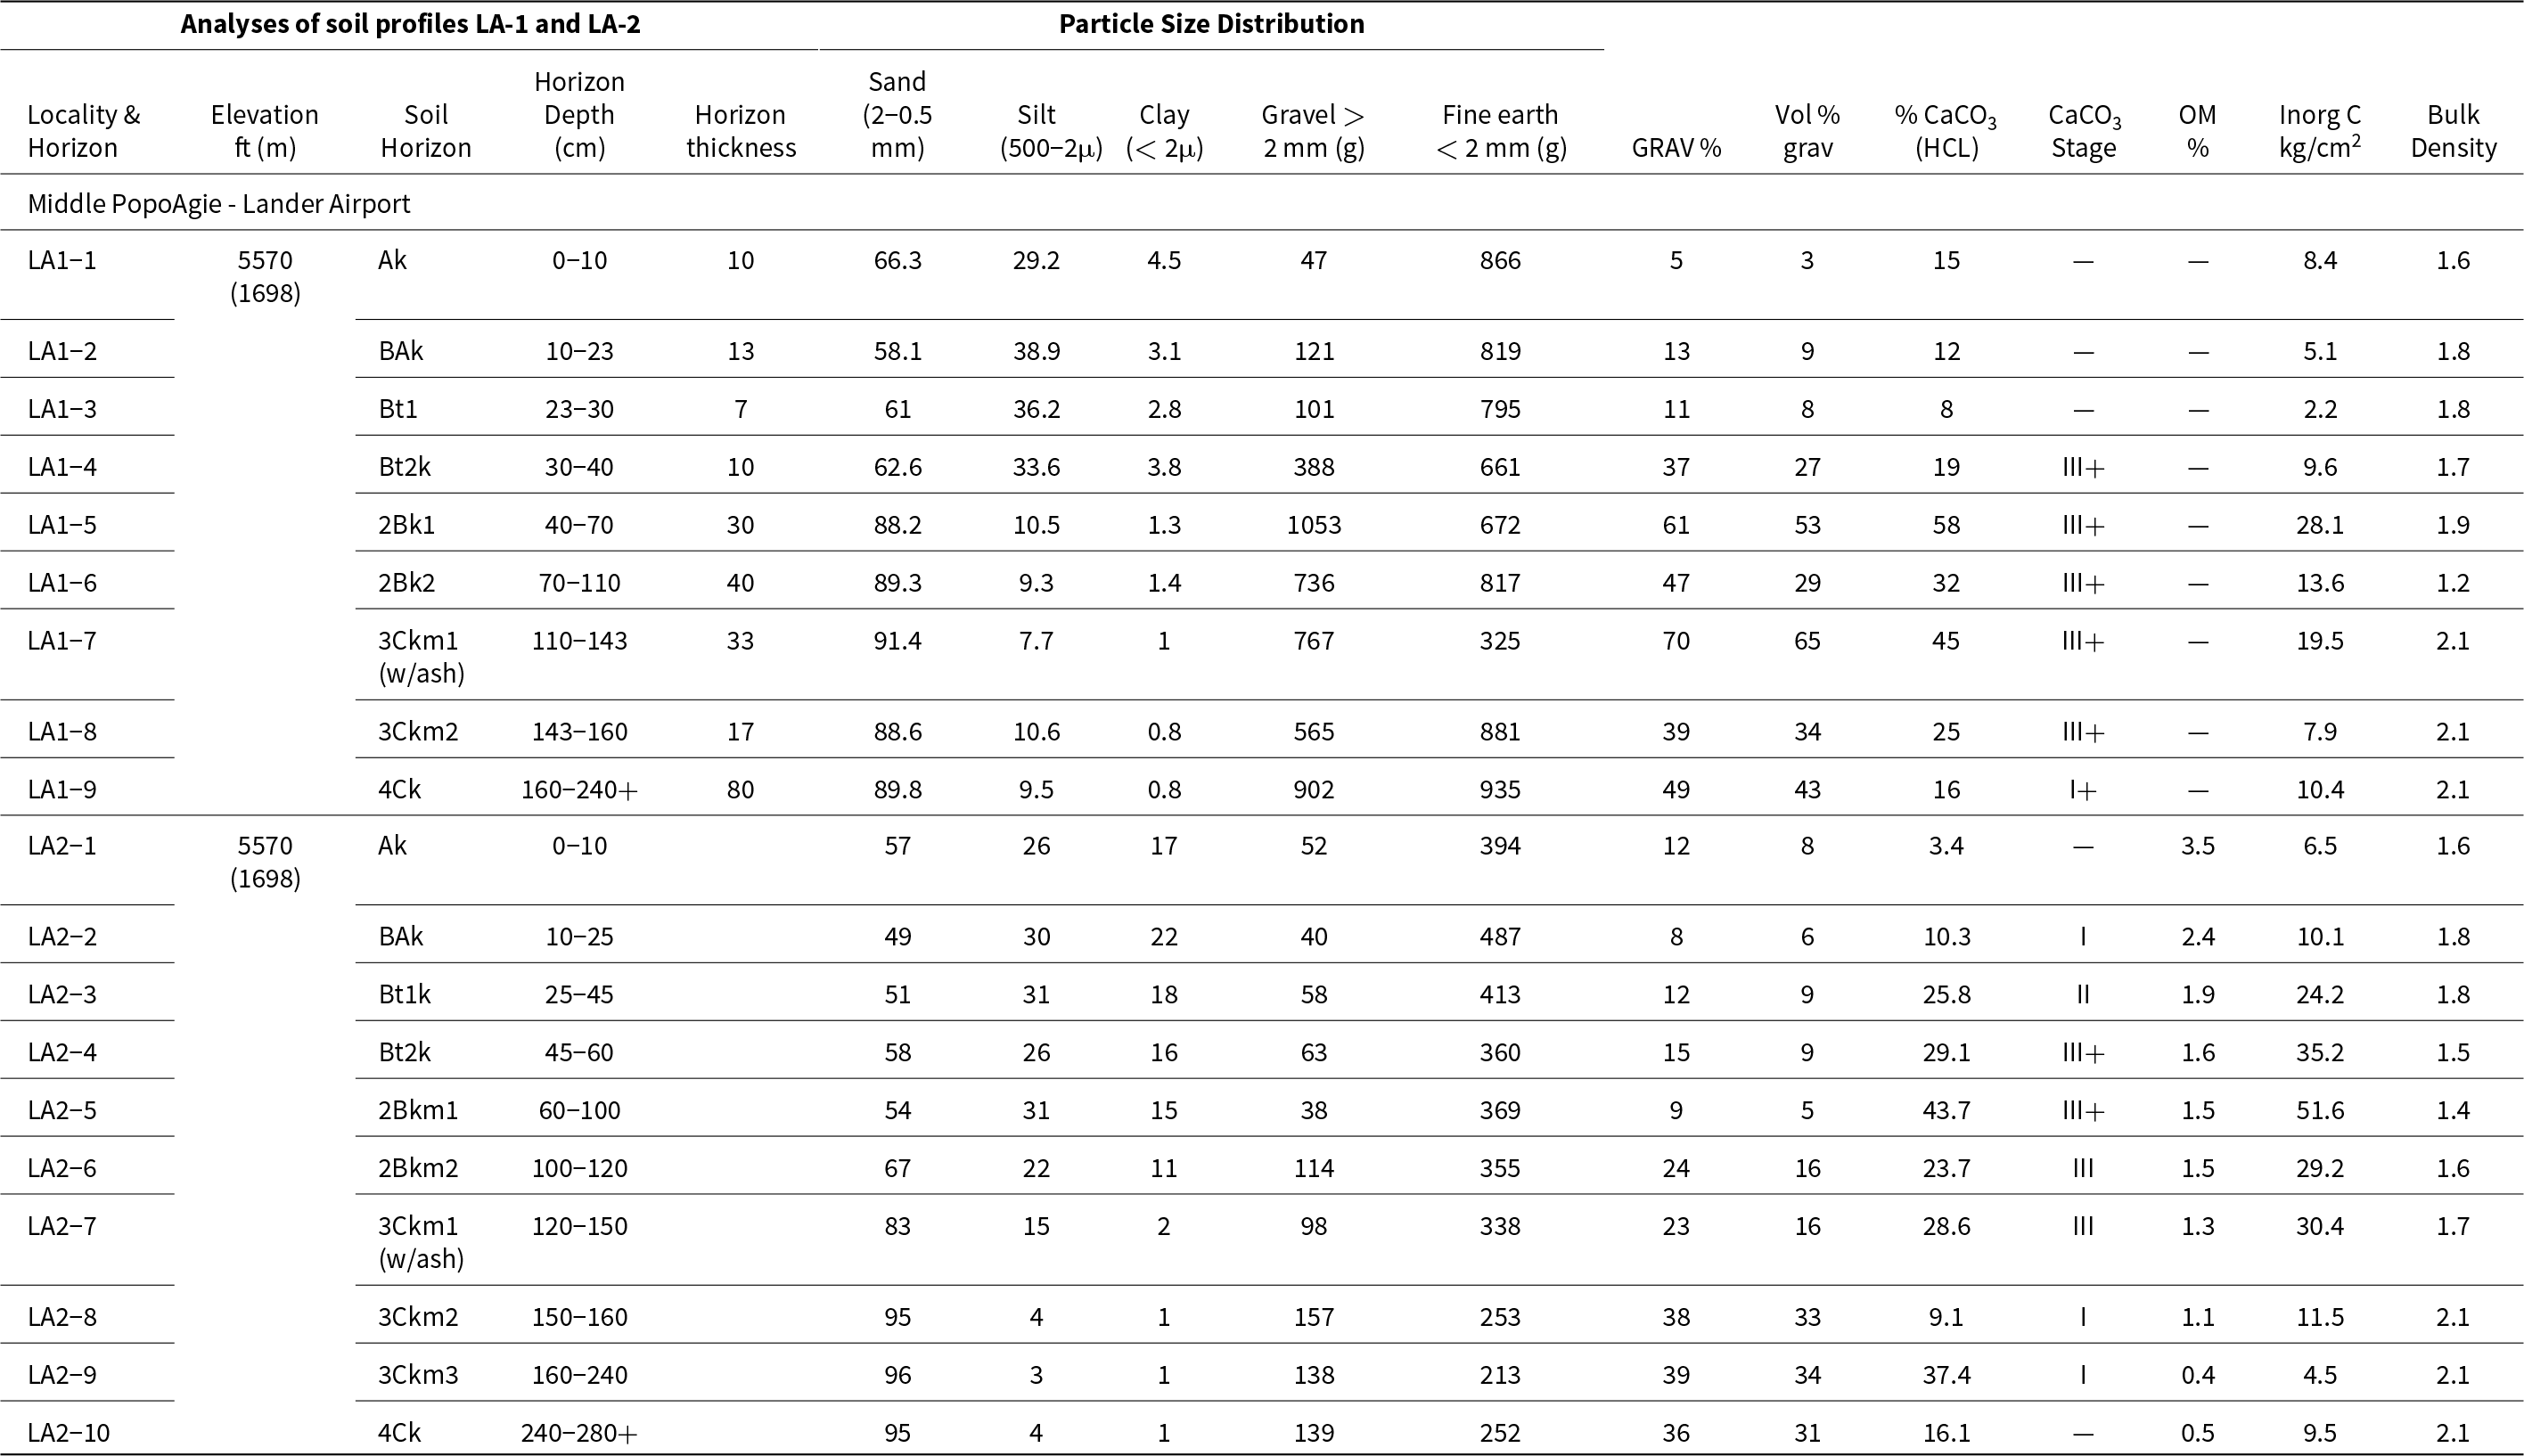
A second deposit, this of reworked ash, appears in the east-facing roadcut of Buena Vista Drive (Fig. 2, red dot; Fig. 4a), ∼200 m west of the above fall-ash locality. We exposed ∼10- to 15-cm-thick horizons of the reworked ash in two soil profiles, LA-1 and LA-2 (Fig. 4b and c), 130–145 cm below the terrace surface in each profile. The reworked ash horizons (Fig. 4b and c) are found within a matrix of gravelly sand within a deposit of stream cobbles admixed with pebbly/gravelly sand similar to the fall-ash locality. The horizons of reworked ash have been hardened by precipitates of both silica and pedogenic carbonate from subsequent phases of soil development (Soil Survey Staff, 2014). The bedded boulders, gravel, and coarse sand within which the reworked ash lies extends at least 3 m beneath and 20–30 cm above the ash horizons (Fig. 4b and c; Table 1). The stratigraphic correspondence between the fall-ash locality and the reworked ash in the soil profiles suggests that the location of the soil profiles was an active paleochannel of the Middle Popo Agie River during ash deposition, while the fall-ash locality was not. Although the reworked ash in the soil profiles was not geochemically analyzed for this study, both are macro- and microscopically comparable to the fall ash, except for the thicknesses and indurated nature of the reworked ash horizons.
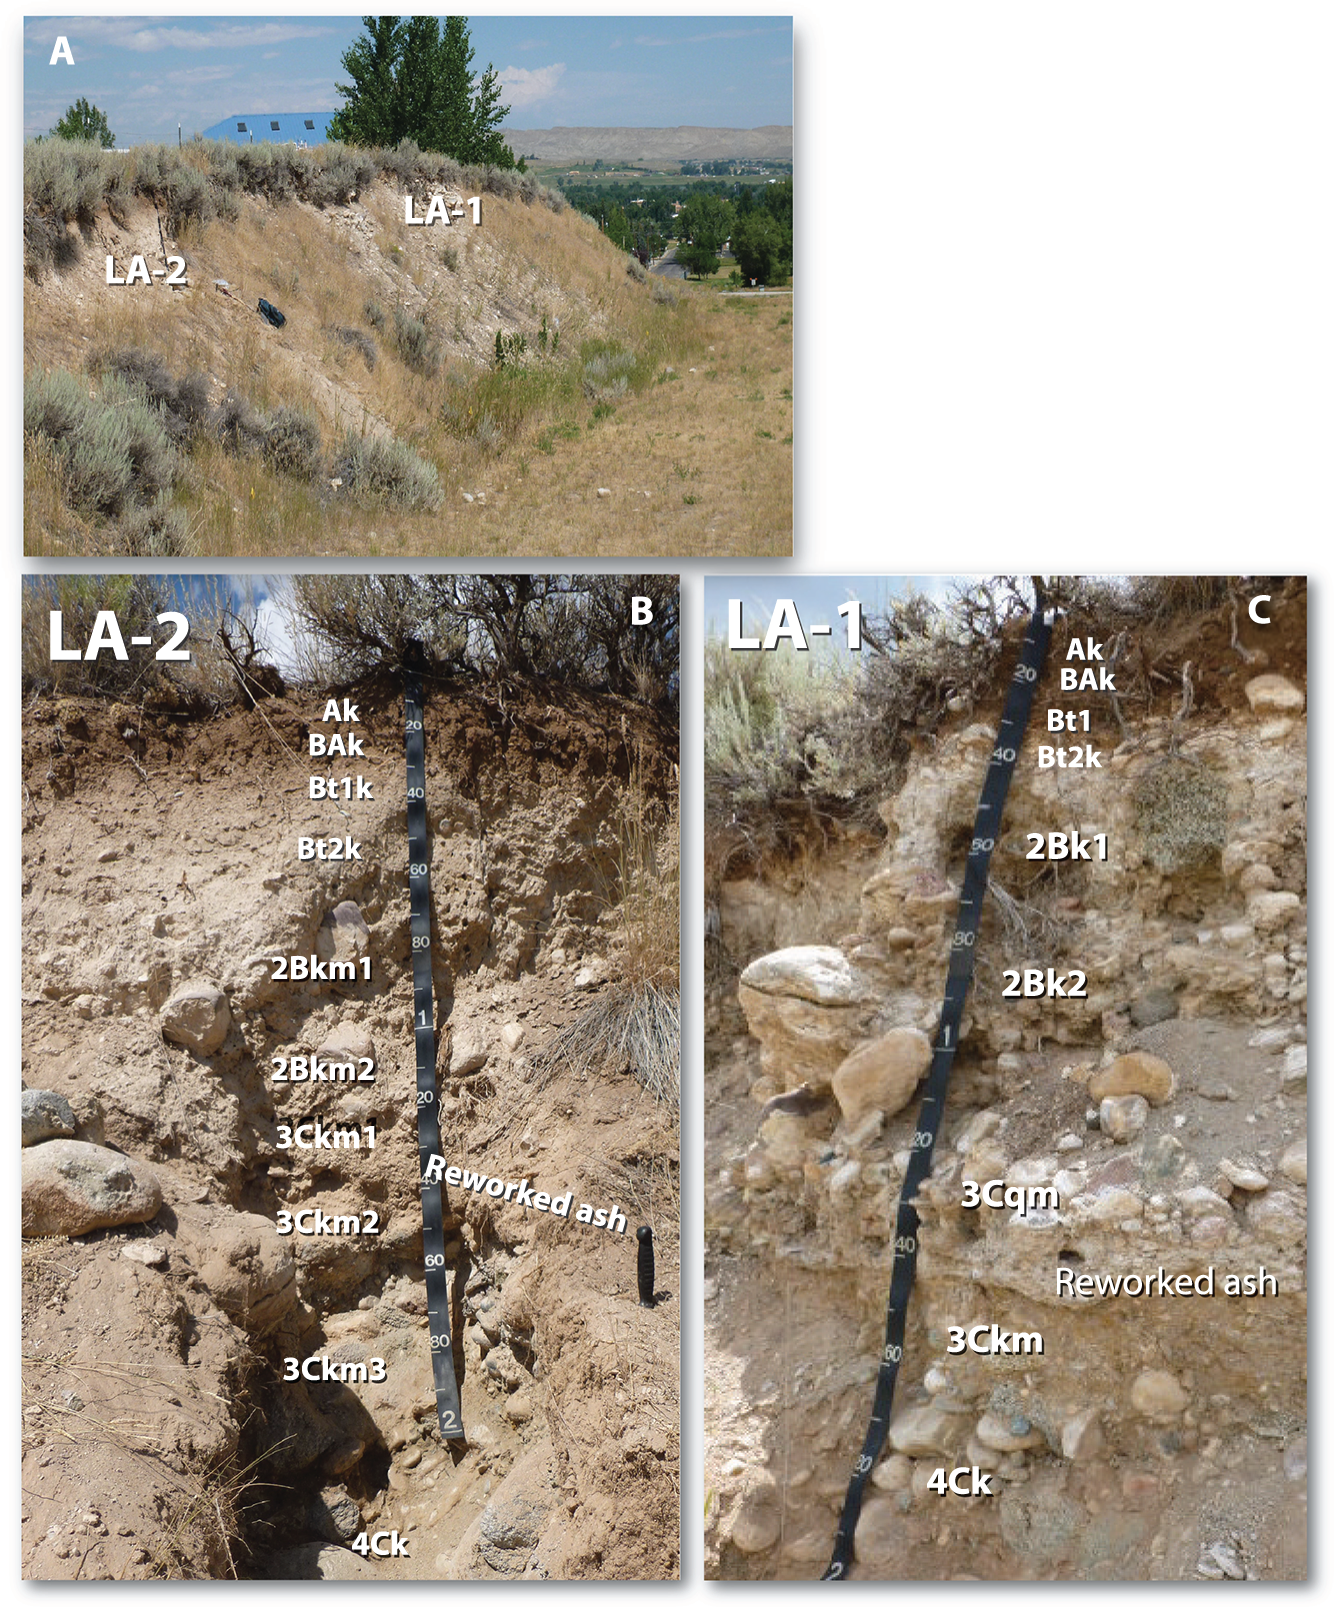
Figure 4. (A) View to north of soil profiles LA-1 and LA-2 along the northwestern boundary of the Lander Airport (red dot in Figure 2). (B, C) Details of LA-2 and LA-1 showing the horizons of reworked ash within the coarse outwash alluvium at ∼140 cm in each profile. Physical and chemical data are presented in tabular form in Tables 1 and 5.
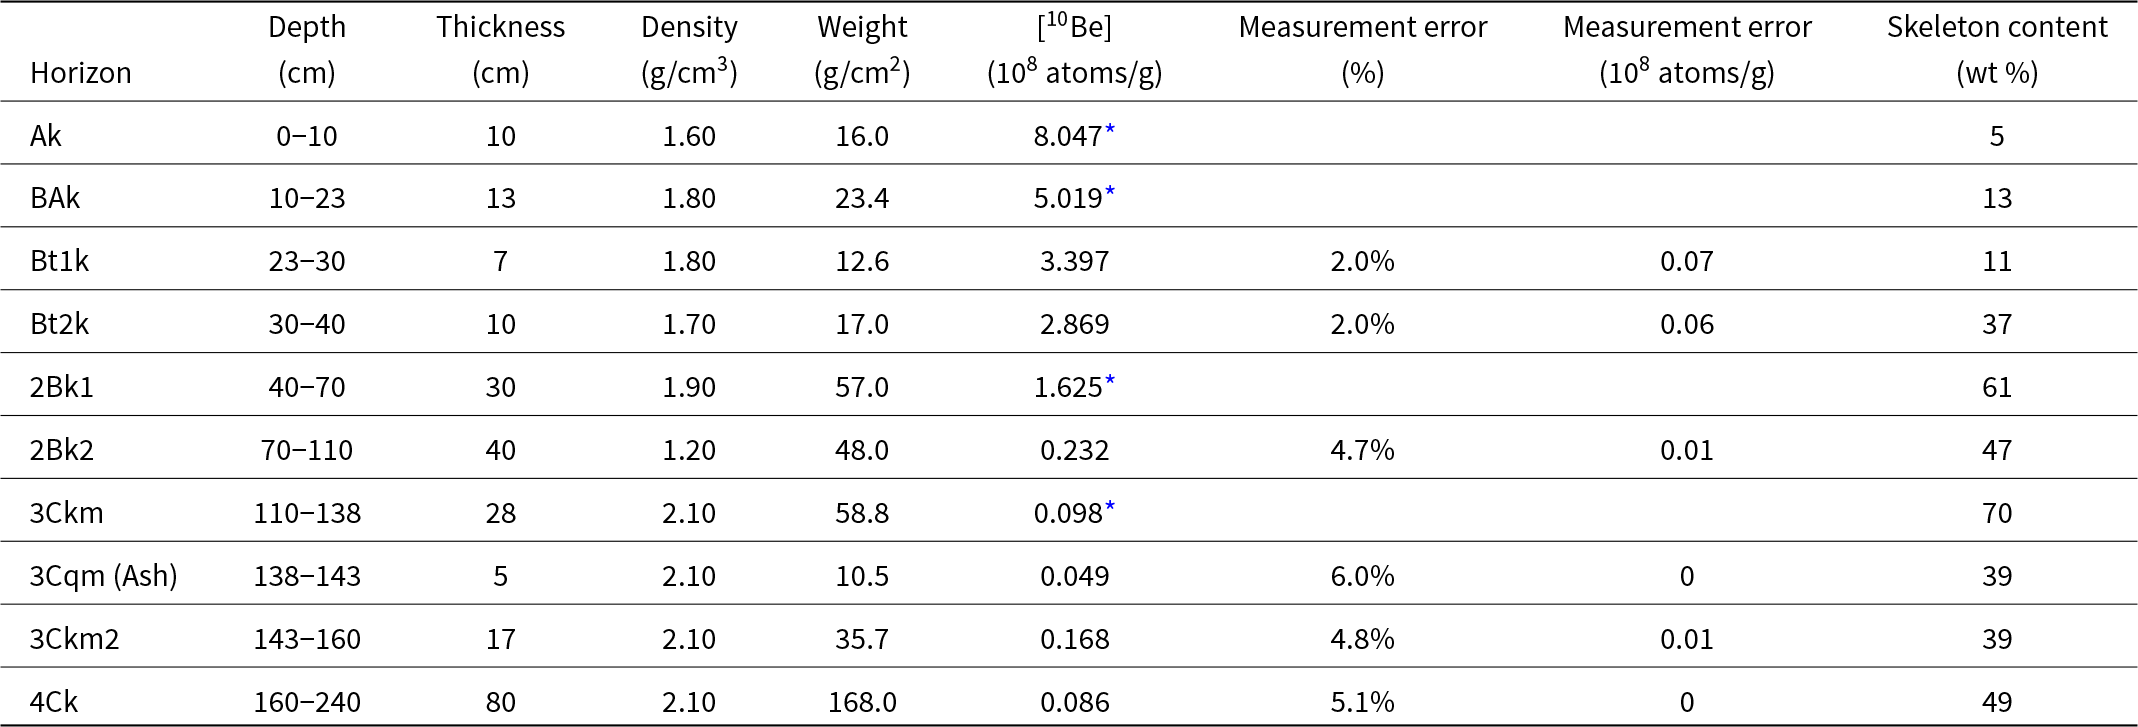
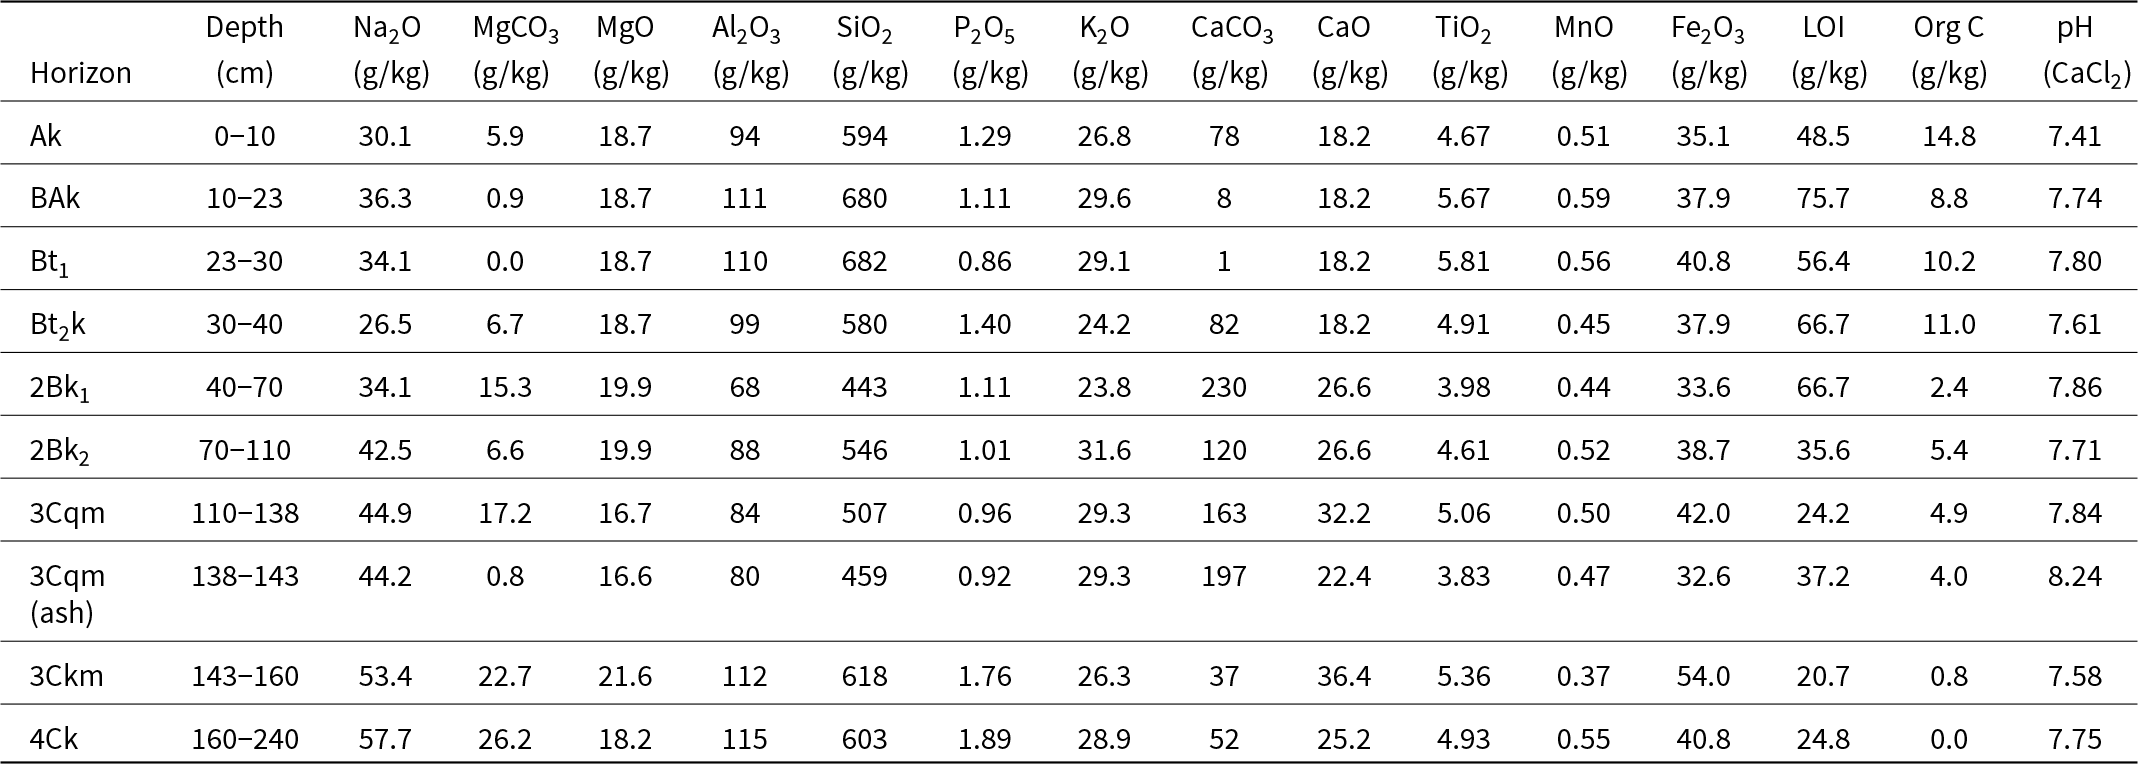
Table 1. Laboratory analyses of soil profiles LA-1 and LA-2 developed on the Airport Terrace. Horizons containing the reworked Lava Creek ash are noted for each profile.
For comparison with the Lander airport ash, we also collected samples of both Lava Creek A and B ashes from the Muddy Ridge locality (Fig. 1; Izett and Wilcox, Reference Izett and Wilcox1982; Jaworowski, Reference Jaworowski, Keefer, Metzger and Godwin1993). This locality is 57 km NNE of Lander on the Mexican Pass SW USGS 7.5′ quadrangle (SE1/4, SW1/4, Sec. 4, T3N, R6W; 43°15′41.65″N; 108°24′54.47″W). The Muddy Ridge locality exposes ∼30 cm of Lava Creek A ashfall overlain by 3 m of Lava Creek B ashfall, with no intervening sediment (Fig. 3e).
Soil samples
We described and sampled each horizon from the two soil profiles (Fig. 4) for physical and chemical analyses in order to: (1) compare the soil development characteristics to previous soils described from Pleistocene terraces in this region and (2) discern evidence for any discontinuities that might suggest the pedogenic characteristics of these profiles do not reflect the true age of the terrace. We additionally sampled 6 of the 10 horizons from profile LA-1 for meteoric 10Be inventory (Table 4), in hope to develop a numeric age for the profile and to detect additional evidence of pedogenic or sedimentological discontinuity that was not readily noticeable in the visual profile and/or the grain-size analyses (Maejima et al., Reference Maejima, Matsuzaki and Higashi2005; Tsai et al., Reference Tsai, Maejima and Hseu2008; Egli et al., Reference Egli, Brandová, Böhlert, Favilli and Kubik2010; Dühnforth et al., Reference Dühnforth, Anderson, Ward and Blum2012; Foster et al., Reference Foster, Anderson, Gray and Mahan2017).
Ash analyses
40Ar/39Ar
40Ar/39Ar age analysis of the fall ash (sample 138-143) was performed at the New Mexico Bureau of Geology & Mineral Resources. The sample was prepared for dating by gentle crushing and sieving, followed by etching in dilute HF acid in an ultrasonic bath to remove adhering glass from crystals. Sanidine was separated using a Franz magnetic separator and lithium polytungstate density liquids, followed by handpicking to select crystals free from adhering matrix glass and containing minimal melt inclusions.
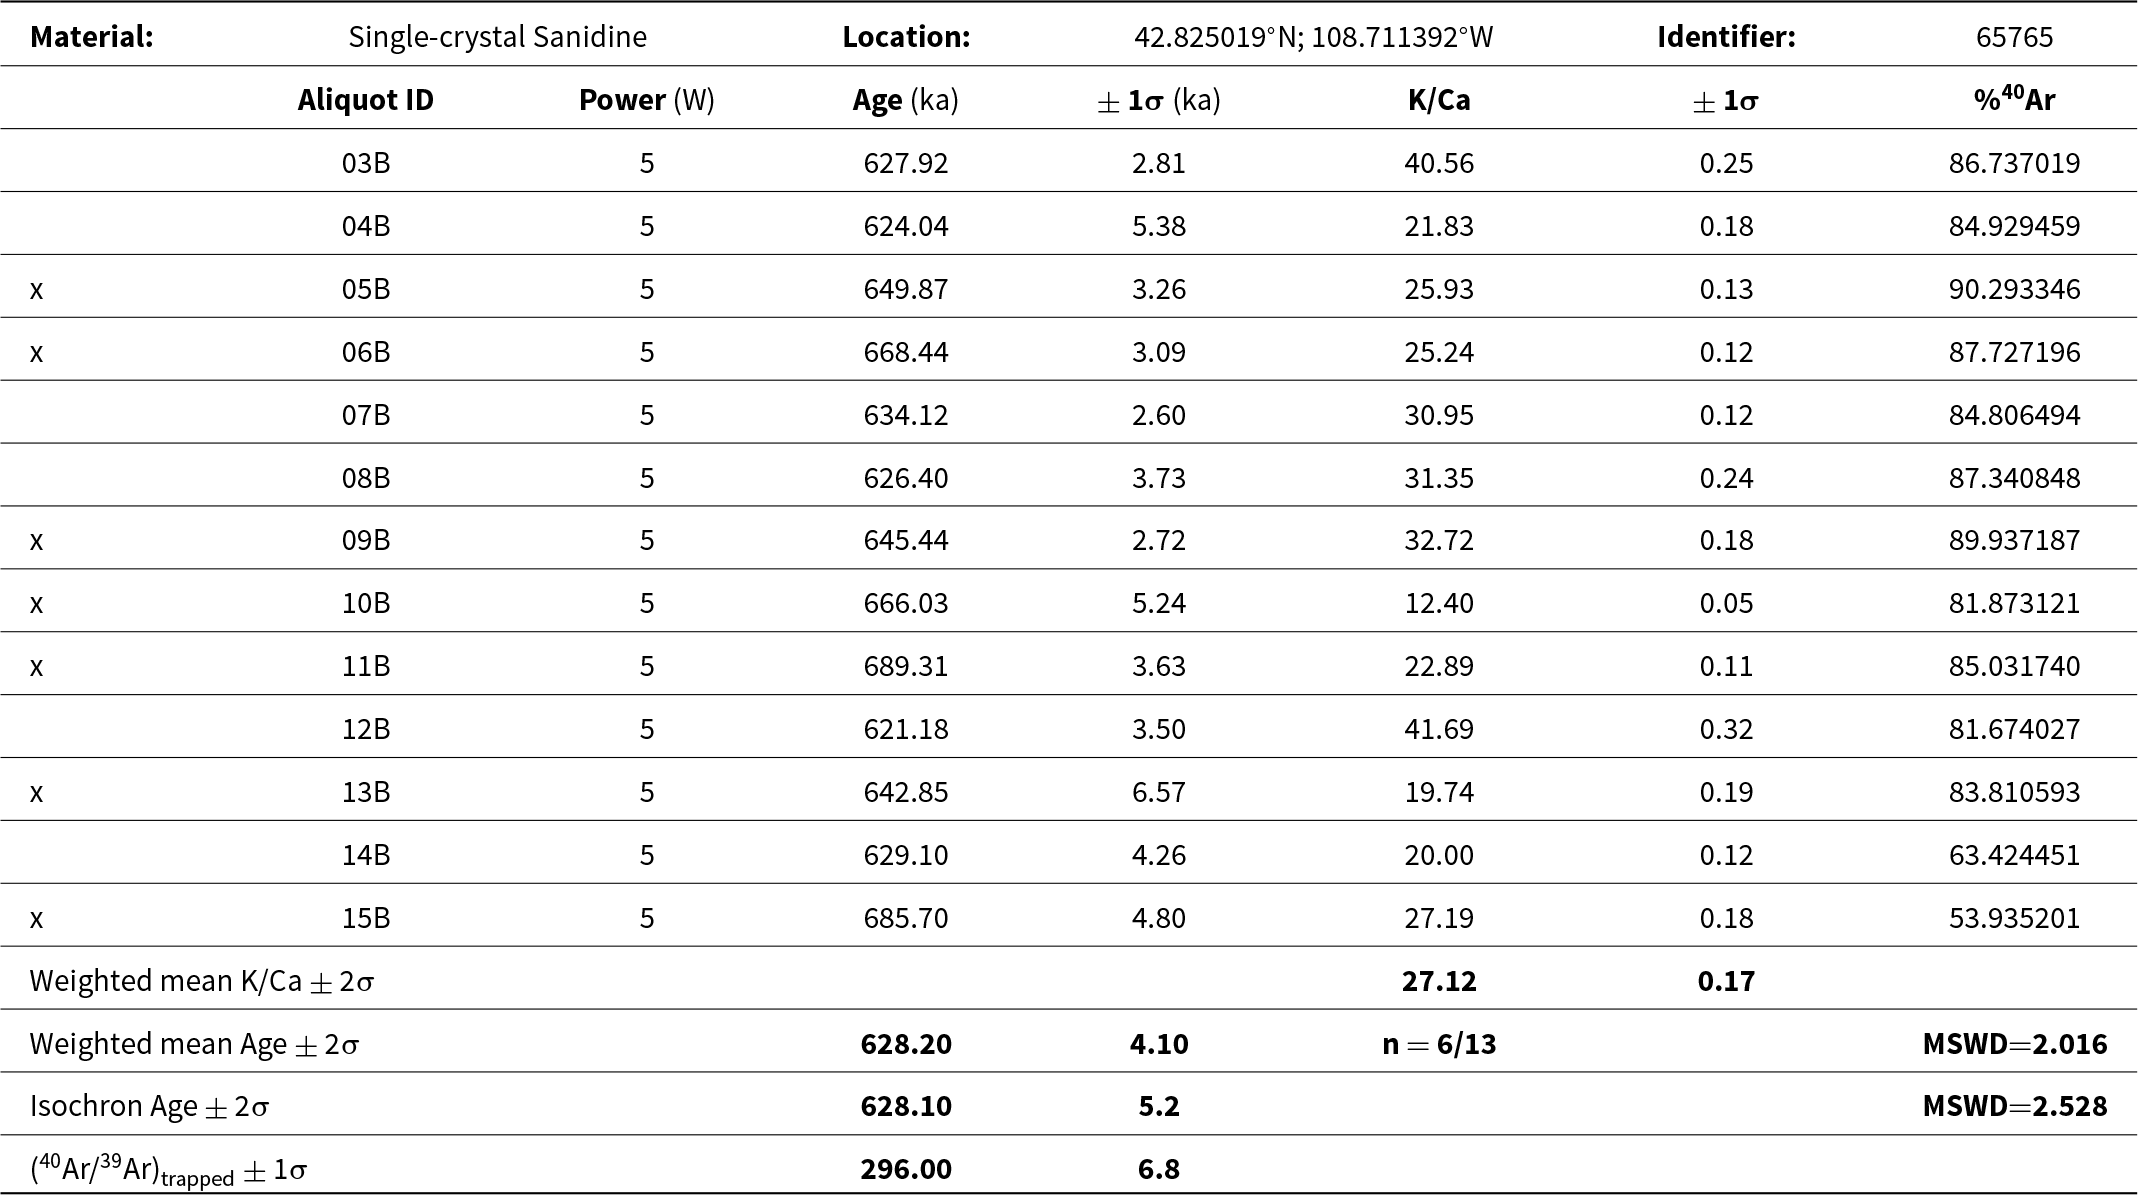
Sanidine separates and flux monitors (Fish Canyon Tuff sanidine, 28.201 Ma, Kuiper et al., Reference Kuiper, Deino, Hilgen, Krijgsman, Renne and Wijbrans2008) were irradiated in machined aluminum discs at the USGS TRIGA reactor in Denver, Colorado. Following irradiation, sanidine separates and monitors were analyzed at the New Mexico Geochronology Research Laboratory using a Thermo Argus VI multicollector mass spectrometer. Single crystals of flux monitors (n = 6 per hole) and unknowns (n = 13) were fused using a 75-watt CO2 laser. J-factors were determined from flux monitor analyses to a precision of ± 0.1%. Analytical parameters are summarized in the footnotes of Table 2 and further detailed in the Data Repository.
Table 2. 40Ar/39Ar single-crystal laser-fusion ages derived from Lander Airport ash deposit. Figure 5 displays the ideogram and inverse isochron for these data.
Notes:
X symbol preceding sample ID denotes analyses excluded from weighted-mean calculations.
n/nt = number of analyses used to compute age/total analyses, MSWD = mean square of weighted deviates.
Sample preparation: minerals were separated by crushing and sieving, followed by etching in 7% HF (sanidine only) or 7% HCl and rinsing in an ultrasonic bath, then concentrated using a Franz magnetic separator and/or density liquids, followed by hand picking.
Irradiation: samples and Fish Canyon Tuff sanidine monitors in machined aluminum trays were irradiated in-vacuo at the Denver USGS Triga reactor.
Instrumentation and procedures: samples heated using a defocused CO2 laser for 30 seconds; reactive gases removed during analysis by reaction with a SAES NP-10 getter; analyses were performed using Thermo Argus VI and/or Helix mass spectrometers on line with automated all-metal extraction system; J-factors were determined by CO2 laser-fusion of 4–6 single crystals from each of multiple radial positions around the irradiation tray.
Age and error calculations: mean age errors quoted as ± 2σ, all other errors ± 1σ; calculations performed using Pychron software, version 18.2; weighted-mean or plateau age and error are inverse-variance weighted mean and error (Taylor, 1982), with error multiplied by root MSWD where MSWD > 1; plateau steps selected using criteria of Fleck et al. (1977); cumulative % 39Ar is cumulative % of total 39Ar used in weighted-mean or plateau age calculations.
Constants: decay constants after Min et al. (2000), λ total = 5.464e−10/a; isotopic abundances after Steiger and Jäger (1977); ages calculated relative to FC-2 Fish Canyon Tuff sanidine interlaboratory standard at 28.201 Ma (after Kuiper et al., Reference Kuiper, Deino, Hilgen, Krijgsman, Renne and Wijbrans2008).
Electron microprobe
Electron microprobe major element geochemical analysis of the fall ash was performed using a Cameca SX-100 electron microprobe located at the New Mexico Bureau of Geology & Mineral Resources. Two samples from the Lander Airport locality were analyzed: sample #138-143 from the middle of the unit and sample Lander #2021-04 from the top. For comparison, two samples from Lava Creek A and B exposed at the Muddy Ridge locality were also analyzed (Figs. 1 and 3e). Samples were prepared for electron microprobe analysis by mounting each in epoxy in a one-inch round leucite disk, polishing with 15-, 6-, and 1-micron pure diamond grit suspended in distilled water, and carbon coated. More complete details of sample preparation are in the footnotes to Table 3.
Table 3. Electron microprobe data from individual shard analyses from Lander Airport ash and Muddy Ridge Lava Creek A and B. Mean compositional data are also compared to published data from other localities. Figure 7 shows the electron microprobe data in graphical form.
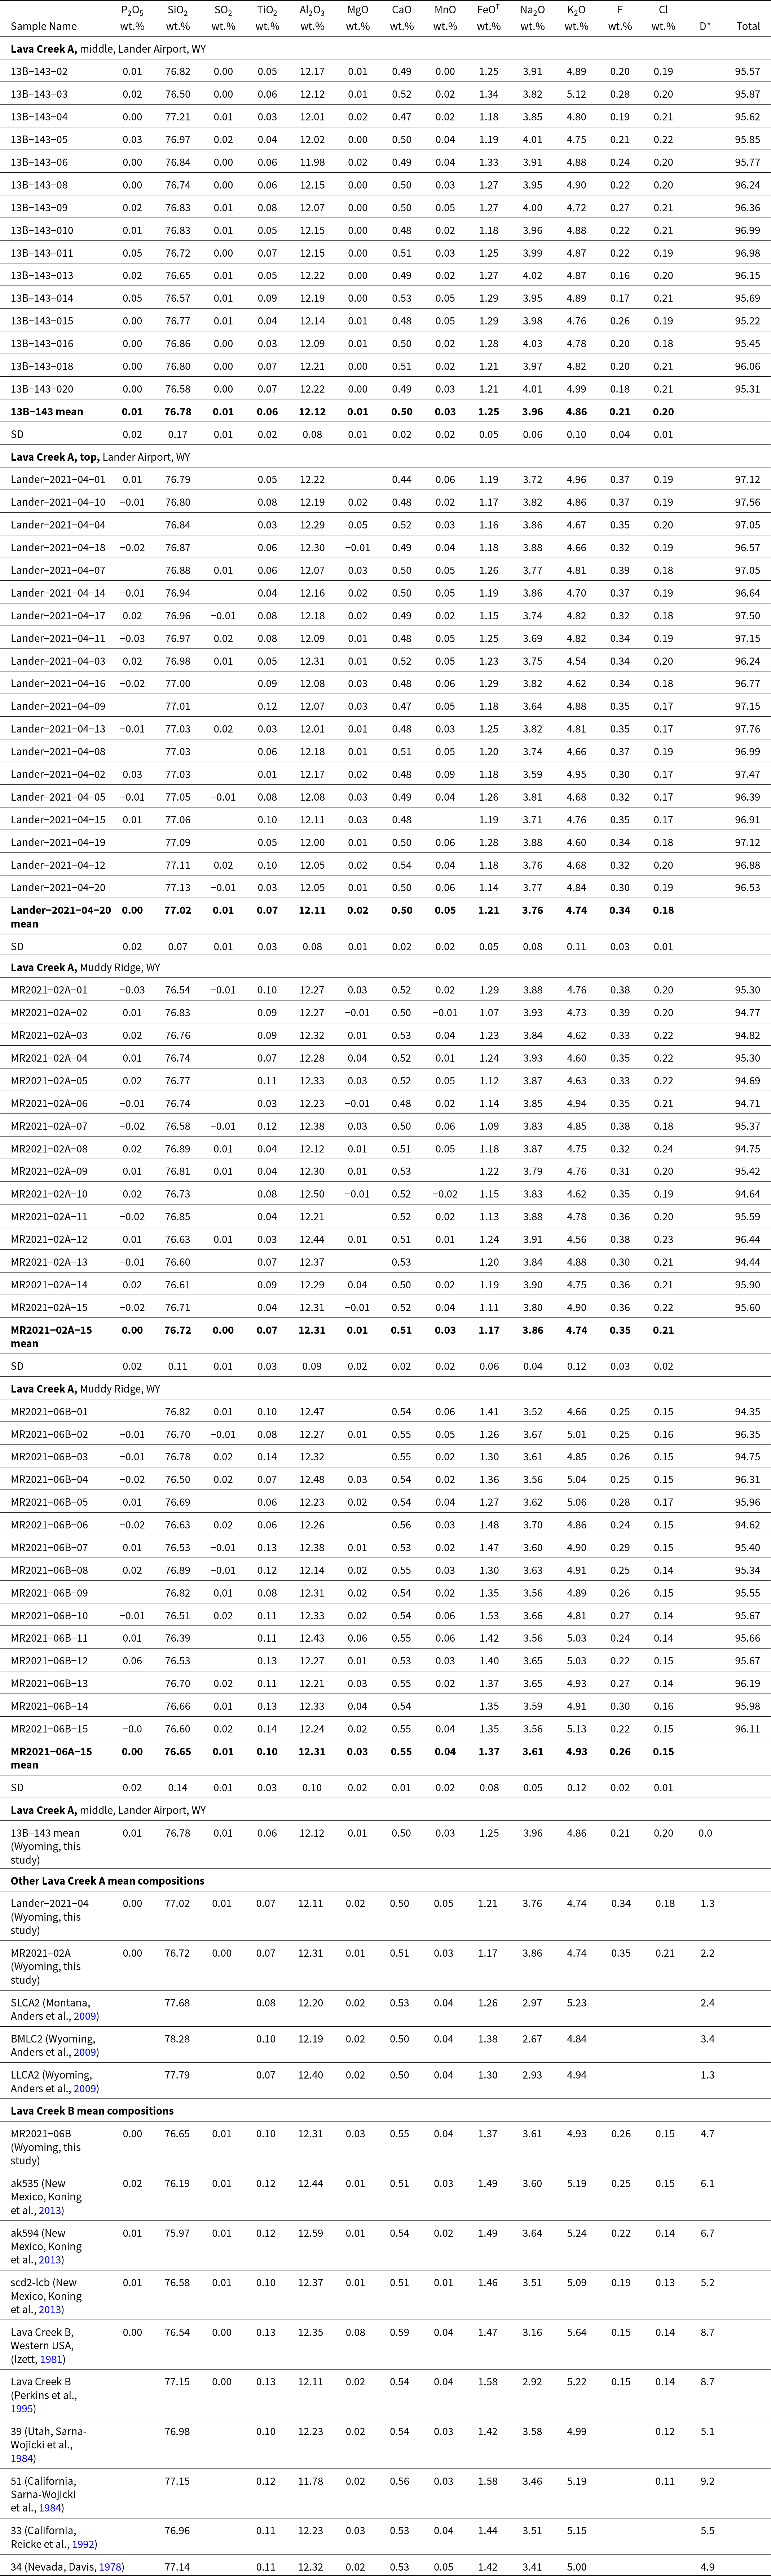
Notes: Analyses were made using a Cameca SX-100 electron microprobe. Geochemical quantities are in weight %. Analytical precision, based on replicate analyses of standard reference materials of similar composition to the unknowns, are as follows (all in wt.%): SiO2 ± 0.47, TiO2 ± 0.03, FeO ± 0.06, MnO ± 0.06, MgO ± 0.07, CaO ± 0.02, Na2O ± 0.55, K2O ± 0.27, P2O5 ± 0.02, Cl ± 0.07. Peak count times of 20 seconds were used for all elements with the exception of Na (40 sec.), F (100 sec.), Cl (40 sec.), and S (40 sec.). Primary calibration standards are: P2O5 and CaO Beeson apatite; SiO2, K2O, Al2O3 orth-1; TiO2 rutile, MgO diopside, MnO MnO, FeO magnetite; Na2O Amelia albite; SO2 barite; Cl scapolite. Beam size used for analysis is 20 micrometers. Analyses are normalized to 100% analytical totals, as is conventional for tephrochronology research. Original analytical totals are reported.
* Distance Function between Lander Airport ash (13B-143) and mean composition of other Lava Creek tephra, calculated following methods described in Perkins et al. (Reference Perkins, Nash, Brown and Fleck1995), neglecting Cl, which is unavailable for some analyses
The samples were initially examined using backscattered-electron (BSE) imagery in order to identify particles with smooth, vesicle-free glass for quantitative analyses. Elements analyzed include Na, Mg, Al, Si, P, S, Cl, K, Ca, Ti, Mn, and Fe (Table 3). An accelerating voltage of 15 kV was used, with a probe current of 10 nA. Peak count times of 20 s were used for all elements with the exception of Na (40 sec.), F (100 sec.), Cl (40 sec.), and S (40 sec.). Background counts were obtained using one half the times used for peak counts. Beam size of 20 microns was used. Analytical precision, based on replicate analyses of certified reference materials, is listed in Table 3. A number of standard reference materials, including feldspars, amphiboles, and glasses were run as unknowns in each analytical session to monitor calibration accuracy, and inter-run reproducibility.
Soil analyses
Physical and chemical analyses
We used soil analytical techniques reported in Dahms and Egli (Reference Dahms and Egli2016), as modified from Jackson (Reference Jackson1969), Klute (Reference Klute1986), and Singer and Janitsky (Reference Singer and Janitzky1986). Air-dried bulk samples initially were sieved to separate the gravel (> 2 mm) from the fine earth (< 2 mm) fractions. We report the ratio of the > 2-mm fraction (g) to the total sample weight (g) as ‘gravel percent’. Samples of the < 2 mm fraction were then homogenized with a sample separator (Rentsch PT 1000). Particle size distribution was determined using the sieve-and-pipette method with prior removal of pedogenic carbonate via 0.5N HCL on heat (∼80°C) and subsequent oxidation of organic matter by 30% H2O2. Particle size distribution is reported as weight percent (USDA grain-size scale).
Bulk density (fine earth and soil skeleton) was estimated from corresponding horizons of previously reported soils of similar age for which bulk density was determined from gravel-free paraffin-coated peds using an estimated gravel density of 2.6 g/cm3 (Dahms and Egli, Reference Dahms and Egli2016). We estimated organic matter percent by the loss-on-ignition (LOI) method at 360°C (Davies, Reference Davies1974). Soil pH (0.01 M CaCl2) was determined using a soil:solution ratio of 1:2.5 (Dahms and Egli, Reference Dahms and Egli2016).
Pedogenic carbonates were determined by two methods (Dahms and Egli, Reference Dahms and Egli2016): (1) via the dissolution of carbonates by HCl and (2) by comparing the HCL results with total Ca and Mg concentrations obtained from XRF measurements. We performed an iterative speciation calculation with the XRF data based on elemental contents and present the results as oxides or carbonates (and fitted to 100% as total sum) to determine CaO and CaCO3 species (Tables 1 and 5). Organic C contents were measured at 550°C using a C/H/N analyzer (Leco). The standard reference material is EDTA (Säntis Analytical, article no SA502092) having C = 41.09% (measured values were C: 41.11 ± 0.08%).
Soil development using meteoric 10Be
We estimated the 10Be abundance using the assumption that the overwhelming portion of 10Be in a profile is adsorbed in the fine earth (< 2 mm) fraction. The amount is consequently calculated according to:
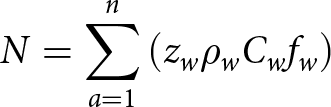 \begin{equation}N = \mathop \sum \limits_{a = 1}^n \left( {{z_w}{\rho _w}{C_w}{f_w}} \right)\end{equation}
where N corresponds to the abundance of 10Be (inventory), zw to the thickness of the soil horizon, ρw to the bulk density, Cw to the concentration (fine earth) in the corresponding horizon, and fw to the relative fraction (% by weight) of fine earth.
If the meteorological 10Be inventory since the initiation of soil formation is known, then the time since the soils were exposed to meteoric 10Be flux can be inferred from the following equation:
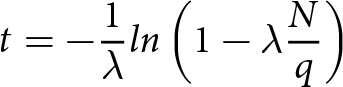 \begin{equation}t = - \frac{1}{\lambda }ln\left( {1 - \lambda \frac{N}{q}} \right)\end{equation}
where t is the age of soil, λ is the decay constant of 10Be (4.62 × 10⁻⁷/y), N is the inventory of 10Be in time t (atoms/cm2), and q is the annual deposition rate of 10Be (atoms/cm2/y). The measured inventory N is the integral of concentration multiplied by soil density at the depth the profile was sampled (Pavich and Vidic, Reference Pavich, Vidic, Swart, Lohmann and Savin1993; Maejima et al., Reference Maejima, Matsuzaki and Higashi2005). This equation usually is valid when erosion and inheritance are negligible, neither of which has been convincingly demonstrated for terraces in this region of the Rocky Mountains (e.g., Dühnforth et al., Reference Dühnforth, Anderson, Ward and Blum2012; Foster et al., Reference Foster, Anderson, Gray and Mahan2017).
10Be measurement of soil materials
We measured the abundance of 10Be only in profile LA-1, because this profile contains the most clearly exposed ash horizon. Each soil horizon (Table 4) was analyzed for its 10Be content, using the fine-earth fraction (< 2 mm). 10Be was extracted from the soil samples using a modified method from Horiuchi et al. (Reference Horiuchi, Minoura, Kobayashi, Nakamura, Hatori, Matsuzaki and Kawai1999). We added 0.4 mg of 9Be(NO3)2 (carrier) to 1–5 g of soil (< 2-mm fraction). This mixture of carrier and sample was heated for 3 hours at 550°C to remove organic matter. After cooling, the mixture was shaken and leached with 8 ml HCl (16% v/v) overnight. The solids were separated by centrifuge, leached, and the liquid collected. After a second leaching, the soil residue was discarded and the obtained solutions mixed together and heated at 80°C until the volume reduced to about 1 ml. To this sample, 1 ml HNO3 (65% v/v) and 1 ml HCl (32% v/v) were added and any fine particles removed by centrifugation. NaOH (16% v/v) was added to the sample until it reached a pH value of 2, and subsequently 1 ml of concentrated EDTA and NH4OH was added until a pH value of 8 was obtained and the gel containing Be(OH)2 and some Fe(OH)2 was precipitated. Next, the Be(OH)2 was re-dissolved and the solution containing Be was separated by centrifugation. Fe was removed using an anion exchange column and the cleaned solution was heated to near dryness. The Be was separated using two different cation exchange columns. Pure Be(OH)2 was then precipitated with NH4OH and subsequently dried at 70°C. It was calcinated in an oven for 2 hours at 850°C to obtain pure BeO. This BeO was then mixed with Nb powder and pressed into a mass spectrometer target.
Table 4. Meteoric 10Be and soil physical parameters used in calculations of stocks of 10Be in the soil horizons of profile LA-1 (see Figure 8).
* Extrapolated values (using the equation given in Figure 8).
The 10Be/9Be ratios were measured with the MILEA AMS system at the ETH Zürich (Christl et al., Reference Christl, Vockenhuber, Kubik, Wacker, Lachner, Alfimov and Synal2013) and normalized to the ETH Zürich in-house AMS standard S2007N (10Be/9Be = 28.1 × 10⁻¹² nominal), which has been calibrated relative to ICN 01-5-1 (10Be/9Be = 2.709 × 10⁻¹² nominal) (Nishiizumi et al., Reference Nishiizumi, Imamura, Caffee, Southon, Finkel and McAninch2007), both of which are associated with a 10Be half-life of 1.387 ± 0.012 My (Chmeleff et al., Reference Chmeleff, von Blanckenburg, Kossert and Jakob2010; Korschinek et al., 2010).
For the age calculation we used an estimated 10Be long-term deposition rate of 1.82–2.42 × 10⁵/cm2/yr, based on Derakhshan-Babaei et al. (Reference Derakhshan-Babaei, Nosrati, Tikhomirov, Christl, Sadough and Egli2020). Recognizing the difficulty of estimating a precipitation value for a period several hundred thousand years ago, we used a paleo-precipitation value of 150–200 mm/yr, conservatively modified from the modern mean annual precipitation value of ∼300 mm/yr calculated from the meteorological station at the Lander airport.
Results
40Ar/39Ar age of the ash
The single-crystal 40Ar/39Ar analyses show a polymodal distribution of ages, ranging from 621 to 706 ka with individual crystal age errors ranging from ± 2.6 to ± 6.6 ka. (Fig. 5a and Table 2; all weighted-mean errors are 2σ). K/Ca ratios (determined from Ca-derived 38Ar) range from 12.4 to 41.7 and average 27.1 ± 6.7. Radiogenic yields (the fraction of 40Ar that is non-atmospheric) of most crystals are greater than 80%. The youngest six crystals form a distinct mode with a weighted-mean age of 628.2 ± 4.1 ka, with an MSWD (mean squared weighted deviation) value of 2.02, suggesting that the scatter in the data can be attributed to analytical error. Plotting the data on an inverse isochron diagram (Fig. 5b) yields an isochron age (628.1 ± 5.2 ka), which is indistinguishable from the weighted-mean age, and a 40Ar/36Ar intercept (296.0 ± 6.8) that is within error of atmospheric argon (40Ar/36Ar = 295.5).
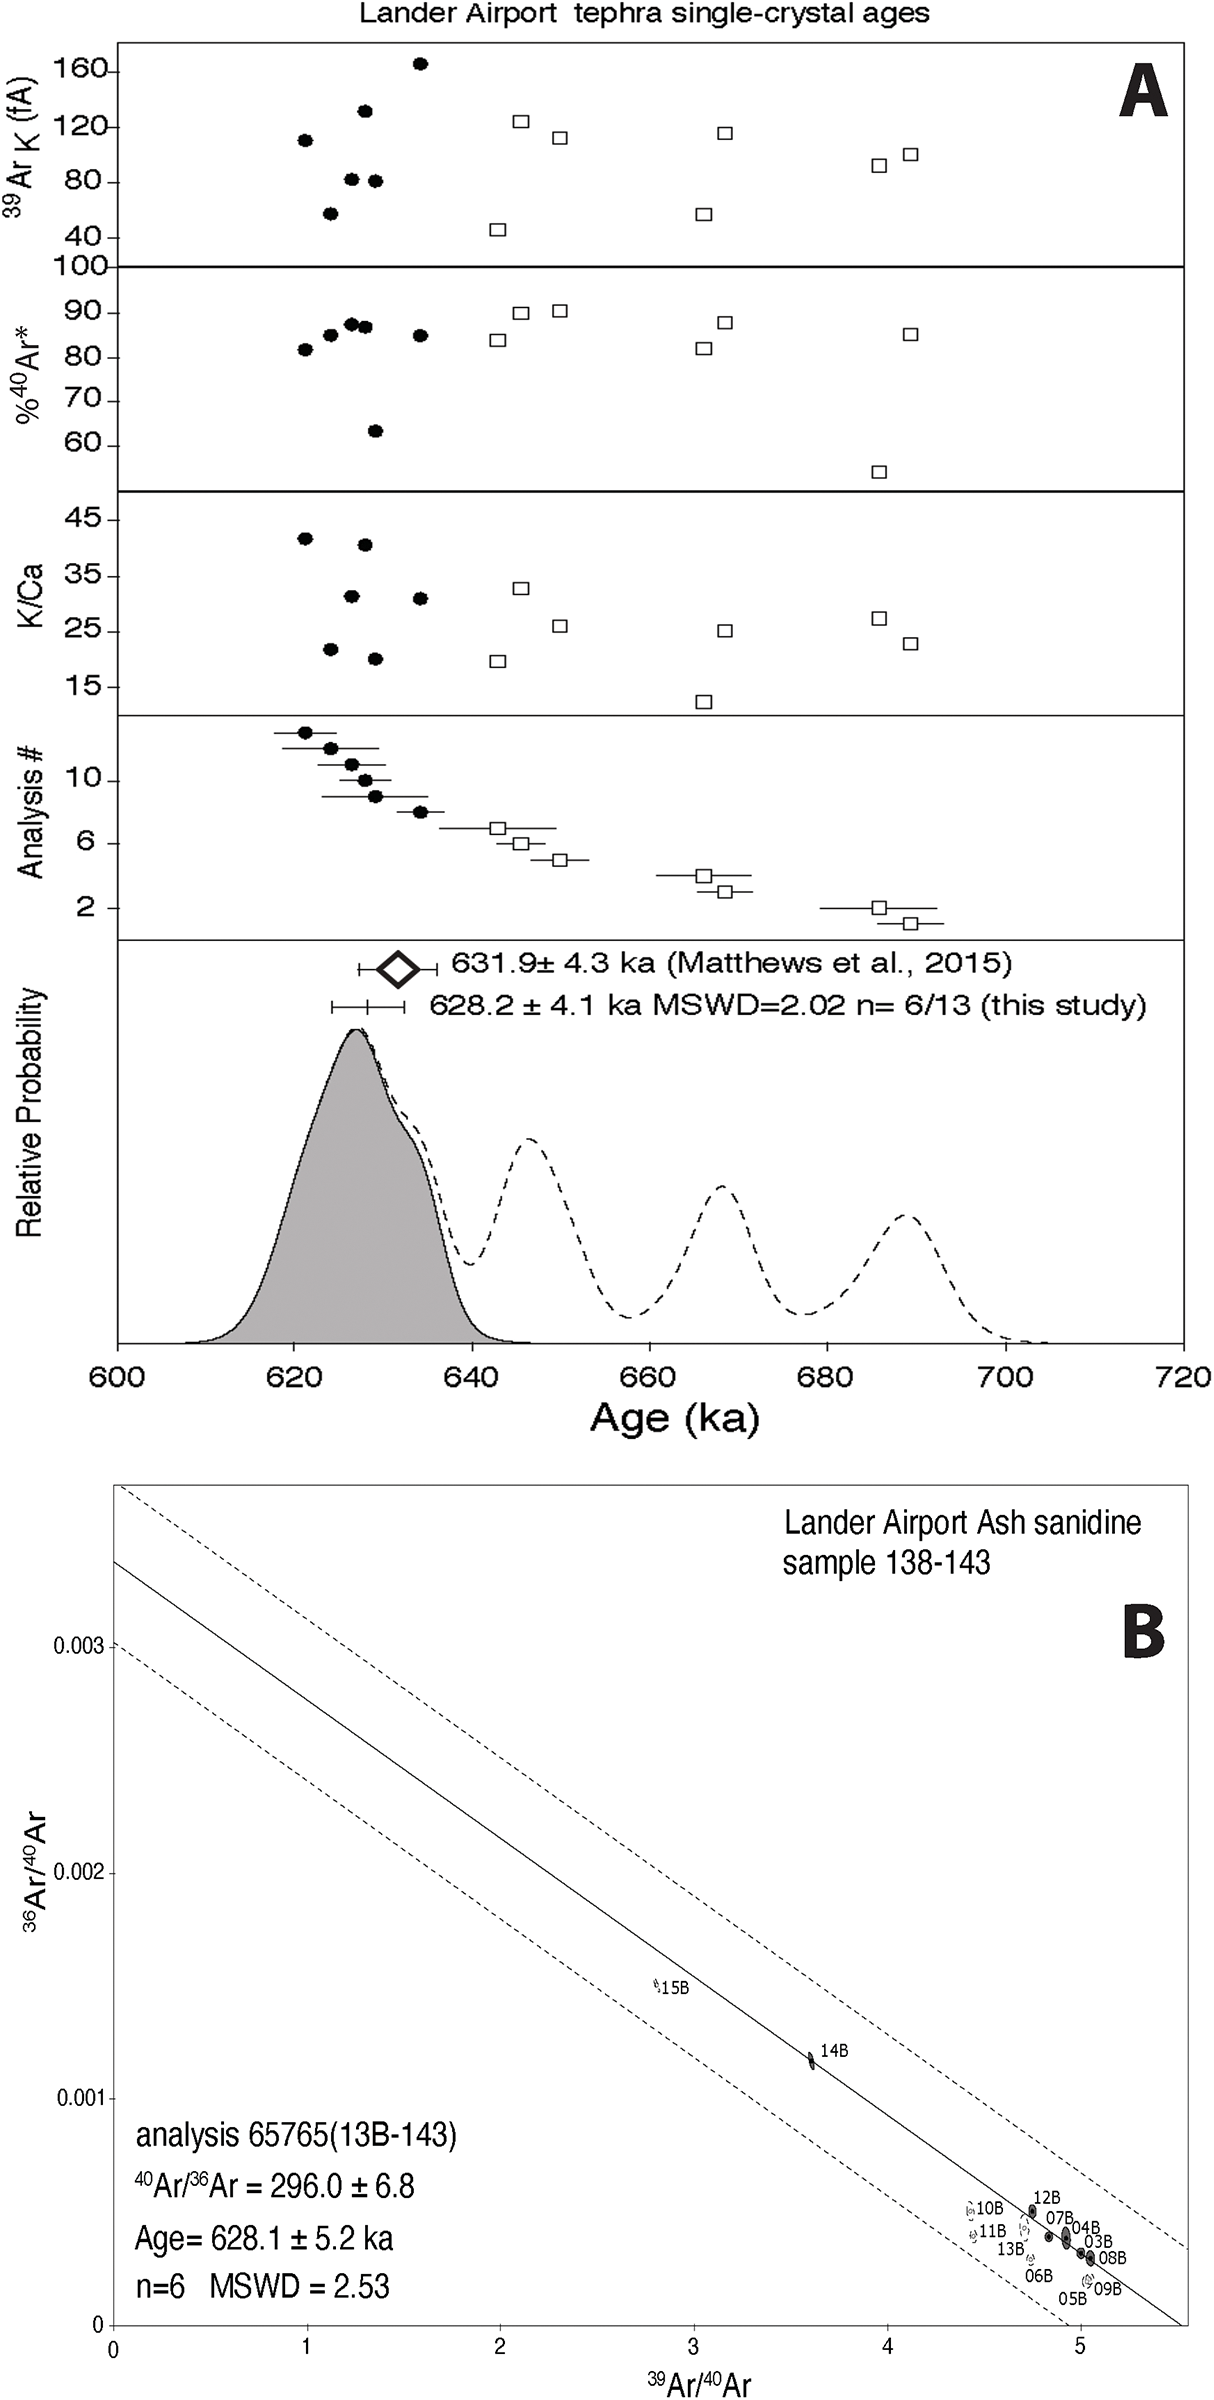
Figure 5. (A) Ideogram showing the 40Ar/39Ar single-crystal laser-fusion ages of sanidine from the Lander Airport ash exposure. Lander Airport samples are represented by the black circles and shaded probability curve. Stacked auxiliary plots show the 39Ar signal size, radiogenic yield, K/Ca ratios, the age (%40Ar*), and uncertainty of dated crystals. Circles represent data used to calculate the mean age. Squares represent anomalously old data points rejected from the mean age calculation, as discussed in the text. (B) Inverse isochron of single-crystal laser-fusion data from sanidine from Lander Airport ash. Data used in the isochron calculation shown with gray-filled solid ellipses. Rejected data are shown with unfilled dashed error ellipses. Data are presented in tabular form in Table 2.
Age distributions of this sort, with a young mode accompanied by a “tail” of anomalously old crystals, are typical for Yellowstone ashes, ignimbrites, and lavas (Gansecki, Reference Gansecki1996; Gansecki et al., Reference Gansecki, Mahood and McWilliams1998; Christiansen, Reference Christiansen2001; Matthews et al., Reference Matthews, Vazquez and Calvert2015). Many workers have attributed the older ‘tail’ of single-crystal ages in Yellowstone sanidines to some crystals being antecrysts or wall-derived xenocrysts (Gansecki et al., Reference Gansecki, Mahood and McWilliams1998; Matthews et al., Reference Matthews, Vazquez and Calvert2015), but an alternative explanation is that anomalously old ages are due to excess 40Ar contained in melt inclusions that were incompletely removed during the mineral separation process (e.g., Esser et al., Reference Esser, McIntosh, Heizler and Kyle1997). Regardless of the source of the crystals with anomalously old apparent ages, we consider the weighted-mean age of the youngest population of crystals to be an accurate estimate of eruption age. This weighted mean age of 628.2 ± 4.1 ka (Fig. 5) overlaps with published 40Ar/39Ar ages for the Lava Creek Tuff A and B ignimbrite (Matthews et al., Reference Matthews, Vazquez and Calvert2015), as further detailed in the discussion section below.
Ash geochemistry and grain morphology
Microprobe glass-analyses show that glass shards from the Lander Airport ash are unaltered and rhyolitic in composition. The average major element compositions (Table 3 and Fig. 7) are similar to data from the Lava Creek A at Muddy Ridge and to published values (statistical distance values of 1.3–3.4; method of Perkins et al., Reference Perkins, Nash, Brown and Fleck1995), but differ from glass compositions of the Lava Creek B ash at Muddy Ridge and from published values (statistical distance values of 4.7–9.2) (Table 3). The Lander Airport ashfall shows distinctly lower values for FeO and higher values for Cl (Fig. 7), values which correspond to the range of values commonly associated with Lava Creek A ashes elsewhere and when compared with published values for Lava Creek B ashes (Christiansen, Reference Christiansen2001; Matthews et al., Reference Matthews, Vazquez and Calvert2015).
In addition to differences in chemical compositions, Lava Creek A ashes also show distinctive differences in particle morphology from those of Lava Creek B. The Lander Airport ash and Muddy Ridge Lava Creek A samples (Fig. 6a and b) are very poorly sorted with a maximum particle size of 200 μm and abundant fine fragments (< 10 μm), although the Muddy Ridge Lava Creek A sample (Fig. 6b) shows a smaller median grain size and more abundant fine fragments. The ashes at both localities consist of glass fragments that are fracture-bounded, blocky, and have variable but generally low vesicularity. Shard-shaped bubble-wall fragments are rare (Fig. 6a and b). In contrast to the Lava Creek A ashes at Lander and Muddy Ridge, Lava Creek B tephras at Muddy Ridge (Fig. 6c) and elsewhere are dominated by coarser, well-sorted, delicate shard-shaped vesicle-wall fragments with maximum dimensions of 500 μm.
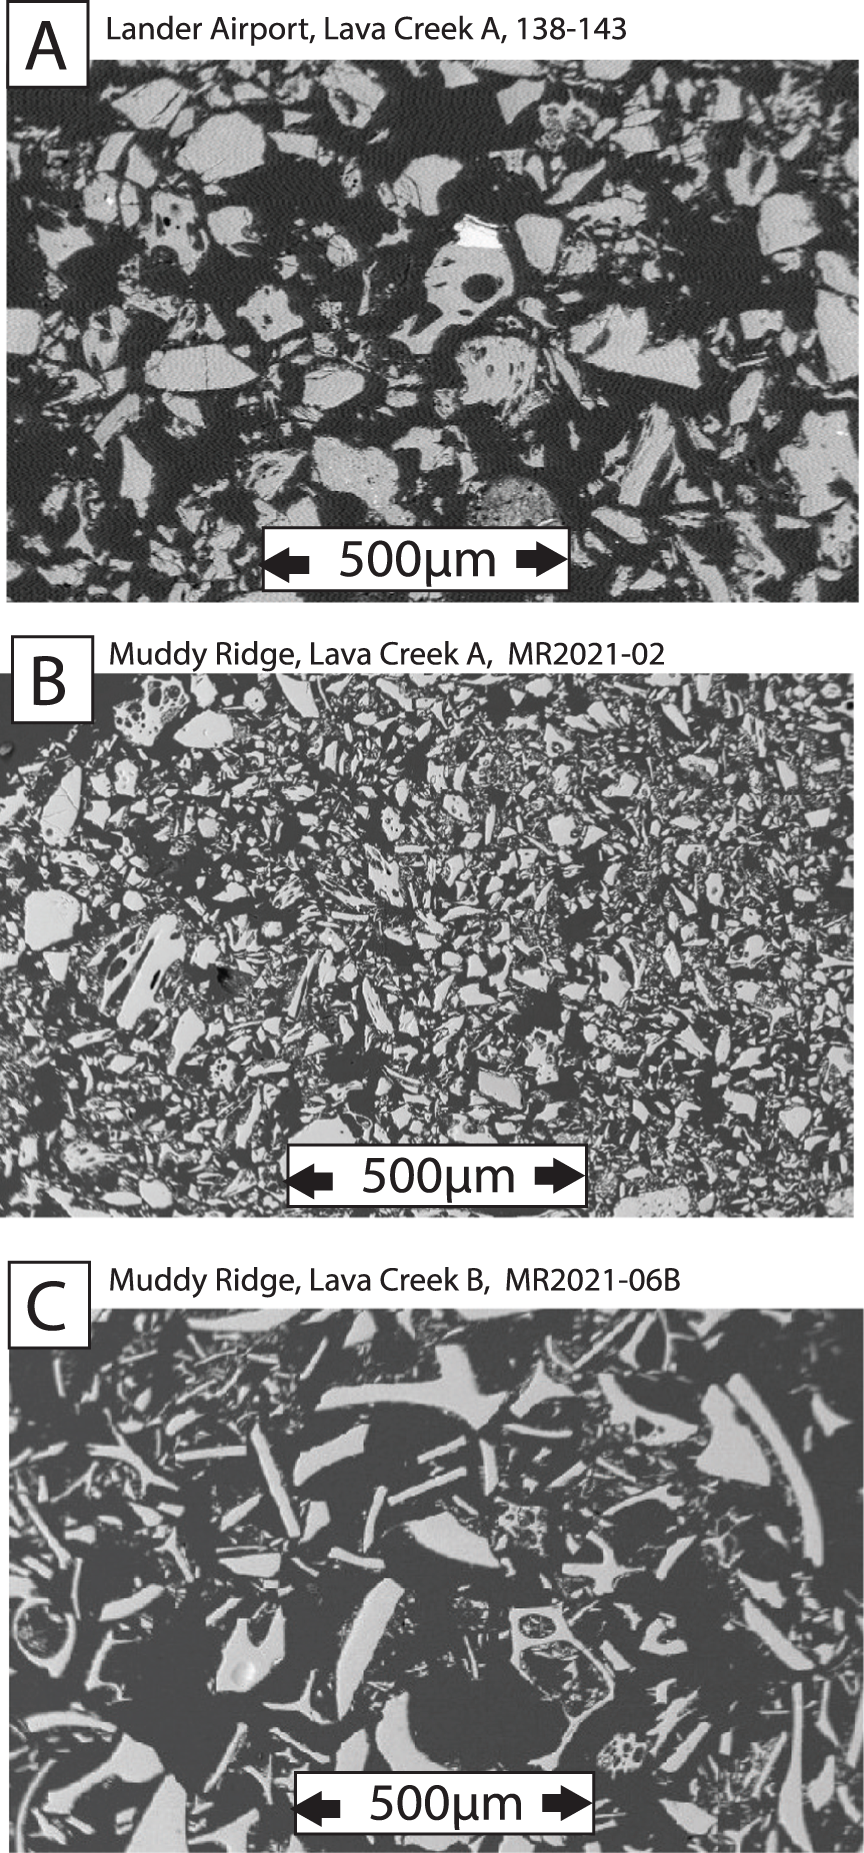
Figure 6. (A) Backscattered electron (BSE) image of Lander Airport ash sample 138-143 showing the poor sorting and blocky shard morphology. (B) BSE image of Muddy Ridge Lava Creek A sample MR2021-02 showing size distribution, sorting, and morphology similar to the Lander Airport ash. (C) BSE image of Muddy Ridge Lava Creek B sample MR2021-06B showing delicate cuspate bubble-wall shard morphology with coarser grain size and better sorting than the Lava Creek A samples in (A) and (B).
Soil morphology
The morphology of soil profiles LA-1 and LA-2 is illustrated in Figure 4 and by the data presented in Tables 1 and 5. Both profiles are similar to those previously reported from alluvial deposits correlated to Bull Lake and pre-Bull Lake glacial episodes in the Wind River and Bighorn River basins (Reheis Reference Reheis1987; Nettleton and Chadwick, Reference Nettleton and Chadwick1991; Chadwick et al., Reference Chadwick, Hall, Kelly, Amundson, Gosse, Phillips and Jaworowski1994; Hall, Reference Hall1999; Dahms and Egli, Reference Dahms and Egli2016). The profiles here exhibit multiple clay-rich (argillic) horizons and horizons with pedogenic carbonate (Bk). Notable variability in the soils’ physical and chemical characteristics (especially in grain sizes, organic matter (LOI), inorganic C, and percent CaCO3) appear in both profiles above the ash-bearing horizons (Table 1: LA-1, 110–143 cm, LA-2, 120–150 cm; Table 5: 110–138).
Table 5. Chemical composition (major elements given in oxide form), LOI, organic C, and pH of the ≥ 2-mm fraction of profile LA-1. Ca and Mg in oxide and carbonate form, because both species occur in the soil. CaCO3 represents ‘pedogenic’ carbonate (e.g., Dahms and Egli, Reference Dahms and Egli2016). CaO represents content of oxidized (inorganic) Ca.
Accumulation of carbonate is common in soils of arid regions at profile locations of contrasting grain size, as percolation of soil water is interrupted by the change from either coarse-to-fine or fine-to-coarse grain sizes, so that CaCO3 precipitates at the change in hydrologic permeability (Bachman and Machette, Reference Bachman and Machette1977; Birkeland, Reference Birkeland1999). Both profiles exhibit Stage III and III+ carbonate morphology (Gile et al., 1966, 1981; Bachman and Machette, Reference Bachman and Machette1977) in the 2Bk1 and 2Bk2 (LA-1) and 2Bkm1 and 2Bkm2 (LA-2) horizons (Table 1 and Fig. 4). Contents of CaCO3 in the soils’ Stage III and III+ horizons vary from 45% to 58% in profile LA-1 and from 24% to 44% in profile LA-2 (Table 1).
Meteoric 10Be content and soil age
The meteoric 10Be content (Table 4) through soil profile LA-1 is highest just beneath the surface (2.869–3.397 × 10⁵ atoms/g) and exponentially decreases with depth to values close to zero (0.049 × 10⁵ atoms/g) in the ash layer (Fig. 8, blue circles). The 10Be content again increases in the horizons below the ash (0.086–0.168 × 10⁵ atoms/g; Fig. 8, red squares). The curve fit to the 10Be concentrations (Fig. 8) models the depth distribution of meteoric 10Be as it accumulated in the profile during subsequent sedimentation and soil-profile development following deposition of the ash horizon. Values of the 10Be contents shown in Table 4 for the Ak, BAk, 2Bk1 horizons, and the portion of the 3Cqm horizon just above the ash were extrapolated from the curve.
Using the sum of the 10Be abundance along the soil depth profile from the surface to the ash-bearing horizon, the calculated age of this profile (eq. 2) is only ca. 145–195 ka, assuming annual precipitation of ∼150–200 mm and 10Be deposition rates of 1.82–2.42 × 10⁵/cm2/yr. Under this scenario, the alluvium below the ash layer might have been exposed for only about 5–6 kyr.
Discussion
Age and provenance of the Lander Airport Ash
Age of the ash
Matthews et al. (Reference Matthews, Vazquez and Calvert2015) summarized existing dating of Lava Creek Tuff, and presented new 40Ar/39Ar sanidine data showing the ages of Lava Creek Tuff A and B ignimbrites to be indistinguishable at 631.3 ± 4.3 ka, in keeping with field observations suggesting little or no time break between the two eruptions. This age is equivalent to 631.9 ± 4.3 ka when recalculated relative to Fish Canyon Tuff sanidine at 28.201 Ma (Kuiper et al., Reference Kuiper, Deino, Hilgen, Krijgsman, Renne and Wijbrans2008) for direct comparison with results from this study. The close agreement between our measured age of 628.2 ± 4.1 ka and the published age of 631.3 ± 4.3 ka (Matthews et al., Reference Matthews, Vazquez and Calvert2015; Fig. 5) clearly supports identification of the Lander Airport tephra as Lava Creek in origin, although the above method cannot distinguish between Lava Creek A and Lava Creek B. We are confident that the Lander Airport ash was sourced from the Lava Creek Tuff eruption, and that this ash therefore provides a well-dated 628.2 ± 4.1 ka time-horizon within the enclosing sedimentary sequence of the Airport Terrace.
Ash provenance
Glass geochemistry data (Fig. 7 and Table 3) from the Lander Airport ashfall locality support a correlation with the Lava Creek A ash. Our confidence is only limited by the small amount of published geochemical data available from the few previously reported Lava Creek A localities. The Lander Airport ash results agree closely with composition of Lava Creek A at Muddy Ridge and published compositions at other localities, including the analysis of the now-destroyed Cemetery ash locality (LLCA2 of Anders et al., Reference Anders, Saltzman and Hemming2009). The previously noted higher levels of FeO and lower levels of Cl of the Lander Airport ash, when compared to data reported for the Muddy Ridge Lava Creek B and other more distal Lava Creek B deposits (Fig. 7 and Table 3), correspond to similar systematic differences in geochemistry between Lava Creek A and Lava Creek B reported previously (Jaworowski, Reference Jaworowski, Keefer, Metzger and Godwin1993; Christiansen, Reference Christiansen2001; Anders et al., Reference Anders, Saltzman and Hemming2009; Matthews et al., Reference Matthews, Vazquez and Calvert2015).
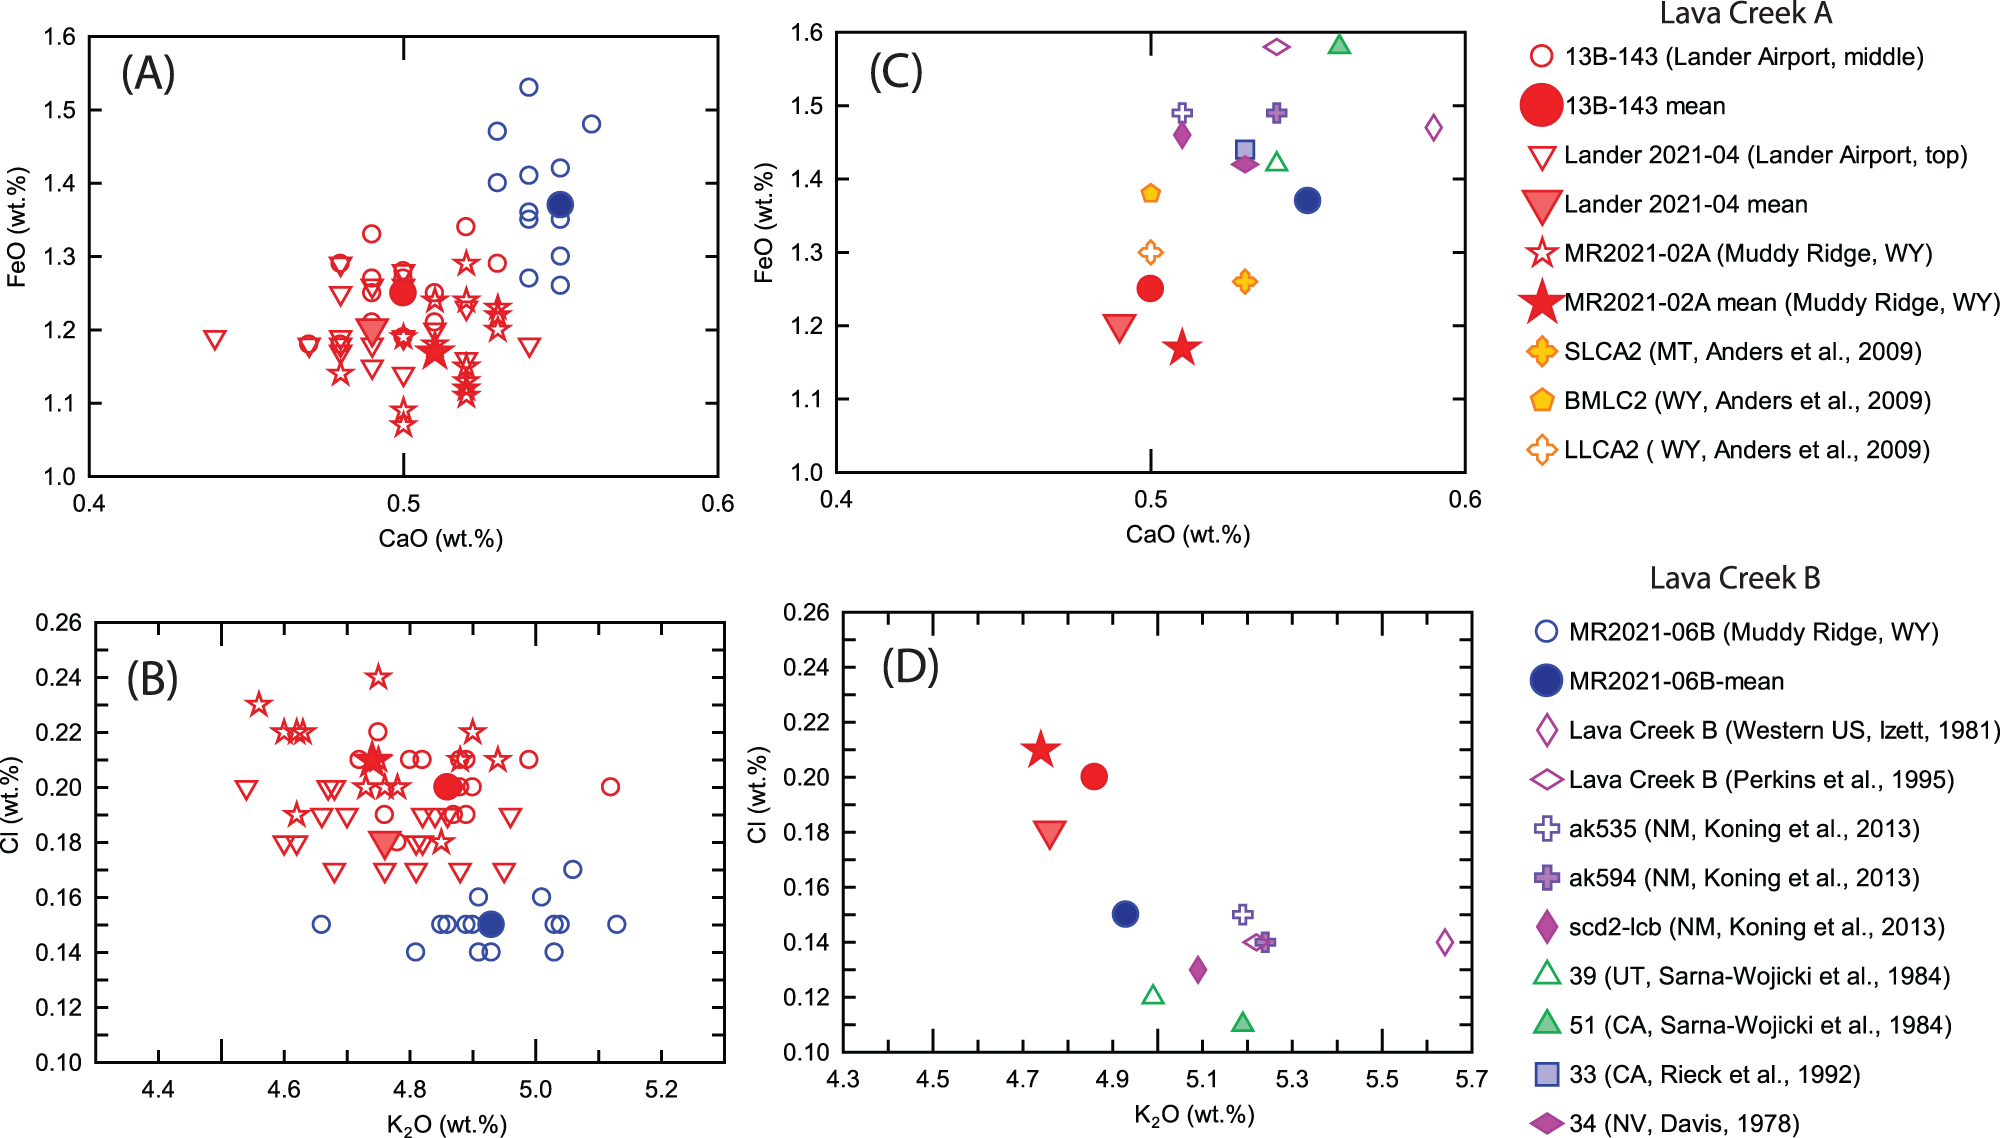
Figure 7. Microprobe geochemistry of glass shards from Lander Airport airfall ash compared to published data from Lava Creek A and B ash from other localities. (A, B) FeO versus CaO and Cl versus K2O for individual shard data from Lander Airport ash samples compared with data from Lava Creek A and B at Muddy Ridge. (C, D) Mean sample compositional values for the same elements from these localities compared with published data from other localities. Some published data lack Cl values. Microprobe data are presented in tabular form in Table 3.
Given the laterally continuous local geometry of typical ashfall deposits (Fisher and Schmincke, Reference Fisher and Schmincke1984), it is likely that the Lander Airport ash, which directly overlies and underlies fluvial gravels, represents a deposit of Lava Creek A that originally was overlain by a deposit of Lava Creek B that was later eroded (e.g., the original deposit of LC-A was possibly thicker). Since the originally reported deposit was said to have exposed both the Lava Creek A and B ashes (Hausel and Love, Reference Hausel, Love, Frost and Roberts1991), the location of the airport ash locations 1.5 km closer to the mouth of Sinks Canyon slightly strengthens the erosion hypothesis. This interpretation is further strengthened by noting that the localities of deposits containing only Lava Creek A are preferentially identified in the main Wind River tributaries, while reported exposures of combined Lava Creek A and B are limited to terraces along the trunk channel of the Wind River (Jaworowski, Reference Jaworowski, Keefer, Metzger and Godwin1993).
Other lines of evidence also point to the Lander Airport ash as Lava Creek A. The white color and fine grain size of the Lander Airport ash are generally similar to those characteristics of the Lava Creek A at Muddy Ridge, in contrast to the coarser, gray-colored ash of the overlying Lava Creek B, a distinction used by Jaworowski (Reference Jaworowski, Keefer, Metzger and Godwin1993) to suggest the ash at the now-destroyed Lander Cemetery locality might have been Lava Creek A.
Additionally, differences in particle morphology between Lava Creek A and B ashfalls also support the identification of the Lander Airport ash as Lava Creek A. As noted previously, both the Lander Airport ash and Muddy Ridge Lava Creek A samples (Fig. 6a and b) are poorly sorted and consist of fracture-bounded blocky glass fragments with variable but generally low vesicularity, and rarely exhibit shard-shaped bubble-wall fragments. We suggest that the grain-size distribution and morphological features of the Lander Airport and Muddy Ridge ash fragments are consistent with a hydrovolcanic origin (Walker, Reference Walker1971; Wohletz, Reference Wohletz1983; Heiken and Wohletz, Reference Heiken and Wohletz1985; Iverson et al., Reference Iverson, Kyle, Dunbar, McIntosh and Pearce2014; Dürig et al., Reference Dürig, Ross, Dellino, White, Mele and Comida2021; Ross et al., Reference Ross, Dürig, Comida, Lefebvre, White, Andronico, Thivet, Eychenne and Gurioli2022), possibly reflecting interaction between the earliest phases of the Lava Creek eruption with a proto-Lake Yellowstone (perhaps occupying the 1.27 Ma Mesa Falls caldera). Alternately, the eruption might have occurred through an icecap, such as those widely recognized to have formed over Yellowstone during MIS 6 and MIS 2 (e.g., Licciardi and Pierce, Reference Licciardi and Pierce2008). Such a conjecture is supported by correspondence of the presently accepted age of the Lava Creek eruption sequence (ca. 631 ka; Matthews et al., Reference Matthews, Vazquez and Calvert2015, and present data) to the MIS 16 cold maxima (ca. 630 ka; Lisiecki and Raymo, Reference Lisiecki and Raymo2005; Stein et al., Reference Stein, Hefter, Grützner, Voelker and Naafs2009; Gibbard and Cohen, Reference Gibbard and Cohen2019) and by the interpretation that the ash at Lander fell on active outwash stratigraphically correlated to the Sacagawea Ridge glacial advance (see Terrace-Moraine correlation below). In contrast to Lava Creek A ash, the well-sorted, delicate, shard-shaped vesicle-wall fragments that dominate Lava Creek B tephra at Muddy Ridge (Fig. 6c) and elsewhere are characteristic of dry magmatic eruptions (Walker, Reference Walker1971; Heiken and Wohletz, Reference Heiken and Wohletz1985; Iverson et al., Reference Iverson, Kyle, Dunbar, McIntosh and Pearce2014).
Soil morphology
Deposition of the ash onto/within with the coarse-grained alluvium beneath the terrace surface suggests the ash was deposited while this floodplain was actively aggrading. Coarsening of the stream materials in the horizons immediately above the ash (Table 1) would appear to result from a temporary increase in stream power, which would have increased the volume of outwash. This appears to have been followed by an overall decrease in sediment yield (finer-grained alluvia) and by alternating sequences of variable grain sizes, suggesting alternations of aggradation and erosion (although there is no visual evidence of local cut-and-fill here). These fluctuations of fine and coarse alluvium above the ash horizon most likely resulted from normal alluvial processes associated with active braided stream channel dynamics in a period of rapidly changing climate.
The change from coarse-grained alluvium into which the ash fell to the less coarse-grained alluvium in horizons farther above the ash support the assumption that probably episodic erosion here removed unknown amounts of material for unknown amounts of time. Thus, the alluvial characteristics of horizons above ∼100–70 cm in these profiles are most likely due to a number of changes in stream dynamics here following ash deposition and even later pedogenic processes. Thus, these soil profiles do not represent a complete pedogenic history for this terrace.
Similar truncated profile sequences have been reported from soils developed on Bull Lake and Sacagawea Ridge moraines and terraces elsewhere in this region. Chadwick et al. (Reference Chadwick, Hall and Phillips1997) and Hall (Reference Hall1999) showed that the characteristics of A and Bt horizons “do not follow age-dependent trends” (Hall, Reference Hall1999, p. 248), while the lower horizons of these soils (especially carbonate horizons) seem to do so. The near-surface horizons of these soils appear to be about the same age and therefore younger than the underlying horizons; thus “… the older the soils the more likely the sola have been stripped (perhaps several times) and then reformed” (Hall, Reference Hall1999, p. 257). The near-surface horizons are presumed to be the result of later soil-forming processes involving loess mantling, erosion (Dahms, Reference Dahms1993; Hancock et al., Reference Hancock, Anderson, Chadwick and Finkel1999; Dühnforth et al., Reference Dühnforth, Anderson, Ward and Blum2012), sheet wash, and/or mass wasting (Hall and Shroba, Reference Hall and Shroba1993, Reference Hall and Shroba1995).
Pedogenic CaCO3
Concentrations of pedogenic CaCO3 (the carbonate ‘stages’ of Gile et al., 1966, 1981; Bachman and Machette, Reference Bachman and Machette1977) are normally considered the most notable age-related soil characteristic in this region. The relation between age and pedogenic carbonate content is generally consistent in this region, although climate-related pedogenic processes associated with alternating glacial–interglacial cycles affect the rates of addition/loss and redistribution of soil carbonates and thus should show more effects in increasingly older profiles (Chadwick et al., Reference Chadwick, Hall, Kelly, Amundson, Gosse, Phillips and Jaworowski1994; Hall, Reference Hall1999; Dühnforth et al., Reference Dühnforth, Anderson, Ward and Blum2012; Dahms and Egli, Reference Dahms and Egli2016; Foster et al., Reference Foster, Anderson, Gray and Mahan2017). In their horizons of maximum profile CaCO3 contents, Chadwick et al. (Reference Chadwick, Hall, Kelly, Amundson, Gosse, Phillips and Jaworowski1994) and Hall (Reference Hall1999) showed that there is no significant relationship between the horizon content of pedogenic carbonate (%) and the morphology of carbonate stages (due to above processes of redistribution and loss, etc.). Nonetheless, a general relationship between carbonate stage versus age can be recognized. Soils on Pinedale (MIS 2) moraines at the Bull Lake type area (BLTA) exhibit pedogenic carbonate stages I, II, and III, while soils on Bull Lake (MIS 6) moraines at the BLTA and Dinwoody Lakes consistently exhibit carbonate stages ranging from II to III+. Soils described from the Sacagawea Ridge moraines at these localities regularly exhibit even more intensely developed carbonate stages of II+ to IV, while soils on outwash terraces in the northern Bighorn Basin only exhibit Stage III carbonates on surfaces estimated to be older than ca. 400 ka (Reheis et al., Reference Reheis, Ritter and Palmquist1984). Thus, since both of the Airport Terrace profiles exhibit multiple Stage III+ pedogenic carbonate horizons (Table 1; LA-1-5 and LA-2-5), the morphology exhibited by these profiles is consistent with profiles described from pre-Bull Lake moraines and terraces in the Wind and Bighorn basins (Reheis et al., Reference Reheis, Ritter and Palmquist1984; Chadwick et al., Reference Chadwick, Hall, Kelly, Amundson, Gosse, Phillips and Jaworowski1994; Hall, Reference Hall1999).
Similarly, Dahms and Egli (Reference Dahms and Egli2016) reported an increase in inorganic C (g/kg) with age in the soils of three suites of terraces along the Popo Agie River. The average contents of inorganic C (average horizon content) clearly increase (Dahms and Egli, Reference Dahms and Egli2016, fig. 4A) with time from the Pinedale soils (∼20 g/kg) to the Bull Lake soils (∼40–60 g/kg) to ∼70 g/kg on the oldest pre-Bull Lake terraces. The levels of the inorganic C stocks in these pre-Bull Lake soils are roughly consistent with carbonate accumulations reported from the Sacagawea Ridge soils at the BLTA and Dinwoody Lakes (Hall, Reference Hall1999) and from the soils on terraces containing Lava Creek ash in the northern Bighorn Basin (Reheis, Reference Reheis1987; Reheis et al., Reference Reheis, Ritter and Palmquist1984).
Soil meteoric 10Be
Profile distribution of 10Be
The abrupt decrease in the content of meteoric 10Be in profile LA-1 into the ash layer from the alluvium below the ash (Table 4) shows that, at the time of ash deposition, the alluvial material on which the ash was deposited was at the surface. Thus, the material below the ash layer had received an input of 10Be over a previous period, prior to deposition of the ash. The comparatively small meteoric 10Be contents contained in those horizons below, within, and directly overlying the ash (0.049–0.168 × 10⁸ atom/g) indicate the presence of fairly rapid rates of deposition, while the greater 10Be contents in the horizons above 110 cm (0.232–8.047 × 10⁸ atoms/g) indicate that rates of deposition above the ash horizon were much slower and more variable than in the alluvium below it.
The curve in Figure 8 is a model of the contents of meteoric 10Be in the horizons overlying the ash (Table 4). The curve begins with the near-zero content within the ash layer and includes the increase in meteoric 10Be in the horizons above it. The meteoric 10Be content along this profile reveals that some sedimentary (e.g., erosional) discontinuity is present in the profile above the ash horizon, as represented by the abrupt increase in meteoric 10Be content within horizon 2Bk2 from 110–70 cm (Table 4 and Fig. 8). This apparent interruption in the expected gradual continuity of sedimentation also appears as an abrupt decrease in bulk density from 2.1 to 1.2 (Table 1). It is not surprising that this profile shows discontinuous development, since similar discontinuities appear to be common for meteoric 10Be profiles reported from several similar soil/geomorphic situations in the region (e.g., Dühnforth et al., Reference Dühnforth, Anderson, Ward and Blum2012; Foster et al., Reference Foster, Anderson, Gray and Mahan2017).
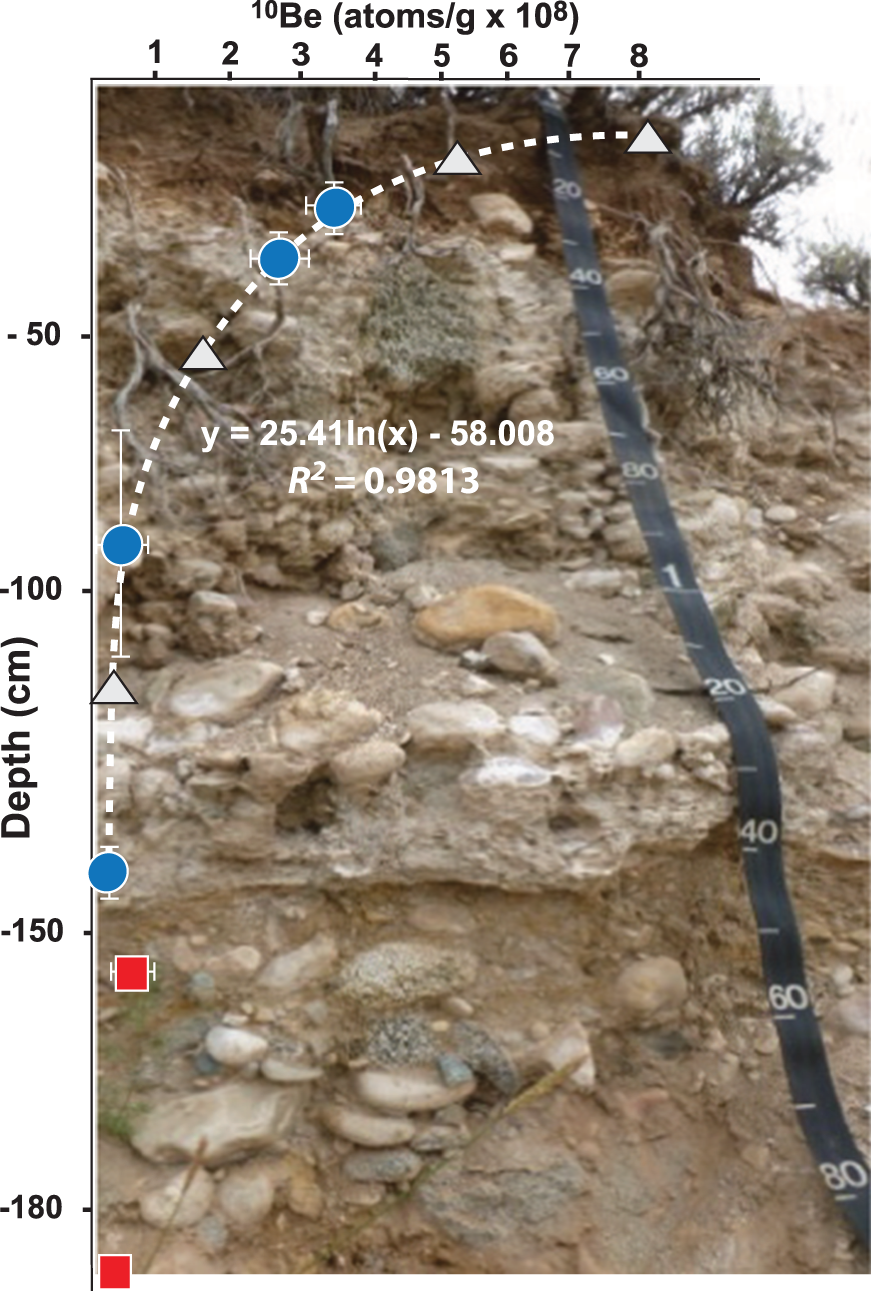
Figure 8. Plot of 10Be versus depth in soil profile LA-1. The two red squares represent samples below the ash horizon; blue circles represent samples within and above the ash horizon; gray triangles represent 10Be contents extrapolated for those soil horizons not directly analyzed from the modeled curve. Horizontal whiskers approximate the measurement error (%) shown in Table 4. Vertical whiskers represent the depth of each sampled horizon (Table 4). Note the abrupt increase in 10Be contents in the horizons above ∼70 cm depth and which continue to increase toward the surface. The abrupt increase in 10Be content suggests the profile is not the result of continuous uninterrupted pedogenic development, because a depth profile beginning with the horizons below the ash layer should show a less abrupt, more gradual increase toward the surface.
Profile age estimate
Wind and water processes continuously affect floodplains and terrace surfaces (Hall, Reference Hall1999; Benn, Reference D.I and Gornitz2009; Wagenbrenner et al., Reference Wagenbrenner, Germino, Lamb, Robichaud and Foltz2013). As we have demonstrated from our soil profile analyses, it is probable that surface erosion has sequentially removed portions of the soil surface above the ash horizon, only to redeposit fresh materials, leading to frequently interrupted pedogenic development. Consequently, those 10Be stocks that previously would have contributed to the total stock are now underrepresented; this then giving rise to our age estimate (above) of only 145–195 ka for the soil profile above the ash. This meteoric 10Be soil age estimate obviously is much too young compared with the ca. 628 ka age of the ash. Considering that such a complex of profile discontinuities almost certainly represents a significant amount of time, the discrepancy between the ash age and the profile meteoric 10Be age-estimate is not surprising (e.g., Hall, Reference Hall1999; Dühnforth et al., Reference Dühnforth, Anderson, Ward and Blum2012).
Note that the meteoric 10Be age-estimate is only semi-quantitative and is prone to systematic uncertainty, since several key assumptions (e.g., deposition rates, paleo-precipitation) cannot be absolutely validated (Derakhshan-Babaei et al., Reference Derakhshan-Babaei, Nosrati, Tikhomirov, Christl, Sadough and Egli2020). For example, Dühnforth et al. (Reference Dühnforth, Anderson, Ward and Blum2012) showed similar patterns of younger-than-expected meteoric 10Be ages in the soils on Pleistocene terraces near Boulder, Colorado. They estimated meteoric 10Be deposition rates to about 3.9–5.1 × 10⁵ 10Be atoms/cm2/yr from the previous estimate for Salt Lake City (Monaghan et al., Reference Monaghan, Krishnaswami and Turekian1986). Were we to have used these values, the age estimate our soil profile LA-1 would have been even younger (69–116 ka) than our present calculation.
Correlations and age of the Sacagawea Ridge glaciation
Terrace–moraine correlation
As noted earlier, the numeric age of moraines correlated to the Sacagawea Ridge glaciation has been poorly constrained. The principal evidence of the till’s age has been through correlation of an outwash unit containing Lava Creek ash mapped by Richmond and Murphy (Reference Richmond and Murphy1989) to the type Sacagawea Ridge moraine (although these lie on opposite sides of Dinwoody Lakes) and subsequent correlation of isolated elements of terrace WR7 along the Wind River to the Dinwoody Lakes outwash unit (Richmond and Murphy, Reference Richmond and Murphy1965, Reference Richmond and Murphy1989; Jaworowski, Reference Jaworowski, Keefer, Metzger and Godwin1993; Chadwick et al., Reference Chadwick, Hall and Phillips1997).
The provenance of the ca. 628 ka Lava Creek ash in the Lander Airport Terrace indicates the alluvium corresponds to MIS 16 (Lisiecki and Raymo, Reference Lisiecki and Raymo2005; Gibbard and Cohen, Reference Gibbard and Cohen2019). Thus, the terrace likely correlates most directly to the WR7 terraces that contain Lava Creek ash along the main Wind River between Dinwoody Lakes and Riverton (Fig. 1; Richmond and Murphy, Reference Richmond and Murphy1989; Nettleton and Chadwick, Reference Nettleton and Chadwick1991; Izett et al., Reference Izett, Pierce, Naeser and Jaworowski1992; Jaworowski, Reference Jaworowski, Keefer, Metzger and Godwin1993; Chadwick et al., Reference Chadwick, Hall, Kelly, Amundson, Gosse, Phillips and Jaworowski1994, Reference Chadwick, Hall and Phillips1997).
When the Airport Terrace gradient is projected upstream along the Middle Popo Agie River (Figs. 2 and 9) the projection meets the Middle Popo Agie River at the mapped location for the terminus of the Sacagawea Ridge valley glacier outside and downstream from the mouth of Sinks Canyon (Fig. 2; Dahms et al., Reference Dahms, Egli, Brandova, de Castro Portes, Fabel, Harbor and Christl2018, fig. 3). This projection is somewhat ambiguous, because the area outside the Sinks Canyon mouth includes a stagnant ice/moraine complex that is mapped to contain both Bull Lake and Sacagawea Ridge materials (Dahms, Reference Dahms2004; Dahms et al., Reference Dahms, Egli, Brandova, de Castro Portes, Fabel, Harbor and Christl2018). However, boulders on the Bull Lake unit here exhibit appropriate 10Be exposure ages of 93–163 ka (Dahms et al., Reference Dahms, Egli, Brandova, de Castro Portes, Fabel, Harbor and Christl2018) and the mapped position of the Bull Lake terminus is ∼500 meters upstream from where the Airport Terrace gradient projection meets the valley floor near the Sacagawea Ridge ice terminus as mapped downvalley from the mouth of Sinks Canyon (Fig. 2; Dahms et al., Reference Dahms, Egli, Brandova, de Castro Portes, Fabel, Harbor and Christl2018, fig. 3).
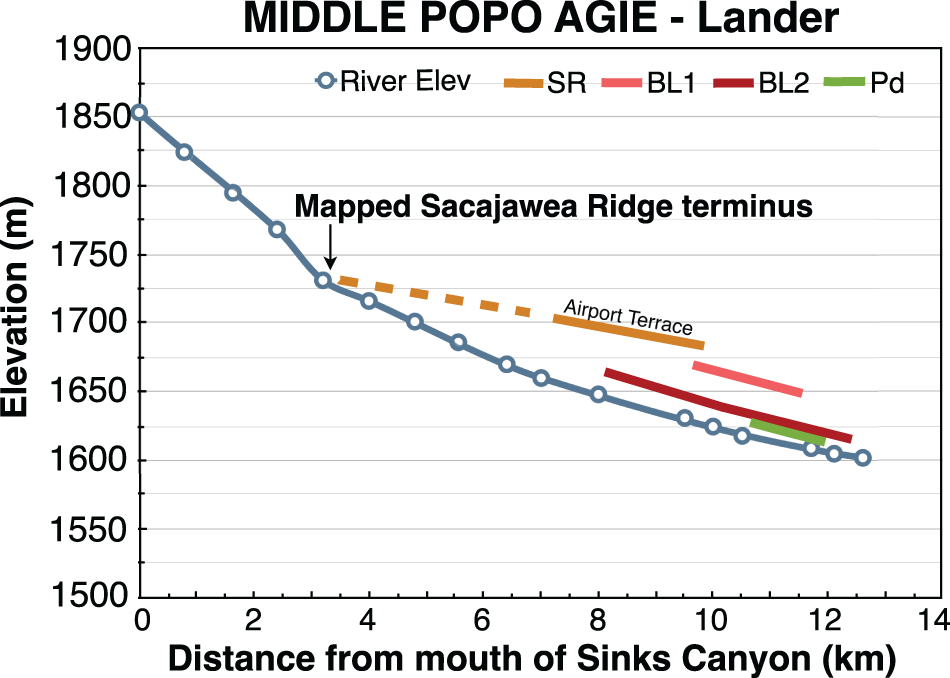
Figure 9. Visual gradients of the Pleistocene terraces previously reported by Dahms and Egli (Reference Dahms and Egli2016) above the Middle Popo Agie River in Lander, Wyoming. Elevations of terrace treads are meters above local stream level. Blue = modern stream elevation; green = Pinedale (Pd) (MIS 2); red = ‘Late’ Bull Lake (BL2) (MIS 6); rose = ‘Early’ Bull Lake (BL1) (MIS 12 or 10); yellow = Airport Terrace (Sacagawea Ridge; SR; MIS 16). The dashed yellow line represents the upstream projection of the Airport Terrace gradient as interpolated from surface elevations along the terrace. The projection meets the present stream channel where the Sacagawea Ridge moraine remnants are mapped downvalley from Sinks Canyon (Dahms et al., Reference Dahms, Egli, Brandova, de Castro Portes, Fabel, Harbor and Christl2018). Open circles indicate locations along the Middle Popo Agie River where elevations were measured. Elevations along the Middle Popo Agie River were taken at roughly one-half-km intervals at locations where elevations could be easily interpolated. Elevations of the terrace surfaces were taken from at least three locations, at intervals intended to accurately represent each terrace tread. All elevations taken from the Mount Arter SE (1978) and Lander (1978) U.S.G.S. 7.5′ quadrangle topographic maps.
We recognize the difficulty involved with correlating terrace gradients to moraines. Hancock and Anderson (Reference Hancock and Anderson2002, p. 1139) highlighted this difficulty by demonstrating that the treads of stream terraces along the Wind River apparently formed only after the sediment supply from upstream began to wane, in response to the transition from glacial-to-interglacial conditions, so that “terrace formation lags significantly behind the timing of forcing.” Additional work on the Wind River terraces between Dinwoody Lakes and Bull Lake reinforces this point, because all terrace surfaces exhibit sequences of post-outwash eolian sedimentation and erosion that overlie the coarse outwash gravels beneath (Sharp et al., Reference Sharp, Ludwig, Chadwick, Amundson and Glaser2003). As we showed previously, profiles LA-1 and LA-2 also exhibit this pattern in the variations in grain-size characteristics, as well as the 10Be contents of the profiles above the outwash gravels and ash in profile LA-1. A significant time lag appears to be represented on the Wind River terraces between the waning of sediment supplies purportedly begun at the glacial–interglacial transitions and the formation of the terrace treads (Sharp et al., Reference Sharp, Ludwig, Chadwick, Amundson and Glaser2003); however, the main body of outwash beneath the Airport Terrace surface would have already formed the main connection (and gradient) with the Sacagawea Ridge moraine front (at the outwash outlet). Thus, the surface elevation(s) we used to extend the gradient to the moraine front most likely differ(s) from the elevation(s) of the outwash on which the ash fell by only the ∼1.5-m thickness of the soil profiles above the ash. It is significant that the Lava Creek A ash occurs within the coarse outwash. This relationship indicates that the ash fell while the Middle Popo Agie was actively aggrading in response to high sediment production from the glacial activity in its headwaters.
Age of the Sacagawea Ridge tills
As noted, previous CRN exposure ages derived from boulders on Sacagawea Ridge till units have exhibited ages from 150 ka to <500 ka (Gosse, Reference Gosse1994; Phillips et al., Reference Phillips, Zreda, Gosse, Klein, Evenson, Hall, Chadwick and Sharma1997; Gosse et al., Reference Gosse, Evenson, Klein, Sorenson and Easterbrook2003). Recently, 10Be exposure ages of 556.4 ± 103.9 ka, 520.7 ± 32.5 ka, and 554.1 ± 33.3 ka were reported from granodiorite boulders on Sacagawea Ridge moraines above Sinks Canyon (Fig. 10a; Dahms et al., Reference Dahms, Egli, Brandova, de Castro Portes, Fabel, Harbor and Christl2018) and North Fork Canyon (Fig. 10b; Egli et al., Reference Egli, Dahms, Dumitrescu, Derachshan-Babaei, Christl and Tikhomirov2020), respectively. The ca. 556 ka age (Dahms et al., Reference Dahms, Egli, Brandova, de Castro Portes, Fabel, Harbor and Christl2018) was derived from boulder DS-1 located on the right-lateral moraine of the Sacagawea Ridge map unit above Sinks Canyon (Fig. 10a) that extends downvalley to terminate outside the canyon mouth (Fig. 2; Dahms et al., Reference Dahms, Egli, Brandova, de Castro Portes, Fabel, Harbor and Christl2018, fig. 3), to which we correlate the Airport Terrace. The ca. 521 ka and ca. 554 ka exposure ages were derived from boulders located above North Fork Canyon in Dickinson Park (Fig. 1 and Fig. 10b) on the left-lateral Sacagawea Ridge moraine, outside of and directly contiguous to the lateral moraines with boulders that exhibit Bull Lake exposure ages.
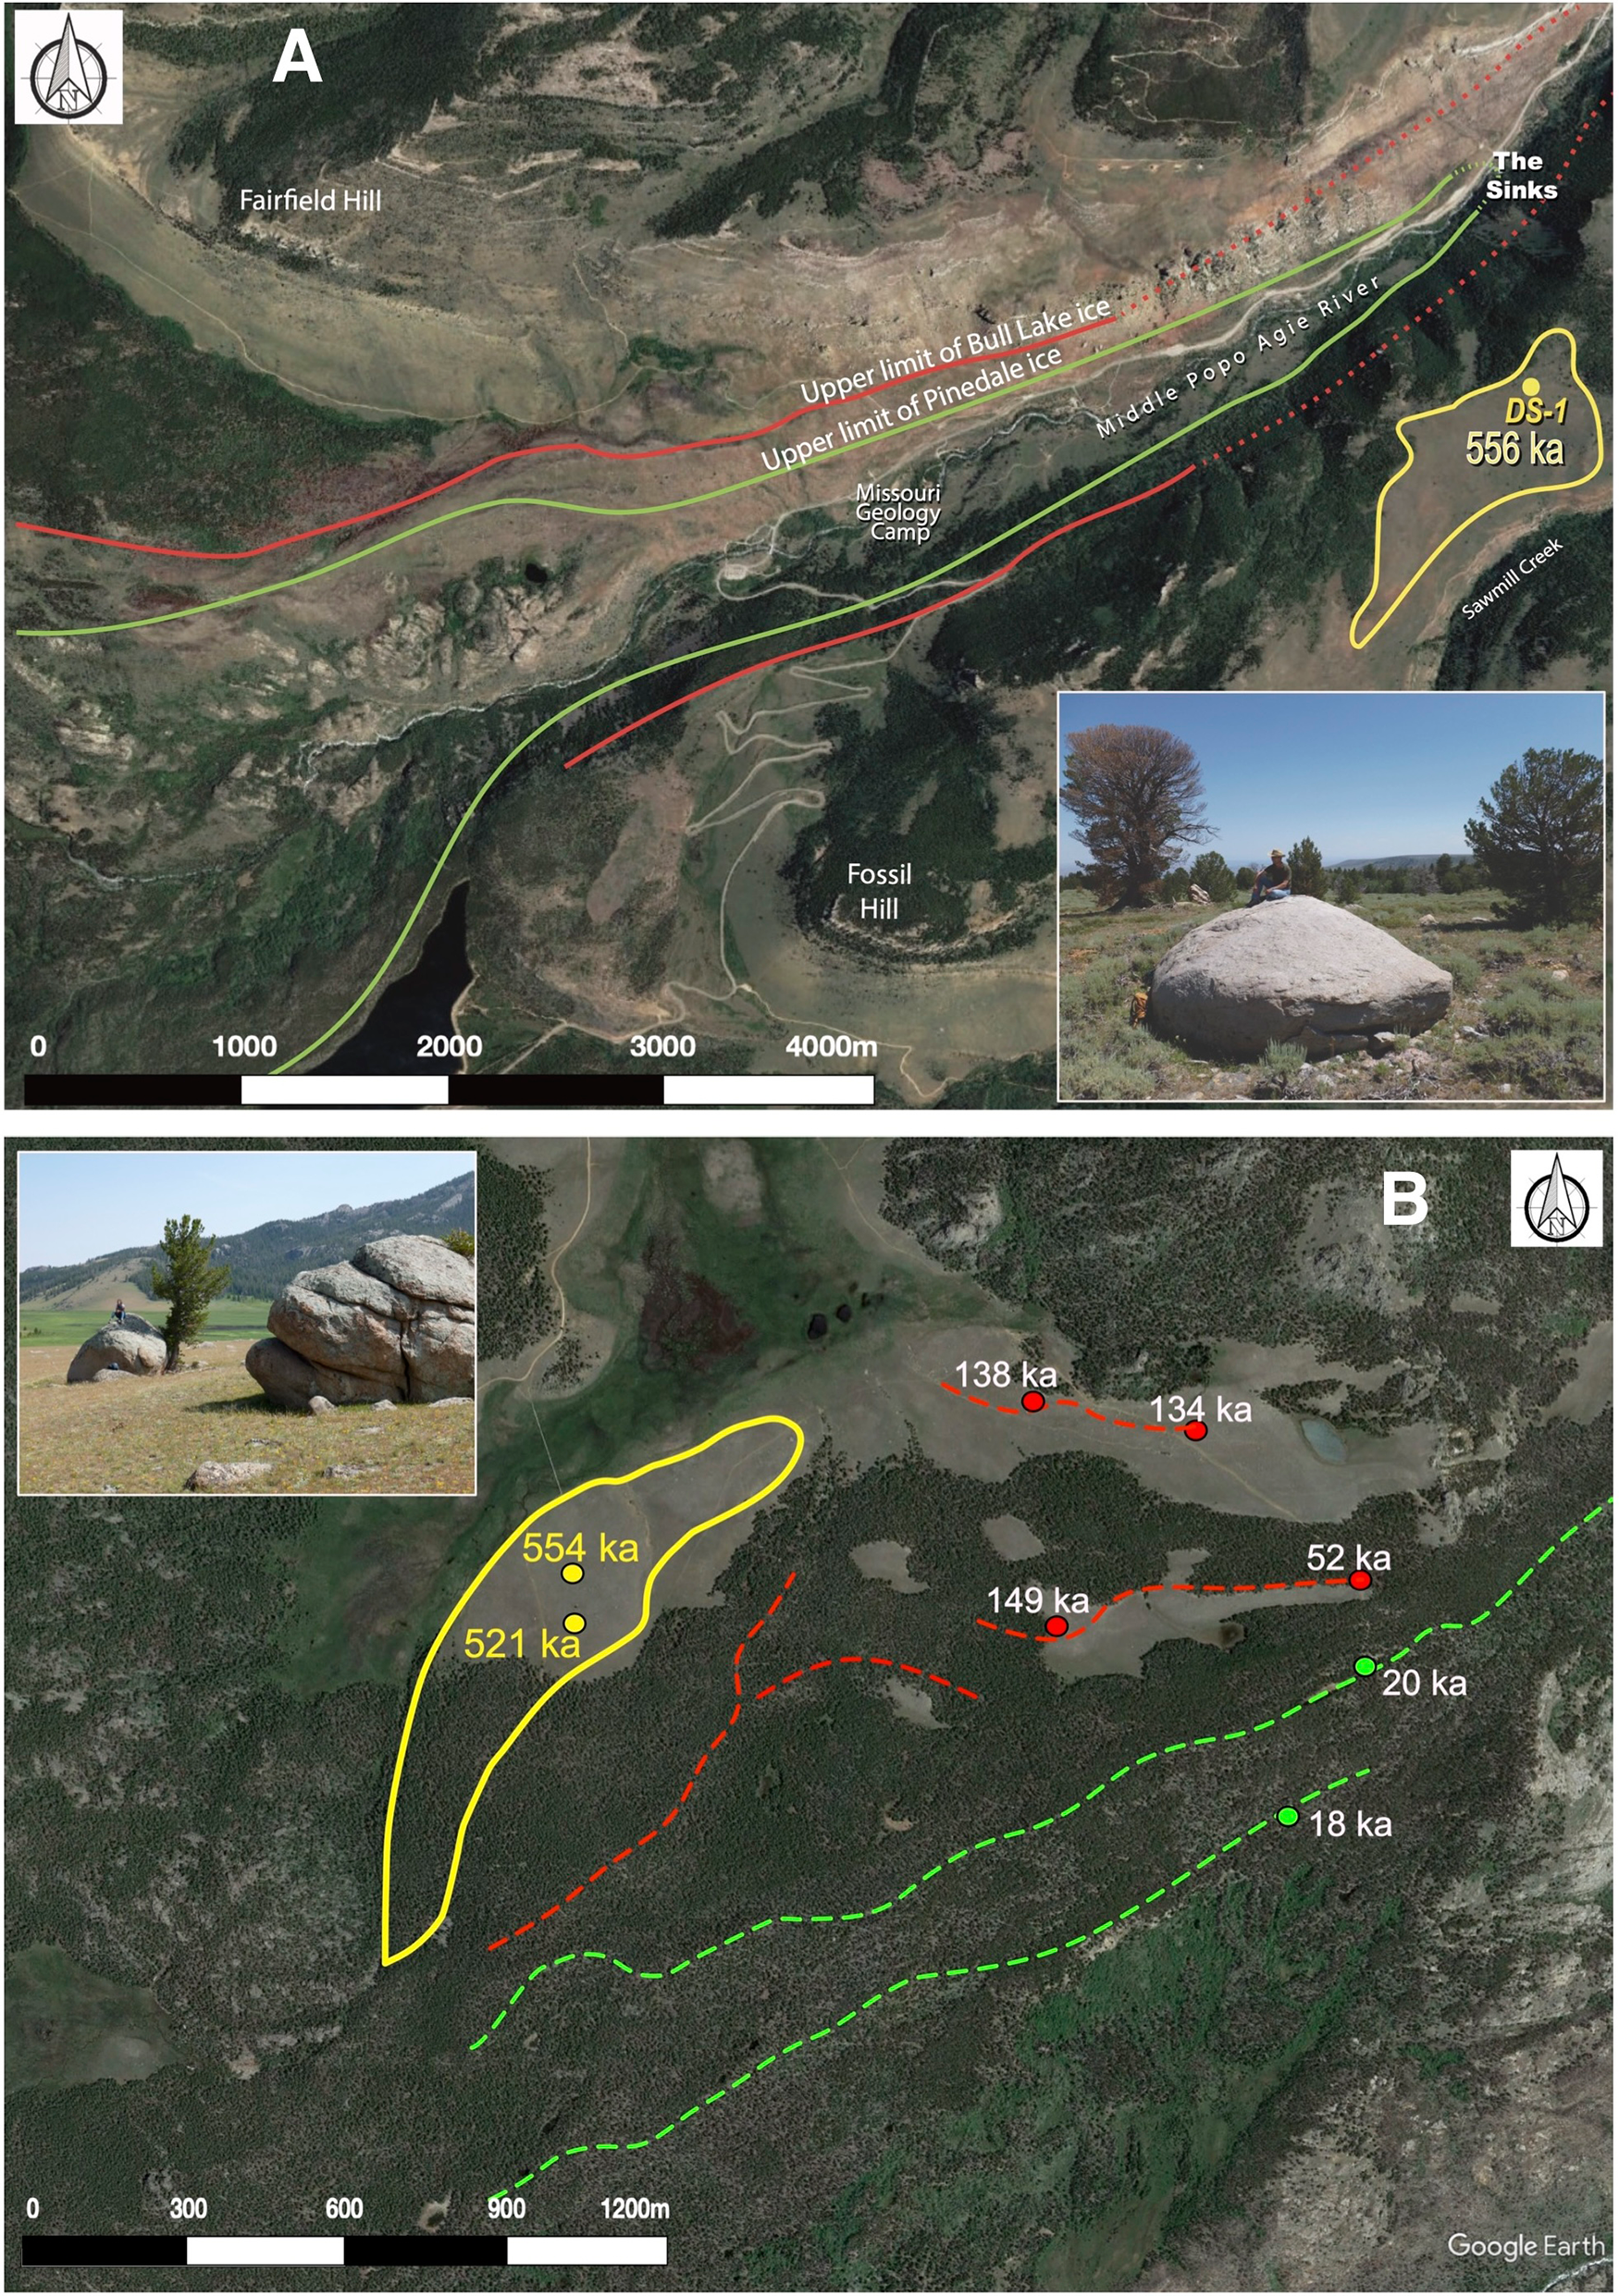
Figure 10. Locations and 10Be exposure ages of granitic boulders on deposits mapped as Sacagawea Ridge moraines above (A) Sinks Canyon (Dahms et al., Reference Dahms, Egli, Brandova, de Castro Portes, Fabel, Harbor and Christl2018) and (B) North Fork Canyon (Egli et al., Reference Egli, Dahms, Dumitrescu, Derachshan-Babaei, Christl and Tikhomirov2020). Yellow lines outline the Sacagawea Ridge units in both figures. (A) Solid red and green lines follow boundaries of Pinedale and Bull Lake moraines, while dotted lines represent extrapolated moraine boundaries (modified from Dahms et al., Reference Dahms, Egli, Brandova, de Castro Portes, Fabel, Harbor and Christl2018, figure 4). (B) Dashed red and green lines represent Bull Lake and Pinedale moraine crests, respectively (modified from Egli et al., Reference Egli, Dahms, Dumitrescu, Derachshan-Babaei, Christl and Tikhomirov2020, figure 4). Base images from Google Earth.
When we consider uncertainties in boulder erosion rates, the minimum limiting exposure ages of ca. 556, ca. 554, and ca. 521 ka from the boulders on Sacagawea Ridge moraines above Sinks (Dahms et al., Reference Dahms, Egli, Brandova, de Castro Portes, Fabel, Harbor and Christl2018) and North Fork canyons (Egli et al., Reference Egli, Dahms, Dumitrescu, Derachshan-Babaei, Christl and Tikhomirov2020) correspond reasonably well with the age of the Lava Creek A ash in the Airport Terrace. These boulder exposure ages include both external and internal error using the time-dependent Lm scaling scheme and estimated boulder surface weathering rates of 2.0, 1.0, and 1.0 mm/kyr, respectively (Dahms et al., Reference Dahms, Egli, Brandova, de Castro Portes, Fabel, Harbor and Christl2018; Egli et al., Reference Egli, Dahms, Dumitrescu, Derachshan-Babaei, Christl and Tikhomirov2020). Only slight increases in the boulder surface weathering rate estimates to 2.15, 1.25, and 1.20 mm/kyr, respectively, would increase the above exposure age estimates to 624.0 ± 230.9, 634.9 ± 133.6, and 639.6 ± 130.1 ka. The tightly grouped range of exposure ages from the boulders above Sinks and North Fork canyons appears to more closely constrain the age of these Sacagawea Ridge moraine units toward the MIS 16 cold maxima of ca. 630 ka (Lisiecki and Raymo, Reference Lisiecki and Raymo2005; Dean et al., Reference Dean, Kennett, Behl, Nicholson and Sorlein2015, Fig. 3).
If we assume that the coarse alluvial materials underlying the Lava Creek ash beneath the Airport Terrace surface are outwash deposits from a glacier that once occupied the Middle Popo Agie valley, then the projection of the Airport Terrace surface gradient to the mapped position of Sacagawea Ridge till on the Middle Fork valley floor (Dahms et al., Reference Dahms, Egli, Brandova, de Castro Portes, Fabel, Harbor and Christl2018) strongly suggests the outwash was derived from the Sacagawea Ridge valley glacier. Moreover, the presence of the ca. 628 ka Lava Creek ash in the Airport Terrace alluvium demonstrates active outwash deposition here between the most intense cold phase of MIS 16 (ca. 630 ka) and the ca. 621 ka age generally associated with Termination VII (Lisiecki and Raymo, Reference Lisiecki and Raymo2005; Gibbard and Cohen, Reference Gibbard and Cohen2019), although recent results place the termination a bit earlier, ca. 631.5 ka (Dean et al., Reference Dean, Kennett, Behl, Nicholson and Sorlein2015).
Thus, the ash-associated age of the Airport Terrace and its projection to the Sacagawea Ridge map unit in Sinks Canyon provide an additional locality to that at Dinwoody Lakes where an outwash unit containing Lava Creek ash may be traced to a Sacagawea Ridge moraine in the Wind River Mountains. The reasonably correlative 10Be minimum-limiting exposure ages from boulders on the Sacagawea Ridge moraine units in Sinks and North Fork canyons add substantial evidence to the interpretation that tills correlated to the Sacagawea Ridge glaciation in the WRM likely were deposited near the cold maximum of MIS 16.
Conclusions
New upstream exposures of a previously destroyed volcanic ash locality within the Airport Terrace above the Middle Popo Agie River in Lander, Wyoming, allow us to re-establish the ash as Lava Creek from the last major eruption of the Yellowstone caldera. 40Ar/39Ar single-crystal sanidine analyses give an age for the ash of 628.2 ± 4.1 ka, statistically indistinguishable from the 631.3 ± 4 ka age for the Lava Creek ash reported by Matthews et al. (Reference Matthews, Vazquez and Calvert2015). Geochemical analyses and morphological characteristics of the ash show it to be the ‘A’ member of the Lava Creek volcanic suite, similar to other Lava Creek A deposits previously reported from the Wind River Basin (Izett et al., Reference Izett, Pierce, Naeser and Jaworowski1992; Jaworowski, Reference Jaworowski1992, Reference Jaworowski, Keefer, Metzger and Godwin1993), as suggested by previous analysis of the original Cemetery ash deposit (Anders et al., Reference Anders, Saltzman and Hemming2009). We find no evidence for the Lava Creek B ash at the new ashfall locality. This is not surprising, since the Lava Creek B has, to date, been identified in this basin only at locations near the main course of the Wind River; it appears absent from reported exposures along the main tributaries of the Wind River, such as along the Middle Popo Agie (Jaworowski, Reference Jaworowski, Keefer, Metzger and Godwin1993; Chadwick et al., Reference Chadwick, Hall and Phillips1997).
The location of the fall- and reworked-ash exposures within the coarse alluvium of the Airport Terrace indicates that the Middle Popo Agie River was actively aggrading as outwash at the time of ash deposition (ca. 628 ka), near the MIS 16 maximum ca. 630 ka (Dean et al., Reference Dean, Kennett, Behl, Nicholson and Sorlein2015; Gibbard and Cohen, Reference Gibbard and Cohen2019). Our projection of the terrace surface grade upstream along the Middle Popo Agie to meet the valley floor at the mapped terminus of the Sacagawea Ridge valley glacier (Dahms et al., Reference Dahms, Egli, Brandova, de Castro Portes, Fabel, Harbor and Christl2018) also reveals the presence of an active glacier in Sinks Canyon at the time of the Lava Creek eruption. This stratigraphic relationship provides another location in addition to the Sacagawea Ridge type locality at Dinwoody Lakes (Fig. 1) where an outwash terrace containing Lava Creek ash may be directly correlated with a Sacagawea Ridge moraine in the Wind River Mountains (Richmond and Murphy, Reference Richmond and Murphy1989; Chadwick et al., Reference Chadwick, Hall and Phillips1997).
Additionally, accounting for boulder erosion-rate uncertainties on such older deposits, the previously reported 10Be boulder-exposure ages of 556.4 ± 103.9, 554.1 ± 33.3, and 520.7 ± 32.5 ka on the Sacagawea Ridge moraine units mapped above Sinks (Dahms et al., Reference Dahms, Egli, Brandova, de Castro Portes, Fabel, Harbor and Christl2018) and North Fork canyons (Egli et al., Reference Egli, Dahms, Dumitrescu, Derachshan-Babaei, Christl and Tikhomirov2020) support an age for the Sacagawea Ridge glaciation in the Wind River Mountains more closely constrained towards MIS 16.
Finally, if the Sacagawea Ridge glacial episode of the Rocky Mountains is constrained to MIS 16, then a correlation appears to exist (Fig. 11) to the Lava Creek ash-containing middle till (A2) of the N Group of the Laurentide Ice Sheet in the Nebraska–Western Iowa region of the U.S. midcontinent (Balco and Rovey, 2010; Rovey and Balco, Reference Rovey and Balco2011; Rovey and McLouth, Reference Rovey and McLouth2015).
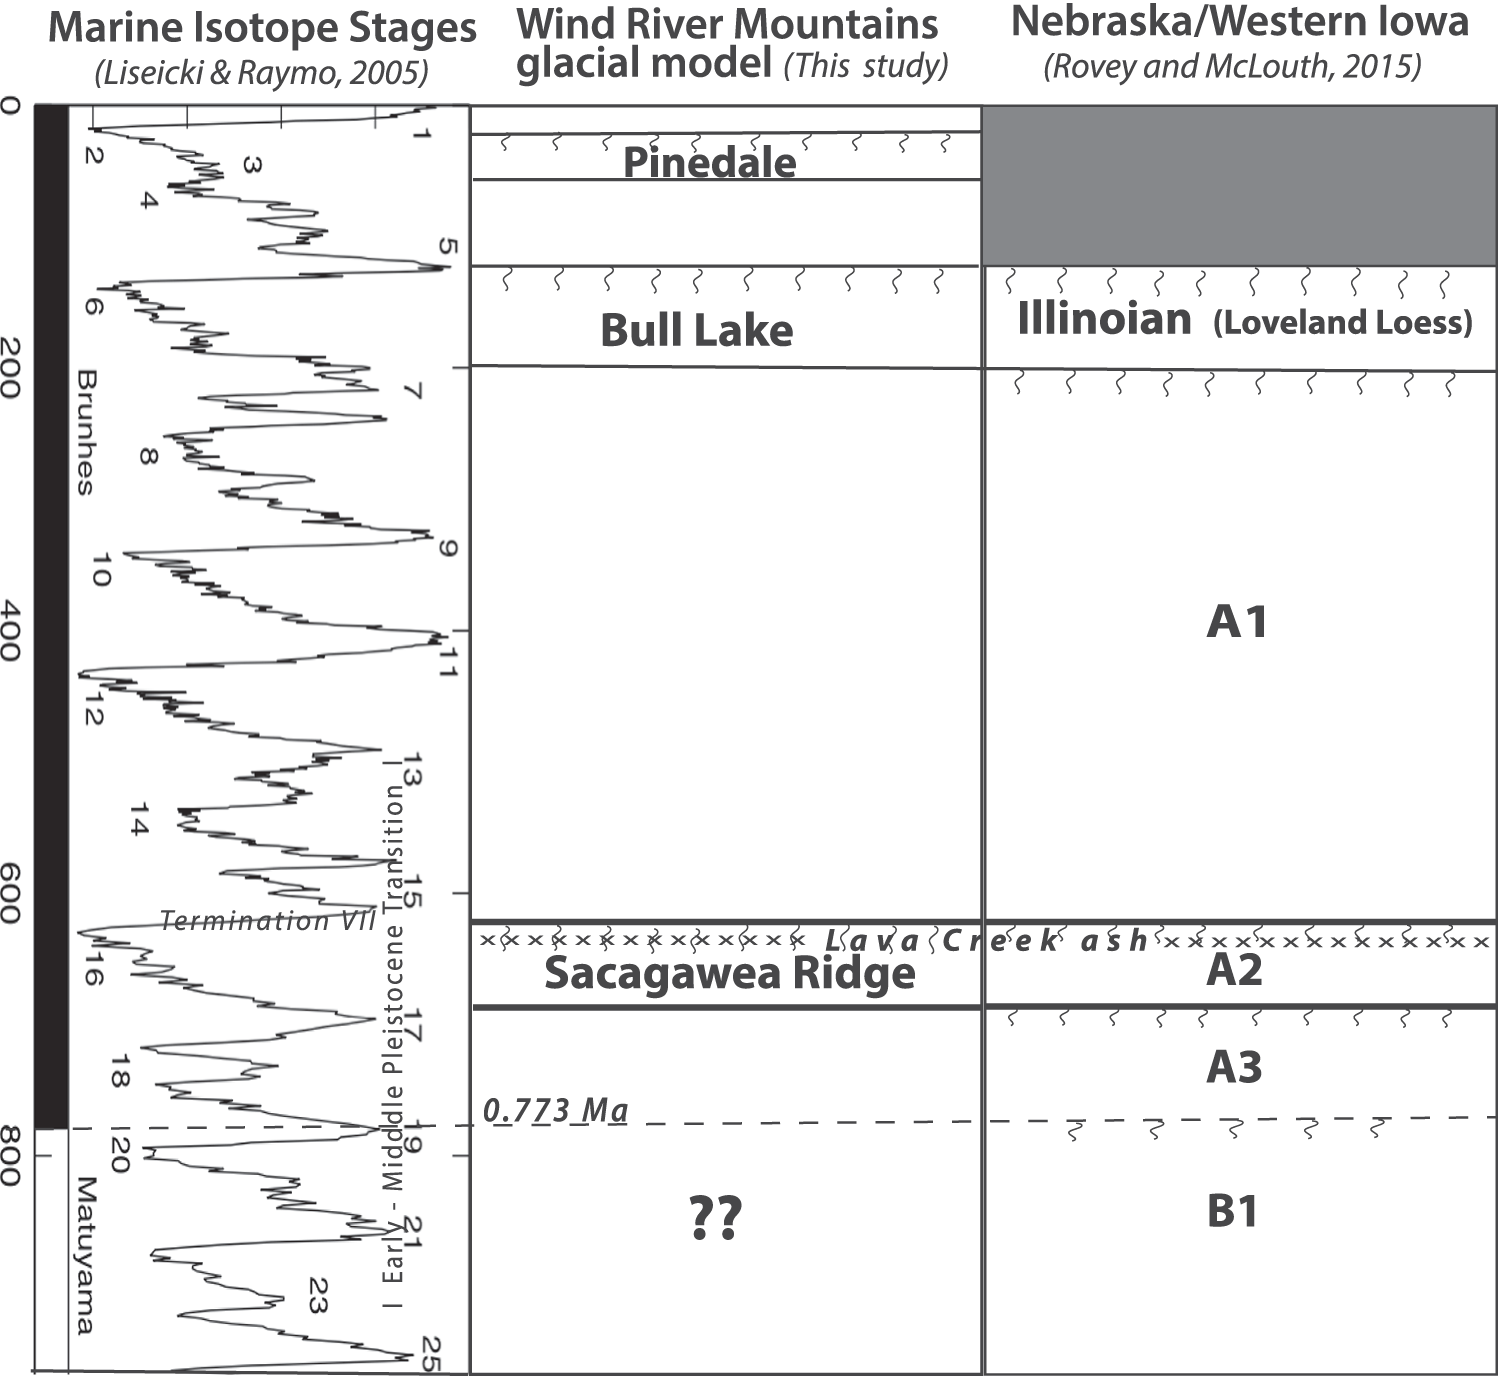
Figure 11. Correlation chart showing the published allostratigraphic units of the Wyoming Rocky Mountains (this study) and the Nebraska/western Iowa portion of the Laurentide Ice Sheet for the past ca. 900 kyr (Rovey and McLouth, Reference Rovey and McLouth2015). The record of the Marine Isotope Stages of Lisiecki and Raymo (Reference Lisiecki and Raymo2005) is shown for accurate time perspective and associated marine isotope stages. Rovey and McLouth (Reference Rovey and McLouth2015) did not illustrate the presence of the Peoria Loess as the correlate in the larger midcontinent region for the MIS 2 (Wisconsinan) glaciation (the Loveland Loess is the correlate for the Illinoian (MIS 6) glaciation). Note the apparent correspondence among the deposits attributed to the MIS 16 and later glacial advances in the Wind River Mountains and from the Laurentide Ice Sheet margin in Nebraska/western Iowa, while a lack of correspondence appears to exist prior to MIS 16 (see Conclusions).
Rovey and McLouth (Reference Rovey and McLouth2015) also reported the presence of a post-Matuyama (A3) till (<773 ka, MIS 18?) immediately below the A2 till; however, there is presently no moraine or outwash evidence reported for a similar post-Matuyama/pre-Sacagawea Ridge glacial advance in the Rocky Mountain region (Fig. 11). The only evidence for pre-Sacagawea Ridge glaciation in the WRM appears as the high elevation boulder deposits reported along the eastern slope of the range (Veggian et al., Reference Veggian, Smaglik and Dahms2010; Dahms et al., Reference Dahms, Egli, Brandova, de Castro Portes, Fabel, Harbor and Christl2018). Granitic boulders with 10Be exposure ages of ≥1.4 Ma are reported from the surface of Table Mountain (Fig. 1), which lies ∼485 meters above the location of the mapped Sacagawea Ridge terminus, with no evidence of intervening glacial activity (Dahms et al., Reference Dahms, Egli, Brandova, de Castro Portes, Fabel, Harbor and Christl2018). Similarly, the elevation of the (undated) boulder-covered surface of Red Butte (Fig. 1) lies ∼270 meters above the highest terrace outside the mouth of the North Fork of the Popo Agie (Dahms and Egli, Reference Dahms and Egli2016), again with no evidence of intervening glacial deposits.
Similar high elevation diamicts/gravels (dated to ca. 1.4–1.2 Ma) are reported from Colorado (Wolkowinsky and Granger, Reference Wolkowinsky and Granger2004; Sortor, Reference Sortor2022; Odom et al., Reference Odom, Ruleman, Sterne, O’Keefe and Morgan2024) along with evidence from the San Luis Basin for a cooling climate at ca. 1.4–1.2 Ma, followed by a major hiatus in glacial activity here until MIS 16 (Rogers et al., 1985, 1992). Thus, even though general correspondence apparently exists between alpine glacier advances in the Rocky Mountains and advances of the Laurentide Ice Sheet during MIS 16, MIS 6, and MIS 2 (Fig. 11), their records do not appear to accord prior to MIS 16. Obviously, additional work should be done in these regions to investigate the apparent lack of correspondence. However, the lack of complete stratigraphic correspondence highlights the complications involved with inter-regional correlations among Quaternary units (see Morrison and Wright, Reference Morrison and Wright1968). It is possible that the differing glacial morphodynamics of these regions (see, for example, the post-MIS 2 surges of the Des Moines and James lobes of the Laurentide Ice Sheet; Patterson Reference Patterson1997, Reference Patterson1998) suggest that we probably should not anticipate complete stratigraphic correspondence.
Supplementary material
The supplementary material for this article can be found at https://doi.org/10.1017/qua.2024.63.
Acknowledgements
Constructive reviews by Ben Laabs and David Dethier were sincerely appreciated and considerably improved the manuscript. Cal Ruleman also offered valuable advice. We thank the city of Lander and the Lander Airport for allowing access to the sites on the Airport Terrace and thanks to the staff of Mt. Hope Cemetery for allowing us to snoop around (futilely) for additional ash exposures. Mark Anders graciously provided the photo of the now-destroyed Cemetery locality shown in Figure 3d. Dagmar Brandová prepared soil samples for the 10Be analyses. We gratefully acknowledge support for the ash analyses from the UNI College of Social and Behavioral Sciences. The final form of this paper was assisted by a research stay for the senior author at the University of Zürich with the support of the Swiss National Science Foundation (Grant # IZSEZO_214797).


