

Expanding retrospective voting to pledges
Does pledge performance bear any electoral consequences for government parties? There can be significant variability in government party pledge performance. The British Conservatives, in government between 1987 and 1992, kept more than 90 per cent of their pledges. In contrast, only 24 per cent of the policy commitments of the right‐wing FPÖ, which became the second strongest party in the Austrian elections in 1999 and entered government for the first time in a coalition with the conservative ÖVP, were enacted by the end of the legislative period in 2002. This study investigates whether citizens consider this difference in performance for their voting choices. Do government parties have to fear electoral losses if they give a poor performance?
This article builds upon four major strands of literature: research on election pledge fulfilment, on citizens’ perceptions of pledge fulfilment, on retrospective voting, and on prospective voting. Only in recent years have scholars started to give serious thought towards using government performance as a record of fulfilment of promises made by parties in their electoral programs, and to study differences across countries and under different institutional arrangements (Naurin et al. Reference Naurin, Royed and Thomson2019). Of course, political scientists have been interested before in promissory dimensions of democratic accountability (Mansbridge Reference Mansbridge2003), and have empirically studied the linkage between electoral programmes and policies. Research on saliency has analysed the congruence between a party's relative emphasis on topics in its electoral program and the subsequent budgetary expenditures in this area (Klingemann et al. Reference Klingemann, Hofferbert and Budge1994). The pledges approach offers a more detailed analysis of the linkage between electoral programs and outputs. Election pledges are “commitments in parties' programs to carry out certain policies or achieve certain goals” (Thomson et al. Reference Thomson, Royed, Naurin, Artés, Costello, Ennser‐Jedenastik, Ferguson, Kostadinova, Moury, Pétry and Praprotnik2017, 528). Thus, the pledges approach focusses on specific parts of a party's electoral programme, prospective policy commitments (and not all statements in a manifesto), and depending on the content of the pledge associates them with different sources, such as legislation, ministerial decrees, or budgetary issues. The empirical results of Thomson et al. (Reference Thomson, Royed, Naurin, Artés, Costello, Ennser‐Jedenastik, Ferguson, Kostadinova, Moury, Pétry and Praprotnik2017) have shown that while parties' electoral promises are not “cheap talk”, not all of them are kept.
Scholars have also recently started to analyse how voters perceive pledge fulfilment. Admittedly, the narrative of pledge breaking politicians appears to be firmly anchored in society (Naurin Reference Naurin2011, 69–98). However, beyond this broad assessment of the general ability and willingness of any politician and party to keep previously made pledges, voters appear to be better informed about concrete pledge performances of government parties. Different scholars have provided evidence that citizens’ perceptions mirror actual pledge performance (Thomson & Brandenburg Reference Thomson and Brandenburg2019; Duval & Pétry Reference Duval and Pétry2018; Thomson Reference Thomson2011).
Research on retrospective voting has provided a wide range of evidence that voters consider parties' and politicians' past behaviour for their voting decisions. Many scholars have studied the status of the economy as a predictor of voting choices (Lewis‐Beck & Ratto Reference Lewis‐Beck and Ratto2013; Fiorina Reference Fiorina1981; Key Reference Key1966). It appears that elections are instruments through which voters reward incumbents for good economic performance, and punish them for bad economic performance. There is also some evidence that voters consider government performance in other policy fields beyond the economy, such as internal security, for their voting decisions (Cook et al. Reference Cook, Jelen and Wilcox1994; Cummins Reference Cummins2009; Marsh & Tilley Reference Marsh and Tilley2010).
Previous research has also provided a wide range of evidence for prospective voting: voters care for parties' policy positions and specific proposals offered in election campaigns (Downs Reference Downs1957; Budge & Farlie Reference Budge and Farlie1983; Hsieh et al. Reference Hsieh, Lacy and Niou1998; Elinder et al. Reference Elinder, Jordahl and Poutvaara2015). Prospective voting models consider competition between political parties, assume that election platforms are binding for the political parties and that citizens vote in accordance with their expected utility regarding the policies that a party supports in its platform.
This study aims to bridge these different perspectives on government performance and voting. I analyse retrospective pledge voting at the aggregate level, as many economic voting studies have done (Nannestad & Paldam Reference Nannestad and Paldam1994; Paldam Reference Paldam1991; Powell & Whitten Reference Powell and Whitten1993). In contrast to economic voting however, the notion of performance used in this study does not rely on an abstract, universal economic condition such as the GDP, unemployment, or inflation, but links an incumbent party's own promised policies to the actual output. The main difference between my approach and economic voting relates to how voters attribute responsibility for outputs and outcomes to parties. For economic voting, voters themselves must attribute responsibility to government parties. The economy is a very complex phenomenon: it is not only political parties that are involved but many different players, such as companies, interest groups and other states. Thus, when responsibility is not clearly attributed a priori to one of these actors, deciding which of these players to make responsible for a bad state of the economy is a very difficult task and it is inevitable that different people attribute responsibility to different actors.Footnote 1 From the perspective of retrospective pledge voting, however, parties declare themselves responsible for different policies and outcomes. Thus, retrospective pledge voting naturally establishes a link between expectations which have been created by a party itself by making promises to its voters, and the actual delivery of these promises during its time in government.Footnote 2
This is the first study that analyses electoral consequences of government party pledge fulfilment from a comparative perspective. Up until now, the very few scholars who have studied the effect of pledge fulfilment or breakage on voting have either conducted experiments in controlled laboratory conditions (Feltovich & Giovannoni Reference Feltovich and Giovannoni2015; Born et al. Reference Born, van Eck and Johannesson2018) or relied on empirical evidence in specific countries or regions (Elinder et al. Reference Elinder, Jordahl and Poutvaara2015; Johnson & Ryu Reference Johnson and Ryu2010). The results of these studies have been mixed: while the experimental scholars have found evidence that pledge breakage leads to electoral punishment of a candidate, the authors of the empirical studies – that have only focussed on specific countries and single economic pledges – have not found any support for retrospective pledge voting. This study examines electoral consequences of pledge performance of government parties beyond the economy, in various policy fields, in 14 different countries.
I argue that voters do not forget about a government party's previous election pledges and react to this party's record of fulfilment of pledges at the following election. This is to be expected because of two mechanisms: first, the enactment of pledges implies policy benefits (rewarding accomplishment), and second, government parties that do stick to their pledges during the legislative term are perceived as credible and accountable actors, and consequently voters will trust them in the future as well (attributing competence). The results of the comparative analysis indeed indicate that a government party's pledge fulfilment affects its electoral outcome. Thus, it appears that government parties worsen their chance of being re‐elected if they do not stick to what they promised their voters during the previous election campaign. However, interestingly and in contrast to economic voting, retrospective pledge voting is not more likely to emerge when clarity of responsibility is high.
This study is a first step towards improving the understanding of citizens' voting considerations by linking a prospective and retrospective perspective on voting. The findings pave the way for a better understanding of citizens’ voting considerations with regards to promissory democratic representation (Mansbridge Reference Mansbridge2003). Especially in times of rising populist parties who challenge existing democratic structures and criticise established parties for not being responsible actors, it is essential to understand how citizens evaluate and react to parties' actual performances. A notion of performance that is based on election pledges acknowledges that the relation between representatives and represented goes beyond rational benefits and is also about trust. Trust is necessary to ensure that voters actually feel represented by their representatives – and the role of election promises in this relation should not be underestimated (Rose & Wessels Reference Rose and Wessels2018).
Retrospective pledge voting
Rewarding accomplishment and attributing competence
I argue that election outcomes depend on a government's past performance in fulfilling election pledges. This study incorporates the Comparative Party Pledges Project's concept of highly specific pledges. It defines an election pledge as “a statement committing a party to one specific action or outcome that can be clearly determined to have occurred or not.” (Thomson et al. Reference Thomson, Royed, Naurin, Artés, Costello, Ennser‐Jedenastik, Ferguson, Kostadinova, Moury, Pétry and Praprotnik2017, 532).Footnote 3 I refer to the ability (or willingness) of a government party to enact its election pledges as pledge performance. I propose that the better a government party's pledge performance, the better its electoral outcome is expected to be at the next elections. The theoretical perspective of this study builds upon the established model of retrospective voting at the aggregate level, as has been suggested by economic voting scholars who see electoral outcomes as a result of general economic performances (Nannestad & Paldam Reference Nannestad and Paldam1994; Paldam Reference Paldam1991; Powell & Whitten Reference Powell and Whitten1993). However, this study widens the traditional perspective on retrospective voting by linking election outcomes to specific performances of individual government parties.
Based upon a rational choice approach of individual action (Downs Reference Downs1957), I assume voters to be rational actors and policy‐seekers who consider policies supplied by parties in the form of election pledges. They care for pledges when they are made and also scrutinise how well incumbent parties keep their pledges during the legislative term. Thus, I assume that voters do not forget about election pledges, but consider how well a government party has performed in fulfilling its pledges, and are more likely to reward that party at the next election when it has shown a better pledge performance.
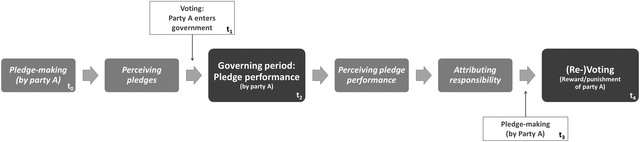
There are several steps in the causal chain between pledge fulfilment and voting, as illustrated in Figure 1. To begin, we have to go back in time. Consider Party A, offering a policy program and making pledges during an electoral campaign at t0. These pledges are perceived by citizens, who decide based on the content of these pledges whether they want to vote for party A at t1. Party A then receives sufficient votes to enter government. During the legislative term (t2), A fulfils or breaks its electoral pledges. Its pledge performance is perceived by citizens who attribute responsibility to A. Finally, citizens cast a vote at t4 and decide, based on A's pledge performance at t2, either to reward or punish it by maintaining or withdrawing their vote.Footnote 4 Before elaborating on the causal mechanisms of rewarding accomplishment and attributing competence that link pledge performance and voting (the variables that this study is mainly interested in), I will briefly go through the different steps of this chain in order to elaborate on the underlying assumptions that are inherent to retrospective pledge voting.

Figure 1. Stages from pledge‐making to voting.
Note: The figure shows the single stages from pledge making to voting in order to illustrate the theoretical assumptions and causal mechanisms as explained in the main text. The focus of this study is to analyse the link of pledge fulfilment to voting at the aggregate level, as indicated by the bigger, dark grey boxes.
The first two steps preceding pledge performance are pledge‐making and perception of pledges. During election campaigns, parties compete with each other by offering different policy proposals that are written down in their electoral programmes. They emphasise different issues (Wagner & Meyer Reference Wagner and Meyer2014), and promise different policy actions and outcomes to their voters (Ferguson Reference Ferguson2012, 67; Royed Reference Royed1996, 56–59; Wagner & Meyer Reference Wagner and Meyer2014).
When it comes to perception of pledges, of course most citizens do not read the electoral programmes of all competing parties. However, research has suggested and shown that media reports the content of electoral programmes to citizens (Bara Reference Bara2005; Merz Reference Merz2018), and that citizens indeed consider different political offers as made in electoral programmes for their voting decisions (Budge & Farlie Reference Budge and Farlie1983; Downs Reference Downs1957; Hsieh et al. Reference Hsieh, Lacy and Niou1998; Elinder et al. Reference Elinder, Jordahl and Poutvaara2015). In addition, the way pledges are defined by the Comparative Party Pledges Project implies high specificity – and specific pledges are much more likely to be identified as core policies by voters, and a party's success (or failure) to enact specific pledges is more likely to be accurately perceived by voters (Naurin & Oscarsson Reference Naurin and Oscarsson2017, 6). Thus, it can be assumed that electoral platforms and the pledges contained in them play a crucial role during electoral campaigns and affect a party's chance to maximise its votes when citizens are attracted by its policy proposals.
After a party has been voted into government office, it is expected to stick to its promises during the governing period (t2). The idea of linking policies in electoral programs to actual policy outputs and outcomes has been manifested in the mandate theory, the responsible party model and in the concept of promissory representation (Mansbridge Reference Mansbridge2003; McDonald & Budge Reference McDonald and Budge2005; Klingemann et al. Reference Klingemann, Hofferbert and Budge1994). Citizens consider pledge fulfilment as one of the most crucial qualities of good governing behaviour, and the abandonment of pledges leads to great distrust in political parties (Rose & Wessels Reference Rose and Wessels2018). Empirically, electoral programs do indeed predetermine the legislative agenda to a large extent. However, there still is a variance between governments in their ability (or willingness) to stick to their pledges during the legislative term (Thomson et al. Reference Thomson, Royed, Naurin, Artés, Costello, Ennser‐Jedenastik, Ferguson, Kostadinova, Moury, Pétry and Praprotnik2017). The government setting clearly affects a party's ability of fulfilling its original election pledges. For example, being in a coalition makes it a priori more difficult for a party to enact its election pledges when compared with a single party government. Usually, coalition partners write a coalition agreement at the beginning of the legislative period which to a large degree sets their governing agenda (Timmermans Reference Timmermans2003; Moury Reference Moury2011).Footnote 5 In line with that, pledge scholars have found that election pledges that are supported in the coalition agreement are more likely to be enacted (Mansergh & Thomson Reference Mansergh and Thomson2007; Matthieß Reference Matthieß2019). However, even if on average the share of pledge fulfilment is lower for parties in coalitions when compared with single party governments, there still is considerable variation within each of these groups. In the empirical sample used in this study, pledge fulfilment of single party governments empirically ranges from 45 to 92 per cent and for coalition parties from 23 to 83 per cent. Consequently, I assume that voters react to different performances given by parties in coalitions – although it might be to a lesser degree when compared with parties in single party government, as will be elaborated below (H2).
Perception of pledge performance and attribution of responsibility link the two main steps – pledge performance and voting – to each other. In general, there appears to be a negativity bias with respect to citizens’ evaluations of parties’ abilities and willingness to fulfil their pledges (Naurin Reference Naurin2011, 69–83). However, despite this general negativity bias, citizens still perceive differences in pledge performance. Research that has more thoroughly looked into evaluations of pledge performance – perceptions of the overall rate of pledge fulfilment as well as the enactment of single pledges – has demonstrated that citizens' accurate evaluations of pledge fulfilment depends significantly on the actual performance of government parties. These studies have shown “that people hold far more nuanced and accurate views on promise keeping and breaking than suggested by their responses to general questions” about whether political candidates or parties generally stick to their election pledges (Thomson & Brandenburg Reference Thomson and Brandenburg2019, 25). General questions about whether political parties keep their pledges might actually be a measure of political trust rather than a way to evaluate citizens' knowledge about actual pledge fulfilment (Naurin & Oscarsson Reference Naurin and Oscarsson2017, 3). Of course, how people perceive and evaluate political information in general (Simon Reference Simon1955; Campbell et al. Reference Campbell, Philip, Miller and Stokes1960, 133; Evans & Andersen Reference Evans and Andersen2006) and pledge performance in particular, might be moderated by their prior beliefs (Belchior Reference Belchior2019; Markwat Reference Markwat2014; Duval & Pétry Reference Duval and Pétry2018). Belchior (Reference Belchior2019) has argued and shown for Portugal that people who do not sympathise with the government and who identify with an opposition party are more likely to be biased in judging actual fulfilled pledges as broken. But, this is not necessarily inconsistent with my argument: voters who identify with and/or voted in a previous election for a government party are expected to be better at accurately evaluating that party's pledge performance. Thus, even if there might be a general negativity bias in evaluations of pledge performance (e.g. 50 per cent of actual pledge fulfilment might generally be perceived as only 40 per cent), I assume that citizens who generally identify with a government party still do perceive different levels of congruence between specific promises and outcomes (that empirically range from 23 per cent to over 90 per cent) and are able to attribute responsibility to the party in question – and this ultimately affects their voting decisions.Footnote 6
Turning now to the main causal mechanism of this study: how does pledge fulfilment influence voting? I argue that a party's pledge performance affects its chances of being re‐elected in at least two different ways. The first one involves the idea of rewarding accomplishment. This argument builds upon the established theory of retrospective voting used by economic voting scholars who see elections as instruments with which voters reward or punish governments on the basis of past economic developments (Key Reference Key1966; Fiorina Reference Fiorina1981). The perspective of rewarding incumbents based on their performance is expanded to individual government parties that, as I argue, are held accountable according to the congruence between their formerly made policy propositions in various policy fields during the electoral campaign and the policies implemented during the legislature. It is worth taking another look at Figure 1 which traces the path from pledge‐making to voting. As has been argued above, voters decide to vote for the party who is closest to their own preferences for a past election at t1 (Downs Reference Downs1957). Policy proposals made at t0 are expected to satisfy these voters’ personal desires. Since voters are policy‐seekers, the enactment of these pledges maximises their utilities. Thus, when the party they supported enters government after the election, they expect that party will stick to the policy proposals offered during the electoral campaign and will translate them into actual policies and outcomes during their time in office. At the next election at t4, voters look back and reward their party by re‐electing it if it has fulfilled its pledges. Equally, they punish it for failure by withdrawing their support and electing a competitor (or abstaining from the election). Thus, according to this first scenario of rewarding accomplishment, citizens’ voting decisions are based on backwards‐looking reasoning: past achievements are rewarded on the day of election.
The second causal mechanism that I present here refers to the idea of attributing competence to a party. In this scenario, voters are not only assumed to look back and reward or punish a party according to its past performance, but also look to the future and use the past performance that a government party has shown as a source of information. In this way, they select competent officials who will continue to run for office over the long term (Ferejohn Reference Ferejohn1986). Building upon the idea of prospective voting, when electing a party at t4, voters must choose based on the offer of different policy proposals (Downs Reference Downs1957), and in doing so take a leap of faith. But how can they be sure that the party that they have elected will not forget about its election pledges after entering government? A valuable source of information for deciding whether to trust someone in the future is past experience. Competence and trust are essential qualities of political candidates that are considered by citizens for their voting decisions. Abramowitz (Reference Abramowitz1988) has emphasized the increasing role of candidate characteristics, since the “weakening of party loyalties in the electorate means that candidates must increasingly rely on personal appeal to gain votes” (398). In particular, it appears that incumbents lose significant support when their involvement in political scandals is revealed to the public (Abramowitz Reference Abramowitz1988; Krosnick & Kinder Reference Krosnick and Kinder1990; Peters & Welch Reference Peters and Welch1980). Thus, a government party that has shown good performance by sticking to its promises during t2 is perceived as a competent and responsible actor, and voters will trust that this party will be committed to its promised policies in the future as well. Equally, voters will be sceptical when a party has not kept the promises upon which it was elected into office in the first place. A party suffers from credibility problems with respect to holding future commitments when it has strongly deviated from its past policy agenda and has shown fundamental ideological shifts – voters will not perceive this party as a competent actor, lose trust, and consequently, withdraw their support at the polls even if they do not oppose the party's new electoral program at t3. Thus, in this second scenario of attributing competence, citizens employ forward‐looking reasoning for their voting choices: based upon on a party's past performance, an evaluation can be made as to whether that party is a competent and trustworthy actor that is expected to stick to promises in the future as well, and should therefore be supported at the polls.
Both perspectives, rewarding accomplishment and attributing competence, are plausible mechanisms that link pledge performance to voting. They might be valid at the same time, and thus are not mutually exclusive. For example, voters might simultaneously be forward‐ and backward‐looking: they want to support party A at the polls because they are pleased with its past performance, and at the same time they can be certain that the party's new program will be implemented as well. This study does not aim to disentangle both mechanisms. What is essential here is that there are at least two mechanisms that provide reasonable arguments as to why pledge performance affects voting.
I expect that voters decide whether to support a party in future elections based on its previous pledge performance. The sum of these individual decisions is then expected to be observable at the aggregate level, which is reflected in election results.
Hypothesis 1: The better a government party's pledge performance, the better its electoral outcome.
Clarity of responsibility
The previous arguments were based on the assumption that voters are rational, policy‐seeking actors. This assumption implies that voters are always equally well informed about outcomes of policy‐making‐processes, and that they all apply the same reasoning when judging an individual party's ability and willingness to keep its pledges – independently of the context. However, there is a wide range of various government and institutional settings that might decrease the chance that voters accurately perceive information about pledge fulfilment and make strict judgments about a government party's pledge performance. Thus, under certain conditions, such as higher levels of complexity in policy‐making, a citizen's rationality might be bounded or affected by other conditions when taking retrospectively informed voting decisions (Powell & Whitten Reference Powell and Whitten1993; Hobolt et al. Reference Hobolt, Tilley and Banducci2013).
The concept of clarity of responsibility is best suited to describe these distortions in rational decision making that arise from complex institutional and government settings (Powell & Whitten Reference Powell and Whitten1993). As has already been argued above, the government setting, such as sharing power in a coalition, appears to affect a government's ability to enact its election pledges at t2. It is not just that multiple veto players in the government make the policy making process more complex due to the necessity of negotiating and compromising (Tsebelis Reference Tsebelis2002), but also that citizens are expected to have difficulties in accurately perceiving and encoding political information, such as pledge performance, when compared to situations in which only one party is in charge of the government. Various scholars have argued and shown that for economic voting if power is unified in the incumbent government, citizens are more likely to place responsibility for outcomes on incumbents (Powell & Whitten Reference Powell and Whitten1993, 398). According to Hobolt et al. (Reference Hobolt, Tilley and Banducci2013), there are two forms of clarity: institutional clarity refers to the formal, relatively static division of power within a country that is, among other things, determined by the governmental system and the existence of institutional veto players, such as second chambers. Governmental clarity concerns the cohesiveness of an incumbent government at a given time, which can change within a country, e.g. coalition versus single party government or minority versus majority. As is the case with economic voting, I expect that retrospective pledge voting is moderated by clarity of responsibility at the institutional and government level. Voters are more likely to perceive pledge fulfilment and hold parties accountable when lines of responsibility are clear.
Clarity of responsibility might moderate the relation between pledge performance and voting in two ways: first, voters face challenges in accurately perceiving information about pledge fulfilment. If lines of responsibility are blurred because a minority coalition government is formed, it becomes more difficult to receive information and make an accurate evaluation of a government party's performance when compared to a situation where a single party government with a secured majority in parliament exists. A government party with less power and fewer seats has greater difficulties in communicating its policy positions to voters than a party with more seats and power (Spoon & Klüver Reference Spoon and Klüver2017). Similarly, it can be expected that voters are more likely to perceive the achievements of a single‐party majority government than of a government party in a minority coalition, who has to find compromises with its coalition partner and additionally depends on the support of opposition parties.
Second, even if voters were fully informed about a party's pledge performance, institutional and governmental settings might affect the attribution of responsibility: voters might realise that a party's ability to successfully enact its program depends on the existence of other veto players, such as coalition partners, that make it necessary to agree on compromises, and consequently to break pledges. In such situations, it is expected that voters are more lenient in their judgments. Empirically, it is difficult to disentangle whether the conditioning effects emerge during the stage of accurate perception or attribution of responsibility. However, for the purpose of this study it is important that blurriness in lines of responsibility is expected to weaken the effect that a government party's pledge performance has on citizens' voting decisions.
Hypothesis 2: The higher the clarity of responsibility, the more likely that a government party with a better pledge performance will improve its electoral outcome.
Research design
Case selection
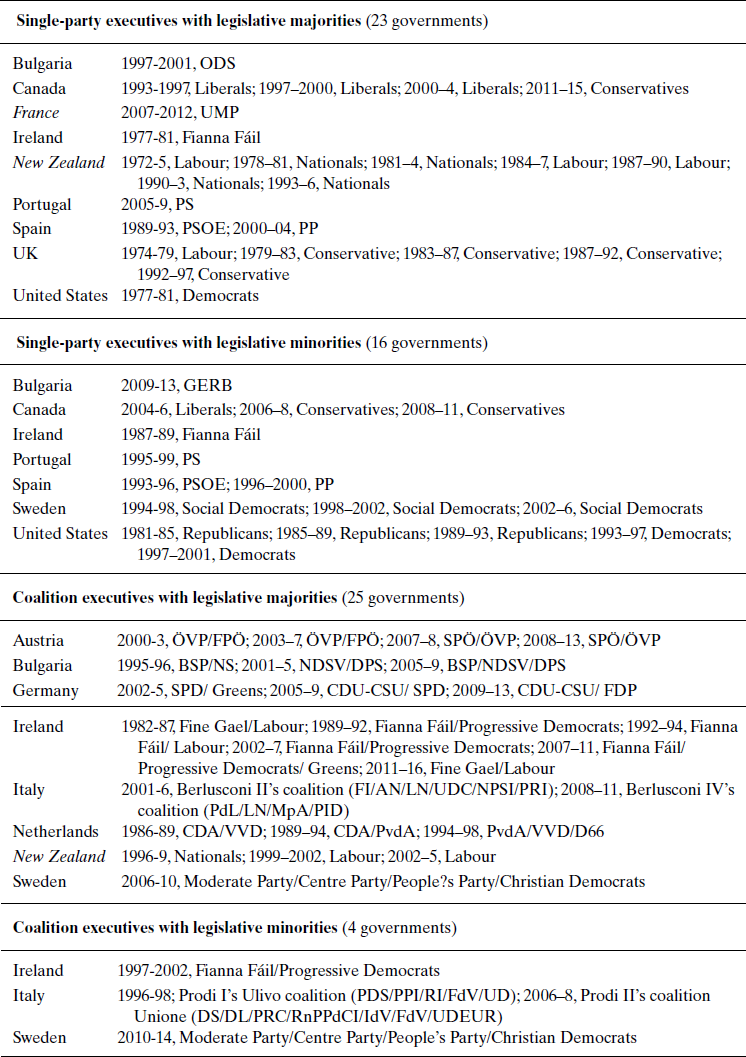
This study examines the effect of pledge performance across 14 countries and 69 elections between 1977 and 2015. The country selection includes Austria, Bulgaria, Canada, France, Germany, Ireland, Italy, the Netherlands, New Zealand, Portugal, Spain, Sweden, the United Kingdom, and the United States. Table 2 lists all included governments.
Using this comparative sample allows for analysis of the electoral consequences of pledge fulfilment in different institutional and governmental settings – thereby increasing the confidence in the external validity of the findings. For example, there is variation between countries with respect to institutional features such as unicameralism and federalism. Federal, bicameral countries such as Germany as well as unitary, unicameral systems such as Sweden are considered in this study. In addition, the governmental settings differ both between and within countries: in Ireland, for example, single‐party executives with and without legislative majorities, as well as minority and majority coalitions, have been formed. The variation in institutional and government features will be considered in the analysis by controlling for different degrees of clarity of responsibility.
Measuring electoral outcome
The dependent variable is operationalised in three different ways: change in vote share, absolute vote share and vote ratio. Change in vote share is an established measurement in the economic voting literature (Powell & Whitten Reference Powell and Whitten1993; Paldam Reference Paldam1991). Incumbent gains or losses are calculated by subtracting the percentage of valid votes won by each government party in the current election by the percentage in the previous one. Data source for calculating the dependent variable is the Manifesto Project Dataset (Volkens et al. Reference Volkens, Lehmann, Matthieß, Merz, Regel and Weßels2017). On average, the vote share is ‐0.05. Thus the government parties considered in this study suffer a 5 per cent vote share loss on average.Footnote 7 The absolute vote share is measured by the percentage of votes won by the government in a current election at t2 (Lewis‐Beck & Mitchell Reference Lewis‐Beck and Mitchell1990). Vote ratio is calculated as the incumbent gains or losses by dividing the percentage of valid votes won by each government party in the current election (t2) by the percentage in the most recent one (t1).
Measuring pledge performance and clarity of responsibility
The main independent variable, pledge performance, is operationalised as the share of election pledge fulfilment for each government party and is calculated by dividing the number of fulfilled pledges by the number of total pledges for each party. The data are extracted from the large‐scale comparative analysis of election pledge fulfilment assembled by scholars from the Comparative Party Pledges Project – CPPP (Thomson et al. Reference Thomson, Royed, Naurin, Artés, Costello, Ennser‐Jedenastik, Ferguson, Kostadinova, Moury, Pétry and Praprotnik2017). According to the CPPP's definition a pledge is “a statement committing a party to one specific action or outcome that can be clearly determined to have occurred or not” (Thomson et al. Reference Thomson, Royed, Naurin, Artés, Costello, Ennser‐Jedenastik, Ferguson, Kostadinova, Moury, Pétry and Praprotnik2017, 532). This means that in order to be identified as a pledge, an electoral commitment is required to have specificity, so that a researcher can find clear evidence for its fulfilment. After a pledge has been identified, a second coding step consists of determining its status of enactment. Document sources for deciding whether a pledge was fulfilled include legislation, ministerial decrees, and budgetary, as well as secondary sources. In order to ensure high quality data, the CPPP has conducted several coder reliability tests for both coding stages, within and between countries (see online appendix).
The data for France and New Zealand are added from country studies conducted by Bouillaud et al. (Reference Bouillaud, Guinaudeau and Persico2017) and McCluskey (Reference McCluskey2008) who have applied a similar coding procedure, as suggested by the CPPP, when gathering their data. However, since these data have not been part of the CPPP's project and there is no information about the coder reliability, I will also run analyses without these countries in order to ensure that my results are not driven by deviating coding procedures.
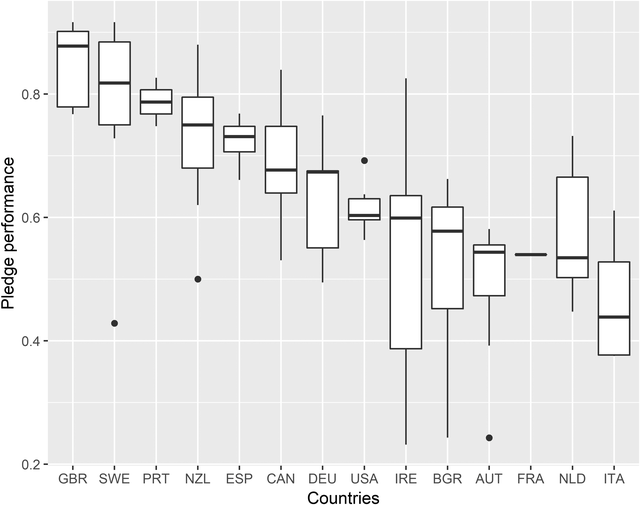
Figure 2 shows that there is variance in pledge performance across the cases that are included in this study. The average share of pledge fulfilment at the party level is 60 per cent. The lowest rate is 23 per cent (Irish Green Party in a coalition with two other parties, 2007–2011), and the highest 92 per cent (Swedish Social Democrats in a single party minority government, 1994–1998). There are countries in which parties have constantly higher rates of pledge fulfilment, such as the UK (78‐92 per cent), and other countries such as Austria (24‐58 per cent) where government parties generally show lower rates of pledge fulfilment. However, as the box plots by country in Figure 2 show, there is also substantial variation within countries.

Figure 2. Distribution of pledge fulfilment by country.
Note: Boxes are ordered by the country median of the share of pledge fulfilment from high to low.
In order to test H2, this study measures clarity of responsibility. As has been proposed by Hobolt et al. (Reference Hobolt, Tilley and Banducci2013), I also consider clarity of responsibility as a two‐dimensional concept, incorporating institutional and government clarity. I use the identical components for measuring institutional clarity as in Hobolt et al. For government clarity I make slight adjustments which allow, as I argue below, measuring this dimension more precisely for the purpose of this study.
As in Hobolt et al., this study measures institutional clarity by considering four components: weak committee structures (1 for weak, 0.5 for middle strong, and 0 for strong committees),Footnote 8 unicameralism (1 for uni‐ and 0 for bicameralism), unitarism (1 for unitary and 0 for federal state), and parliamentary system (1 for parliamentarian and 0 for (semi‐)presidential).Footnote 9 The assigned values are added up and then divided by four – the number of components. The index has an observed maximum of 1 and a minimum of 0.
For government clarity, the following components are considered: single party vs. coalition government (1 vs. 0), a government's majority status (1 for majority vs. 0 for minority government), non‐existence of bicameral opposition (1 for non‐existence and 0 for existence), and ideological cohesion within the government (continuous measure: 1 for maximum cohesion, 0 for minimum distance).Footnote 10 Ideological cohesion is calculated by considering variation between ideological positions: it is measured as the ideological distance between the leftmost and rightmost parties in coalitions, using the positions on a left‐right‐dimension as indicated by the Manifesto Project Dataset (Volkens et al. Reference Volkens, Lehmann, Matthieß, Merz, Regel and Weßels2017) and rescaled to run from 0 to 1. In single party governments, ideological cohesion is coded as 1. Finally, the assigned values for a government's coalition status, its majority status, the existence of bicameral opposition and ideological cohesion within a government are added up and divided by four. Empirically, the index for government clarity runs from 0.46 to 1.
Measuring control variables
I include three control variables which might possibly confound the hypothesised relationships. First, I consider a country's economic situation by controlling for the average economic misery. The Economic Misery Index (EMI) goes back to the economist Arthur Okun (Okun Reference Okun2011). It is calculated by adding the unemployment rate to the inflation rate (percentage change in the Consumer Price Index). For each legislature, I considered the mean of the unemployment and inflation rate between the years of two elections. The log of the variable is used in order to account for the EMI's skewed distribution. The EMI is chosen over other economic measures such as the GDP because it includes two aspects, unemployment and inflation, and these are much more likely to be perceived by citizens because they are more directly affected than by changes in the GDP. However, in order to account for the use of different economic measures in models of retrospective voting, I also estimate models as robustness checks that include alternative economic measures, such as the average GDP growth.
In addition, I control for confounding effects at the party level: a government party's vote share of a past election and its distance to the median position. In line with previous studies, the past vote share is expected to be negatively related to incumbent gains, because “it is easier to lose absolute percentage points from a larger base” (Powell & Whitten Reference Powell and Whitten1993, 395f). The distance to the median position is included in order to control for citizens' prospective voting considerations at t4. The smaller the distance to the median position at a current election, the more likely a government party is expected to gain votes (Downs Reference Downs1957). The distance is calculated by subtracting a government party's rile score as it appears in the Manifesto Project Dataset (Volkens et al. Reference Volkens, Lehmann, Matthieß, Merz, Regel and Weßels2017) from the median position. The absolute distance is divided by 100 so that it could theoretically range from 0 (occupation of the median position) to 1 (highest distance to median position). Empirically, it ranges from 0.01 to 0.47.
Analysis
In order to empirically test the formulated hypotheses about retrospective pledge voting, I rely on OLS regression models. The observations are clustered into countries and therefore all models have been estimated with clustered robust standard errors. First, I investigate the effect of pledge fulfilment on voting (H1). Second, I test whether retrospective pledge voting is moderated by clarity of responsibility at the institutional and government level (H2).
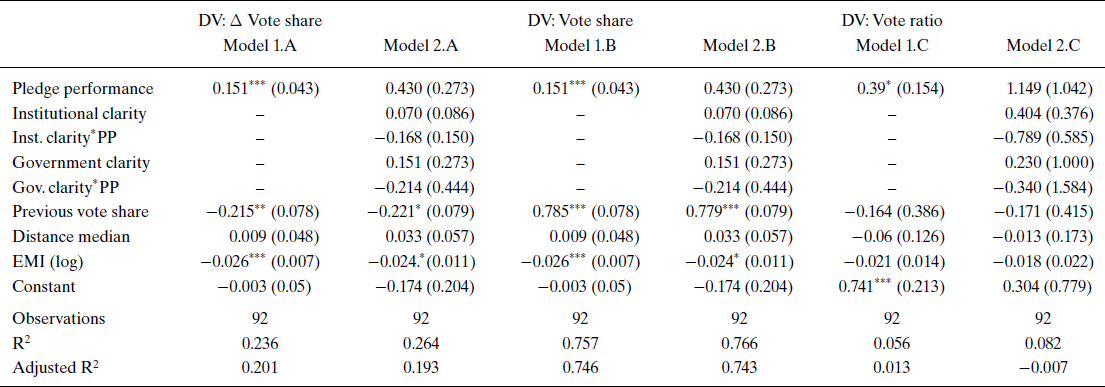
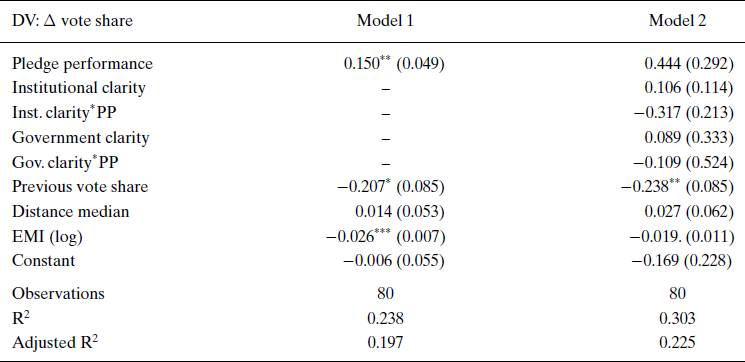
Table 1 reports the full results of the estimated regression models. There are three different measures for the dependent variable that capture a government party's electoral outcome: change in vote share (A), the absolute vote share (B), and vote ratio (C). Each of the models 1 includes pledge performance as the main independent variable and controls for the economic situation as well as the distance to the median position. The results of the models 1.A‐C show that pledge fulfilment has a positive and statistically significant effect on the electoral outcome. Higher levels of pledge fulfilment appear to be of advantage for the electoral support of a government party. Thus, the results indicate that the electoral outcome is positively affected by pledge fulfilment, as has been suggested by H1.
Table 1 The effect of pledge fulfilment on electoral performance

Notes: Results from an OLS regression with clustered robust standard errors. PP – pledge performance, EMI – Economic Misery Index.
***p < 0.001, **p < 0.01, *p < 0.05, p < 0.1.
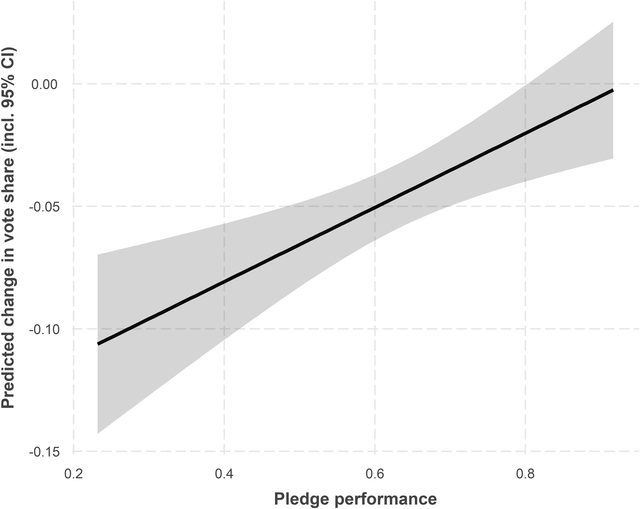
Based on model 1.A, Figure 3 illustrates the predicted values of pledge fulfilment on the change in vote share. All other variables are held at their mean. The point estimates of the predicted values are indicated by the solid lines and the 95 percent confidence intervals are illustrated by the grey area. The figure shows that the electoral performance of a government party steadily improves with the pledge performance. A government party that enacts 50 per cent of its election pledges would have to fear losing seven per cent of its votes, while a party that reports a pledge fulfilment rate of 80 per cent would lose two per cent of votes from one election to another. Thus, there is a tendency to lose rather than win votes for government parties at subsequent elections – this has been also suggested and shown by previous studies (Whitten & Palmer Reference Whitten and Palmer1999; Paldam Reference Paldam1986). Nevertheless, this predication is in line with H1: a government party shows a better electoral performance when it has shown a better pledge performance.Footnote 11

Figure 3. Effect of pledge fulfilment on electoral performance.
Note: The figure is based on model 1.A in table 1. Grey area indicates 95% confidence intervals.
Now looking at models 2.A‐C and the impact of clarity of responsibility that has been shown by previous studies to be a crucial moderator of retrospective economic voting. For voting based on pledge performance, however, the story seems to be different. For both clarity measures negative – albeit not statistically significant – interactions terms are reported. Higher clarity does not appear to make retrospective pledge voting more likely to occur. Thus, clarity of responsibility does not show the expected effect, which is yet another indication that retrospective pledge and economic voting differ from each other in some key aspects.
With regard to the control variables in Table 1: as expected and in line with previous studies, the vote share of a past election is negatively related to changes in vote share ‐ it is easier to lose votes from a larger base. Only in the models 1.B and 2.B a positive effect is reported: the vote share in the previous election (lagged dependent variable) appears to positively impact the current absolute vote share. But this is not surprising: for example, a party that gained 30 per cent of votes at t1 might lose votes at a subsequent election, but is still more likely to receive 25 per cent of votes at t2 when compared to a party that had a vote share of 5 per cent at t1. As expected, the economic misery index (EMI) shows a negative and (apart from models 1/2.C) statistically significant impact on an incumbent party's electoral performance. The effect for the distance to the median position is positive (as expected) in the model variants A and B, but negative in C, but in all models it is neither substantial in size, nor statistically significant.
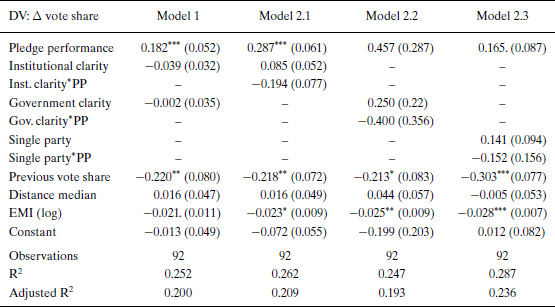
In order to validate the findings, different robustness checks have been performed. All of these additional models can be found in the appendix.Footnote 12 First, the models have been re‐estimated without France and New Zealand which have not been coded by the CPPP (Bouillaud et al. Reference Bouillaud, Guinaudeau and Persico2017; McCluskey Reference McCluskey2008). Table 3 shows that the results do not substantially differ when these cases are excluded. Second, table 4 considers the clarity measures as additional controls for testing H1 (model 1) and different variants of interaction effects for testing H2: a separate test for government (model 2.1) and institutional clarity (model 2.2) as well as for the difference between single vs. coalition party governments, which is one component of the government clarity index (model 2.3). Regarding the latter: studies that have been interested in pledge fulfilment as dependent variable have shown that pledges originating from single party governments are more likely to be fulfilled when compared with coalitions (Thomson et al. Reference Thomson, Royed, Naurin, Artés, Costello, Ennser‐Jedenastik, Ferguson, Kostadinova, Moury, Pétry and Praprotnik2017). However, retrospective pledge voting does not appear to be affected by this difference. The remaining checks in table 4 also do not differ substantially from the results that have already been presented in Table 1. For both, institutional and government clarity, negative and not statistically significant interactions are still reported. In sum, all additional robustness checks do not contradict the main findings of the analysis above.Footnote 13
The results of the analysis lend considerable support for the hypothesis that pledge fulfilment affects electoral outcomes: a government party appears to be less likely to lose votes when it has shown a better performance at pledge fulfilment. Different measures of electoral success – changes in vote share, vote ratio and absolute vote share – have been considered in the analysis and the results have been shown to be robust. However, there is no evidence that retrospective voting with respect to pledge performance is more likely to occur when clarity of responsibility at the institutional and government level is high.
Conclusion
Does pledge performance bear any electoral consequences for government parties? I find that electoral outcomes of government parties depend on their performance of pledge fulfilment. This study has looked at the relation between pledge performance and voting at the macro level, which can be considered as a hard test. As I have argued, there are several intermediate steps between pledge fulfilment and voting which might present challenges when looking at the direct link between pledge and electoral performance of a government party. However, despite these challenges, this study finds evidence that voters do respond to government party pledge fulfilment. Government parties are not rewarded for pledge fulfilment, but it appears that they are able to prevent bigger electoral losses if they show better performances in keeping their pledges. The general tendency of government parties to lose rather than win votes at subsequent elections has also been shown by previous studies (Paldam Reference Paldam1986; Whitten & Palmer Reference Whitten and Palmer1999). But obviously, electoral losses can be prevented if government parties meet their own standards and voters’ expectations. Thus, the main finding of this study is that pledge performance matters for voting.Footnote 14
I do not find conclusive evidence that institutional and government clarity of responsibility moderates the relation between pledge performance and voting. This is surprising because clarity of responsibility has been shown to be a crucial moderator of economic voting (Hobolt et al. Reference Hobolt, Tilley and Banducci2013; Powell & Whitten Reference Powell and Whitten1993). Thus, it seems that pledge performance and economic voting differ from each other in some key aspects.
My findings have important implications for research on voting, pledge fulfilment and citizens’ evaluations of pledge fulfilment. First, retrospective voting considerations do matter – beyond the economy. Citizens appear to be able to consider differences in party pledge fulfilment, and to hold government parties accountable for promises that were made in the past. Moreover, if as this study has shown there is a direct effect of pledge performance on voting, political parties should be aware of the long‐term costs that they risk when election pledges are ignored. A party that consistently disregards its own guidelines will neither be regarded as a responsible nor as a competent player to which voters are willing to delegate power. Second, the findings of this study add empirical evidence to the normative ideal of promissory representation that has guided research on pledge fulfilment (Mansbridge Reference Mansbridge2003; Thomson et al. Reference Thomson, Royed, Naurin, Artés, Costello, Ennser‐Jedenastik, Ferguson, Kostadinova, Moury, Pétry and Praprotnik2017; Naurin et al. Reference Naurin, Royed and Thomson2019). Parties should take their own pledges seriously, because voters obviously do not forget about them. Or said the other way around: if voters do indeed punish or reward political parties at elections for bad or good pledge performances respectively, then parties should have an incentive to keep their electoral pledges (Aragonès et al. Reference Aragonès, Postlewaite and Palfrey2007), and be careful when they make pledges. Knowing that voters do not forget about past elections puts pressure on parties to be truthful and not to try to bait voters with unrealistic promises. Third, this study has incorporated the perception of pledge fulfilment as a crucial step between pledge performance and voting in its theoretical assumptions. Even if there is a general negativity bias with respect to how people perceive pledge fulfilment (Naurin Reference Naurin2011; Thomson Reference Thomson2011), actual differences in pledge performance still appear to result in different electoral outcomes – at least at the aggregate level. Thus, it appears that voters do not only expect (Rose & Wessels Reference Rose and Wessels2018), but also react to party pledge fulfilment.
This study serves as a crucial step towards understanding the linkage between pledge performance and voting, though the results do raise interesting questions for future studies to answer. One puzzling finding is that high levels of clarity of responsibility do not positively impact pledge performance based voting. In addition, future research should look into the relation between pledge performance and voting not only at the aggregate level, but especially at the level of individual voters. This would allow a closer look at the causal mechanisms that are assumed to link pledge performance and voting to be taken. One interesting question to address in future research is, for example, whether different kinds of voters react differently to party pledge fulfilment.
Acknowledgements
I thank Heike Klüver, Heiko Giebler, Alejandro Ecker, Denise Traber and the three anonymous EJPR reviewers for their excellent comments and suggestions.
Online Appendix
Additional supporting information may be found in the Online Appendix section at the end of the article:
Table 5. The effect of pledge fulfilment on electoral performance – alternative economic control variables
Table 6. The effect of pledge fulfilment on electoral performance – PEC
Table 7. The effect of pledge fulfilment on electoral performance – w/o distance median
Supporting Information
Appendix
Table A1. Country and government selection

Source: Thomson et al. (Reference Thomson, Royed, Naurin, Artés, Costello, Ennser‐Jedenastik, Ferguson, Kostadinova, Moury, Pétry and Praprotnik2017b), except for New Zealand (McCluskey Reference McCluskey2008) and France (Bouillaud et al. Reference Bouillaud, Guinaudeau and Persico2017) that are written in italics.
Table A2. The effect of pledge fulfilment on electoral performance – w/o FRA and NZL

Notes: Results from an OLS regression with clustered robust standard errors. PP – pledge performance, EMI – Economic Misery Index. New Zealand and France are excluded.
***p < 0.001, **p < 0.01, *p < 0.05, p < 0.1.
Table A3. The effect of pledge fulfilment on electoral performance – clarity of responsibility

Notes: Results from an OLS regression with clustered robust standard errors. PP – pledge performance, EMI – Economic Misery Index. The variable “single party” is coded a dummy (1 – single party government, 0 – party in a coalition).
***p < 0.001, **p < 0.01, *p < 0.05, p < 0.1.


 Open access