


Social networks are complex systems of interpersonal relationships that have long been acknowledged to be highly influential on mental health and general well-being. Reference Santini, Koyanagi, Tyrovolas, Mason and Haro1,Reference Kawachi and Berkman2 Strong connections with friends, family and community members enhance psychological resilience, offering belonging, emotional reinforcement and practical aid. Reference Feeney and Collins3,Reference Morelli, Lee, Arnn and Zaki4 Robust social networks are consistently associated with lower rates of depression and anxiety, particularly during stressful periods. Reference Wang, Mann, Lloyd-Evans, Ma and Johnson5 The 2019 coronavirus disease (COVID-19) pandemic is a reminder of the importance of social relationships while highlighting their complex interplay with mental health. Physical distancing measures aimed at curbing viral spread drastically altered daily life, fostering isolation and uncertainty. Reference Haug, Geyrhofer, Londei, Dervic, Desvars-Larrive and Loreto6,Reference Pfefferbaum and North7 These disruptions transformed positive social interactions into potential risks for viral transmission, yet perceived social support remained a vital buffer against psychological distress. Reference Perez-Brumer, Balasa, Doshi, Brogdon, Doan and Oldenburg8
While studies have examined the mental health impacts of social networks during the pandemic, many relied on isolated time points, small samples or specific subgroups such as adolescents or healthcare workers. Reference Wright, Faul, Graner, Stewart and LaBar9–Reference Zhu, Wei, Meng and Li12 Comprehensive investigations across diverse populations and time points are needed to assess the broader implications of social networks on mental health during crises. Sweden’s unique pandemic strategy, which emphasised voluntary guidelines over mandatory lockdowns, provides a valuable context for exploring these dynamics. Reference Ludvigsson13,Reference Ludvigsson14 This study investigates the relationships between social networks and depressive and anxiety symptoms over 12 months in a large Swedish cohort, addressing gaps in previous research. We aimed to examine (a) whether social network characteristics are associated with symptoms of depression and anxiety at each time point, (b) how these associations changed over the course of the pandemic and (c) whether there are lagged, bidirectional effects between social network characteristics and mental health over time.
Method
Study population and data source
We used data from the Omtanke2020 study, a prospective cohort study established in June 2020 to investigate the mental health of Swedish adults during the COVID-19 pandemic. Reference Lovik, González-Hijón, Kähler, Valdimarsdóttir, Frans and Magnusson15,Reference Unnarsdóttir, Lovik, Fawns-Ritchie, Ask, Kõiv and Hagen16 Participants were eligible if they were ≥18 years old, Swedish speaking and in possession of a Swedish personal identity number and electronic identification. Recruitment occurred from 9 June 2020 until 8 June 2021. Participants either volunteered vi social media campaigns or were actively recruited through existing cohorts at Karolinska Institute – namely the Karolinska Mammography Project for Risk Prediction of Breast Cancer, the Swedish Twin Registry and LifeGene. Reference Lovik, González-Hijón, Kähler, Valdimarsdóttir, Frans and Magnusson15 Comprehensive online surveys were administered at baseline, every month after recruitment during the first year and annually during the 3 years following recruitment. At baseline, a total of 29 521 adults provided informed consent, with the final baseline cohort consisting of 28 302 participants who answered at least 1 question. Participants were included in the present study if they participated in the baseline and 6- and 12-month follow-up questionnaires, and had non-missing data for the social network questions and measures of depressive and anxiety symptoms.
Social network
The social network domain comprised both objective and subjective measurements. Objective measurements included: relationship status (married; cohabitating or other firm relationship; single or divorced; widowed), parenthood (yes/no), presence of child(ren) at home (yes/no); and four frequency-of-contact items asking how often participants in the past 2 weeks had spoken on the phone, contacted others via social media, met others in person and left their home. Subjective measurements were seven items asking agreement with statements about emotional support from family, having a specific person to turn to, feeling safe at home, increased family closeness, increased warmth or love from others, perceived increase in societal cohesion and perceived helpfulness to others. Response formats are shown in Supplementary Table 1 available at https://doi.org/10.1192/bjo.2025.10915: contact frequency items had six ordered response categories (several times per day → more than once per week); and perceived items used a five-point Likert scale (do not agree at all → completely agree). All social network items used in structural equation modelling (SEM) analyses were standardised to z-scores using cluster resampling by calendar month, to reduce bias from seasonal and calendar-period differences in response distributions over the recruitment period.
Mental health
Depressive symptoms
Depressive symptoms were measured with the Patient Health Questionnaire (PHQ-9), a validated self-report questionnaire used to assess the presence of depressive symptoms. Reference Kroenke, Spitzer and Williams17 This questionnaire includes nine items corresponding to each of the DSM-IV criteria for depressive symptoms. Response options relate to how frequently participants had experienced each item during the past 2 weeks, measured using a 4-point Likert scale from 0 (‘not at all’) to 3 (‘nearly every day’). Total scores range from 0 to 27, with a score of 10 or above indicating the presence of moderate to severe depressive symptoms. This measurement tool has consistently shown high sensitivity and specificity for major depression, and is thus a good indicator for clinical diagnosis. Reference Kroenke, Spitzer and Williams17 The internal consistency for PHQ-9, based on the Omtanke2020 study at baseline, was α = 0.88. Reference Lovik, González-Hijón, Kähler, Valdimarsdóttir, Frans and Magnusson15
Anxiety symptoms
Anxiety symptoms were measured using the General Anxiety Disorder (GAD-7) scale, a validated self-report questionnaire used to assess the presence of generalised anxiety disorder (GAD) symptoms during the past 2 weeks, represented by 7 items that are measured using a 4-point Likert scale. Total scores range from 0 to 21, with a score of 10 or above indicating the presence of moderate to severe anxiety symptoms. Like PHQ-9, GAD-7 is a reliable measurement tool for detecting the presence of GAD. Reference Spitzer, Kroenke, Williams and Löwe18 The internal consistency of GAD-7, based on the Omtanke2020 study at baseline, was α = 0.90. Reference Lovik, González-Hijón, Kähler, Valdimarsdóttir, Frans and Magnusson15
Covariates
We selected covariates a priori based on theoretical and empirical links with both social network indicators and mental health outcomes. Covariates measured at baseline include age (continuous); gender (male or female); current smoking status (yes or no); history of any mental illness (yes or no); recruitment type (via prior cohort participation or social media); body mass index (BMI; <25, 25–30 or >30); problematic alcohol consumption during the past 2 weeks (measured using the CAGE Substance Abuse Screening Tool, where higher CAGE scores indicate alcohol abuse problems and a score of ≥2 is considered clinically significant Reference Ewing19 (0, 1 or ≥2)); frequency of physical activity during the past 7 days (every day, 4–6 days, 1-3 days or none); and number of chronic diseases (0, 1, 2 or ≥3). We also included several time-varying covariates using data collected at baseline and at 6- and 12-month follow-ups, namely employment status (full-time work, part-time work, not working, retired or student); change in employment (no change, not relevant (i.e. student, retired), lost job or other negative change, positive change, other); economic difficulties (a 5-point scale ranging from ‘very easy to ‘very difficult’ to make ends meet financially in the past 6 months); COVID-19-related worries (a 5-point scale ranging from ‘very worried’ to ‘not at all worried’ about becoming infected with the COVID-19 virus); previous positive COVID-19 polymerase chain reaction test (yes or no); and survey completion date for baseline and 6- and 12-month follow-up. For subgroup analysis only, age was categorised into three groups: 18–39 years, 40–59 years and ≥60 years.
Statistical analysis
Missing data for the PHQ-9 and GAD-7 scales were handled using imputation methods based on the joint distribution. Reference Lovik, González-Hijón, Kähler, Valdimarsdóttir, Frans and Magnusson15 For the entire study population, means (± standard deviation), medians (interquartile range) and frequencies (percentages) were calculated, where appropriate. Descriptive statistics are presented for males and females separately. Missing covariate data were included in all analyses, with missing answers treated as a separate category. Statistical analyses were performed using Stata/BE 18.0 for Windows (StataCorp LLC, College Station, Texas, USA; https://www.stata.com) and the lavaan package in R version 4.3.1 for Windows (The R Foundation, Vienna, Austria; https://cran.r-project.org).
SEM
Structural equation modelling was employed to examine the correlations of social networks with depressive and anxiety symptoms at each time point. Because social network might have a delayed influence on mental health outcomes, we employed cross-lagged panel modelling (CLPM) to explore the potentially lagged effects of social network on depressive and anxiety symptoms across the three waves. CLPM is a conventional SEM approach that estimates both autoregressive effects and cross-lagged paths, thereby allowing assessment of influences between variables over time. The hypothesised cross-sectional and cross-lagged models are presented in Supplementary Figs 1 and 2, respectively.
Cross-sectional and cross-lagged models were first analysed without covariate adjustment. In the multivariable analysis, a two-step approach was used. First, all social network and mental health variables were individually regressed on the aforementioned covariates. The residuals obtained from these regression models were used to generate new analysis variables, which were subsequently incorporated into the models to adjust for covariates. For baseline data, three models were used: (a) adjusted for age and gender; (b) additionally adjusted for history of mental illness, chronic diseases, BMI, smoking status, CAGE score, physical activity and recruitment type; and (c) additionally adjusted for previous COVID-19 infection, COVID-19-related worries, economic difficulties, employment status and response period. For 6- and 12-month follow-ups, we adjusted for previous COVID-19 infection, COVID-19-related worries, economic difficulties, employment status, changes in employment and response period. Variables from adjusted models were then fit cross-sectionally and cross-lagged to ascertain the relationships between social network components and anxiety symptoms and depressive symptoms at the three time points.
Model parameters and standard errors were estimated using maximum likelihood. Model fit was assessed using the χ 2 goodness of fit statistic, the comparative fit index (CFI), the Tucker–Lewis index (TLI), the standardised root mean squared residual (SRMR) and the root mean square error of approximation (RMSEA). A good fit indicates that the model accurately represents the relationships among the variables. A good model fit was defined as CFI ≥ 0.95, TLI ≥ 0.95, SRMR ≤ 0.05 and RMSEA ≤ 0.05. Reference Hu and Bentler20 The Akaike information criterion (AIC) was also used to compare different models, with a lower AIC value indicating a better model fit.
The analytic procedure started with the hypothesised models containing all social network variables (Supplementary Figs 1 and 2). However, initial model fit did not meet the established criteria for good fit. To improve model fit while maintaining theoretical integrity, the trimming procedure outlined by Meyers et al Reference Meyers, Gamst and Guarino21 was applied. This involved systematic removal of non-significant paths or variables from the model to improve its fit and parsimony, reassessing model fit at each step.
Ethical standards
The authors assert that all procedures contributing to this work comply with the ethical standards of the relevant national and institutional committees on human experimentation, and with the Helsinki Declaration of 1975 as revised in 2013. Written informed consent to participate was obtained from all participants. The Omtanke2020 study was approved on 3 June 2020 by the Swedish Ethical Review Authority (no. DNR 2020-01785).
G.L.M. affirms that the manuscript is an honest, accurate and transparent account of the study being reported; that no important aspects of the study have been omitted; and that any discrepancies from the study as planned have been explained.
Results
Sample characteristics
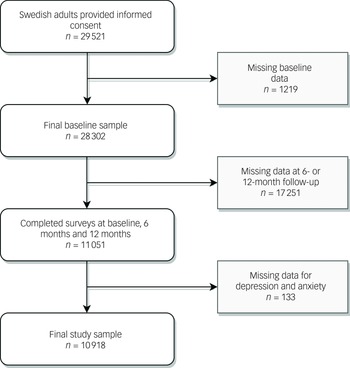
Of the 28 302 participants in the Omtanke2020 study, 11 051 responded to the 6- and 12-month follow-up surveys. Of these participants, 133 had more than 20% missing values for depressive and anxiety symptoms (i.e. above the 20% threshold for imputation). Thus, the final study sample included 10 918 participants (Fig. 1), the majority (82.0%) of whom were female. The mean age at cohort recruitment was similar among men (52.6 (±16.0 s.d.) years) and women (53.3 (±15.3 s.d.) years) (Table 1). Overall, women had healthier self-reported lifestyle factors, lower BMI (54.8% of women in the healthy weight range versus 50.4% of men), lower prevalence of smoking (10.9% of women currently smoking versus 18.1% of men) and fewer chronic diseases (31.1% of women had at least one disease versus 36.4% of men). Conversely, more women reported a history of any mental illness (31.5% of women versus 19.6% of men). Over half (55.4%) of the study sample was recruited through invitation due to participation in other ongoing cohort studies at Karolinska Institute. Characteristics of the original baseline population compared with the current study population are presented in Supplementary Table 2.
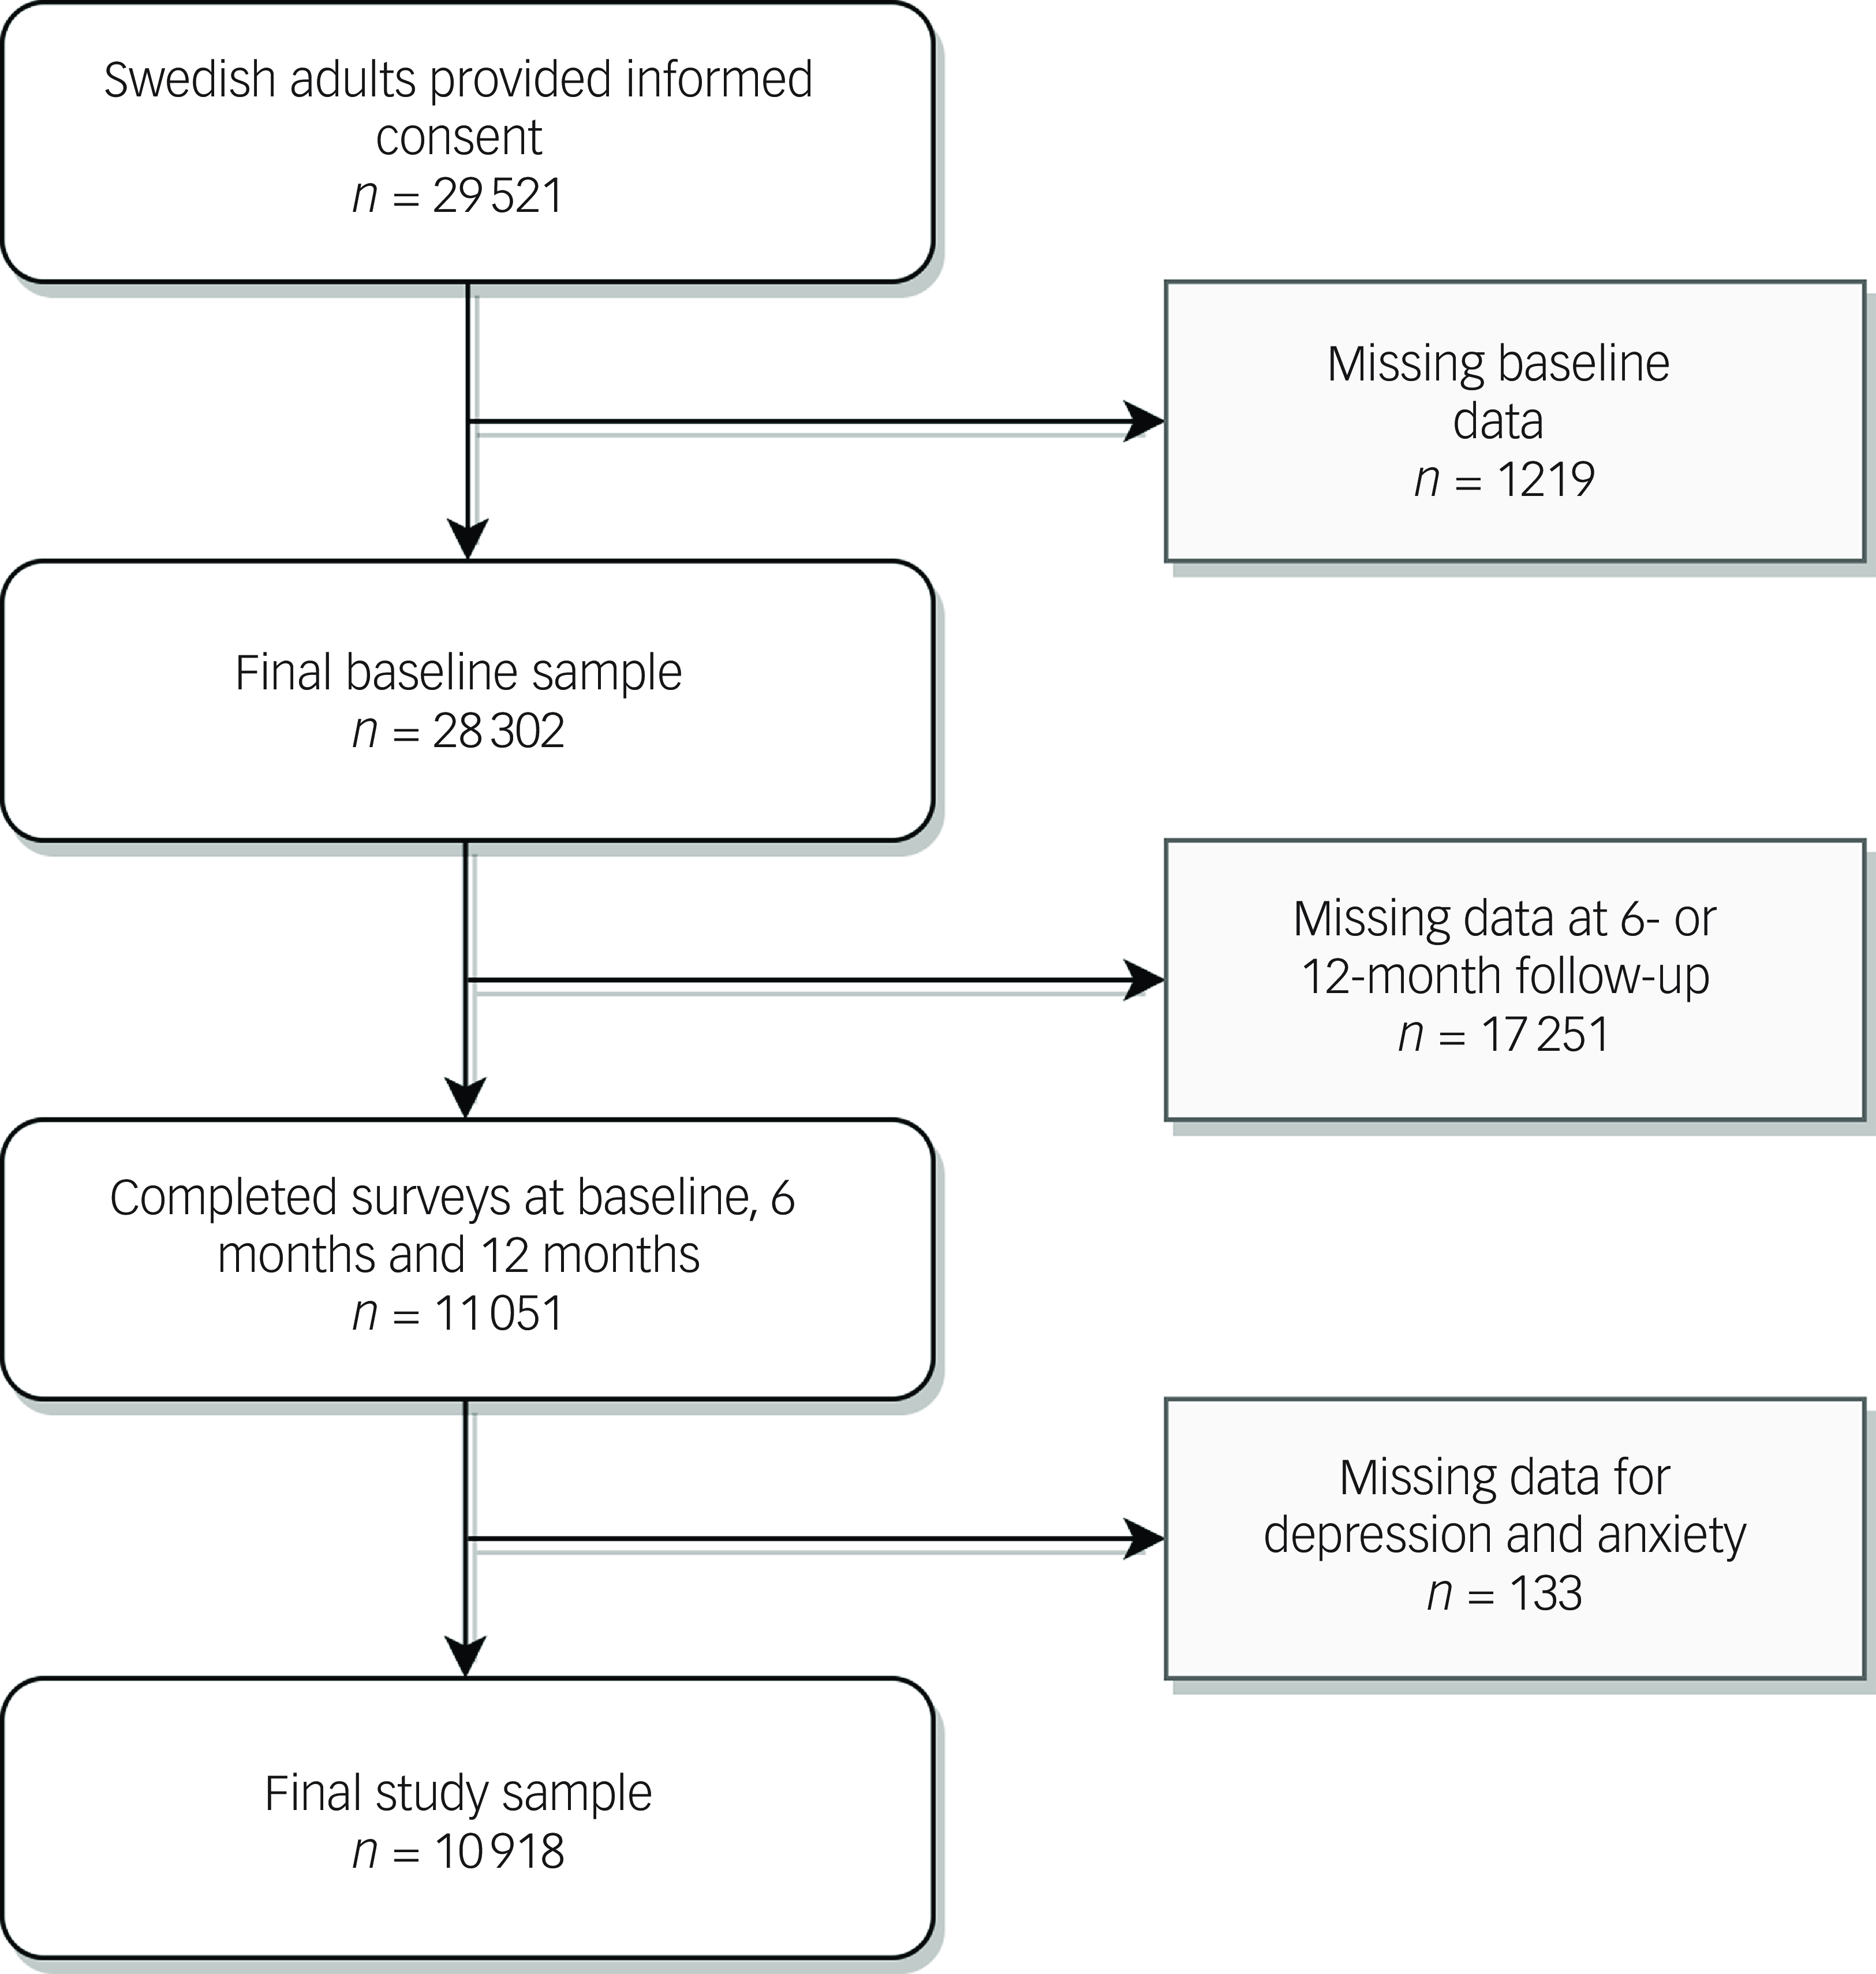
Fig. 1 Flowchart of the study sample.
Table 1 Baseline characteristics of the study sample
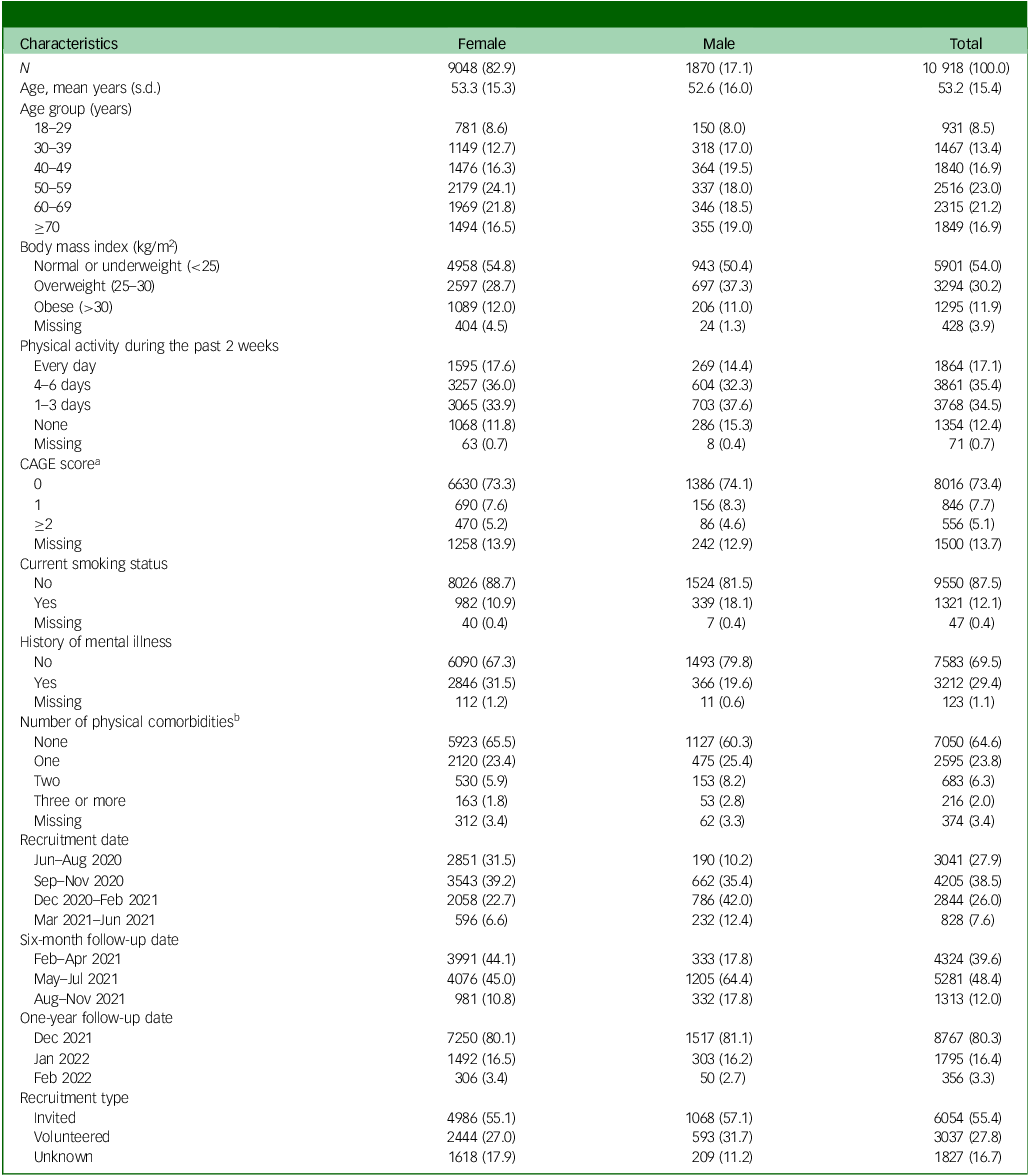
Data are presented as n (%), unless otherwise specified.
a. A higher CAGE Substance Abuse Screening Tool score indicates alcohol abuse problems; a total score of ≥2 is considered clinically significant. Reference Ewing19
b. Includes hypertension, heart disease, respiratory illness (including asthma), chronic kidney failure, cancer, diabetes and impaired immune system, for reasons other than the above.
The prevalence of depressive and anxiety symptoms, social network variables and different covariates across the three time points are summarised in Supplementary Table 3. The prevalence of moderate-to-severe depressive symptoms decreased consistently from baseline to the 12-month follow-up (15.0 to 12.7%), as did the prevalence of anxiety symptoms (9.9 to 8.9%). The proportion of marriage and parenthood remained stable over time (∼72%). While contact frequency varied across the three time points, family-related variables (emotional support, closeness and love) showed a stable pattern. Societal cohesion and helpfulness towards others varied, with an increase in negative feelings toward cohesion over time (baseline, 18.5% strongly disagreeing versus 12-month follow-up, 24.7%). Employment and economic difficulties remained stable while COVID-19-related worries fluctuated, dropping from 30.9 to 16.1% over time.
SEMs
Cross-sectional models
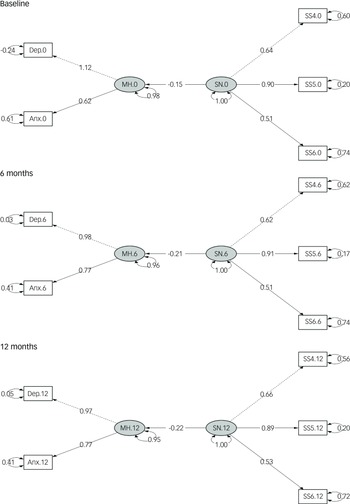
Across all time points and models, the three social network indicators consistently demonstrating the best model fit statistics were closeness to family, perceived warmth or love from others and increased societal cohesion; these indicators were therefore used in all final cross-sectional models (see Fig. 2; path diagrams for the unadjusted models are given in Supplementary Fig. 3). The baseline cross-sectional model showed a significant inverse association between social network and mental health (β = −0.19, P < 0.001), with similar magnitudes at 6 months (β = −0.23, P < 0.001) and 12 months (β = −0.22, P < 0.001). Fit statistics for the three cross-sectional models were good (Table 2; χ 2 significant, while CFI, TLI and RMSEA met conventional thresholds). Coefficients remained stable following stepwise adjustment for covariates (fully adjusted cross-sectional coefficients: model 1, β = −0.15; model 2, β = −0.14; model 3. β = −0.15, all P < 0.001), supporting the robustness of the contemporaneous associations.
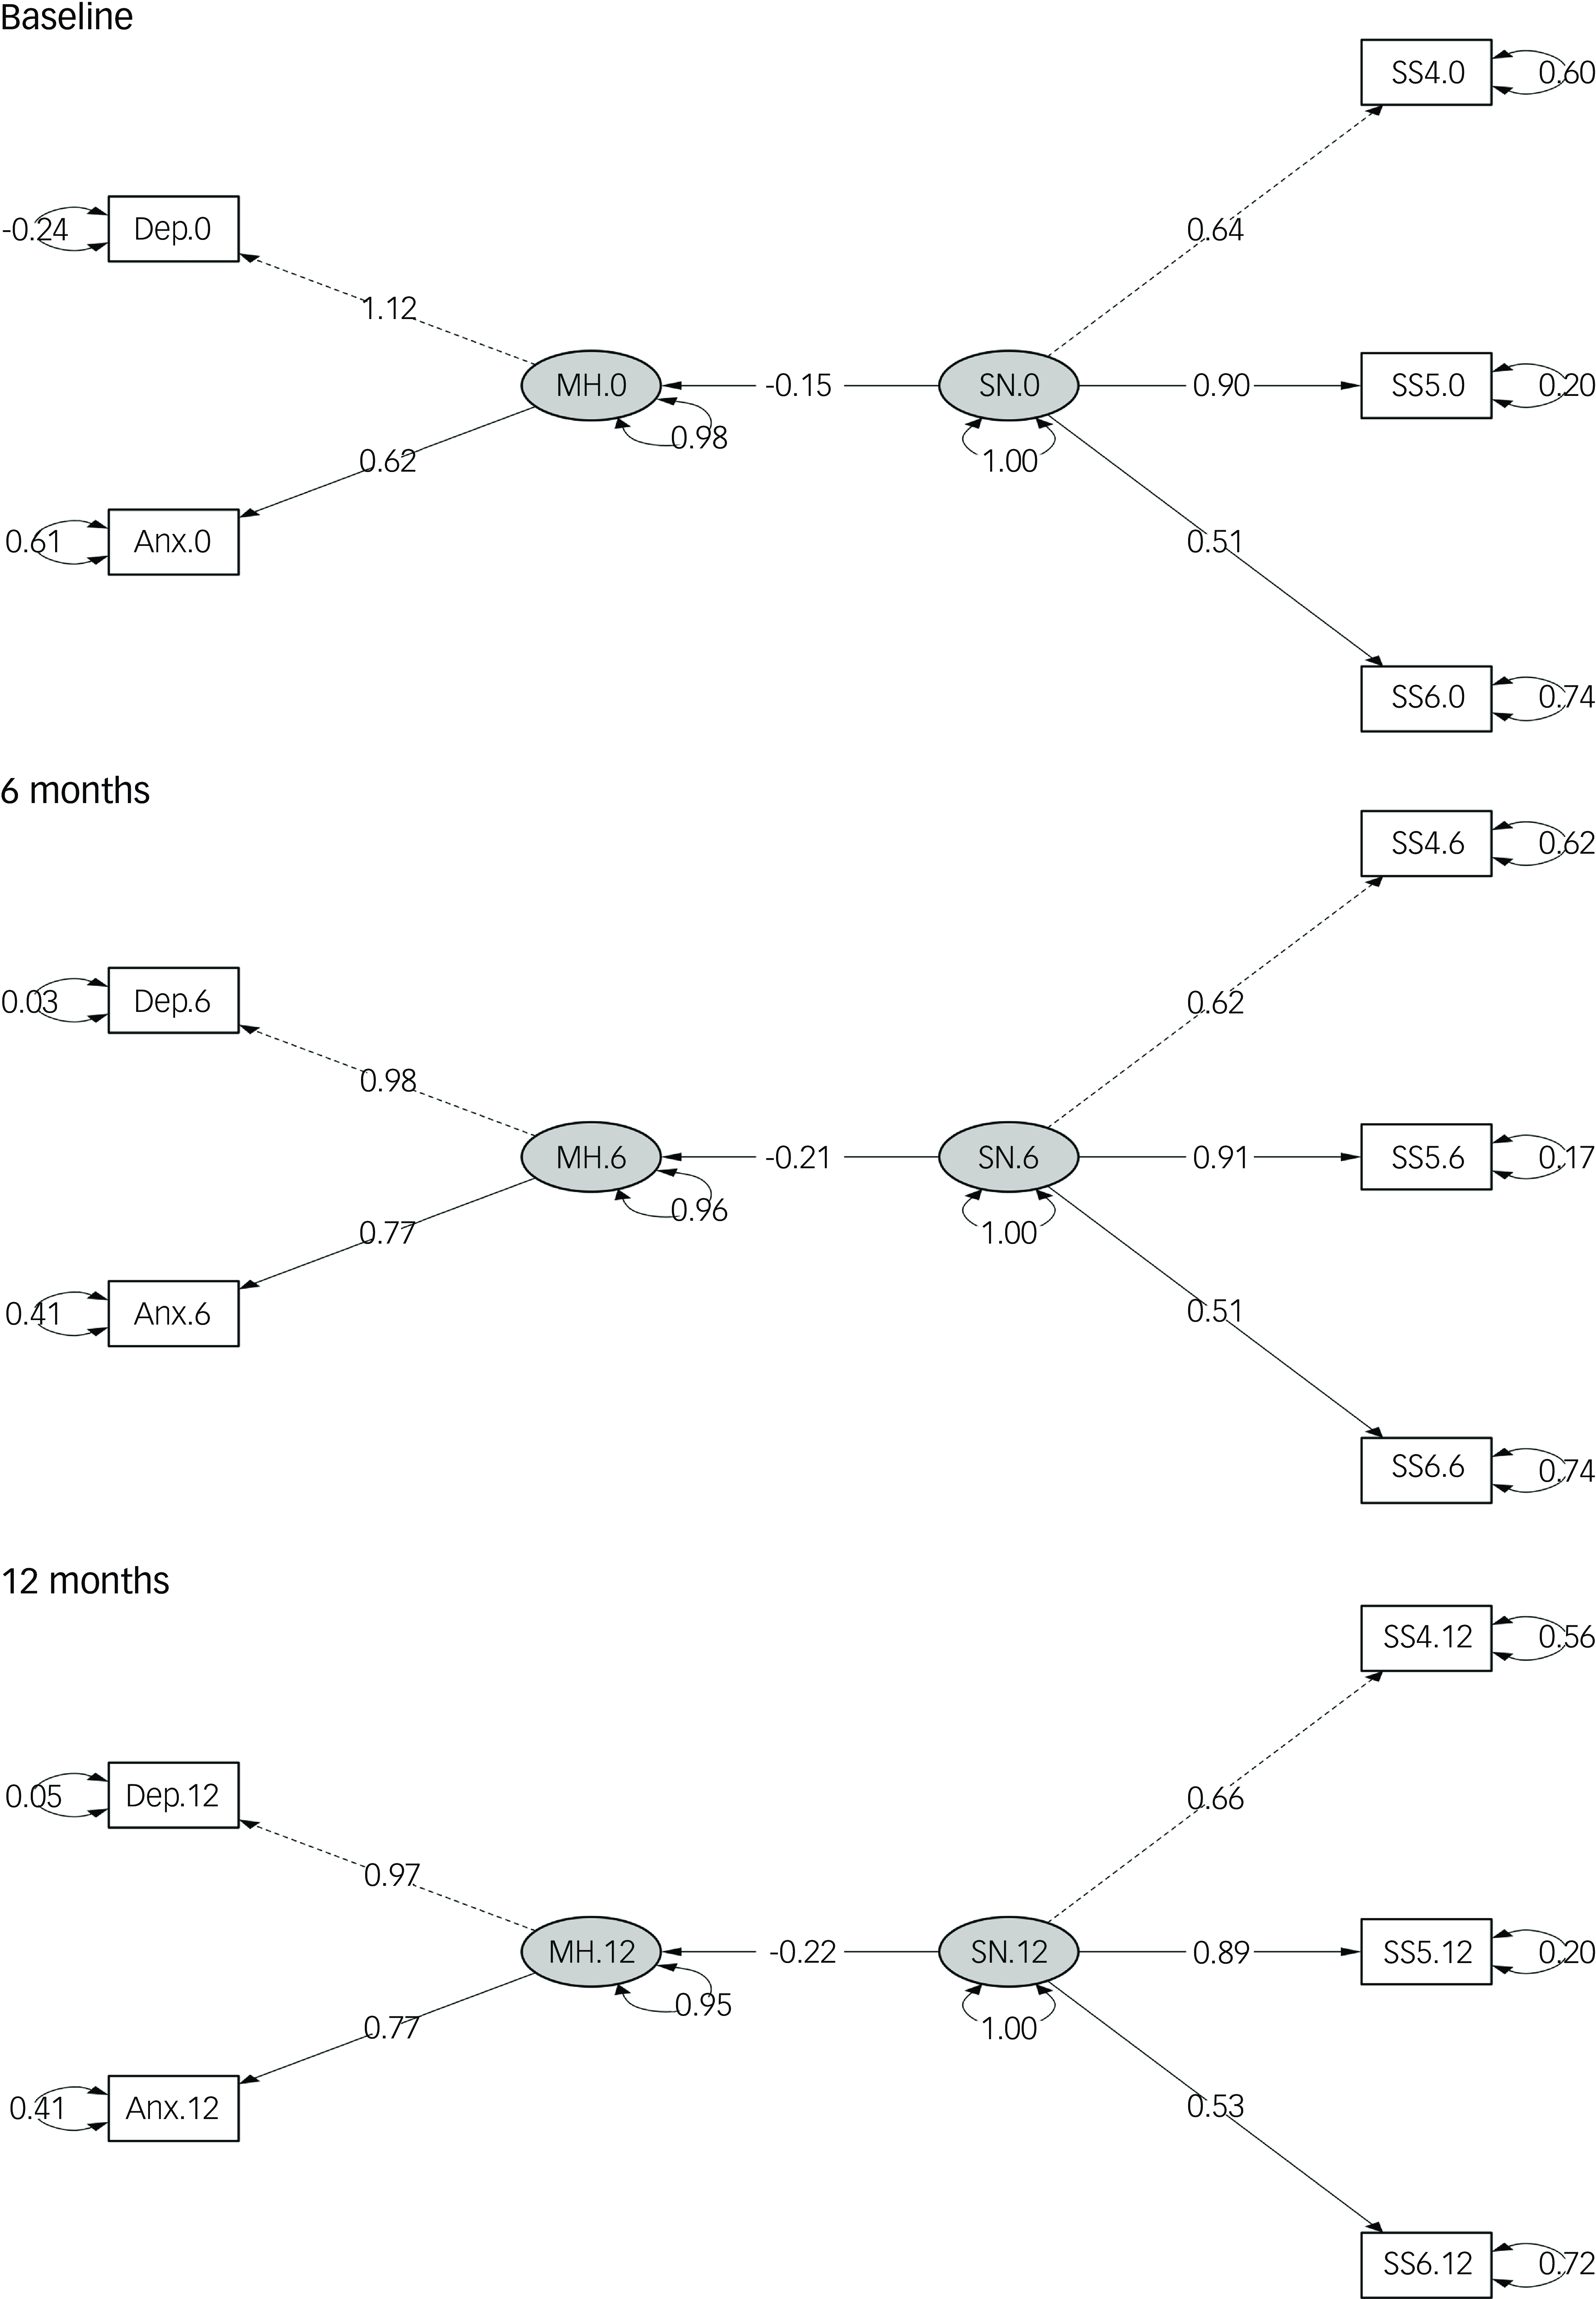
Fig. 2 Path diagrams of adjusted cross-sectional models at baseline and 6- and 12-month follow-ups. Anx, anxiety symptoms; Dep, depressive symptoms; MH, mental health; SN, social network; SS4, family closeness; SS5, perceived warmth or love from others; SS6, increased societal cohesion. Dashed lines indicate paths from latent variables to the first observed endogenous variables, which are set to a normalisation constraint of 1.00; solid lines indicate other regression paths between latent variables SN and MH, as well as those between latent and observed variables. Two-headed curved arrows indicate the standardised variance for each observed variable. All paths presented in the diagram are statistically significant. The fully adjusted baseline model was used, adjusting for age, gender, previous psychiatric diagnosis, physical comorbidities, body mass index, smoking status, CAGE Substance Abuse Screening Tool score, physical activity, recruitment type, previous COVID-19 infection, COVID-19-related worries, economic difficulties, employment status and response period. Models for the 6- and 12-month follow-ups were adjusted for previous COVID-19 infection, COVID-19-related worries, economic difficulties, employment status and response period.
Table 2 Model fit statistics for all structural equation models after trimming procedure applied
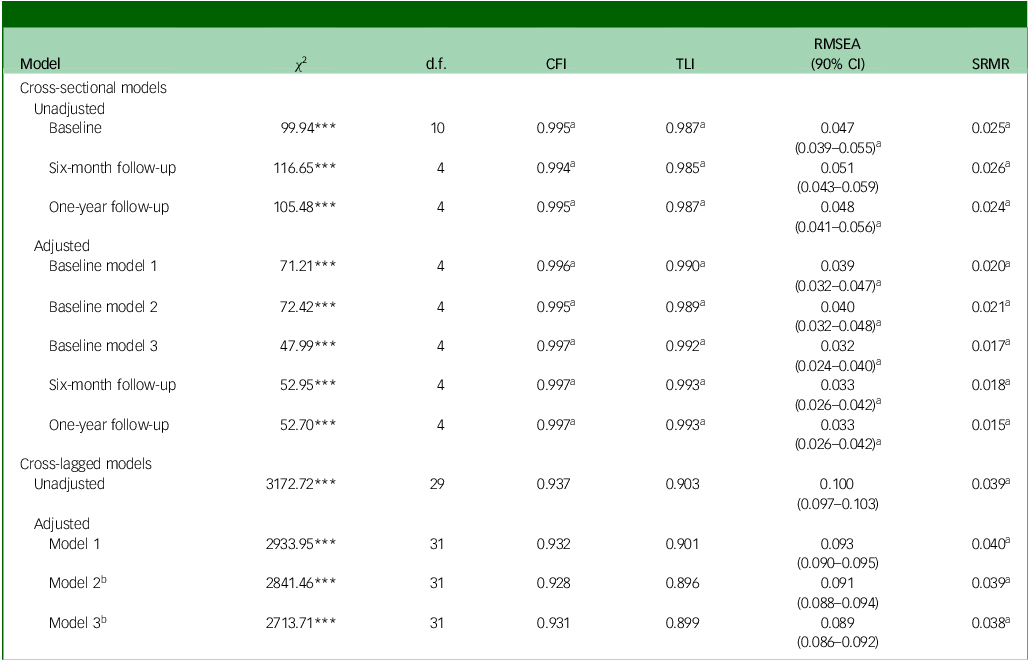
CFI, comparative fit index; TLI, Tucker–Lewis index; RMSEA, root mean square error of approximation; SRMR, standardised root mean squared residual.
Model 1: adjusted for age and gender.
Model 2: adjusted additionally for history of mental illness, physical comorbidities, body mass index, smoking status, CAGE Substance Abuse Screening Tool score, physical activity and recruitment type.
Model 3: adjusted additionally for previous COVID-19 infection, COVID-19-related worries, economic difficulties, employment status and response period.
a. Meets the requirement for good model fit.
b. Also adjusted for change in employment.
***P < 0.001.
Cross-lagged models
Consistent with the cross-sectional models, the latent social network construct defined by family closeness, perceived warmth or love from others and increased societal cohesion demonstrated the best fit in the cross-lagged models. The path diagram for the adjusted cross-lagged analysis is presented in Fig. 3.
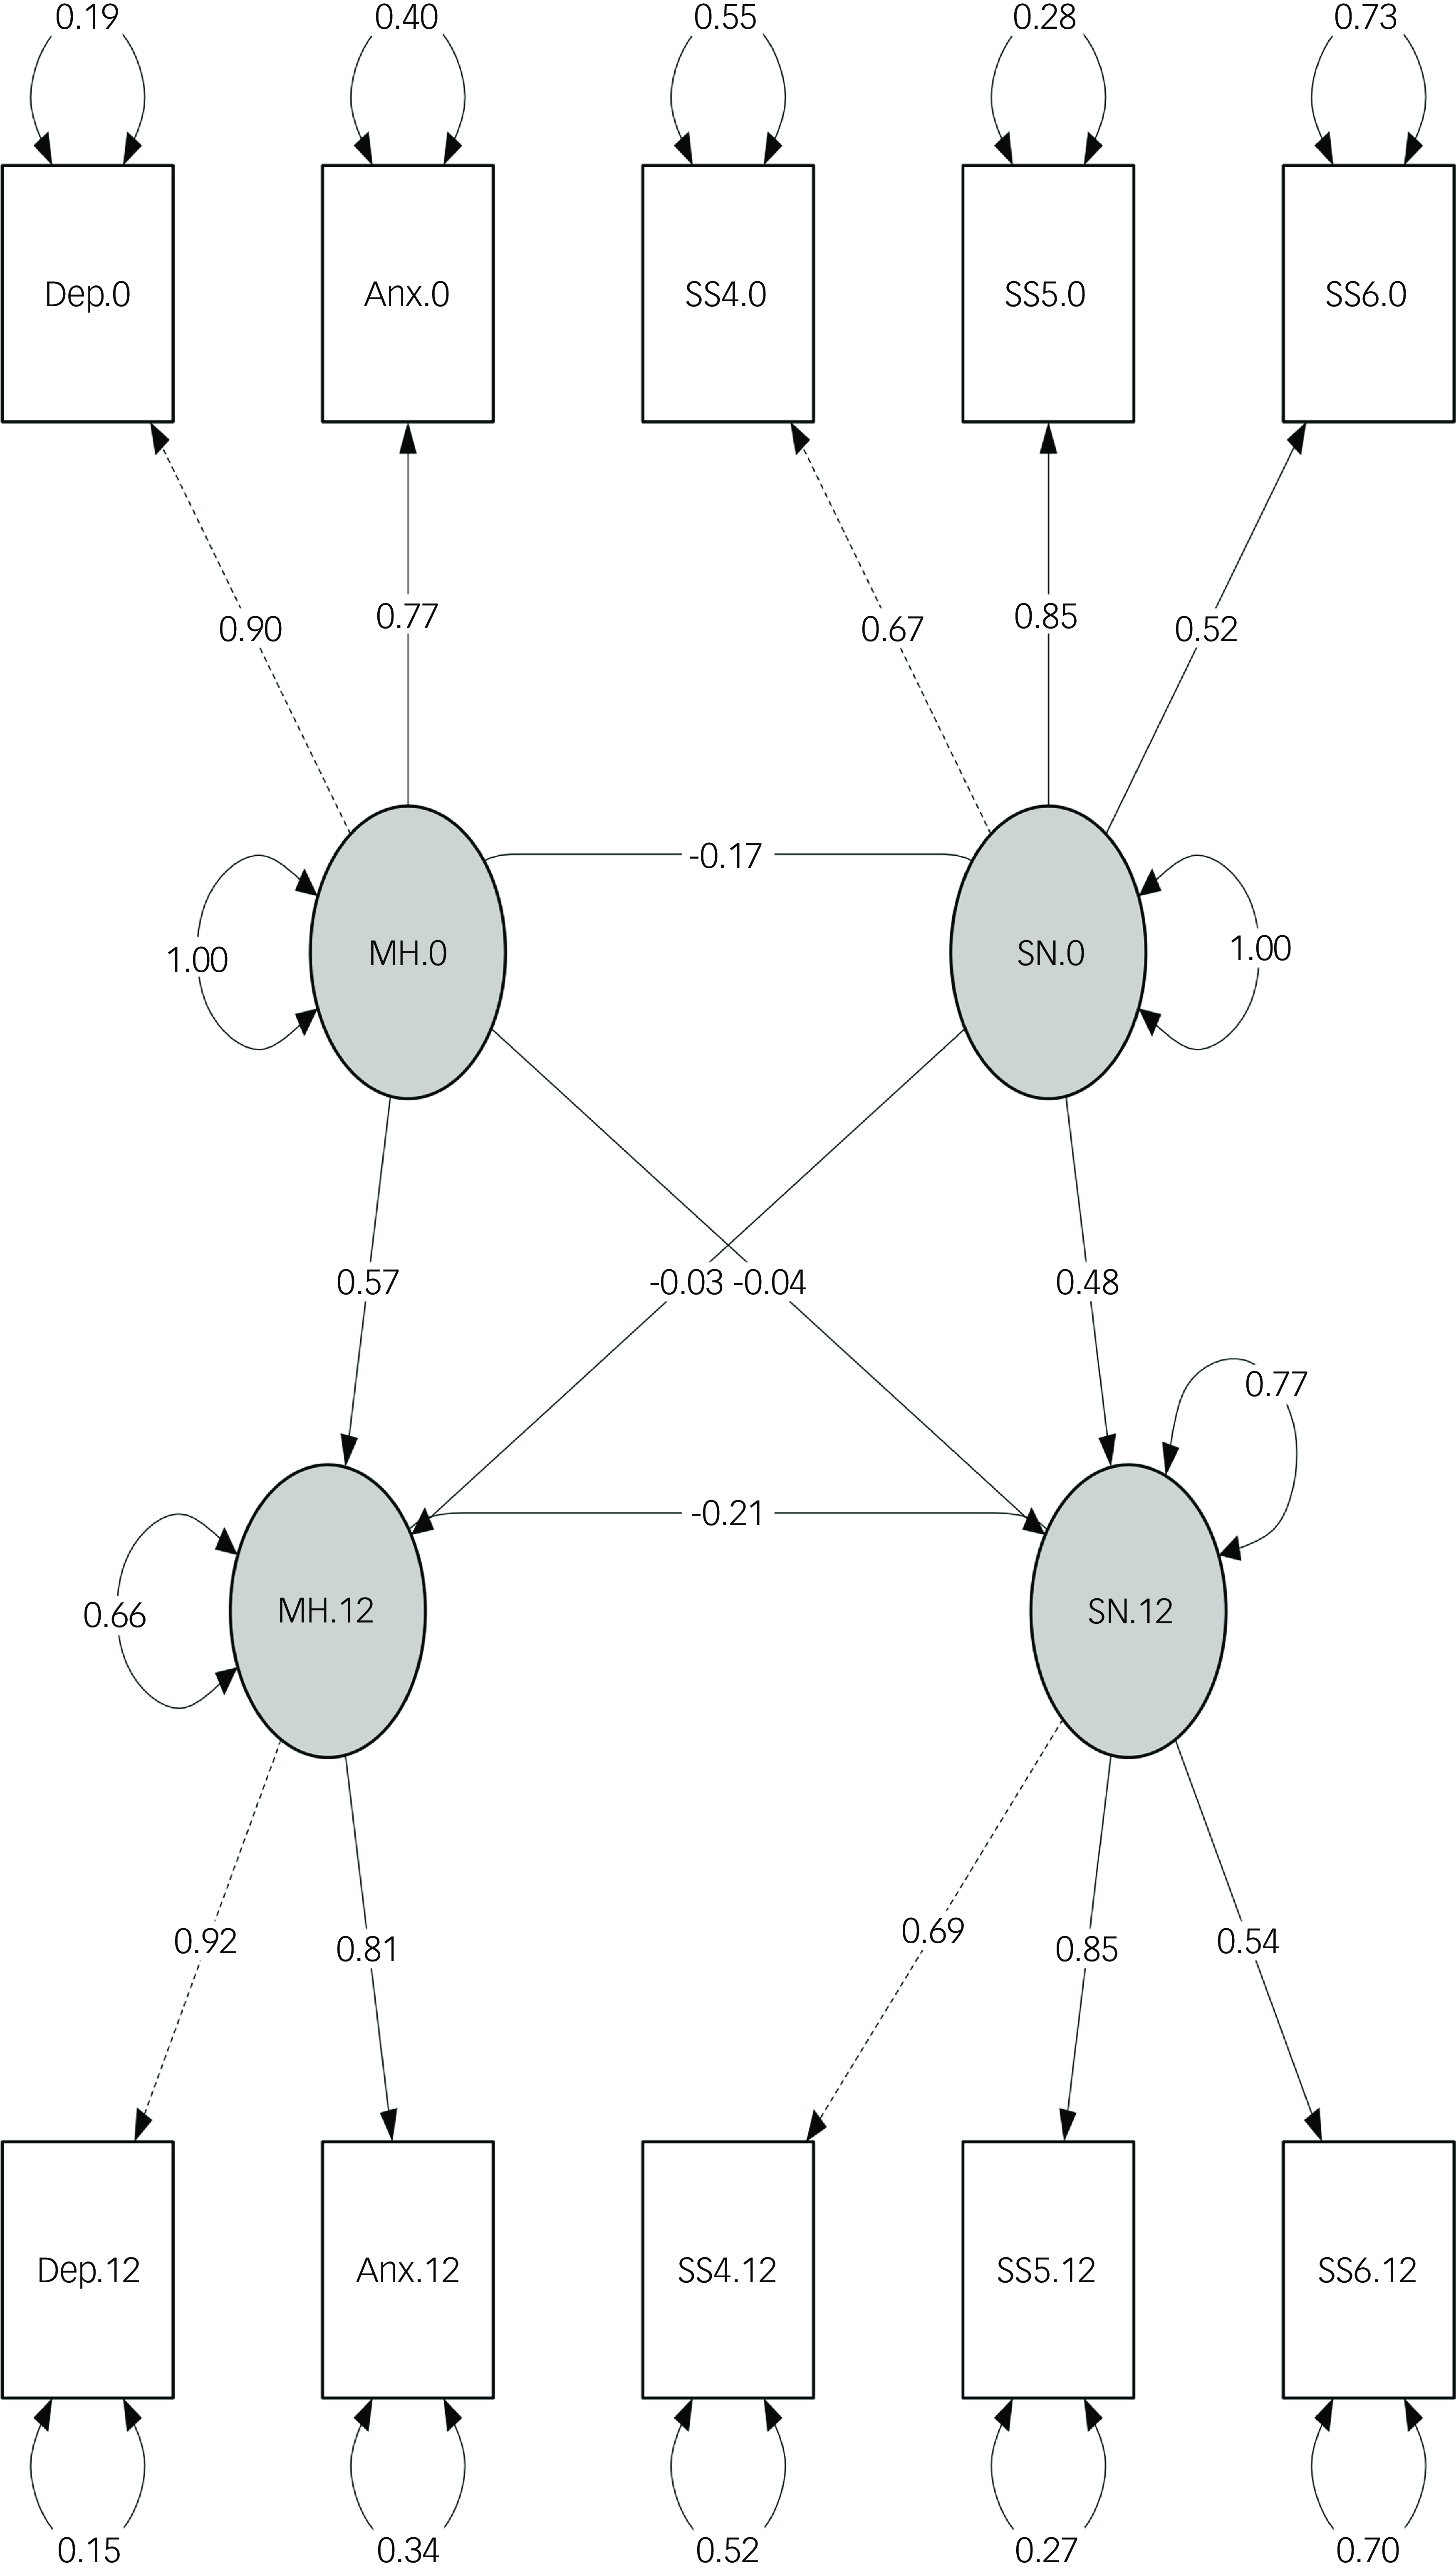
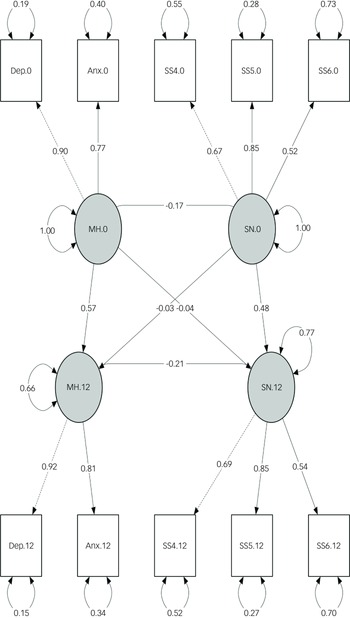
Fig. 3 Path diagram of the fully adjusted cross-lagged panel model at baseline (0) and 1-year follow-up (12). Anx, anxiety symptoms; Dep, depressive symptoms; MH, mental health; SN, social network; SS4, family closeness; SS5, perceived warmth or love from others; SS6, increased societal cohesion. Dashed lines indicate paths from latent variables to the first observed endogenous variables, which are set to a normalisation constraint of 1.00; solid lines indicate other regression paths between latent variables SN and MH, as well as those between latent and observed variables. Two-headed curved arrows indicate the standardised variance for each observed variable. All paths presented in the diagram are significant. The fully adjusted model (model 3) was implemented using the following baseline variables: age, gender, previous psychiatric diagnosis, physical comorbidities, body mass index, smoking status, CAGE Substance Abuse Screening Tool score, physical activity, recruitment type, previous COVID-19 infection, COVID-19-related worries, economic difficulties, employment status and response period. The 1-year model is adjusted for previous COVID-19 infection, COVID-19-related worries, economic difficulties, employment status and response period.
In the adjusted model, temporal stability (autoregressive effects) was moderate for both constructs: social network baseline → 1 year, β = 0.46, P < 0.001; mental health baseline → 1 year, β = 0.57, P < 0.001. Contemporaneous correlations between social network and mental health were negative at both time points, with slightly weaker baseline association in the adjusted model (β = −0.17, P < 0.001) than in the unadjusted model (β = −0.21, P < 0.001) and a slightly stronger correlation at 1 year (β = −0.21, P < 0.001, adjusted; β = −0.15, P < 0.001, unadjusted).
During model development, associations at the 6-month wave were consistently weaker; therefore, 6-month measurements were excluded to improve parsimony and model fit. Across specifications, goodness-of-fit statistics for the cross-lagged models were slightly lower than for the cross-sectional models, but overall fit was acceptable for the adjusted 0- to 12-month model (CFI 0.960, TLI 0.931, RMSEA 0.074, SRMR 0.022; see Table 2 for fit indices).
Subgroup analysis
Results from the analysis stratified by gender are displayed in Supplementary Tables 4 and 5, while results from the age-stratified analysis are shown in Supplementary Tables 6 and 7. Regardless of gender and age, the same social network variables (family closeness, perceived warmth or love from others and increased societal cohesion) consistently had the strongest correlations with contemporary depressive and anxiety symptoms and best model fit statistics. Gender did not appear to have a consistent impact on mental health or social network (Supplementary Tables 4 and 5), but there was a stronger positive correlation among men than among women between mental health at baseline and that at 1 year (Supplementary Table 5; 0.66, P < 0.001 for men versus 0.56, P < 0.001 for women). In the age-stratified analysis, participants aged 60 years or older displayed the most significant change in the correlation between social network and mental health over time (Supplementary Table 6; −0.10, P < 0.001 at baseline versus −0.20, P < 0.001 at 1-year follow-up). All other estimates were relatively stable across age groups. Similarly, the cross-lagged models exhibited worse fit statistics than the cross-sectional ones (Table 2).
Discussion
To the best of our knowledge, this is the first study to use SEM, including CLPM, to analyse social network and mental health during the COVID-19 pandemic in a large cohort. The cross-sectional and cross-lagged models confirmed the study hypotheses, namely that stronger perceived social support is inversely associated with poor mental health outcomes, with minor gender differences detected. While the prevalence of depressive and anxiety symptoms decreased over the study period, social network variables remained stable predictors of depressive and anxiety symptoms. Furthermore, although the relationship between social network and mental symptoms was stronger at baseline than at the 1-year follow-up, the continued statistical significance of this relationship underscores the enduring influence of perceived social support on mental well-being. Results did not vary greatly by gender or age.
Results in context
At baseline, the prevalence of moderate-to-severe symptoms was 15.0% for depression (PHQ-9 ≥10) and 9.9% for anxiety (GAD-7 ≥10) (Supplementary Table 3). These rates are broadly consistent with pandemic-era population estimates for Sweden, and exceed many pre-pandemic estimates. For instance, an analysis of data from the European Health Interview Survey (EHIS-3) reported an overall prevalence of clinically relevant depressive symptoms of 6.54% pre-pandemic (2018–2020), with Sweden at approximately 10.72%. Reference Arias-de la Torre, Vilagut, Ronaldson, Bakolis, Dregan and Martín22 Compared with the full Omtanke2020 cohort, the current analytic sample was older, reported fewer depressive and anxiety symptoms and generally had more favourable socioeconomic and health characteristics (Supplementary Table 2).
Our statistical models started with the inclusion of all 14 social network variables collected in the study, and these variables were systematically removed from the models based on their impact on model fit. Reference Meyers, Gamst and Guarino21 The variables that consistently fit the models and had the strongest correlation with depressive and anxiety symptoms were closeness to family, perceived warmth or love from others and increased societal cohesion. These results align with previous studies showing that emotional, perceived aspects of social network are stronger predictors of mental and physical well-being as opposed to the more quantifiable aspects (e.g. number of interpersonal relationships). Reference Murphy, Beridze, Vetrano and Calderón-Larrañaga23,Reference Sun, Harris and Vazire24 Notably, these three social network variables represent different levels of social relationships. Family closeness and perceived warmth or love from others refer to relationships with another individual, while the perception of societal cohesion goes beyond individual relationships and explores the broader fabric of a community or society. Kim et al and Smith et al have reported strong associations between neighbourhood social cohesion and lower rates of negative mental health symptoms. Reference Kim, Chen, Kawachi and VanderWeele25,Reference Smith, Baik, Lehning, Mattocks, Cheon and Kim26
The social network variables that consistently failed to fit the models and had the weakest correlations with mental health outcomes were the presence of other family members in the household and the frequency of contacts with social network members. Household size has often been shown to be strongly associated with mental health, Reference Cheng, Zhang, Wang, Zhang, Ye and Liang27,Reference Sempungu, Choi, Lee and Lee28 at odds with the results of this study. Objectively measured family structures may not capture the nuanced emotional support and interpersonal dynamics that are crucial for mental well-being. Reference Umberson and Montez29 It is possible, therefore, that the quality of relationships within the household, rather than the objective number of people, plays a more significant role in influencing mental health in the context of a stressful situation such as the COVID-19 pandemic. Although rare, several other studies have also used SEM to explore the relationships between different measures and mental health during the COVID-19 pandemic. Specifically, a small cross-sectional study conducted in Singapore Reference Lim, Yap, Mahendran and Yu11 revealed that compassion was associated with a greater level of pandemic-related protective health behaviours (i.e. hand hygiene and physical distancing), which in turn was negatively associated with anxiety symptoms.
One of the notable characteristics of the COVID-19 pandemic lies in the differential global responses to the pandemic’s challenges. Some governments implemented strict lockdown laws that effectively curbed viral spread in some cases but amplified feelings of social isolation. Reference Haug, Geyrhofer, Londei, Dervic, Desvars-Larrive and Loreto6 Sweden, on the other hand, aimed to balance virus containment with preserving social connectedness, by avoiding stay-at-home orders in favour of voluntary guidelines to stay home and avoid public places in the first wave of the pandemic. Reference Ludvigsson14 This approach was in direct contrast with other European countries early in the pandemic. For example, Denmark ordered a 2-week stay-at-home order in March 2020 Reference Böhm, Lilleholt, Meineche, Strandsbjerg, Windfeld and Windfeld30 while Norway mandated quarantine periods for travellers returning from abroad. 31 Ebrahimi et al reported that population-level depressive symptoms in Norway were strongly associated with the presence of strict physical distancing policies, and symptoms decreased with the termination of these policies. Reference Ebrahimi, Bauer, Hoffart and Johnson32 Thus, Sweden’s pandemic experience has provided a valuable case study for assessing the implications of relatively lenient restrictions on social networks and mental health outcomes.
Strengths and limitations
This study has several strengths. It leverages a large sample and a longitudinal design with three measurement waves, and uses validated instruments to assess depressive and anxiety symptoms. Analytically, we adjusted for a comprehensive set of potential confounders including time-varying covariates and used SEM, which helps account for measurement error and enables estimation of complex direct and indirect relationships and the proportion of variance explained by predictors. Reference Gefen, Straub and Boudreau33–Reference Jeon35 Nevertheless, the findings should be interpreted while also considering several limitations. Selection bias is a potential issue, because the overall Omtanke2020 cohort and the analytic sample used in this study consist of a disproportionately higher proportion of older women, which limits the representativeness of our findings to the general Swedish population. Reference Statistics Sweden36 Methodologically, the multiplicity inherent in complex structural equation models could inflate certain associations, and residual confounding (for example, by income or education) cannot be ruled out. Finally, we note as a limitation that the social network items were not derived from a single established validated instrument. Although the items map onto commonly used structural and perceived support domains and show expected factor loadings in SEM, future work using validated multi-item scales or formal psychometric validation would improve measurement validity and thereby strengthen the credibility of the observed associations.
Public health implications
The COVID-19 pandemic has underscored how reduced social contact can significantly impact mental health, particularly for individuals who are socially isolated yet not engaged with healthcare systems. While our findings confirm the protective role of perceived social support, they also highlight a challenge, namely how to identify and support at-risk individuals who may not meet clinical thresholds or seek treatment.
Future public health strategies should incorporate brief social support screening tools into non-clinical settings – such as primary care, schools, workplaces and digital platforms – to proactively identify those at risk. Interventions such as teletherapy, peer support groups and community-based mutual aid programmes could subsequently be mobilised to provide connection during times of crisis. Reference Hubley, Lynch, Schneck, Thomas and Shore37–Reference El Zerbi, Hartopp, Ramsay and Marlow41 Sustained investment in community cohesion is especially important for prevention of mental health deterioration during future pandemics or similar disruptions. Reference Svensson and Elntib42
While findings in this area may seem difficult to act upon clinically, they hold clear relevance for population-level prevention. Social support remains a modifiable factor, and addressing it requires early, community-centred and cross-sector approaches.
In conclusion, this large cohort study presents a distinctive approach by examining the relationships between social network and depressive and anxiety symptoms across various time points during the COVID-19 pandemic in Sweden. The utilisation of SEM to explore these associations empirically corroborates the protective role of perceived social support in mental health outcomes, and emphasises the importance of fostering strong social networks, especially in times of crisis.
Supplementary material
The supplementary material is available online at https://doi.org/10.1192/bjo.2025.10915
Data availability
The raw data-sets are unavailable for sharing due to Swedish data protection laws. Statistical code will be available on request to the corresponding author.
Author contributions
G.L.M. conceptualised the study, conducted formal analysis and wrote the original draft of the manuscript. E.E.J. was responsible for curation of the Omtanke2020 study data and reviewed the manuscript. A.L. was involved in study conceptualisation and data curation. E.U.G. and K.V. reviewed the manuscript. A.K.K., E.M.F., U.A.V., P.F.S. and F.F. reviewed the manuscript and were involved in conceptualisation of the Omtanke2020 study and data collection. M.B. supervised the study and was involved in study conceptualisation and interpretation of results. F.F. supervised the study and contributed to resources and funding acquisition. M.B. and F.F. contributed equally as co-last authors. All authors contributed to the article and approved the submitted version.
Funding
This study was funded with grants from NordForsk (no. CovidMent, 105668), Horizon 2020 (no. CoMorMent, 847776) and the Karolinska Institute.
Declaration of interest
None.


 Open access
eLetters
No eLetters have been published for this article.