

Introduction
Recently, many countries have experienced a “rainbow wave” — or a sharp increase in the number of LGBTQ+ candidates running for office.Footnote 1 In some countries, such as Canada, these candidates have not been very successful in being elected despite running in greater numbers. Scholars have begun to explore many potential barriers for LGBTQ+ candidates, including public scrutiny (Wagner Reference Wagner2021), voter bias (Everitt and Horvath Reference Everitt and Horvath2021; Golebiowska Reference Golebiowska2003; Haider-Markel et al. Reference Haider-Markel, Miller, Flores, Lewis, Tadlock and Taylor2017; Herrick and Thomas Reference Herrick, Thomas, Ellen and Tadlock1999, Reference Herrick and Thomas2001; Jones et al. Reference Jones, Brewer, Young, Lambe and Hoffman2018; Jones and Brewer Reference Jones and Brewer2019; Loepp and Redman Reference Loepp and Redman2022; Magni and Reynolds Reference Magni and Reynolds2021), party gatekeeping (Ashe Reference Ashe, Tremblay and Everitt2020), and district competitiveness (Everitt and Tremblay Reference Everitt and Tremblay2023; Grahn Reference Grahn2024; Lapointe, Ferland, and Turgeon Reference Lapointe, Ferland and Turgeon2024). In this paper, we take inspiration from work on women in politics to consider another potential barrier: political finance. After all, research shows that money is important to winning elections (Burrell Reference Burrell2003; Carty and Eagles Reference Carty and Eagles2005; Eagles Reference Eagles2004). If LGBTQ+ candidates are poorly financed, it could explain why in some countries they are not as successful in being elected despite running in higher numbers. Are there campaign financing inequalities between LGBTQ+ candidates and straight cisgender (cis) candidates? Are there inequalities among LGBTQ+ candidates? If so, what explains them?
We answer these questions using the case of LGBTQ+ candidates in Canada during the 2015, 2019, and 2021 federal elections. We combine data on out LGBTQ+ candidates with political finance data from an administrative database maintained by Elections Canada, Canada’s federal electoral management body. Our data include four of the five parties that won seats in the Canadian House of Commons during this period the center-left Liberal Party, the center-right Conservative Party, the social democratic New Democratic Party (NDP), and the Green Party.Footnote 2 The Canadian case is useful for answering our research questions because many LGBTQ+ candidates ran for these parties in these elections (N = 175), and there has been a greater diversity of LGBTQ+ candidates since the rainbow wave in 2019. This allows us to explore differences not only between straight cis and LGBTQ+ candidates but also among LGBTQ+ candidates, particularly in terms of gender.
We find important financing gaps not only between straight cis candidates and LGBTQ+ candidates but also among LGBTQ+ candidates. In bivariate analyses, we find LGBTQ+ candidates receive substantially less money than straight cis candidates. Among LGBTQ+ candidates, gender plays an important role: queer cis women and transgender and nonbinary (TNB) candidates are particularly disadvantaged with less money overall (grand total contributions).Footnote 3 Even when we control for other factors that predict contributions (district political competition, district demographics, other candidate variables, etc.), we still find substantive and significant gaps facing LGBTQ+ candidates in the Conservative and Green parties. However, LGBTQ+ candidates overall are not disadvantaged in the Liberals and the social democratic NDP — if anything, our results suggest that LGBTQ+ candidates may be advantaged relative to straight cis candidates in these parties. When we control for other variables, we find that queer cis men typically receive at least as much money as straight cis men, if not more. The results for queer cis women are mixed and vary by party. Finally, TNB candidates typically receive less money across parties, though the results for the Greens fall short of statistical significance. For all analyses, we generally find substantively similar results when we use transfers from party organizations to local campaigns or campaign spending instead of contributions as the outcome variable. Our findings suggest that financing gaps will narrow by addressing other barriers (e.g., electing more LGBTQ+ people or running LGBTQ+ candidates in more winnable districts). However, to fully address the gaps, more will be needed, such as setting up funds to help candidates from particular (sub)groups.
This paper contributes to three literatures. First, we add to research on barriers facing LGBTQ+ candidates by evaluating another potential barrier: political finance. Second, we contribute to a growing literature on identity and campaign finance by analyzing LGBTQ+ identities and, in doing so, expand work about gender and campaign finance by examining the intersection between gender and sexuality and considering TNB candidates. Third, we build on a small but growing literature that points to the importance of party organizations in (addressing) inequalities in political finance.
Barriers to LGBTQ+ Representation
As more LGBTQ+ candidates have run in recent years, scholars have turned their attention to identifying barriers these candidates face. One strand of work considers barriers posed by voters. Scholars suggest that negative public opinion (Everitt and Camp Reference Everitt and Camp2014), public scrutiny (Wagner Reference Wagner2021), and/or stereotyping (Wagner Reference Wagner2019) can deter LGBTQ+ people from running. Other scholars identify voter bias as a barrier to at least some LGBTQ+ candidates (see Golebiowska Reference Golebiowska2003; Herrick and Thomas Reference Herrick, Thomas, Ellen and Tadlock1999, Reference Herrick and Thomas2001 for negative reactions to out lesbian and gay candidates; but see Everitt and Horvath Reference Everitt and Horvath2021; Loepp and Redman Reference Loepp and Redman2022; Magni and Reynolds Reference Magni and Reynolds2018, Reference Magni and Reynolds2021 for the lessening of penalties facing some LGBTQ+ candidates in some contexts; see Haider-Markel et al. Reference Haider-Markel, Miller, Flores, Lewis, Tadlock and Taylor2017; Jones et al. Reference Jones, Brewer, Young, Lambe and Hoffman2018; Jones and Brewer Reference Jones and Brewer2019; Magni and Reynolds Reference Magni and Reynolds2021 for voter biases against trans candidates).
A second strand of work explores barriers posed by parties. Ashe (Reference Ashe, Tremblay and Everitt2020) examines whether party gatekeepers prefer straight cis candidates but finds this is not the case. There is evidence, however, that parties pose barriers to LGBTQ+ candidates by running them in districts they are unlikely to win (Baisley and Albaugh Reference Baisley and Albaugh2025; Everitt and Tremblay Reference Everitt and Tremblay2023; Lapointe, Ferland, and Turgeon Reference Lapointe, Ferland and Turgeon2024; but for contrary evidence outside of Canada, see Grahn Reference Grahn2024; Haider-Markel Reference Haider-Markel2010). Incumbency could be another party barrier to LGBTQ+ candidates given the low number of out LGBTQ+ elected officials and party insiders’ preference to renominate incumbents (Albaugh Reference Albaugh2022).
We add to research on barriers facing LGBTQ+ candidates by examining another potential barrier: political finance. If LGBTQ+ candidates receive less money than their straight cis counterparts, this could help explain why they are less likely to win in some countries. Although there is some evidence that LGBTQ+ candidates in the US are more successful fundraisers (Magni and Reynolds Reference Magni and Reynolds2022), the same pattern might not hold in other contexts, especially in countries like Canada where an increase in the number of LGBTQ+ candidates running has not translated into more LGBTQ+ elected officials. In asking whether LGBTQ+ candidates receive less money, we take inspiration from work on campaign finance and women candidates.
Identity and Campaign Finance
Much of the research about identity and campaign finance has focused on women. Early work on gender and campaign finance explored whether financing was a barrier for women candidates. For instance, Uhlaner and Schlozman (Reference Uhlaner and Schlozman1986) analyzed whether major-party women candidates for the United States House of Representatives in the 1980 election raised less money than men candidates. The authors found that women raised less money than men but that this was due to factors — such as incumbency or committee chairmanships — that donors valued but that were more common among men. As Buckley and Mariana (2023) explain, in many contexts women continue to be disadvantaged when it comes to factors associated with raising money.
Over time, research began to show that fundraising and spending differences between candidates did not fall along gender lines, at least in some contexts (for evidence from the US, see Burrell Reference Burrell1985, Reference Burrell2014; Herrnson, Lay, and Stokes Reference Herrnson, Lay and Stokes2003; Hogan Reference Hogan2007; Thomsen and Swers Reference Thomsen and Swers2017; for evidence from Canada, see Garnett et al. Reference Garnett, Pruysers, Young and Cross2022; Tolley, Besco, and Sevi Reference Tolley, Besco and Sevi2022; but for evidence of women facing fundraising disadvantages in other contexts, see Cigane and Ohman Reference Cigane and Ohman2014; Piscopo et al. Reference Piscopo, Hinojosa, Thomas and Siavelis2022; Sidhu and Meena Reference Sidhu and Meena2007; Tovar Reference Tovar2007). Yet scholars largely agree that the playing field is still not even for women when it comes to political finance. Instead, researchers shifted their attention to other gendered differences in financing. They note, for example, that the costs of running for office can deter women from running in the first place (Burrell Reference Burrell1985; Murray Reference Murray2023). There is some evidence from the US that women have to spend more to achieve the same results as men (Herrnson, Hunt, and Kettler Reference Herrnson, Hunt and Kettler2022). Others show that even if women candidates raise the same amount or more than men, they do so by devoting greater effort to fundraising (Burrell Reference Burrell2003) and undertaking different fundraising activities (Crespin and Deitz Reference Crespin and Deitz2010). Women candidates, for example, are more likely to receive money from women, who are less likely to donate and donate in smaller amounts than men (McMahon, Sayers, and Alcantara Reference McMahon, Sayers and Alcantara2023; Tolley, Besco, and Sevi Reference Tolley, Besco and Sevi2022). In some contexts, women candidates make up for this by getting other funds. In the US, women’s donor networks, such as EMILY’s List and the WISH List, help women candidates and sometimes even provide them a fundraising advantage over men (Burrell Reference Burrell2003, Reference Burrell2014). In the Canadian context, Currie-Wood and Pruysers (Reference Currie-Wood and Pruysers2023) show that central parties can and sometimes do support women candidates with additional campaign funds but this has not been a consistent priority.
There has also been some research on race and campaign finance. Cho (Reference Cho2002), for example, finds that Asian Americans tend to donate to Asian American candidates. In the US, Grumbach and Sahn (Reference Grumbach and Sahn2020) show that the presence of an Asian, Black, or Latino nominee increases the proportion of Asian, Black, or Latino contributions in the general election. In Canada, Besco and Tolley (Reference Besco and Tolley2022) find that ethnic minorities are less likely to donate than other Canadians with the exception of South Asian Canadians who donate at very high rates.
Our work draws on and contributes to work on identity and campaign finance in three ways. First, most research on identity and campaign finance has focused on gender and race, and at times the intersection of gender and race (Grumbach, Sahn, and Staszak Reference Grumbach, Sahn and Staszak2022; Sanbonmatsu Reference Sanbonmatsu2025; Sorensen and Chen Reference Sorensen and Chen2022) or gender and class (Murray Reference Murray2023). We consider other identities — LGBTQ+ identities — and look at a different intersection: the intersection of gender and sexuality. However, in doing so, we take inspiration from early work on gender and campaign finance by examining whether there are financing gaps (in this case between straight cis and LGBTQ+ candidates). Like that early work, we consider whether these gaps persist after controlling for factors associated with fundraising (Uhlaner and Schlozman Reference Uhlaner and Schlozman1986).
Second, we expand work about gender and campaign finance by considering TNB candidates. This more comprehensive analysis of gender has become possible and more important in recent years as more of these candidates run. Our findings suggest that disaggregated intersectional analyses are important because straight cis women likely drive findings about the lack of gender financing gaps.
Finally, much of the literature on campaign finance has focused on the US. Yet the US is an outlier in many respects, including in how candidate-centered its elections are, the prevalence of private forms of political financing, and the existence of political action committees (PACs) (Feo, Fiorelli, and Piccio Reference Feo, Fiorelli and Piccio2023). As a result, scholars have emphasized the need for more work from other contexts, particularly from countries with different political systems and institutions (Besco and Tolley Reference Besco and Tolley2022; Feo, Fiorelli, and Piccio Reference Feo, Fiorelli and Piccio2023). We take up that call in this paper by focusing on Canada.
Why Might LGBTQ+ Candidates Receive Less Money?
In this section, we discuss why LGBTQ+ candidates might receive less money. In doing so, we focus on inequalities that might arise during fundraising for general elections. Given that, we do not focus directly on inequalities that may arise in political recruitment, but we discuss potential downstream consequences of inequalities in political recruitment as they relate to financing campaigns.
The simplest reason to expect LGBTQ+ candidates to receive less money is that they often run for parties that raise less money. Typically, right-of-center candidates have a fundraising advantage as they draw support from wealthy individual donors and/or corporate donors (Cross, Pruysers, and Currie-Wood Reference Cross, Pruysers and Currie-Wood2022; Feo, Fiorelli, and Piccio Reference Feo, Fiorelli and Piccio2023). However, LGBTQ+ candidates, especially from intersectionally marginalized subgroups, tend to run for left parties, particularly those that have historically taken more pro-LGBTQ+ policy positions (Everitt and Camp Reference Everitt and Camp2014; Everitt and Tremblay Reference Everitt and Tremblay2023; Everitt, Tremblay, and Wagner Reference Everitt, Tremblay and Wagner2019; Lapointe, Ferland, and Turgeon Reference Lapointe, Ferland and Turgeon2024). As a result, we expect LGBTQ+ candidates, especially those from intersectionally marginalized subgroups, to receive less money than their straight cis counterparts.
Party gatekeepers and donors may direct less money to LGBTQ+ candidates for reasons other than their gender and sexuality. These actors often want to ensure that contributions matter for election outcomes by helping the party win seats. As a result, they may funnel more money to those they think have a better chance of winning based on incumbency, district competitiveness, and past political experience (Buckley and Mariani Reference Buckley and Mariani2023; Feo, Fiorelli, and Piccio Reference Feo, Fiorelli and Piccio2023; Krasno, Green, and Cowden Reference Krasno, Green and Cowden1994; Uhlaner and Schlozman Reference Uhlaner and Schlozman1986). Yet we know that women and LGBTQ+ people are less likely to be incumbents, more likely to run in seats the party is unlikely to win, and less likely to have past political experience (Baisley and Albaugh Reference Baisley and AlbaughForthcoming; Baisley and Albaugh Reference Baisley and Albaugh2025; Buckley and Mariani Reference Buckley and Mariani2023; Everitt, Tremblay, and Wagner Reference Everitt, Tremblay and Wagner2019; Lapointe, Ferland, and Turgeon Reference Lapointe, Ferland and Turgeon2024; Uhlaner and Schlozman Reference Uhlaner and Schlozman1986). Intersectionally marginalized subgroups of LGBTQ+ people, such as queer women or TNB people, are even less likely to be incumbents or run in “winnable” districts (Everitt and Tremblay Reference Everitt and Tremblay2023). As a result, we examine whether financing gaps between straight cis and LGBTQ+ candidates and across LGBTQ+ subgroups persist after adjusting for other variables on which these candidates are disadvantaged. If these financing gaps go away after controlling for these factors, it does not mean that LGBTQ+ candidates (or particular subgroups) are not disadvantaged. Instead, it suggests that addressing other factors, such as incumbency, district competitiveness, or past political experience, would help address financing gaps.
Beyond these inequalities in factors typically associated with fundraising, we see reasons to expect LGBTQ+ candidates to be disadvantaged. First, as scholars increasingly argue, politics is shaped by cisheteronormativity — or the idea that cisgender people who are heterosexual are the norm and that their relationships are considered natural and superior (Ashe Reference Ashe, Tremblay and Everitt2020; Everitt and Tremblay Reference Everitt and Tremblay2023; Raney Reference Raney, Tremblay and Everitt2020; Schotel and Mügge Reference Schotel and Mügge2024). As these scholars note, LGBTQ+ candidates (especially TNB candidates) have long been excluded from politics. Even as these candidates have become more visible in formal politics in recent years, scholars have often described them as “space invaders” whose presence highlights and challenges the norms and boundaries of politics (Everitt and Tremblay Reference Everitt and Tremblay2023; Schotel and Mügge Reference Schotel and Mügge2024). Due to cisheteronormativity, party gatekeepers and donors may see LGBTQ+ candidates as less conventional and electable and therefore engage in “strategic discrimination” when donating or allocating funds (for more on strategic discrimination, see Bateson Reference Bateson2020). Party gatekeepers and donors may also have concerns about LGBTQ+ candidates being “single-issue” candidates and therefore offer less financial support (for more on fears about single-issue candidates, see Tremblay Reference Tremblay2022).
LGBTQ+ candidates may also be disadvantaged in fundraising due to wage gaps. Research on other marginalized groups finds affinity effects in campaign finance. More specifically, scholars note that women are more likely to support women candidates and that racial minorities are more likely to support racial minority candidates (see, e.g., Besco and Tolley Reference Besco and Tolley2022; Grumbach and Sahn Reference Grumbach and Sahn2020; Tolley, Besco, and Sevi Reference Tolley, Besco and Sevi2022). This can put women and racial minority candidates at a disadvantage because of wage gaps, with women and racial minorities having less money to donate due to earning less than men and white people, respectively (Grumbach and Sahn Reference Grumbach and Sahn2020; Tolley, Besco, and Sevi Reference Tolley, Besco and Sevi2022). One might expect affinity effects with LGBTQ+ donors being more likely to support LGBTQ+ candidates. This may leave LGBTQ+ candidates at a disadvantage because LGBTQ+ people earn less than straight cis people (Appiah et al. Reference Appiah, Brennan, Halpenny, Pakula and Waite2021; Carpenter et al. Reference Carpenter, Feir, Pendakur and Warman2024; Carpenter, Goodman, and Lee Reference Carpenter, Goodman and Lee2024; for a broader discussion of employment outcomes, see Waite, Pajovic, and Denier Reference Waite, Pajovic and Denier2020). These wage gaps are larger for some subgroups than others. For example, Appiah et al. (Reference Appiah, Brennan, Halpenny, Pakula and Waite2021) find that heterosexual men earned the most, followed by gay men, lesbian women, bisexual men, and bisexual women. Research that includes TNB people tends to find very large wage gaps (Carpenter et al. Reference Carpenter, Feir, Pendakur and Warman2024; Carpenter, Goodman, and Lee Reference Carpenter, Goodman and Lee2024). In addition, we note that young candidates often face biases in politics (Gélix and Chassé Reference Gélix and Chassé2024; Stockemer, Gallant, and Tolley Reference Stockemer, Gallant and Tolley2024). Given that TNB people tend to be young (Statistics Canada 2022), they may also be disadvantaged in financing due to their age.
Due to broader systems of marginalization and research on wage gaps, we expect differences in financing across LGBTQ+ subgroups. We focus our discussion on four categories we can examine with our data:
-
• Queer cis men: Among LGBTQ+ subgroups, we expect queer cis men to be the most advantaged, in part because they are men. Although they are still disadvantaged by cisheteronormativity in politics, they were often the first of LGBTQ+ subgroups to enter formal politics (Everitt and Camp Reference Everitt and Camp2014; Rayside Reference Rayside1998). As a result, even if they are not the most “conventional” or “traditional” candidates, party gatekeepers and donors may have fewer concerns at this point about their electability. However, gay and bisexual cis men tend to earn less than straight cis men (Appiah et al. Reference Appiah, Brennan, Halpenny, Pakula and Waite2021).
-
• Queer cis women: Among LGBTQ+ subgroups, we expect queer cis women to be the next most (dis)advantaged. Gender biases in politics likely disadvantage queer cis women compared to queer cis men. In addition, queer cis women typically entered formal politics later than queer cis men, and there are still fewer of them in elected office (Everitt and Tremblay Reference Everitt and Tremblay2023; Reynolds Reference Reynolds2013). As a result, we expect party gatekeepers and donors to see queer women as less “conventional” or “traditional” as candidates. Wage gaps pose more problems for queer cis women than queer cis men (Appiah et al. Reference Appiah, Brennan, Halpenny, Pakula and Waite2021), which also shapes our expectation that queer cis women will be more disadvantaged than queer cis men.
-
• TNB candidates: We expect TNB candidates to be even more disadvantaged than queer cis men and queer cis women due to cisnormativity. In addition, TNB candidates typically entered formal politics even later than queer cis men and queer cis women, marking them as even less conventional candidates (Schotel and Mügge Reference Schotel and Mügge2024). There are still many contexts, such as federal politics in Canada, where there has yet to be an out trans or nonbinary elected representative (Everitt and Tremblay Reference Everitt and Tremblay2023). TNB people face significant wage gaps (Carpenter et al. Reference Carpenter, Feir, Pendakur and Warman2024; Carpenter, Goodman, and Lee Reference Carpenter, Goodman and Lee2024), shaping our expectation that TNB candidates will be disadvantaged in fundraising. In addition, past work suggests that TNB candidates face voter biases (Haider-Markel et al. Reference Haider-Markel, Miller, Flores, Lewis, Tadlock and Taylor2017; Jones et al. Reference Jones, Brewer, Young, Lambe and Hoffman2018; Jones and Brewer Reference Jones and Brewer2019; Magni and Reynolds Reference Magni and Reynolds2021). As a result, party gatekeepers and donors may see TNB candidates as particularly unelectable and therefore not direct funds to them.
-
• Two Spirit candidates: We have few expectations about Two Spirit candidates given limited research about Indigenous candidates and financing and inequalities facing Two Spirit individuals in general (for a discussion of data limitations regarding Two Spirit people in wage gaps, see Appiah et al. Reference Appiah, Brennan, Halpenny, Pakula and Waite2021). However, they may be disadvantaged due to being both Indigenous and part of the LGBTQ+ community.
We also see reasons why LGBTQ+ candidates, including those from intersectionally marginalized subgroups, may be disadvantaged within certain parties, particularly right-of-center parties. In many countries, right-of-center parties have anti-LGBTQ+ voters as part of their base, but they may need to appeal to voters who are not anti-LGBTQ+ to win elections. Although right-of-center parties may nominate LGBTQ+ candidates strategically to signal to voters that they are not anti-LGBTQ+ (for a similar logic for women, see Weeks et al. Reference Weeks, Meguid, Kittilson and Coffé2023), there are a few reasons to expect party gatekeepers and donors in these parties not to back LGBTQ+ candidates financially. First, if these party gatekeepers and donors are themselves socially conservative or anti-LGBTQ+, they may be unwilling to finance LGBTQ+ candidates. Second, right-of-center parties may be especially concerned that their own voters may be unwilling to vote for LGBTQ+ candidates and not view LGBTQ+ candidates as electorally competitive enough to be worth backing financially. Finally, right-of-center parties are typically resistant to equity policies within their own organizations, which makes them (particularly) unlikely to identify, mitigate, or counter biases facing LGBTQ+ candidates, including in finance. All these factors lead us to suspect that LGBTQ+ candidates are likely to be disadvantaged within right-of-center parties, such as the Conservative Party of Canada.
The Canadian Case
To compare the political financing of straight cis versus LGBTQ+ candidates, we turn to the Canadian case. This case is useful for such a study given that many LGBTQ+ candidates have run in recent Canadian federal elections. In 2019, Canada experienced a “rainbow wave,” with a record number of LGBTQ+ candidates running for office (Lenti Reference Lenti2019). Many LGBTQ+ candidates ran again in 2021. The “rainbow wave” also ushered in more diversity in terms of LGBTQ+ candidates, Baisley and Albaugh Reference Baisley and AlbaughForthcoming CJPS, which presents an opportunity to examine differences in political financing among differently situated LGBTQ+ candidates (for example, cis versus TNB candidates, queer cis men versus queer cis women, etc.).
We note a few major institutional features of the Canadian case that may shape political financing. First, Canada has a Westminster parliamentary system with very high party discipline, making it unlikely individual candidates’ ideological positions matter for political financing. As a result, ideology is likely to play a role in shaping which parties donors support, as opposed to which individual candidates (for the importance of party to political donations in Canada, see Garnett et al. Reference Garnett, Pruysers, Young and Cross2022; but for the importance of ideology in the US, see Barber, Canes-Wrone, and Thrower Reference Barber, Canes-Wrone and Thrower2017; Barber Reference Barber2016). Second, Canada’s House of Commons uses a single-member plurality electoral system, similar to the US House of Representatives or the UK House of Commons, making district-level electoral contexts highly salient for party gatekeepers and donors. Third, Canada has a multiparty electoral system in which five parties win seats: the Liberals, the Conservatives, the NDP, the Bloc québecois (BQ), and the Greens. Prior to the 2015 election, the Conservatives formed a majority government and the NDP formed the Official Opposition federally for the first time in Canadian history. After the 2015 election, however, the Liberals formed a majority government with the Conservatives as the Official Opposition. The Liberals were reduced to minority government status as a result of the 2019 election, and the Conservatives remained as the Official Opposition. The Liberals secured a second minority after a snap election in 2021.
Comparatively speaking, Canada’s campaign finance regime is fairly restrictive (International Institute for Democracy and Electoral Assistance 2025). As Garnett et al. (Reference Garnett, Pruysers, Young and Cross2022) explain, “[t]he only legal sources of income for Canadian political parties and candidates are publicly funded election expense reimbursements and contributions from individual donors” (422). Since 2003, union and corporate donations have been prohibited in Canada, making individual donations central to political finance in Canada. However, there are limits on individual donations. In 2015 (the start of the period under study), individuals could donate a maximum of $1,500 per calendar year to each of the registered parties and another $1,500 per calendar year — in aggregate — to the registered electoral district associations (EDAs), nomination contestants, and candidates of each of the registered political parties.Footnote 4 The $1,500 limits increase by $25 each year and include both monetary and non-monetary (or “in-kind” contributions) (Elections Canada n.d.). There are also spending limits, which are based on the year, the length of the campaign, and the population of the district. Given that spending limits are based in part on the length of the campaign period, it is worth noting that there was some variation over these elections. By Canadian standards, the 2015 campaign (of 11 weeks) was long. The campaigns in 2019 (five and a half weeks) and 2021 (five weeks) were more typical. Third-party spending is also tightly regulated, and Canada does not have PACs. Many of these features of Canada’s political finance regime are common among post-industrial democracies, though some post-industrial countries do not have the same restrictiveness or give more public funding to parties.
The political finance system in Canada is quite party-centric. Although individuals can contribute directly to local candidates, most donations are made to registered parties (central or national party organizations) or to EDAs (local party organizations). Central and local party organizations can then transfer funds to local candidates (sometimes through complex pathways, such as from an individual contributor to the registered party to the EDA to the local candidate). In our data, for example, party transfers from either the central or local organizations account for the lion’s share of funding that local candidates receive: the median candidate who receives any money obtains 89% of their total fundraising from transfers from registered parties or EDAs, and 88% of candidates who receive any money obtain at least 50% of their total fundraising from transfers from registered parties or EDAs. Canadian parties, therefore, are important intermediaries for campaign finance, which presents an opportunity to examine how they allocate resources (see also Currie-Wood and Pruysers Reference Currie-Wood and Pruysers2023). In this way, Canada is more similar than the US to many other countries: work on countries other than the US has emphasized the important role of political parties in political finance, including in Chile (Piscopo et al. Reference Piscopo, Hinojosa, Thomas and Siavelis2022), Ireland (Buckley and Mariani Reference Buckley and Mariani2023), South Korea (Shin and Kwon Reference Shin and Kwon2023), Cabo Verde and Ghana (Wang, Muriaas, and Bauer Reference Wang, Muriaas and Bauer2023).
Canada has two well-documented patterns that play important roles in shaping LGBTQ+ representation. First, less electorally successful left parties, such as the NDP and the Greens, tend to nominate LGBTQ+ candidates in much larger numbers than the two major parties, the Liberals and the Conservatives. This pattern contrasts with other countries where major parties tend to nominate LGBTQ+ candidates who then have good chances of winning their seats, such as the US (Democrats) and the UK (Labour and Conservatives). Second, parties nominate LGBTQ+ candidates in less winnable districts, unlike the Democrats in the US (Haider-Markel Reference Haider-Markel2010) and Swedish parties (Grahn Reference Grahn2024). When we examine financing gaps without controls, we expect these factors to put LGBTQ+ candidates at a greater disadvantage in Canada than in some other countries.
Many Canadian parties have adopted equity policies, particularly for candidate searches and nominations. Several Canadian political parties set targets for the representation of candidates from certain groups. These policies were often set for women and, in some cases, have been expanded to include other equity-seeking groups, including LGBTQ+ people. In recent years, the Liberals have aimed for 30% of their candidates to be women (Lapointe, Ferland, and Turgeon Reference Lapointe, Ferland and Turgeon2024, 3); the NDP “aims to have women candidates running for election in at least 50 per cent of all electoral districts and to have women candidates in at least 60 per cent of the electoral districts where it has a chance of winning” (Ashe Reference Ashe, Tremblay and Everitt2020, 306); and the Greens set a target for 50% women (Lapointe, Ferland, and Turgeon Reference Lapointe, Ferland and Turgeon2024, 3). Since 2019, the NDP’s gender target explicitly includes TNB individuals. The NDP also has an additional target of nominating 30% of candidates from equity-seeking groups in winnable districts. In this policy, “equity-seeking groups” includes LGBTQ+ people, racialized persons, Indigenous people, persons living with disabilities, and youth (New Democratic Party of Canada 2019).
The Liberals, NDP, and Greens all have diversity search committees, which can pressure local organizations to meet these targets. These committees can assist with candidate searching and recruitment and even freeze nominations until there has been a “thorough” search for candidates from equity-seeking groups. Following the lead of the NDP, the Liberals and Greens now also include LGBTQ+ candidates in their policies requiring a “thorough” search for candidates from equity-seeking groups (Ashe Reference Ashe, Tremblay and Everitt2020; Everitt Reference Everitt2015; Everitt and Tremblay Reference Everitt and Tremblay2023; Green Party of Canada 2021; Liberal Party of Canada 2020).
Some Canadian political parties have also considered candidate diversity and equity when it comes to political finance. In 1983, the NDP established the Agnes McPhail fund to support women in nomination contests and general elections, and in 1984 the Liberals established the Judy LaMarsh Fund to support women candidates (Bashevkin Reference Bashevkin1993). Funds for LGBTQ+ candidates were established much later and have been less widespread. Although the NDP currently has Victory Funds for racial minorities, women, LGBTQ+ people, persons living with disabilities, and Indigenous peoples, the earliest documentation we can find of a Victory Fund for LGBTQ+ candidates is from June 11, 2022 — that is, after the period under study in this paper.Footnote 5
Data
We examine inequalities in political finance by combining two data sources. First, we draw on Baisley and Albaugh’s (Reference Baisley and AlbaughForthcoming) dataset of candidates for the 2015–21 Canadian federal elections, which provides information on LGBTQ+, TNB, and Two Spirit candidates. Although this dataset includes the five parties that won seats in the Canadian House of Commons, we exclude the BQ because it had only one out LGBTQ+ candidate during this time period. Second, we draw on finance data from Elections Canada, Canada’s federal electoral management body. We use Part 2f (“Summary of Contributions, Loans, Transfers, and Other Cash Inflows”) of reports of financial returns filed by candidates after each election. When possible, we use the financial returns amended by Elections Canada. When amended returns are not available, we use the original returns filed by candidates. We present an overview of the coding of all variables in the dataset and their sources in Online Appendix A.
Our explanatory variables are candidate identities. First, we examine a gap between straight cis and LGBTQ+ candidates. Then, given that there may be additional barriers facing particular subgroups, we examine six different non-overlapping groups: (1) straight cis men, (2) straight cis women, (3) queer cis men, (4) queer cis women, (5) TNB people, and (6) Two-Spirit people.Footnote 6
Figure 1 displays the number of out LGBTQ+ candidates by party in each year. Figure 1 shows the “rainbow wave” — the sharp increase in LGBTQ+ candidates from 2015 to 2019. It also highlights a partisan divide in nominating LGBTQ+ candidates. Unsurprisingly, the NDP, the party most tied to the LGBTQ+ movement (DeGagne Reference DeGagne2019), nominates the lion’s share of the LGBTQ+ candidates, followed by the Green Party, which is also ideologically left of the Liberal and Conservative parties.
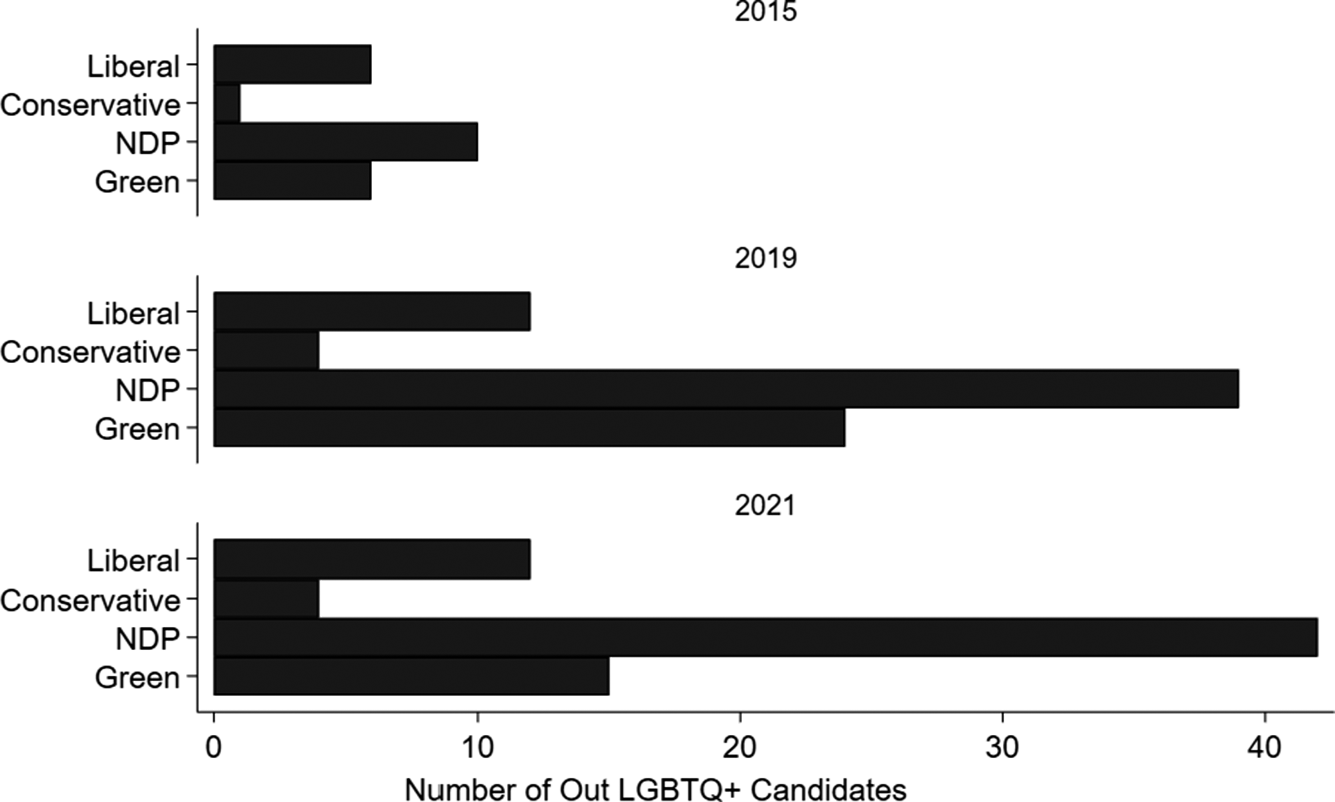
Figure 1. Number of LGBTQ+ candidates, by party and year.
Figure 2 breaks down LGBTQ+ candidates into subgroups.Footnote 7 In 2015, LGBTQ+ candidates across parties were rare and typically queer cis men, with a few queer cis women. In 2019 and 2021, LGBTQ+ candidates became more diverse, including substantial numbers of queer cis women and TNB candidates, along with a few Two Spirit candidates. Figure 2 highlights that, when we conduct more intersectional or disaggregated analyses, we need to be cautious about small cell sizes in our regression models, particularly for Two Spirit candidates across parties and subgroups within the Liberal and Conservative parties, which nominate few LGBTQ+ candidates.
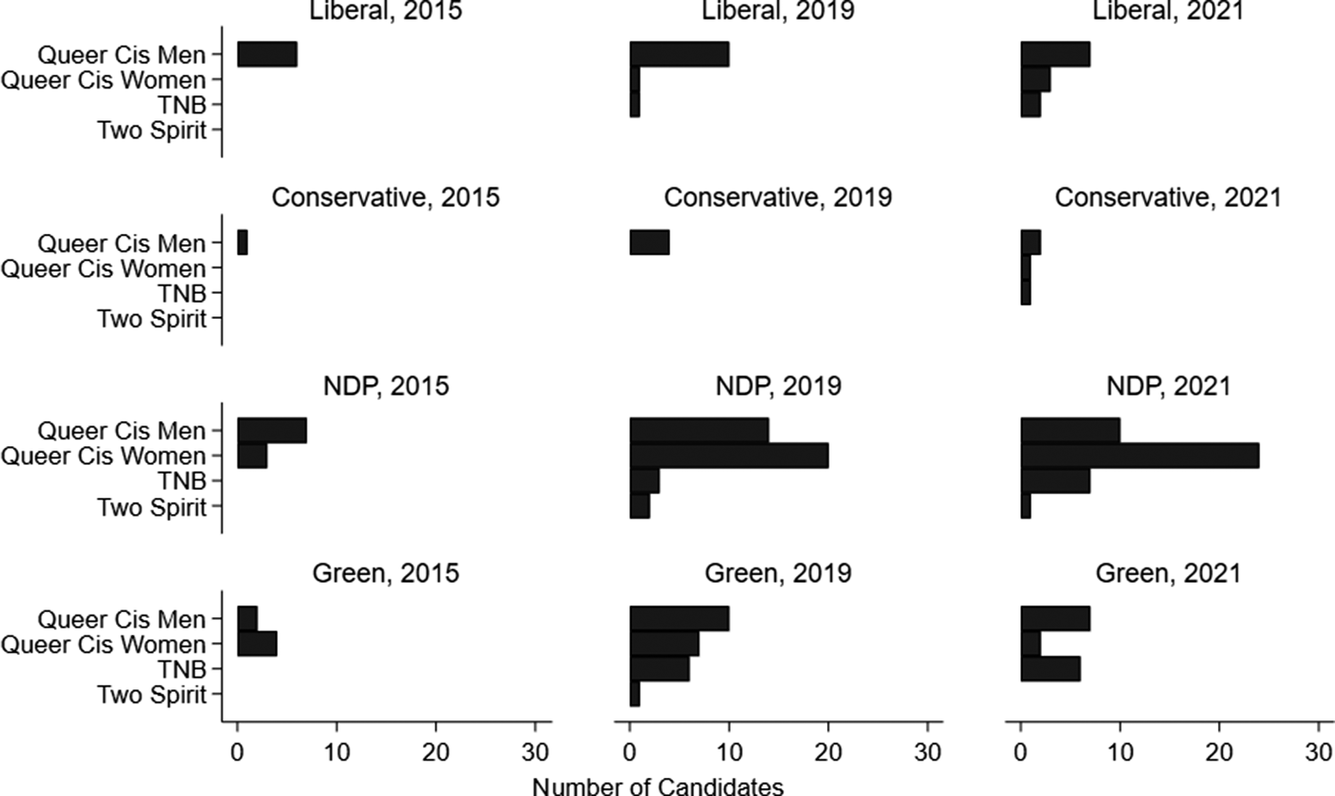
Figure 2. Number of candidates, by subgroup of LGBTQ+ candidates, party, and year.
Our main outcome of interest is the grand total contributions — the total amount of money raised as part of a candidate’s general election campaign. We use the reported grand total contributions for each candidate where possible. However, the Elections Canada data include some tabulation errors in grand total contributions. For example, some candidates report 0 Canadian dollars (CAD) in grand total contributions even when they have received money. We calculate the grand total contributions manually to correct these errors. In cases where we found candidates reporting campaign spending but not contributions, which are potential compliance errors, we replace the missing contributions data with overall campaign spending data. Our results are substantively similar if we focus on party transfers (the sum of monetary and non-monetary transfers from registered parties and EDAs to local candidates) or campaign spending (the total amount spent by a candidate in a general election campaign). We show these results in Online Appendices G and H.
Our dataset also includes a number of potential control variables, including party, year, gender, incumbency, challenging an incumbent, candidate race, past political experience at other levels of government, district competitiveness (the party’s win or loss margin in the previous election), the spending limit in each electoral district in CAD (calculated by Elections Canada based on population, in thousands CAD), district urbanity (pulled from Armstrong, Lucas, and Taylor Reference Armstrong, Lucas and Taylor2022 and rescaled 0–1), district median household income (in thousands of dollars), district median age, share of the district with a university degree, and the share of the district that is South Asian. We discuss the rationales for these control variables when we discuss our regression models in the Analysis section below.
We present descriptive statistics for our main outcome variable along with breakdowns for our explanatory variables and selected control variables in Table 1. We include five statistics that help illustrate the distributions: the (1) percentage of candidates who reported raising no money, (2) median, (3) mean, (4) standard deviation, and (5) range. We include the percentage of zeroes because political finance data often include substantial numbers of candidates who receive and/or spend zero money. In our case, zeroes are relatively rare. Only 7% of candidates received no money, and the overwhelming majority (83%) of the zeroes are Greens. These results suggest a pressing need to account for the large number of zeroes when analyzing Green candidates.
Table 1. Summary statistics for grand total contributions, overall and by categorical covariates
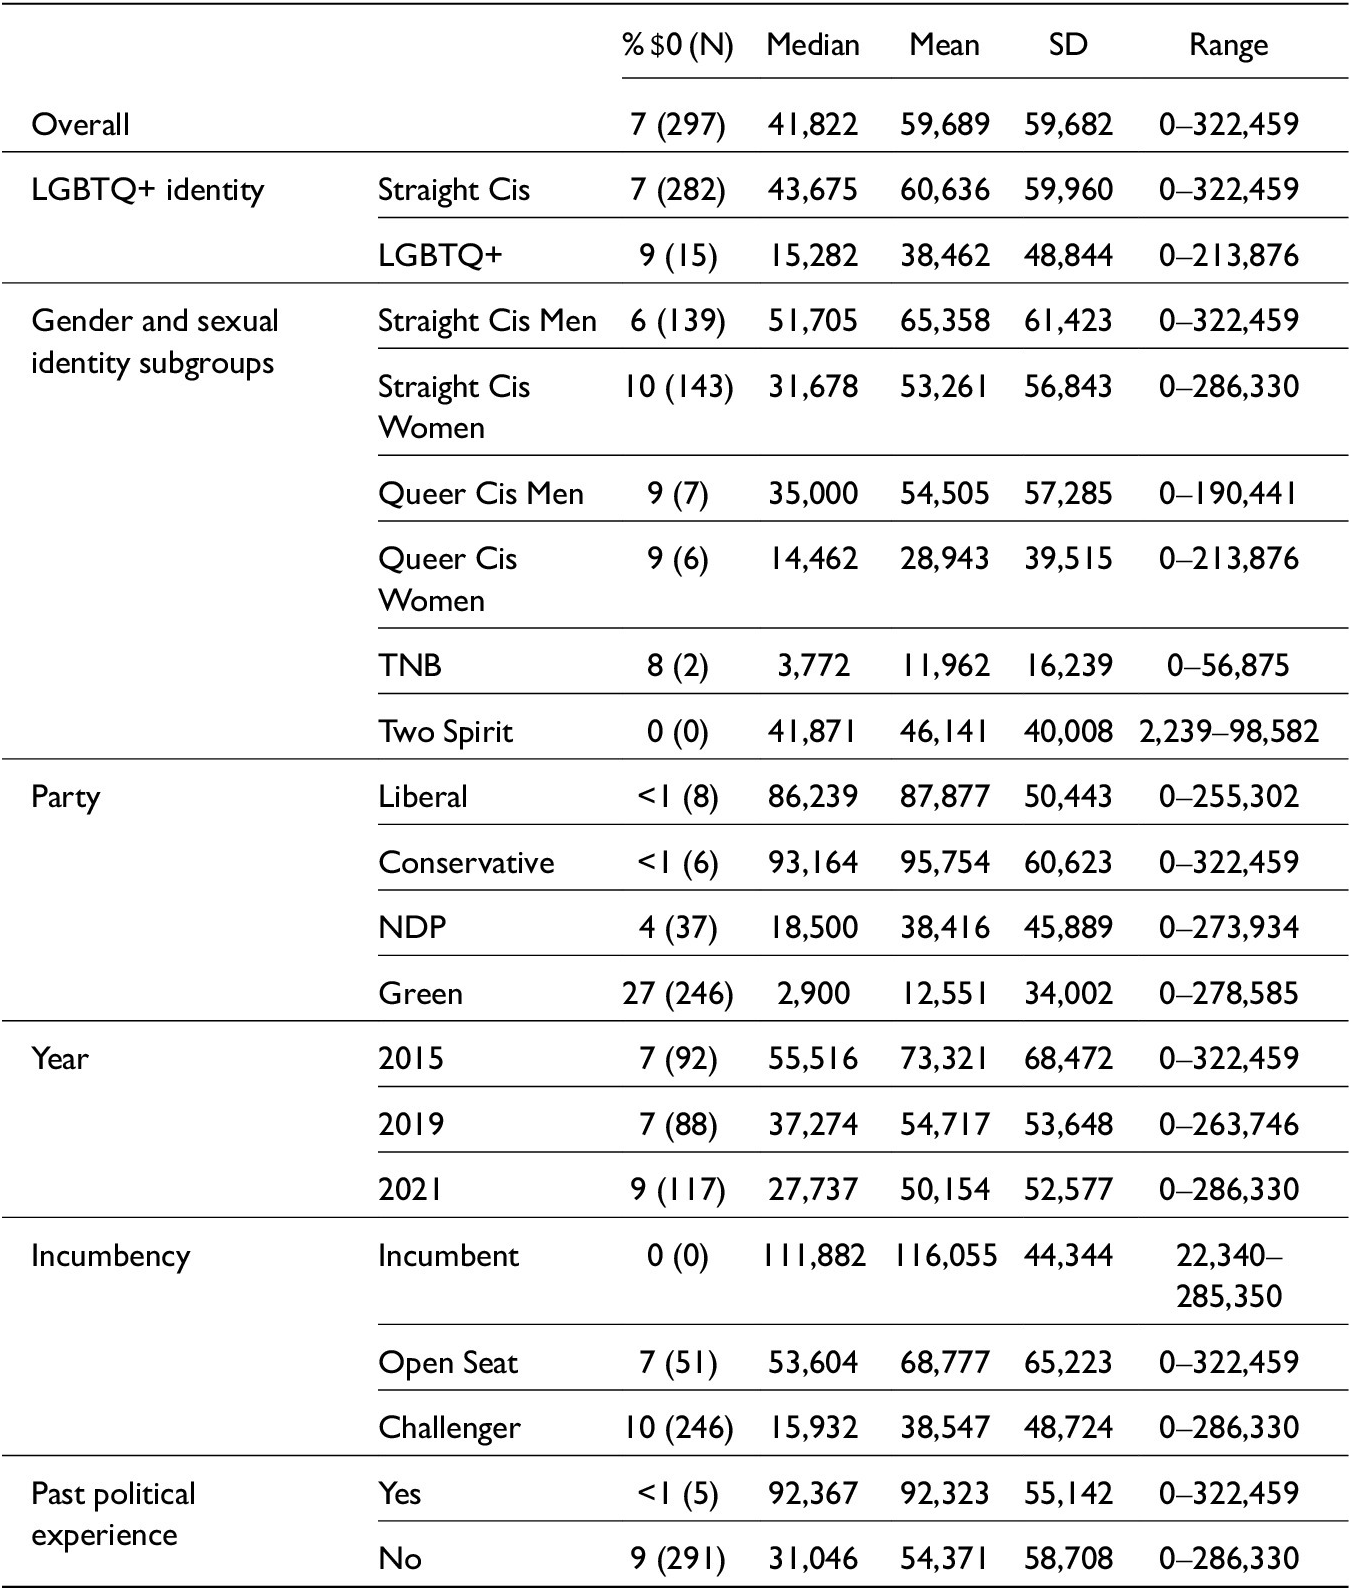
Table 1 shows some initial inequalities to explain in our regression analyses. LGBTQ+ candidates receive substantially less money than straight cis candidates. Among our disaggregated subgroups, we find that straight cis men receive the most, followed by Two Spirit candidates, queer cis men, straight cis women, queer cis women, and TNB candidates. The results for Two Spirit candidates may be surprising given that they may face marginalization both for being Indigenous and for being sexual/gender minorities, but the four Two Spirit candidates include Blake Desjarlais, the first Two Spirit Member of Parliament (MP) and one of the few NDP candidates who won a seat previously held by another party in 2021. Otherwise, these data typically show gender marginalization: men generally receive more than women, and cis candidates receive more than TNB candidates.
Although these bivariate analyses show some inequalities to be explained, the remainder of the table shows some other variables that may explain the bivariate inequalities. Partisan differences are likely to account for these bivariate inequalities. Conservative candidates receive the most, followed closely by the Liberals. However, NDP and Green candidates receive substantially less money overall. Given that LGBTQ+ candidates tend to run disproportionately for the NDP and, to a lesser extent, the Greens, the unequal fundraising across parties is likely to work against LGBTQ+ candidates. Fundraising goes down over time, for two reasons. First, in 2015, the Conservatives called a longer campaign period, which allowed candidates to spend more money in that election. Second, in 2021, the snap election left less time for parties and candidates to raise money. Given that LGBTQ+ candidates were more likely to be on the ballot in 2019 and 2021 than in 2015, we need to account for time in our regression models. Incumbents all received at least some money, often substantially more than candidates running in open seats or as challengers (running against incumbents). Candidates who have past political experience at other levels of government are more likely to receive money and receive substantially more than those who do not. Given that LGBTQ+ candidates are unlikely to be incumbents or have past political experience, these inequalities may account for the lower levels of fundraising among LGBTQ+ candidates.
Analysis
We account for the inequalities in political finance facing LGBTQ+ candidates using a series of regression models. We run two families of models. In all models, grand total contributions is the outcome. Model 1 uses the LGBTQ+ dummy as the main explanatory variable, and Model 2 uses disaggregated gender and sexual identity subgroups. We run separate models for each party because parties play a major role in distributing funds and may make different strategic decisions about, for example, how much to defend against other parties in areas they previously won or targeting new districts to win. However, we include a model with all parties as a baseline.
We estimate negative binomial models with Huber-White robust standard errors, adjusting for variables that may account for these gaps (for a recent example, see Piscopo et al. Reference Piscopo, Hinojosa, Thomas and Siavelis2022). These models address that the data do not contain negative values, which can bias ordinary least squares estimates. Negative binomial models rely on a log link. This log link addresses issues of heteroskedasticity and diminishing returns (a contribution of $1,000 means something different when a campaign has $10,000 than when it has $100,000). The distributions of the outcome variables visually correspond to negative binomial distributions rather than Poisson distributions, which also satisfy the first two criteria.
Given the relatively low share of zeroes in our data, we do not run zero-inflated negative binomial regressions, which are commonly used in other analyses of finance data. In our data, only the Green Party has a clearly inflated number of zeroes (see Table 1). In addition, there are potential estimation problems when using zero-inflated models, which account for “excess” zeroes beyond those predicted by a regular negative binomial model by mixing the negative binomial model with a binomial model, such as logit or probit. However, given some variables, such as incumbency, perfectly predict having more than zero contributions, the binomial portion of the model can run into estimation challenges. Given what we know about our data, we handle zeroes in two ways. In the main text, we exclude zeroes entirely, then we estimate zero-censored negative binomial regression models. These models are the most comparable across all four parties. In Online Appendix D, we supplement these results by running negative binomial models with the zeroes for the Liberals, Conservatives, and the NDP, then estimating a penalized logit model of whether Green candidates receive any money (Firth Reference Firth1993). Penalized logit accounts for perfect prediction (Rainey Reference Rainey2016).
Given that our descriptive statistics in Figure 2 show some small cell sizes, we note two exclusions from our models. First, we exclude Two Spirit candidates from our regression models. Second, we do not run models for the Liberals and Conservatives using the disaggregated gender and sexual identity subgroups. These exclusions follow our general rule not to run a regression analysis when we are dealing with cell sizes of under five.
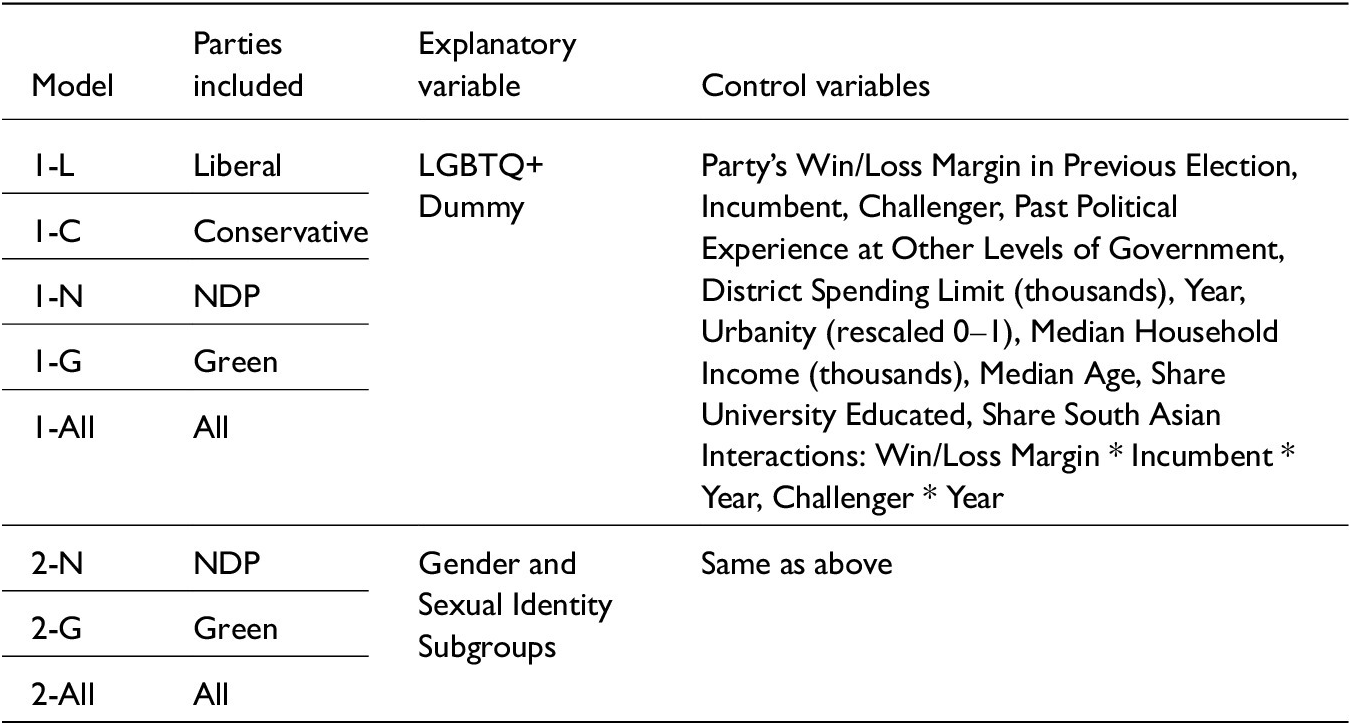
Table 2 shows an overview of the models run in the main manuscript, including the parties included, the specification of our main explanatory variable, and our control variables. In Models 1 and 2, we adjust for variables well-attested to correlate with political finance outcomes. First, we include variables that capture the district electoral context for the party, including the party’s win/loss margin in the previous election, incumbency, and running as a challenger (against an incumbent). Second, we account for the substantial variation in fundraising across elections by including both year dummies and the district spending limit in each election (in thousands CAD). Third, we add district demographics known to predict differences in political donations geographically in Canada, including urbanity (rescaled 0–1), median household income (in thousands CAD), median age, university-educated population share, and South Asian population share (Garnett Reference Garnett2024). Finally, we add two sets of interactions, including a three-way interaction between the win/loss margin, incumbency, and year and a two-way interaction between challenger and year. Although three-way interactions are difficult to interpret, the three-way interaction between incumbency, win margin, and year is well-supported in scatterplots of the data (see Online Appendix B). When we run models that pool across parties, we also include party dummies and include them in our preexisting interaction terms.
Table 2. Overview of models
Results
We start by presenting the results using a single variable for all LGBTQ+ candidates before dividing into subgroups. Figure 3 displays the average marginal effect (AME) for the LGBTQ+ candidate variable from Model 1 for each party separately and for all four parties pooled. The regression table for these models are in Online Appendix Table C1. It shows some notable differences across parties. The Conservatives and the Greens show negative AMEs, which suggests that even after accounting for other variables, LGBTQ+ candidates for these parties receive less money. These discrepancies are substantively meaningful, especially compared to the typical fundraising for each party. The AME for the Conservatives is over one-quarter the median value received by Conservative candidates over this period, and the AME for the Greens is twice the median amount received by Green candidates over this period. By contrast, the Liberal and NDP AMEs are positive. Among the Liberals, LGBTQ+ candidates are not clearly disadvantaged — indeed, the point estimate is a “bonus” of 14,000 CAD, though it is nonsignificant (p = 0.11). Among the NDP, LGBTQ+ candidates are advantaged: they receive over 16,000 CAD more than would be expected given other variables. When we pool across parties, the estimate is noisy and nonsignificant, which fits with the mixture of positive and negative estimates for each party independently.
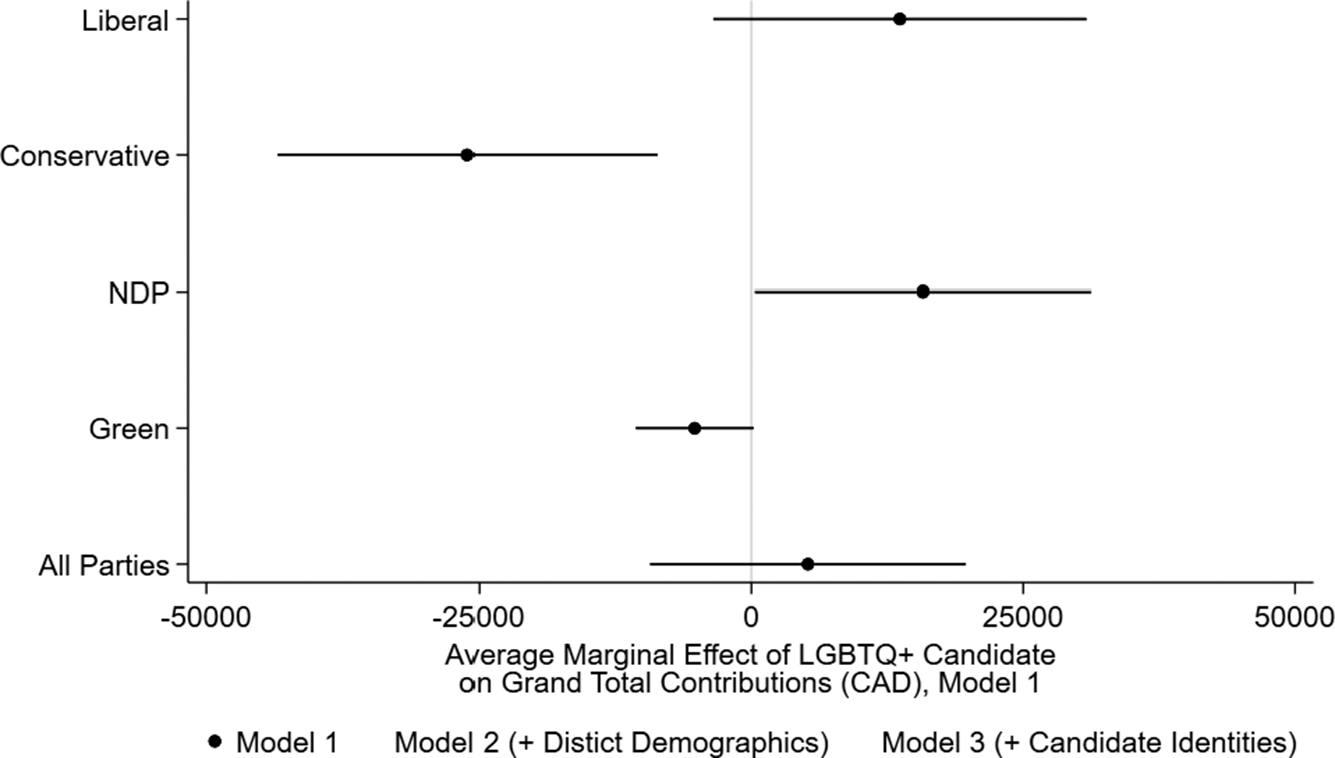
Figure 3. Average marginal effects of LGBTQ+ candidate identity, separately by party and pooled together, model 1.
The negative AME in the Conservative model fits with our expectations, but the Green result is more surprising. We suspect that the poor values for LGBTQ+ candidates among the Greens could come from a few factors, including the tendency for that party to focus their campaigning in a small number of target districts (none of which have LGBTQ+ candidates) and LGBTQ+ candidates appearing to be disproportionately young activists run as “paper candidates” who largely do not campaign in their own districts.Footnote 8 The LGBTQ+ candidate “bonus” in the NDP (and, though nonsignificant, the Liberals) is even more surprising given that it provides evidence against our expectations.
Next, we examine the AMEs for our disaggregated gender and sexual identity subgroups from Model 2. The results are available in Figure 4, and the regression tables for these models are available in Online Appendix Table C2. We show these models only for the NDP, the Greens, and pooled across parties because of small cell sizes for disaggregated data among the Liberals and the Conservatives. In our models, we find no evidence that straight cis women or queer cis men are disadvantaged. Indeed, the point estimates are largest for queer cis men in the NDP, though the estimates are very noisy due to small numbers. Queer cis women have mixed results. In the NDP, queer cis women are, if anything, advantaged (by over 9,000 CAD), though this result is nonsignificant. However, they are disadvantaged among the Greens (by about 8,000 CAD). When we pool across parties, we find no evidence queer cis women are disadvantaged, which is against our expectations.
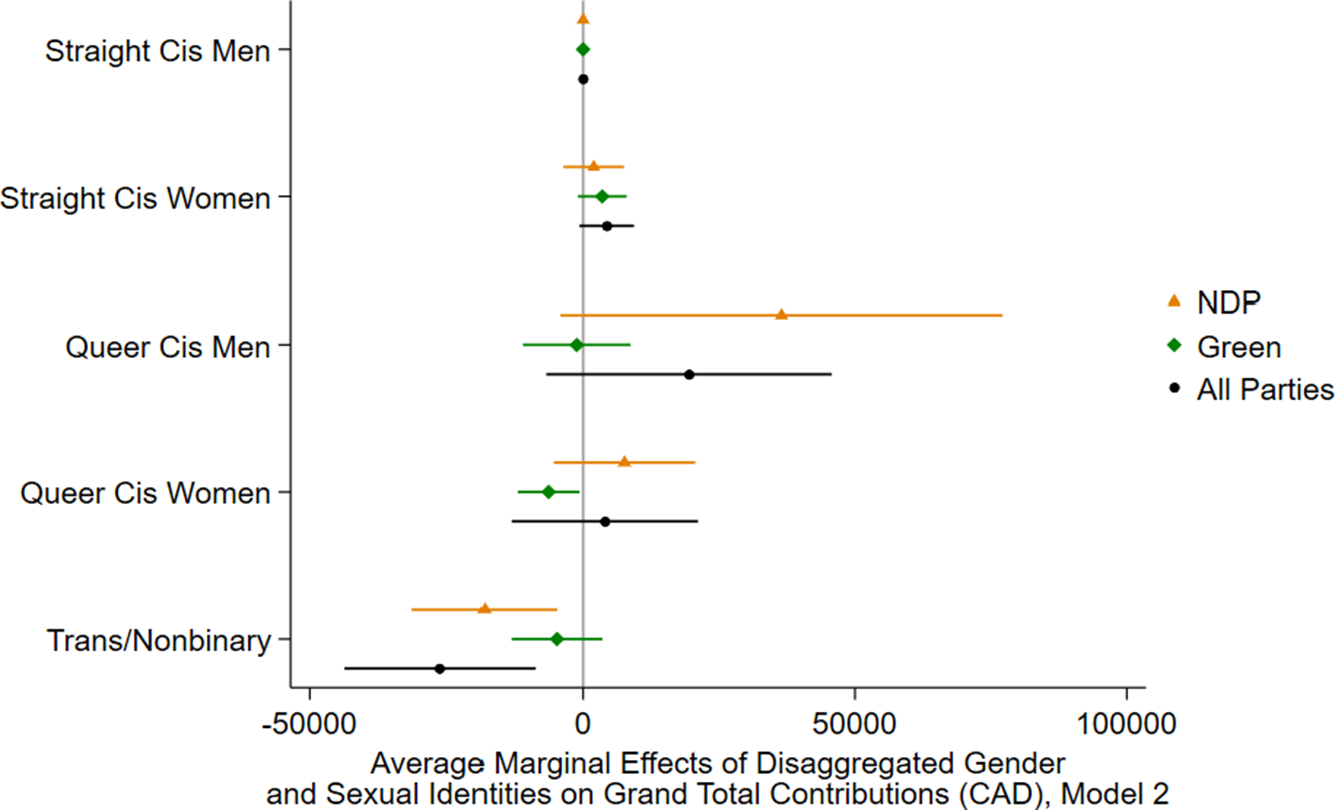
Figure 4. Average marginal effects of subgroup identities relative to straight cis men, separately by party and pooled together, model 2.
The results in Figure 4 show a clear disadvantage for TNB candidates, despite their small numbers, which is in line with our expectations. In the NDP, TNB candidates receive over 16,000 CAD less than straight cis men after adjusting for other variables. Indeed, in the NDP, TNB candidates receive significantly and substantially less money, even after adjusting for other variables, than all other gender and sexual identity subgroups. In the Greens, the point estimate is negative but nonsignificant. Finally, the results pooling across all parties are even worse for TNB candidates, estimating a gap of 23,000 CAD facing TNB candidates even after adjusting for other variables.
The results by different gender and sexual identity subgroups suggest that inequalities faced by LGBTQ+ candidates are not the same for all subgroups. Instead, gender plays an important role in explaining which candidates face disadvantage even among LGBTQ+ candidates. Our clearest result is that TNB candidates are disadvantaged even after accounting for many other variables on which they are disadvantaged and even within the NDP, the party most historically aligned with the LGBTQ+ movement. These findings suggest that party insiders and, potentially, donors may view them as not worth backing financially and raise questions about how to design equity policies that could compensate for these inequalities facing TNB candidates. We return to this point in our conclusion.
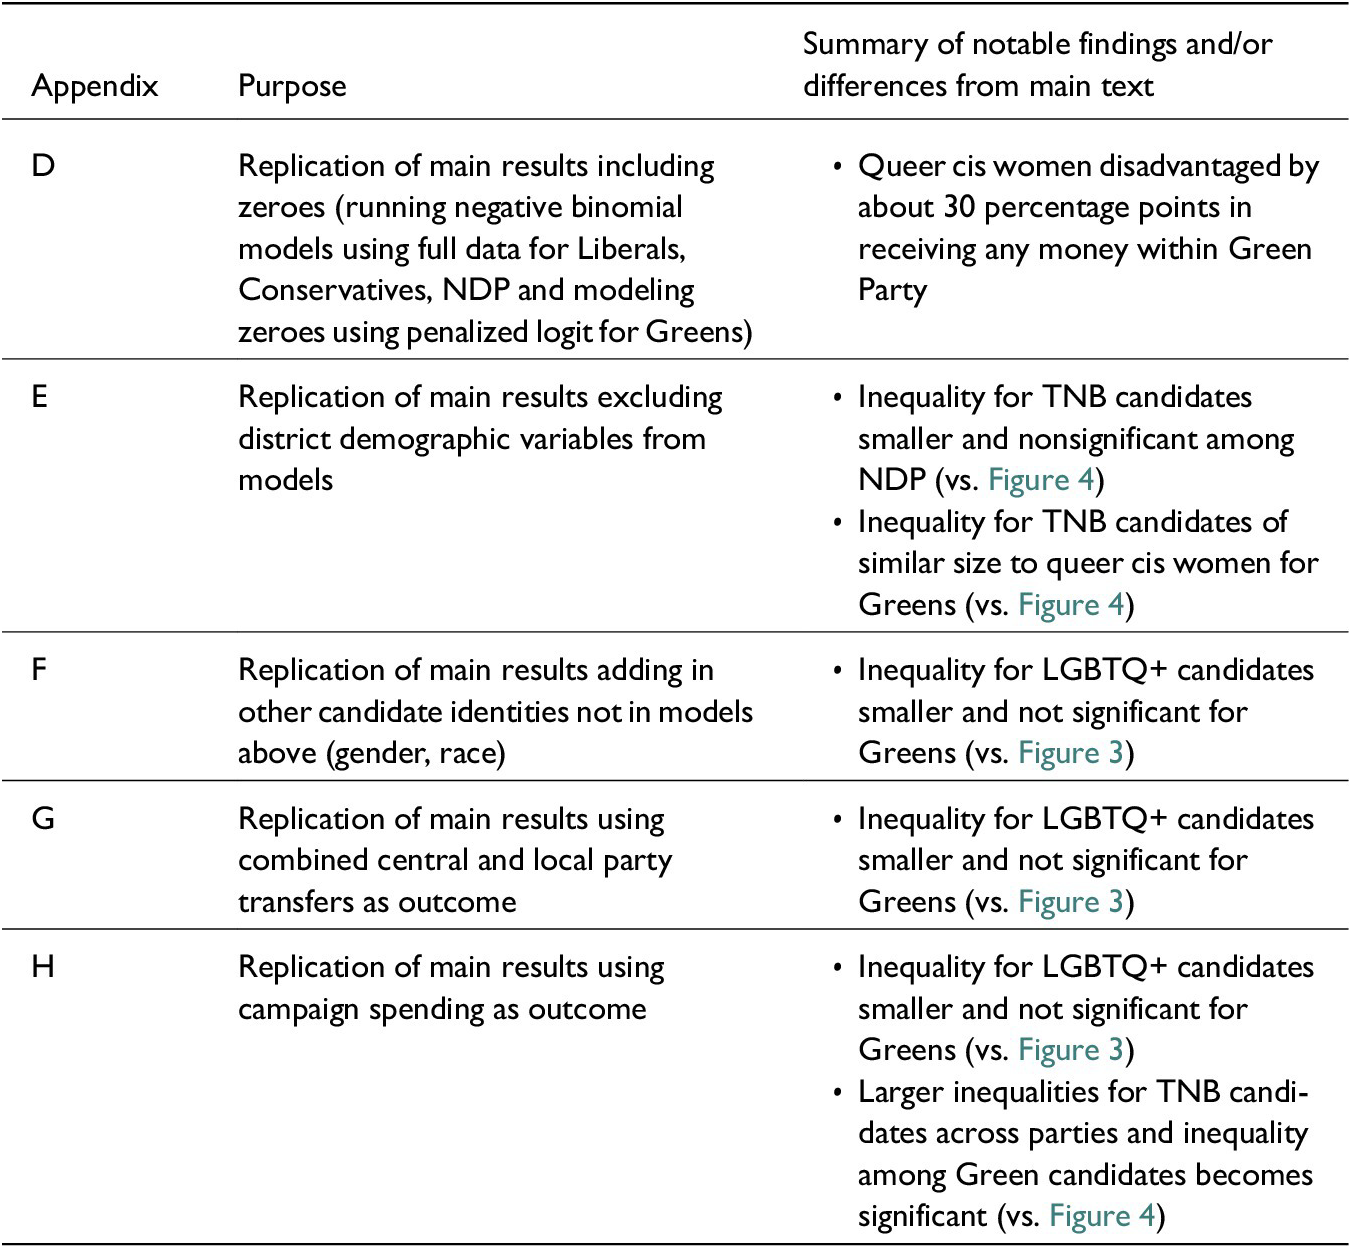
In the Online Appendices, we show several additional results testing whether our results hold when analyzing the data differently. We summarize any notable findings or differences from the main text in each appendix in Table 3. Broadly speaking, our results hold across several alternative approaches to analyzing the data. As Table 3 shows, our results tend to change the most when analyzing the Greens. Our results generally suggest some caution around making too much about the overall inequality for LGBTQ+ candidates in the Greens in Figure 3. When we add in other candidate identity controls or change the outcome variable, our estimates of the “penalty” facing LGBTQ+ candidates for that party become smaller and nonsignificant. However, we also find consistent evidence of disadvantage for queer cis women in the Greens. Some of our models also show significant and substantively meaningful inequalities for TNB candidates in the Greens, which is unlike our results in Figure 4 but more in line with our expectations.
Table 3. Additional results in online appendices
Discussion
Our analysis shows that there is an uncontrolled financing gap between straight cis and LGBTQ+ candidates. Without controls, straight cis candidates received more money than LGBTQ+ candidates. When we subdivide by gender and sexual identities, we find a more nuanced pattern. Straight cis men do the best, followed by queer cis men, straight cis women, queer cis women, and TNB people. In our bivariate analyses, Two Spirit candidates receive the most of any subgroup, though we urge caution around this result because Two Spirit candidates are few in number and include one particularly well-financed candidate (Blake Desjarlais, Canada’s first out Two Spirit MP).
Although many of these gaps are attributable to other variables on which LGBTQ+ candidates are disadvantaged, we find some notable results that persist despite our control variables. When we pool all LGBTQ+ candidates together, we find that LGBTQ+ candidates still receive less money in the Conservative and Green parties, but not in the Liberal and New Democratic parties. In fact, in the NDP, LGBTQ+ candidates receive more money than straight cis candidates once we adjust for other variables that may explain fundraising, which may be partly attributable to the party’s equity policies. When we subdivide, we find that the TNB candidates receive substantially less money than all other gender and sexual minority subgroups in the NDP and in pooled models across parties. We also find that queer cis women receive less money even after adjusting for other variables in the Green Party. Many of these findings are particularly striking in their magnitudes given the small numbers of candidates in these groups, such as LGBTQ+ Conservatives or TNB candidates.
Our results show broadly similar results when we use alternative sets of control variables or use party transfers or campaign spending as the outcome variables. However, our findings of an overall LGBTQ+ candidate “penalty” (negative AME) in the Greens are the most fragile. The alternative outcome variables provide additional context for our findings. Our party transfer results suggest that these financing gaps are largely attributable to decisions made by central and local party organizations. Our campaign spending results suggest that these inequalities in fundraising translate into campaign spending, which is known to affect election outcomes in Canada (Carty and Eagles Reference Carty and Eagles2005; Eagles Reference Eagles2004).
Conclusion
Our analysis makes three main contributions. First, for research on LGBTQ+ representation, it reveals that (1) some inequalities in political finance are attributable to known problems, particularly the tendency of parties to nominate LGBTQ+ candidates — especially queer cis women and TNB candidates — in less winnable districts, but (2) inequalities facing certain subgroups of LGBTQ+ candidates are not fully attributable to those known problems but also their identities. Second, we extend research on inequalities in political finance by examining the intersection between gender and sexuality. Our results particularly highlight the importance of studying gender beyond merely identifying gaps between men and women, since TNB candidates are a particularly disadvantaged group in terms of finance. Third, our results highlight the importance of studying party organizations for explaining inequalities in political finance, especially outside the United States.
Our theoretical expectations and results suggest some expectations for future comparative research on financial inequalities facing LGBTQ+ candidates. Although Canada has some notable differences from other countries in which parties nominate LGBTQ+ candidates and where they nominate them, we expect two of our results to be most likely to hold in other contexts. First, we expect LGBTQ+ candidates to be less well-financed when they run for right-of-center parties. After all, we might expect party gatekeepers or donors within right-of-center parties to (1) have socially conservative values, (2) worry that their voters may not vote for LGBTQ+ candidates, and/or (3) resist adopting policies to address inequalities facing LGBTQ+ candidates. Second, we expect TNB candidates to be especially likely to be disadvantaged in other contexts. After all, when researchers have searched for voter biases against TNB candidates, they have found them (Haider-Markel et al. Reference Haider-Markel, Miller, Flores, Lewis, Tadlock and Taylor2017; Jones and Brewer Reference Jones and Brewer2019; Jones et al. Reference Jones, Brewer, Young, Lambe and Hoffman2018; Magni and Reynolds Reference Magni and Reynolds2021). As a result, party gatekeepers and donors may engage in strategic discrimination against TNB candidates — nominating them tokenistically but not setting them up to win their districts.
Our results have implications for advocates for LGBTQ+ representation. Addressing other inequalities facing LGBTQ+ candidates, such as the tendency for parties to nominate them in less winnable districts, will help close the financing gap for most LGBTQ+ candidates. However, our results suggest that addressing other inequalities may not be enough to correct for the inequalities facing TNB candidates. It may be necessary to push parties to take special measures to remedy the inequalities TNB candidates face. For example, advocates may wish to highlight these inequalities publicly and push parties to establish designated funds for TNB candidates to ensure that they have the resources they need to run effective local campaigns.
Supplementary material
The supplementary material for this article can be found at http://doi.org/10.1017/S1743923X25100093.
Acknowledgments
We thank Randy Besco, Scott Matthews, Daniel Westlake, participants at the 2023 Canadian Political Science Association annual meeting, and the editor and anonymous reviewers for their comments on a previous draft. We thank Dave Armstrong, Jack Lucas, and Zach Taylor for sharing their urbanity data with us. We thank Janica Arevalo, Harry Blackwell, Kaitie Jourdeuil, Sarah Malik, and Maddy Ritter for research assistance on the candidate data. Quinn M. Albaugh and Elizabeth Baisley received financial support for this project from Queen’s University, and Elizabeth Baisley received financial support from the Mamdouha S. Bobst Center for Peace and Justice


 Open access