


Introduction
Given the culminating evidence that the surface temperature of our planet is warming at an alarming rate and that the signals of an ecological and climate crisis intensify, there has now emerged a deep understanding that steep decarbonization is necessary across the global economy. Based on the broad agreement back in Paris 2015 to “pursue efforts to limit the temperature increase to 1.5°C above pre-industrial levels,” and following the lead by the European Union’s (EU) Green New Deal ventures (announced in December 2019) to be the first continent to achieve net-zero emissions by 2050, many countries have declared their decarbonization pathways towards net-zero emissions along with the concomitant policy instruments.
Turkey ratified the Paris Agreement as late as October 2021 and declared 2053 as the target year to achieve net-zero emissions. Since then, following closely and responding to the profound developments brought about by the EU Green New Deal, Turkey’s Green Deal Action Plan was published in July 2021, and the First Climate Council to bring together the stakeholders was held in February 2022. The discussions and resulting roadmap of the Council have since served as the foundation for Turkey’s medium- to long-term climate change policy documents. Turkey announced her updated nationally determined contribution (NDC) to the Paris Agreement during the 27th Conference of Parties (COP 27) in November 2022, pledging to achieve a 41 percent reduction (from a baseline) in greenhouse gas (GHG) emissions by 2030. The 12th Development Plan for the 2024–2028 period has notably, for the first time, addressed the “Green Transition” and the country’s associated priorities, including reducing GHG emissions, enhancing climate adaptation capacity, promoting competitiveness in green and digital transformation, and ensuring an efficient and just transition. Turkey’s Climate Change Mitigation Strategy and Action Plan (CCMSAP; Directorate of Climate Change 2024b) and the Long-Term Climate Change Strategy (Directorate of Climate Change 2024a) are the most recent and most relevant policy documents outlining the country’s key strategies and planned actions for addressing climate change. These documents set medium- and long-term benchmark years of 2030 and 2053, serving as critical frameworks for structuring Turkey’s climate change policy. To further set the legislative foundations of Turkey’s climate policy framework, a draft of Climate Law along with a draft of Carbon Market Regulation have been put into circulation for open public discussions in 2023.
The documents and drafts cited above illustrate that Turkey’s decarbonization efforts are expected to span a range of strategies and policy decisions over a set of critical sectors including energy (power) supply, transportation, industry, agriculture, buildings, and households. Moreover, the thematic areas of “just transition” and “carbon pricing mechanisms” have been established as cross-cutting elements within this sectoral transition framework. Notably, emphasis is placed on the central role of developing an emissions trading system (ETS) to meet national climate targets, investigating alternative carbon pricing approaches, and advancing toward a low-carbon economy, all while adhering to the principle of a just transition.
The selection of a “just transition” and “carbon pricing mechanisms” as cross-cutting thematic areas, along with the strategies outlined in connection with these themes as well as the main mitigation sectors, aligns strongly with Turkey’s long-standing stance emphasizing its developmental needs, special circumstances, and national priorities in contributing to the global effort for climate change. In fact, the official policy documents cited above continue to underscore Turkey’s approach as a developing country, trying to balance its socio-economic objectives and the challenges it faces in transitioning to a low-carbon economy. This approach is clearly articulated in the Law on Ratification of the Paris Agreement of October 7, 2021, which states:
The Republic of Turkey declares that Turkey will implement the Paris Agreement as a developing country and in the scope of her nationally determined contribution statements, provided that the Agreement and its mechanisms do not prejudice her right to economic and social development.
Hence, a key emphasis of Turkey’s national climate change policy is that the climate response cannot be considered separately from its economic and social components.Footnote 1 Accordingly, it has been also openly stated in the CCMSAP (Directorate of Climate Change 2024b) that Turkey, as a developing country, acknowledges the need to adopt a “holistic approach” in addressing the differentiated socio-economic impacts of climate change mitigation and adaptation strategies (particularly with regard to employment, energy poverty, and gender and age dimensions). This approach needs to facilitate the low-carbon transition while ensuring that it does not create additional barriers to the country’s right to economic development (Directorate of Climate Change 2024b, 137).
Also prioritized as a cross-cutting thematic area, and vividly debated in the Climate Law framework, is the effective pricing of carbon through an ETS to serve as the core policy instrument towards decarbonization. It is evident that the design and implementation of the carbon pricing policies, in relationship with the possible innovations on a newly bourgeoning emissions trading market, will have significant implications for both the commodity and the financial markets of the Turkish economy. Needless to assert, the implementation of such a broad environmental policy framework will not only have considerable micro-economic effects on the energy-supply-demand and production structures of the economy but will also generate far-reaching socio-economic impacts to be distilled along macroeconomic conditions of aggregate demand.
Yet, these relatively overdue developments on the policy front still mention plans to conduct studies to ensure a comprehensive understanding and design of climate policies in general, and ETS in particular, without further deepening the existing socio-economic inequalities. However, these documents rather fall short of providing concrete quantification or detailed studies of such policies, leaving key aspects of their implementation and impact largely underexplored. Then again, there have been considerable discussions and efforts to appraise the net-zero target as a comprehensive framework, and much evaluation of alternative pathways that encompass transformation in energy systems, technology and industry upgrading, and broadening of the employment base through green jobs.Footnote 2
Therefore, it is rather novel beyond this point that any academic and policy-relevant advance that focuses on the design, implementation, and implications of environmental policies along with their instruments to stimulate the required decarbonization outcomes becomes crucial. It is particularly important to be able to evaluate the effects of such policies on welfare and distribution patterns in Turkey, since, for any transition the key to acceleration is to be able to assess the likely societal impacts.
Such impacts are especially relevant in the Turkish context, which, as a developing economy, has been experiencing multidimensional societal and economic inequalities. Yet, the social consequences of decarbonization policies will also be determined by the heterogeneous income and consumption expenditure patterns of households. In fact, as is the case at the international level, quantifying the inequalities in terms of contributions to the problem as well as exposure to the impacts is the key to facilitate effective climate policy at the national level (Chancel et al. Reference Chancel, Bothe and Voituriez2023).
These observations attest that climate action towards decarbonization involves a strategic policy framework beyond a dedicated pursuit of a technologically sterile plan, encompassing a wide spectrum of policy commitments to address the social responses on all forms of inequality – gender, ethnicity, and geography. Thus, the successful implementation of an indigenous environmental policy will ultimately depend upon the socio-economic factors of income distribution strata, indicators of consumption demand, and the ability and responsiveness of the individual households to react to price signals. Given this premise, it is the purpose of this paper to study the carbon footprint of Turkish households and investigate the patterns of household-level consumption inequality incidences on GHG emissions in Turkey. Our contention is that such a concrete portrayal of the differentiated carbon incidence of the household income strata will carry valuable information on the viability and the design of effective mitigation policies to combat climate change.
To this end, we utilize two distinct data sources: household consumption and size distribution data from the Turkish Statistical Institute’s (TURKSTAT) Turkish household budget survey (HBS) (TURKSTAT 2019) together with the product-level emissions data of EXIOBASE3 to consistently compile a harmonized dataset with income and expenditure patterns of Turkish households as well as emissions. Such a compilation will allow us to compute and analyze the distribution of carbon emissions, both directly through energy usage of households for heating/cooking and transportation purposes and indirectly, through the spill-over effects of carbon intensities of the consumption categories of households. Overall, our findings indicate that Turkish households produce 245 million tons of CO2-equivalent (eqv) in indirect emissions and approximately 48 million tons of CO2 in direct emissions, with the top 10 percent of households responsible for 19.4 percent and the bottom 10 percent contributing with a share of 4.3 percent of these emissions. Moreover, there is significant heterogeneity in emissions of differently affluent households across different expenditure categories, emphasizing the diverse impact of climate policies across the income distribution.
We confer that a call for action against climate change cannot be reduced solely to a sanctimonious search of the net-zero emission technology pathways, but necessitates a wider understanding of the social structure upon which those technologies and policy responses would rest. It is thereby our contention that the effective design of a socially responsible program in combatting climate change is only possible from a distributional perspective where existing inequalities in income and various social spheres have a direct impact on the households’ willingness and ability to contribute to this struggle. For the (marginal) cost of the same level of decarbonization is likely to be lower for high-income groups – high emitters compared to households of the lower income strata. To our reading of the literature, this is the first study to harmonize and investigate the household carbon footprints of Turkish households given their patterns of income distribution and consumer demand.
The rest of the paper is organized as follows: in the next section, we provide a brief overview of recent debates on households’ carbon footprints in an income-driven framework. We then introduce the specifics of our methodology and the data sources. Following this we conduct and report our results on the patterns of household consumption and emissions inequality. The final section concludes and summarizes.
Synopsis of the related literature
Households clearly play pivotal roles within social and economic institutions, and have a significant impact on the environment. Environmental impacts of households have been the focus of analytical investigation since the mid-1970s (see, e.g. for seminal studies, Herendeen Reference Herendeen1978; Herendeen and Tanaka Reference Herendeen and Tanaka1976). Given that a household’s final consumption is roughly responsible for 60 percent of global GHG emissions and 50–60 percent of global resource use (Ivanova et al. Reference Ivanova, Stadler, Steen-Olsen, Wood, Vita, Tukker and Hertwich2016), it is not surprising that many studies focus on the carbon footprint of households and emission dynamism related to the consumption-based accounting of emissions.
On the other hand, the current discussions on the design of climate change policies have now established that the success of climate policies in general, and carbon pricing schemes in particular, also heavily depends on understanding and addressing the socio-economic context. Broadly stated, this includes designing concomitant policies to address the issues of fairness, equitable design, and enhancing the adaptive capacity of the most affected and vulnerable groups (Baranzini et al. Reference Baranzini, van den Bergh, Carattini, Howarth, Padilla and Roca2017; Chancel et al. Reference Chancel, Bothe and Voituriez2023). Better use of distributional data is essential to be able to effectively integrate concerns about inequality with mitigation and adaptation policies. Furthermore, understanding the relationship between socio-economic inequalities and household carbon footprints is crucial, as addressing these differences is critical for developing socially acceptable and effective carbon pricing mechanisms.
One important and well-addressed issue in the literature in this context is the complex relationship between household income levels and their carbon footprints. Prior studies indicate that income is directly related to household consumption, triggering up the household footprint. Thus, inequality in income distribution provokes carbon emission inequality at the same time. For instance, Oxfam (2020) reported that the richest 10 percent of the world’s population is responsible for more than 50 percent of global emissions, while the poorest 50 percent of the world population contributed only 7 percent of global emissions. Likewise, the top 10 percent of the emitters at the global level are reported to be responsible for almost half of the global GHG emissions (Bruckner et al. Reference Bruckner, Hubacek, Shan, Zhong and Feng2022; Chancel and Piketty Reference Chancel and Piketty2015; Chancel et al. Reference Chancel, Bothe and Voituriez2023).
Studies at the national level further have shown that income-related household footprint inequality is observed not only across, but also within, the respective countries.Footnote 3 López et al. (Reference López, Arce and Serrano2020), for instance, compared the household carbon footprint in Spain and found that higher-income households import more carbon-intensive products compared to lower-income households. Fremstad and Paul (Reference Fremstad and Paul2019) showed that the richest households in the United States pollute the environment 5.5 times more than the poorest ones. Studies for the United Kingdom (Büchs and Schnepf Reference Büchs and Schnepf2013), Greece (Papathanasopoulou Reference Papathanasopoulou2010), Norway (Isaksen and Narbel Reference Isaksen and Narbel2017), Denmark (Sommer and Kratena Reference Sommer and Kratena2017), China (Wiedenhofer et al. Reference Wiedenhofer, Guan, Liu, Meng, Zhang and Wei2017), and the EU (Ottelin et al. Reference Ottelin, Heinonen, Nässén and Junnila2019) confirmed positive relationships between income inequality and inequality across household carbon footprints.
The methodology that had extensively been employed in these studies typically brings together data from household-level income and expenditure surveys to identify heterogeneity in consumption patterns with data from national input–output tables to determine production structures, energy demand of the associated sectors (consumption categories), along with environmental indicators data. However, recent developments in compiling multi-regional input–output databases comprising a large number of sectors/products have made it possible to perform a more detailed and comparative investigation of carbon footprints at the household level.
EXIOBASE is one such project that provides detailed environmentally extended multi-regional input–output tables that provide product-level data and represent different production technologies for different countries. Therefore, the database allows for comprehensive analyses of indirect emissions, which, coupled with national consumption surveys, enable the estimation of carbon footprints at the household level. Following this route, Christis et al. (Reference Christis, Breemersch, Vercalsteren and Dils2019) studied the case of Flanders (Belgium) and reported a positive relationship between household income and household-level carbon footprints. This study also found that consumption categories contribute unevenly to household emissions strata. Using the EXIOBASE dataset together with the consumer expenditure survey of 2013, Hardadi et al. (Reference Hardadi, Buchholz and Pauliuk2021) showed the case of Germany that, while the lowest-income group has the lowest share in the environmental footprint (both carbon and material) over the transportation sector, the group has the highest share in the environmental footprint of electricity and utilities. The highest-income group, on the other hand, is responsible for higher shares in environmental footprints triggered by imported resource use. Following a similar methodology, Jacksohn et al. (Reference Jacksohn, Reaños, Pothen and Rehdanz2023) assessed the GHG footprints of households in Germany over a twenty-year span. They found that heating, transportation, and food categories consistently constituted most of the mean GHG emissions footprint throughout all years. Theine et al. (Reference Theine, Humer, Moser and Schnetzer2022) reported that the top income decile had produced three times more carbon emissions compared to the bottom decile in Austria. Mi et al. (Reference Mi, Zheng, Meng, Ou, Hubacek, Liu and Wei2020) examined twelve different income groups in thirty regions of China and found that the top 5 percent of income earners contribute to 17 percent of the total household carbon footprint, while the bottom 50 percent are responsible for 25 percent. For the EU, Ivanova and Wood (Reference Ivanova and Wood2020) calculated that the carbon footprint of the top 1 percent of income earners reaches 55 tons of CO2-eqv per person, ten-fold the global average level. In their study, Duarte et al. (Reference Duarte, Miranda-Buetas and Sarasa2021) also confirmed the heterogeneity among countries and income groups in the case of the EU, concluding that this leads to emission inequality both within and across countries.
Advancements in methodology certainly enable detailed assessments of household emissions, which serve as essential inputs for designing and evaluating alternative climate change policies. In particular, these tools allow for the evaluation of the distributional impacts of carbon pricing policies and facilitate, at the same time, ex ante assessment of potential complementary policies that aim to address any regressive effects of carbon pricing (Köppl and Schratzenstaller Reference Köppl and Schratzenstaller2023; Ohlendorf et al. Reference Ohlendorf, Jakob, Minx, Schröder and Steckel2021; Wang et al. Reference Wang, Hubacek, Feng, Wei and Liang2016).
Specifically, the recent literature on the distributional impacts and the related political aspects of carbon pricing policies highlights the need to understand the direct (through income and consumption patterns, consumption prices) and indirect (through factor prices) heterogeneous impacts of carbon pricing. It also highlights the need to consider the subsequent policy implications to address these disparities (Goulder et al. Reference Goulder, Hafstead, Kim and Long2019; Metcalf Reference Metcalf2021; Rausch et al. Reference Rausch, Metcalf and Reilly2011). Given that carbon pricing policies often lead to undesirable distributional outcomes, corrective measures are deemed necessary. These measures include compensating low-income, energy-poor, and vulnerable households through mechanisms such as revenue recycling – via tax reductions or lump-sum distributions, targeted cash transfers, investment in public goods, and the transformation of tax regimes to incorporate (gradually) various forms of environmental taxes (Baranzini et al. Reference Baranzini, Goldemberg and Speck2000; Barrez Reference Barrez2024; Bowen Reference Bowen2015; Flues and Thomas Reference Flues and Thomas2015). A critical finding in the literature on the acceptability of climate policies, particularly carbon taxes, is that people tend to prefer policy designs that specifically protect low-income households (Baranzini and Carattini Reference Baranzini and Carattini2017; Brännlund and Persson Reference Brännlund and Persson2012; Gevrek and Uyduranoglu Reference Gevrek and Uyduranoglu2015).
One has to emphasize that these discussions have profound implications for the design of carbon policies. As public acceptance is determined to be one of the key determinants of political feasibility and implementability, the success of such policies hinges on their ability to address, especially, income-related inequalities.Footnote 4
Methodology and data
The carbon footprint of an economy can be calculated using either production-based or consumption-based emissions data. Under the production-based emissions accounting procedure, the focus is on the emissions that are generated while the production activity takes place within the country. On the other hand, consumption-based emissions accounting is linked to the consumption of final goods and services by entities (firms, households, government), irrespective of where these emissions occur along the supply chain. Our focus in this paper is emissions due to (final) consumption demand of Turkish households, where we assess consumption-based emissions of households in Turkey, both direct – due to combustion of fossil fuels by households – and indirect – due to emissions generated during the production of the goods and services to meet the household consumption demands. Thus, households’ total carbon footprint is to be decomposed into its direct (d) and indirect (i) components.
Direct emissions, CO 2 emiss d , result from households’ demand for energy usage in fossil fuels – coal, gas, and petroleum. More specifically, energy demand for residential heating/cooking and private transport purposes are the two main categories that we consider in our calculations of direct emissions. On the other hand, household demand for non-energy products such as food, clothing, and services does not directly produce emissions. Yet, such demand for final products triggers emissions during their production processes. These emissions are defined as indirect or embodied emissions, CO 2 emiss i , as they are ultimately related to household consumption.
The distribution of direct and indirect emissions to households is based on TURKSTAT’s (2019) HBS. HBSs contain expenditures of households in Turkey across 282 five-digit COICOPFootnote 5 expenditure categories. Besides consumption expenditures, the HBS also encompasses various other socio-economic characteristics of households (e.g. gender, education, dwelling type, etc.) and annual disposable income, which we use to assign income deciles. The sample size in 2019 is 11,521.
The HBS provides data on households’ energy expenditures in different fuel categories as well as data on the most frequently used type of fuel for heating/cooking in a dwelling. Therefore, one can derive the direct emissions of each household in the sample by utilizing its energy expenditure in COICOP energy categories under (i) COICOP 4: housing, water, electricity, gas and other fuels, and (ii) COICOP 7: transport. To account for these emissions, we first convert each household’s energy expenditure into units of energy by using energy prices for each source in 2019. The obtained units of energy in m3 for natural gas, tons for coal, wood, and fuel oil, and liters for diesel, petroleum, and other fuels in private transport vehicles are multiplied by the energy-source-specific conversion factor and converted into million tons of CO2. We employ emissions factors provided by TURKSTAT’s National Inventory Report to the United Nations Framework Convention on Climate Change (UNFCCC; United Nations 2022) and the fuel price data are also provided by TURKSTAT.Footnote 6
In calculating and analyzing indirect emissions, CO 2 emiss i at the household level, we combine the Turkish 2019 HBS (TURKSTAT 2019), which provides expenditure patterns at the household level, with the EXIOBASE3 (version 3.8.2), which provides the emission intensities for 200 EXIOBASE product groups. The intensity coefficient for each product category here represents the kg CO2-eqv emissions per 1 Turkish lira (TL) paid.Footnote 7 Hence, it becomes possible to extract, for each monetary unit the household spends for each product, the level of CO2 emitted during the production process of this product. Definitions of EXIOBASE3 expenditure categories differ from COICOP expenditure categories of the HBS. To resolve this problem, Ivanova and Wood (Reference Ivanova and Wood2020) suggest aggregating HBS expenditures into sixty-three COICOP categories (a combination of two-, three-, and four-digit categories) and constructing a concordance table (for Europe) in order to convert HBS categories into 200 EXIOBASE products for which the emission coefficients exist. We utilize this concordance table provided by Ivanova and Wood (Reference Ivanova and Wood2020) as well but make several modifications to ensure that this conversion remains consistent with the expenditure patterns of households in Turkey. As a result of those modifications, we employ sixty-seven COICOP categories that add up to total expenditures for the purposes of conversion of HBS expenditures into EXIOBASE products.Footnote 8
The possibility of systematic under-/over-reporting in the survey expenditure data, which may lead to biased emissions figures, is well acknowledged. To circumvent the problem, we scale the household expenditures derived from the aforementioned conversion such that household expenditures on 200 EXIOBASE products are consistent with the aggregates in the national accounts (reported in EXIOBASE3). Finally, expenditures in the HBS are in purchaser prices, i.e. they include the taxes paid on a product as well as the margins that are attributed to transportation and trade. Utilizing the tax, transport, and trade margin data from EXIOBASE3 for each of the 200 EXIOBASE products, we convert the household expenditures into basic prices.Footnote 9
It is worth acknowledging the limitations of the data and methodology used in this study here. As with all household expenditure surveys, there is an inherent risk of under-reporting, especially in categories such as irregular expenditures or less formal economic activities (e.g. alcohol, tobacco, and small, non-regular purchases) (Steen-Olsen et al. Reference Steen-Olsen, Wood and Hertwich2016). Thus, the sum of expenditures coming from household expenditures usually is lower than the national macroeconomic statistics. On the other hand, expenditures on food and non-alcoholic beverages, housing, water, electricity, gas, and other fuels are generally over-reported by households, which can create discrepancies with national statistics (Isaksen and Narbel Reference Isaksen and Narbel2017). Being aware of these instances, we have to rely on the expected evening-out tendencies due to the law of large numbers and the consistency checks provided by the official survey techniques, and interpret our results more as guidelines over trends rather than numerical projections.
Our methodology also carries certain limitations. Our study uses a mechanical approach matching direct and indirect emissions with household expenditure data by converting emission intensities into specific categories. This approach relies on multiplying household expenditures (in TL) by fixed emission intensities (tonnes CO2-eqv/TL). It assumes that all products within each expenditure group have homogeneous emission intensities. This assumption ignores the “quality effect” of alternative products regarding environmental sustainability, assuming that all households face the same quality and price levels for goods and services (Pottier et al. Reference Pottier, Combet, Cayla, de Lauretis and Nadaud2021).
Investigating for household consumption patterns and emissions inequality in Turkey
Preliminary analysis of household-level consumption and income strata
Table 1 provides a birds-eye view of the household consumption expenditures and annual disposable income for Turkey. In order to enable ease of comparison, Table 1 narrates expenditures of households in quintile income strata as percentage deviations from the respective averages for each commodity basket.Footnote 10
Table 1. Expenditure and income patterns of households, 2019

Source: Authors’ calculations from household budget survey data (TURKSTAT 2019).
TURKSTAT (2019) data reveal that as of 2019, the average annual household expenditure stands at 59,667 TL. The richest 20 percent of the households exhibit an annual average spending 1.82 fold of this figure, while the bottom 20 percent expend only half of this mean average. Gender differences are also pronounced. Male-headed households have an average income that is 4.4 percent higher than the national average, whereas female-headed households have an average income that is 13.2 percent lower.
As expected, education level carries a significant premium. Drop-outs from the high school level of education earn, on average, 17 percent less income. Tertiary education and above have a significant role, with an income premium of 44 percent. Among the households that have tertiary education and above, significant differences in expenditure patterns across individual commodity groupings are observed, especially with respect to consumption of transportation and education services.
Across the commodity baskets, the highest 20 percent of income earners are observed to spend on education 2.22-fold over the nationwide average. The poorest 20 percent, on the other hand, spend 84 percent less than the nationwide average expenditure on education. This difference in expenditure patterns surely plays a critical role in consolidating the income gap observed across Turkish households.
Expenditure differences are also significant over transport services as well as ownership of dwellings. The mode of transportation and housing services will have a key role in contributing to the emissions score of the household as it will have a direct impact on the usage of fossil fuel-based energy sources.
Finally, both the household size and age composition do matter in the observed formation of income strata. All household sizes with more than single-person units have a premium in average income, with large households accommodating more than five occupants displaying the largest gap. Regarding age group, those belonging to the “working” age display higher expenditures in all commodity sets, with the highest margin belonging to education services.
Direct emissions
Components of energy demand across dwellings by deciles are documented in Figure 1. Figure 1, left panel, illustrates the fuel type that has the most common use within the household for each income decile, while Figure 1, right panel, shows the average annual household expenditure in 2019 TL by the private households over the corresponding fuel types in the dwelling.

Figure 1. Left: Energy demand in dwellings (%). Right: Annual expenditure by fuel type (2019 TL).
Source: Authors’ own calculations from household budget survey data (TURKSTAT 2019) and EXIOBASE3 data
As Figure 1, left panel, indicates, there are considerable differences among the income deciles on the most commonly used fuel type in the dwelling, as well as the absolute expenditures on fuels. The households of low income deciles are observed to rely more on coal and wood (including shavings, sawdust, wood chips, turd, etc.) for heating purposes. In the lowest decile, almost 68.0 percent of the households record coal and wood as the most commonly used fuel type in the dwelling. The higher-income groups, in contrast, are observed to rely dominantly on natural gas. In the highest-income group, the share of households that specifies either coal or wood drops down to around 11.2 percent. In this group, 80 percent of the households utilize natural gas for heating/cooking purposes.
However, as Figure 1, right panel, illustrates, the average annual expenditures for each fuel type also show considerable variation, higher-income groups allocating higher levels (in absolute terms) to each fuel type (for those households that use the corresponding fuel type in the dwelling). The lowest variation is in electricity, a commodity with a low residential elasticity of demand. The highest variations in expenditure, on the other hand, are observed for the coal and wood products. Here, for the households that record positive use of these fuels, the highest income decile on average spends around 2.4 times higher on annual consumption of coal/wood. In general, the average annual expenditure for energy for heating/cooking purposes of the lowest income decile is around 1,815.9 TL in 2019 as opposed to 4,105.6 TL of the highest income decile, implying a ratio of 2.3. In fact, the average share of energy costs to household annual income in the lowest decile is recorded to be 10.8 percent, indicating the many households in this group may actually be categorized as suffering from fuel poverty. The national average of annual energy costs to annual income is 5.7 percent, while data reveal that for the highest decile it is only 2.5 percent.
Such significant heterogeneity demonstrates itself in the corresponding direct emissions of CO2 of households. Figure 2, left panel, shows the share of direct CO2 emissions of the corresponding fossil fuel type across household groups. In line with Figure 1, left panel, overall CO2 emissions for heating/cooking purposes of the households in the lower-income groups are due to coal and wood products. For the lowest decile, almost 60 percent of the CO2 emissions from dwellings is due to the burning of these fossil fuel types. As household income increases, the share of CO2 emissions from natural gas also increases. The mean share of natural gas emissions is 57.8 percent for total households; the figure drops down to 28.3 percent for the lowest decile and increases to 77.4 percent for the highest decile. As absolute consumption levels for the lower deciles are also relatively modest compared to households of higher income deciles, the share of liquefied petroleum gas (LPG) for cooking purposes is also relatively higher. The households of upper-income groups rely more on natural gas for cooking purposes in their dwellings.

Figure 2. Dwellings: CO2 emissions from fossil fuel types across income groups. Left, in percentages; right, in million tons.
Source: Authors’ own calculations from household budget survey data (TURKSTAT 2019) and EXIOBASE3 data
Finally, to thoroughly grasp the reflection of such heterogeneities on emissions inequality, we portray in Figure 2, right panel, the total CO2 emissions in absolute terms (million tons of CO2) due to heating/cooking purposes within the dwelling. As the figure clearly indicates, due to a higher number of families using natural gas for heating and cooking, as well as higher consumption within these households, the upper-income categories contribute significantly more to emissions from natural gas compared to the lower-income groups. Overall, total emissions from natural gas measure around 13.5 million tons of CO2, and the highest quintile make up for 30 percent of this figure. The contribution of the lowest income decile to emissions from natural gas is around 2.3 percent. For the rest of the fossil fuels, the contribution of each group is more or less equal, both due to varying shares of households utilizing the corresponding fuel as well as the expenditures, hence material consumption in absolute terms. Overall, the contribution of the highest income decile to total emissions from heating/cooking of the dwellings is 7.0 times higher than the contribution of the lowest decile.
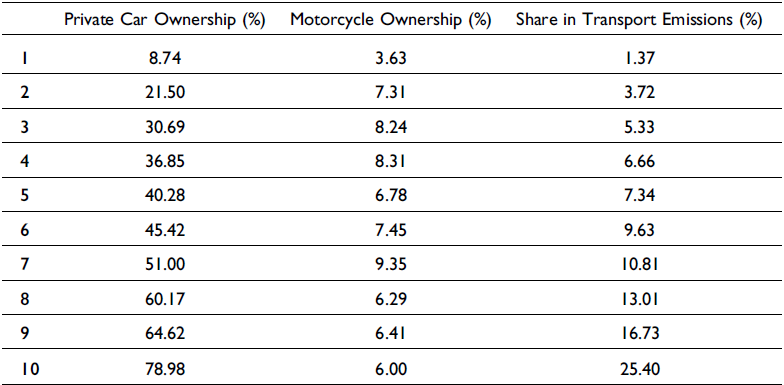
The other source of direct emissions by households we consider is CO2 emissions due to private transport demand. Here, we calculate direct emissions for each household that is responsible for expenditures on diesel, petroleum, and other fuels (mainly transportation LPG) associated with private transport demand in the form of fossil fuels (see Supplementary Material 1, Figure A1). Here, certainly, the private ownership of a vehicle (or utilization of a vehicle provided by an employer privately) and the associated mileage (as we observe in the expenditures for fuels) become the main determinant of the direct CO2 emissions from private transport activities. Table 2 summarizes the results for household CO2 emissions from fossil fuel demand for private transport.
Table 2. Vehicle ownership and emission shares (%)

Source: Authors’ own calculations from household budget survey data (TURKSTAT 2019) and EXIOBASE3 data.
Indirect emissions
In contrast to direct emissions, indirect emissions arise from the production activity as driven by the differentiated expenditure patterns of households. This analysis necessitates information on the intermediate technology in the production of each commodity or service. As households demand goods and services, they invigorate a series of intermediate demands to be inputted to produce the warranted consumption good in the domestic market. EXIOBASE makes use of the input–output datasets in calculating the extent of demand-induced production activities and thereby recovers kg CO2-eqv emissions coefficients per unit of value-added produced and marketed for each of the 200 EXIOBASE products.
This analysis necessitates a discussion of the expenditure allocations across the household income strata. In Figure 3 we disclose this information.

Figure 3. Annual household expenditure by category across income deciles. Left, in 2019 TL; right, in percentages.
Source: Authors’ own calculation based on household budget survey data (TURKSTAT 2019) and EXIOBASE3 data
Note: When calculating indirect emissions, expenditures in the household budget surveys are scaled with an appropriate factor to ensure consistency with the aggregates in the national accounts. This figure presents the scaled expenditure values. Furthermore, the expenditure values in this figure are in basic prices, i.e. taxes are excluded, and trade and transport margins are reallocated to appropriate categories.
Figure 3, left panel, illustrates the average annual expenditure of each disposable income decile by category. This figure suggests that the expenditures on categories that can be classified as essentials, i.e. food and dwellings, are relatively less responsive to income changes. Food expenditure of the top income decile is about 2.6 times and the dwellings expenditure is 3.4 times higher than that of the bottom decile. On the other hand, the top decile allocates approximately 8.6 times more on transport, and seventeen times more on other goods and services relative to the bottom decile. Note that there is a particularly significant increase in the expenditure on other goods and services for the top decile compared to the ninth decile.
Consistent with the observations in Figure 3, left panel, Figure 3, right panel, demonstrates that the share of food and dwellings expenditure in the total budget decreases as income increases. Conversely, richer deciles allocate a higher fraction of their budget on transport and on other goods and services.
Now to see what this structure presents in terms of indirect emission levels across the household strata by deciles, we turn our attention to Figure 4.

Figure 4. Annual household indirect emissions by category across income deciles. Left, in million tons; right, in percentages.
Source: Authors’ own calculations based on household budget survey data (TURKSTAT 2019) and EXIOBASE3 data
In Figure 4, left panel, we display our findings of the annual total amount of CO2-eqv (million tons) emitted by each income decile. The total amount of indirect emissions driven by households in Turkey in 2019 is reportedly 245 million tons. The lowest and highest income deciles contribute indirect emissions of 3.05 and 7.75 million tons through their demand for food products, respectively. At the same time, indirect emissions from dwellings stand at 7.1 and 18.7 million tons, respectively, for the bottom and top deciles. On the other hand, indirect emissions caused by the top decile via expenditures on other goods and services is a remarkable 10.4 million tons, approximately equal to the total emissions of the bottom decile via food and dwellings. Similarly, substantial heterogeneity in emissions via transport can be observed. Whereas the bottom decile emits 0.39 million tons via transport, the emissions of the top decile due to the same category are around 5.8 million tons.
Figure 4, right panel, presents, in turn, the share of each expenditure category within the total indirect emissions of income deciles. As evident from this figure, the essentials (i.e. food and dwellings) are the main drivers of the emissions in the bottom income decile. The sum of these two categories constitutes 87 percent of the bottom decile’s total emissions. The same figure stands at 57 percent for the top decile. A non-trivial fraction, 35 percent, of the total indirect emissions caused by the top decile is due to their expenditure on transportation and on other goods and services.
Figure 5 summarizes the share of each household disposable income decile in aggregate indirect emissions caused by expenditures by the household sector in Turkey. The top decile is responsible for 19 percent of the total 245 million tons CO2-eqv indirect emissions. This is roughly equivalent to the combined total of emissions of the lowest one-third income stratum, and depicts emissions of a factor three-fold in comparison to the lowest income decile.

Figure 5. Share of total household indirect emissions across income deciles.
Source: Authors’ own calculation based on household budget survey data (TURKSTAT 2019) and EXIOBASE3 data
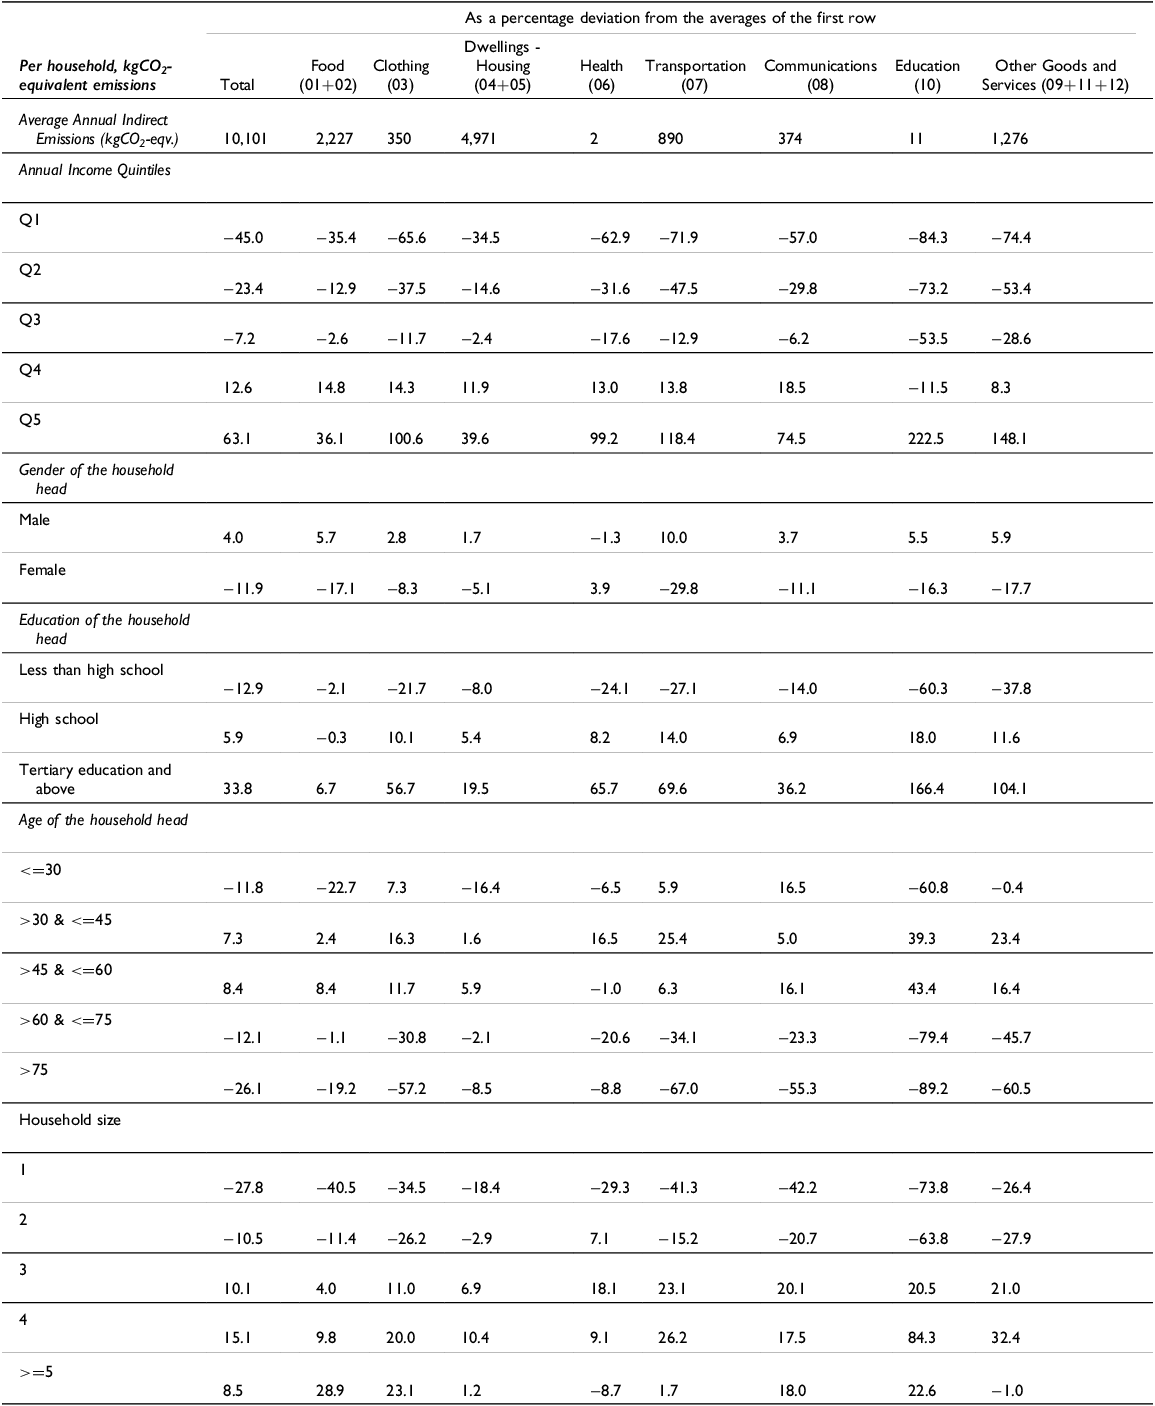
We bring all these in tabulation within Table 3, where we display the households’ differentiated responsibilities of indirect gaseous emissions across the commodity baskets identified in Table 1. As above, the Table documents indirect emissions as percentage deviations from the nationwide average.
Table 3. Indirect household emissions as a percentage deviation from the averages of the first row, 2019 (Classification of Individual Consumption by Purpose (COICOP) consistent classification)

Source: Authors’ own calculations based on household budget survey data (TURKSTAT 2019) and EXIOBASE3 data.
Our calculations in Table 3 reveal that in comparison to the annual average of 10.1 kg CO2-eqv of emissions indirectly released by Turkish households, the highest quintile discloses a responsibility of 63.1 percent in excess over the nationwide average. All three lower quintiles disclose lower averages in comparison to the nationwide mean average. Over the commodity baskets, the widest gap across household strata is disclosed in education services, followed by transport. Education, as to be recalled, is pinned down as the main contributor to household-level income differences and it is not surprising to observe its role in the diversity of indirect emissions. Transportation services and the mode of transport equipment consumed, likewise, carry substantial variation across household categories, with the richest 20 percent recording average emissions up to 7.7-fold in comparison to the lowest-income group.
Both the level of education and gender components play a significant role in differences of household (indirect) emission responsibilities. Following the income gap among the units with female versus male household heads, female-led households display an indirect emissions responsibility 11.9 percent less than the nationwide average. This difference reaches its maximum when the consumption of transportation services is considered.
As food and dwellings are determined as the main drivers of the emissions, specifically for the households at the bottom income deciles, we further provide in Table 4 a summary of our main findings by presenting aggregated direct and indirect emissions per household across different income quintiles and breaking down the total emissions into major components.
Table 4. Total emissions (direct + indirect) and their patterns

Notes: “Other” emissions of “food” include alcoholic and non-alcoholic beverages, and tobacco. “Services” include education, health, communications, and other services. “Shelter: energy and other fuels” and “mobility” emissions figures represent direct + indirect emissions. Quintiles are constructed based on household equivalized disposable income.
The four subcategories in Table 4 (food; shelter: energy and other fuels; mobility; and services) constitute approximately 78 percent of total emissions. While the differences in the emissions of food and shelter: energy and other fuels across income quintiles are significant, they are expected, given the differences in incomes. One noticeable observation from the Table is that under the food category, the major share of emissions is due to the other food category, including alcoholic and non-alcoholic beverages, and tobacco. While the differences in the plant-based food category indicate a 1.84-fold difference between the highest and lowest quintiles, the ratio increases to 2.64 for the animal-based food category. The emissions associated with the mobility and services categories are also striking. The richest income quintile emits on average about 3.25 times more carbon than the poorest quintile. When it comes to the categories of mobility and services, carbon emissions of the richest quintile are over eight times higher than those of the poorest quintile. Thus, it can be argued that economic prosperity drives carbon emissions particularly due to increased expenditures in these categories.
From this perspective, our findings align with the previous studies conducted in other countries, such as Austria (Theine et al. Reference Theine, Humer, Moser and Schnetzer2022), Belgium (Christis et al. Reference Christis, Breemersch, Vercalsteren and Dils2019), China (Mi et al. Reference Mi, Zheng, Meng, Ou, Hubacek, Liu and Wei2020), and Germany (Hardadi et al. Reference Hardadi, Buchholz and Pauliuk2021), which also have attributed a disproportionate share of emissions responsibility to the most affluent. Nevertheless, in level terms comparable emission estimations for Turkey indicate lower per capita emissions compared to EU economies in general.
Thought experiments can provide simple insights into the potential changes in overall emissions that may occur along the path of economic development. Overall direct and indirect per household emissions in Turkey can be calculated as the average of the first column, that is 12,077 kg CO2-eqv. According to TURKSTAT (2019), the average household size in Turkey in 2019 was 3.35, making per-capita emissions roughly 3.605 kg CO2-eqv. Thus, per-capita emissions in Turkey in 2019 were less than the per-capita emissions of all the EU economies in 2010 based on the EU carbon footprint estimates by Ivanova and Wood (Reference Ivanova and Wood2020).
If economic development leads to sufficient income growth so that all households, on average, adopt the lifestyle of the richest quintile, then overall emissions per household would reach 20,113 kg CO2-eqv, implying 6,004 kg CO2-eqv emissions per capita. This figure places Turkey in the lower to middle range of per-capita emissions among EU countries. If households in the first two quintiles adopt the lifestyle of the third quintile, it can be found using similar calculations that per-capita emissions would reach approximately 4,039 kg CO2-eqv, placing Turkey roughly on par with the EU’s lowest-emitting economy in 2010, Romania.
Finally, if all the quintiles spent as much as the third quintile and adopt their lifestyle, per-capita emissions would decrease from 3,605 kg CO2-eqv to 3,356 kg CO2-eqv. However, caution is needed when interpreting this result as an implication of income redistribution. Due to the right-skewed nature of income distribution, the amount of income that would need to be taken from the richest quintile to reduce their expenditures to the level of the third quintile is greater than the amount needed to increase the expenditures of the first quintile to the same level. The extra tax revenue would possibly translate into extra emissions via increased government expenditure. Another possibility is implementing a tax revenue-neutral income redistribution, though evidence on its implications for overall emissions remains ambiguous (see, e.g. Brännlund and Ghalwash Reference Brännlund and Ghalwash2008; Gürer and Weichenrieder Reference Gürer and Weichenrieder2024).
Concluding comments and directions for future research
This paper adds the case of Turkey to the existing literature on the nexus between income strata and household carbon footprint. The global literature highlights that within-country inequalities in carbon footprints often surpass inter-country disparities when explaining global carbon inequality (Chancel et al. Reference Chancel, Bothe and Voituriez2023). Building on this critical insight, our analyses in this paper emphasize that in order to facilitate effective climate policy discussions at the national level, it is of utmost importance to investigate the inequalities in terms of contributions to aggregate household emissions as well as the potential regressive effects of climate policies on income inequalities. In line with the discussion on the literature and based on the results presented in this paper, one can argue that such an approach is particularly relevant for the design of effective climate policies that are efficient, capable of meeting national climate goals, and fair.
Our analysis of the national HBS (TURKSTAT 2019) and the EXIOBASE3 emission intensities data documents significant variation across household income deciles in their responsibilities on both the direct (production based) and indirect (consumption-driven) emissions. Accordingly, our calculations reveal that the highest income decile emitted four times more indirect carbon emissions compared to the bottom income decile, contributing to 19 percent of total indirect emissions. For direct emissions, the top 10 percent of income earners are responsible for 21.3 percent of total emissions, whereas the lowest 10 percent of income earners account for 1.9 percent. Overall, the top decile in Turkey is responsible for 19.4 percent of the country’s production-based and consumption-driven emissions, including both direct and indirect emissions, whereas the lowest income decile’s responsibility is 4.3 percent.
In addition to income disparities, substantial heterogeneity within expenditure categories further emphasizes the need for targeted climate policies. In particular, the indirect emissions of the richest 10 percent via transportation expenditures is about fifteen times that of the poorest 10 percent. The top decile’s indirect emissions from expenditures on other goods and services (which can naively be considered non-essentials) amount to a remarkable 10.4 million tons. This is approximately equal to the total emissions of the bottom decile from food and dwellings. Strikingly, 87 percent of the indirect emissions budget of the poorest decile is attributed to food and dwellings expenditure. These findings highlight that lower-income households are particularly vulnerable to the carbon footprint impacts of climate policies, with their emissions concentrated in essential areas such as food and dwellings, possibly leaving them with fewer opportunities to adapt to higher carbon prices or policy shifts.
The main message of our analysis is that measuring and evaluating carbon footprints at the household level will be crucial in designing social/climate policies, especially in developing economies that face multi-faceted problems. This is especially important for the design of the celebrated NDCs. In pursuit of the net-zero emissions pathways under the NDCs, technological specificities of the designed policies will necessarily impose asymmetric effects across household groups of diverse income levels. It will thus prove pertinent to implement targeted policies focusing on the high-emitter groups without causing further wedges between the lower- and upper-income households.
To this cause, an important issue for concern, for instance, is the policy proposal towards cutting off coal subsidies in Turkey. Such a proposal may present a potential risk for exacerbating inequality if lower-income households are not adequately supported during the transition to cleaner energy sources. Our findings suggest that without favorable compensatory measures or alternatives, such a policy could negatively impact the welfare of lower-income groups, potentially undermining public support for essential climate policies.
Similarly, the cross-cutting theme in the most recent and relevant official policy documents of carbon pricing mechanisms, which are stated as the key mechanisms for reducing emissions, must be carefully designed to account for the diverse carbon intensities across household expenditure patterns. Implementing a uniform carbon price may be economically efficient in theory, but could result in adverse welfare outcomes if compensatory policies – such as targeted rebates, subsidies, or income support – are not in place to protect vulnerable households. Discussions laid out in the “Synopsis of the related literature” section of this paper emphasize that such policies may exacerbate inequalities unless accompanied by social protection measures (also see, e.g. Gonzalez Reference Gonzalez2012; Känzig Reference Känzig2023).
The findings of this study underscore the critical need to align decarbonization pathways with social equity considerations to achieve a just transition at the national level. The stark disparities in household carbon emissions highlight that one-size-fits-all approaches to decarbonization may exacerbate existing inequalities if not carefully designed. Policymakers should therefore prioritize interventions that address the disproportionate burden on low-income households, whose emissions are largely concentrated in essential consumption categories such as food and housing. This requires targeted support mechanisms, such as subsidies for energy-efficient appliances, investments in affordable renewable energy, and financial assistance for home retrofitting to reduce energy consumption. In this way, countries can not only meet their decarbonization goals but also ensure that the transition to a low-carbon economy is both equitable and inclusive.
Understanding these distributional dynamics is critical for addressing the socio-economic impacts of climate change and ensuring the public acceptability of climate policies, including carbon pricing policies. It will be essential to incorporate the implications of income and consumption inequality into policy design, especially in the context of developing economies that are expected to be challenged by various forms of socio-economic inequalities. Furthermore, policies related to climate finance, green energy investment, and the creation of green jobs will play an important role in driving consumption patterns toward low-carbon sectors. It will be important to ensure that these investments reach the most vulnerable to foster a just transition.
Overall, this study adds to the literature on documenting the heterogeneity in household carbon footprints in the context of a developing economy. Such an analysis is certainly a prerequisite to study the distributional impacts of alternative climate policies, particularly the implications of carbon pricing policies in developing countries. Future research and policy development should focus on incorporating the findings in this study and distributional considerations to ensure a fair and efficient transition to a low-carbon economy.
Finally, our study reflects a pre-COVID-19 context and, due to current data limitations, does not address the changes in the dynamics of income distribution and household emission inequality in the post-pandemic period. The pandemic has deepened existing inequalities in many economies, including Turkey, which may have had significant implications for household carbon footprints. For instance, in the post-pandemic period, the vulnerability of low-income households – already limited in their capacity to adapt to climate change – may have increased further. On the other hand, high-income households may have leveraged their financial advantages to maintain or expand their carbon-intensive consumption patterns, thereby perpetuating the asymmetry in emission responsibilities. Future research should examine the pandemic’s impact on income distribution and its relationship with household emissions while addressing these emerging challenges. Such an effort will be critical in ensuring that climate policies are designed to be effective and equitable in the post-pandemic era.
Supplementary material
To view supplementary material for this article, please visit https://doi.org/10.1017/npt.2025.14
Acknowledgments
Research support for this paper is provided by the Scientific and Technological Research Council of Türkiye (TÜBİTAK) under Project No 121K522. We are indebted to TurkStat for its generous supply of micro data on Household Budget Survey. Voyvoda further acknowledges research support from IPC Fellowship 2023/24. We are further indebted to Hasan Tekgüç, Ümit Şahin, and colleagues at the IPC Sabancı University and Kadir Has for their very helpful comments and suggestions on earlier versions of the paper. Author names are in alphabetical order and do not imply any seniority. All the usual caveats do apply.
Competing interests
The authors declare that there are no conflicts of interest.


 Open access