


Non-technical Summary
This study focuses on the evolution of sharks, rays, and chimaeras (collectively known as chondrichthyans) by looking at their jaw shapes over more than 400 million years. Using a theoretical approach, we analyzed the jaw structures of 122 living and 95 extinct species, creating a “theoretical morphospace” that maps out the possible jaw shapes included within the sampled animals and theoretically possible ones beyond it. The functionality for these shapes in terms of speed and strength were then tested and compared against the evolutionary tree of the sampled chondrichthyans. We found that early chondrichthyans had narrow, curved jaws, which evolved into more robust shapes over time, though not always in the most efficient way for feeding. Deep-water species showed the most variety in jaw shapes, while top predators stayed closer to the most efficient designs. This study highlights that chondrichthyans are not just “living fossils,” but have continuously adapted their jaw shapes to new ecological roles, like eating harder prey, rather than sticking to a generalist feeding strategy.
Introduction
Morphological change through time is an important feature of adaptive radiation; however, understanding these changes is difficult due to the complex interactions of function, phylogeny, and ecology on morphology (Seilacher Reference Seilacher, Schmidt-Kittler and Vogel1991; Cubo et al. Reference Cubo, Legendre, De Ricqlès, Montes, De Margerie, Castanet and Desdevises2008; Ferrón et al. Reference Ferrón, Martínez-Pérez and Botella2017; Rawson et al. Reference Rawson, Deakin, Stubbs, Smith, Rayfield and Donoghue2024). Jawed vertebrates underwent an extensive adaptive radiation during the early and middle Paleozoic, displacing their jawless relatives both in terms of diversity and ecology, to comprise the majority of living vertebrates (Donoghue and Keating Reference Donoghue and Keating2014). This radiation is predicated upon the eponymous key innovation of jaws. Deakin et al. (Reference Deakin, Anderson, den Boer, Smith, Hill, Rücklin, Donoghue and Rayfield2022) found that early jawed vertebrates discovered optimal morphologies that combined the functional requirements of speed and strength (bite force) early in their evolution before expanding their occupation of morphospace. This mirrors what was found by Anderson et al. (Reference Anderson, Friedman, Brazeau and Rayfield2011) for early gnathostomes using an array of functionally relevant mandible traits. Chondrichthyes comprise, with Osteichthyes, the crown clade of Gnathostomata, to which the extinct jawed placoderms comprise either a sister clade or a paraphyletic grade of successive sister lineages (Johanson Reference Johanson2003; Brazeau Reference Brazeau2009; King et al. Reference King, Qiao, Lee, Zhu and Long2017). Living chondrichthyans can be divided into three groups, the chimaeras, sharks, and rays, which cover a wide variety of morphologies and occupy a diverse array of aquatic habitats (Dean et al. Reference Dean, Wilga and Summers2005; Sorenson et al. Reference Sorenson, Santini and Alfaro2014; Ankhelyi et al. Reference Ankhelyi, Wainwright and Lauder2018; Hoffmann et al. Reference Hoffmann, Buser and Porter2020; Sternes and Shimada Reference Sternes and Shimada2020; Flowers et al. Reference Flowers, Heithaus and Papastamatiou2021; López-Romero et al. Reference López-Romero, Stumpf, Kamminga, Böhmer, Pradel, Brazeau and Kriwet2023; Dedman et al. Reference Dedman, Moxley, Papastamatiou, Braccini, Caselle, Chapman and Cinner2024; Gayford et al. Reference Gayford, Brazeau and Naylor2024). Further, they encompass an array of feeding morphotypes (Moss Reference Moss1977), primarily through modification of the same underlying cartilaginous elements of the mandibular arch: the Meckel’s cartilage in the lower jaw and the palatoquadrate in the upper jaw, in conjunction with changes to the arrangement of musculature, ligaments, and articulation with the wider cranial anatomy (Dean et al. Reference Dean, Wilga and Summers2005; Maisey Reference Maisey2008; Gayford et al. Reference Gayford, Brazeau and Naylor2024). However, this clade represents only a small fraction of chondrichthyan historical diversity and disparity (Kriwet et al. Reference Kriwet, Kiessling and Klug2008; Sorenson et al. Reference Sorenson, Santini and Alfaro2014; Stein et al. Reference Stein, Mull, Kuhn, Aschliman, Davidson, Joy, Smith, Dulvy and Mooers2018; Gayford and Jambura Reference Gayford and Jambura2025).
Recent analyses of extant shark mandibles by López-Romero et al. (Reference López-Romero, Stumpf, Kamminga, Böhmer, Pradel, Brazeau and Kriwet2023) found a strong correlation between mechanical advantage and the principal axis of variation in lower jaw morphology, which they speculated reflected a functional trade-off between jaw closure speed and bite force. They also identified increased morphological diversification in the deep-water and reef habitats, mirroring the trends found in teleost fish (Martinez et al. Reference Martinez, Friedman, Corn, Larouche, Price and Wainwright2021; López-Romero et al. Reference López-Romero, Stumpf, Kamminga, Böhmer, Pradel, Brazeau and Kriwet2023) and in the neurocranium across elasmobranchs (Gayford et al. Reference Gayford, Brazeau and Naylor2024). Similarly, recent examination of pectoral fin evolution indicates sharks only expanded into pelagic habitats in the Early Cretaceous, indicating a geologically recent shift in the ecological pressures on shark morphology (Sternes et al. Reference Sternes, Schmitz and Higham2024). Despite these valuable findings, understanding the true extent of adaptive evolution is limited by the assumption that morphologies are optimally adapted for specific functions or a trade-off between functions—a commonplace approach that makes little of confounding constraints such as those imposed by development, construction, and historical contingency (Gould and Lewontin Reference Gould and Lewontin1979; Lewontin Reference Lewontin2003).
To address morphological and adaptive evolution comprehensively, we have adopted a theoretical morphology approach to investigate the causal underpinnings of chondrichthyan mandibular evolution. Building upon a sample of empirical morphologies, this approach allows us to infer a broader range of theoretical morphologies through mathematical manipulation. We utilize these theoretical morphologies as the subjects of functional testing, using representative proxies for functional traits to create performance and optimality landscapes. Through modeling of an a priori phylomorphospace, we consider post hoc how chondrichthyan mandibular morphology navigated theoretical morphospace and the degree to which functional optima have influenced phenotypic evolution. We also consider the impact of ecology establishing the occupancy of the theoretical morphology by taxa characterized according to habitat and trophic level.
Methods
The theoretical morphology method we adopt is described in detail by Berks et al. (Reference Berks, Milla Carmona and Donoghue2025). It is a holistic approach that combines characterizing and collating empirical morphologies in order to create a grid of theoretical morphologies. Theoretical morphologies can then be tested for function and compared against one another within the theoretical morphospace. The empirical morphologies can then be overlain onto the theoretical morphospace to highlight their positions in relation to the overall trends in morphology and function. This approach uses 2D single-pixel outlines of empirical morphology as inputs. These inputs are scaled and characterized using elliptical Fourier analysis to create a grid of theoretical morphologies covering a range of the theoretical morphospace. These theoretical morphologies can then be utilized for functional testing to create theoretical performance spaces. By combining the theoretical performance spaces using the inbuilt Pareto optimality framework, an optimality landscape can be generated. The empirical morphologies can then be projected into any of the theoretical spaces.
Data Collection
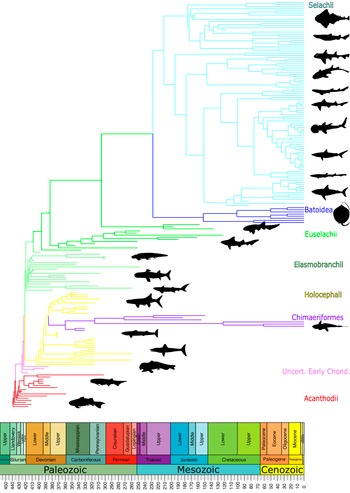
The dataset used in this study (Fig. 1, Supplementary Table) contains outlines of 122 extant and 95 extinct species across 35 orders, building on the combined datasets of Kamminga et al. (Reference Kamminga, De Bruin, Geleijns and Brazeau2017) (94 extant sharks) and Greif et al. (Reference Greif, Ferrón and Klug2022) (41 extinct chondrichthyans). The 28 additional extant and 54 extinct species were added by segmentation of computed tomography scans in Dragonfly (v. 2022.2) of specimens housed at the Natural History Museum London (NHM) and the Open Science Framework (OSF) database, photographs of specimens in the collections of the NHM and the Booth Museum, Brighton, and images from the literature (Didier Reference Didier1995; Tomita et al. Reference Tomita, Sato, Suda, Kawauchi and Nakaya2011; Dearden et al. Reference Dearden, Stockey and Brazeau2019, Reference Dearden, Mansuit, Cuckovic, Herrel, Didier, Tafforeau and Pradel2021; Smith et al. Reference Smith, Manzanares, Underwood, Healy, Clark and Johanson2020; see Supplementary Material).

Figure 1. Phylogeny of chondrichthyans included in this study. PhyloPic silhouettes used under fully open access availability.
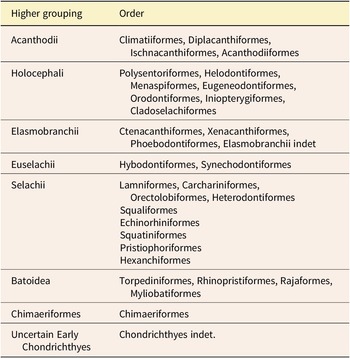
The outlines were grouped at order level based on their cladistic position in López-Romero et al. (Reference López-Romero, Stumpf, Kamminga, Böhmer, Pradel, Brazeau and Kriwet2023), Greif et al. (Reference Greif, Ferrón and Klug2022), and Klug et al. (Reference Klug, Coates, Frey, Greif, Jobbins, Pohle, Lagnaoui, Haouz and Ginter2023). Additional taxa were added to orders according to their cladistic position described in the same source as the specimen image or, if unavailable, from the existing literature (Supplementary Material). Orders were then grouped into more generalized higher groupings for simplicity (Table 1).
Table 1. Generalized groupings used within this study and the orders included within.

The isolated digital jaw models were oriented perpendicular to the long axis of the Meckel’s cartilage in Blender (v. 3.3) and exported as 2D silhouettes. The fossil data primarily expand upon the dataset published by Greif et al. (Reference Greif, Ferrón and Klug2022), with additional outlines from the Handbook of Paleoichthyology (Zangerl Reference Zangerl1981; Stahl Reference Stahl1999; Märss et al. Reference Märss, Turner and Karatajütė-Talimaa2007; Burrow Reference Burrow2021) and the existing literature (Maisey Reference Maisey1982; Lund Reference Lund1985; Didier Reference Didier1995; Coates and Sequeira Reference Coates and Sequeira2001; Kriwet and Klug Reference Kriwet and Klug2004; Shimada and Cicimurri Reference Shimada and Cicimurri2005; Mutter et al. Reference Mutter, De Blanger and Neuman2007, Reference Mutter, Neuman and De Blanger2008; Klug et al. Reference Klug, Kriwet, Böttcher, Schweigert and Dietl2009; Romano and Brinkmann Reference Romano and Brinkmann2010; Tomita et al. Reference Tomita, Sato, Suda, Kawauchi and Nakaya2011; Claeson et al. Reference Claeson, Underwood and Ward2013; Claeson Reference Claeson2014; Dearden et al. Reference Dearden, Stockey and Brazeau2019, Reference Dearden, Mansuit, Cuckovic, Herrel, Didier, Tafforeau and Pradel2021; Smith et al. Reference Smith, Manzanares, Underwood, Healy, Clark and Johanson2020; Villalobos-Segura et al. Reference Villalobos-Segura, Underwood and Ward2021, Reference Villalobos-Segura, Stumpf, Türtscher, Jambura, Begat, López-Romero, Fischer and Kriwet2023; Burrow et al. Reference Burrow, Den Blaauwen and Newman2022; see Supplementary Material). The 2D silhouettes were converted into binary single-pixel outlines using FIJI (v. 1.54d; Schindelin et al. Reference Schindelin, Arganda-Carreras, Frise, Kaynig, Longair, Pietzsch and Preibisch2012).
We used the rfishbase package (Boettiger et al. Reference Boettiger, Lang and Wainwright2012) to extract the ecology data associated with each extant species and create ecological categories for our analyses. Trophic-level data were averaged across the recorded stomach contents and diet composition values recorded in FishBase. In accordance with the methods of López-Romero and colleagues (Reference López-Romero, Stumpf, Kamminga, Böhmer, Pradel, Brazeau and Kriwet2023), the trophic data were split into categories, with values of 2.8–3.8 recorded as low predators, values of 3.81–4.2 recorded as medium predators, and values above 4.2 recorded as top predators. Similarly, the collected habitat data were sorted into groups following Dulvy et al. (Reference Dulvy, Fowler, Musick, Cavanagh, Kyne, Harrison and Carlson2014). For taxa with multiple habitats, priority was given to reef and deep-water associations, while taxa with both freshwater and marine occurrences were categorized as brackish.
Mantel Testing of 2D to 3D Datasets
Our dataset consists of 2D outlines, but chondrichthyan jaws are 3D structures. We therefore created a subset of our dataset to match the specimens included in the 3D dataset presented by López-Romero et al. (Reference López-Romero, Stumpf, Kamminga, Böhmer, Pradel, Brazeau and Kriwet2023) (145 specimens; Supplementary Material), to test the extent to which 2D characterizations of jaws adequately capture the disparity manifest in their 3D morphology. The empirical morphospace matrix generated by our 2D dataset was compared with the matrix created using the code provided in the supplementary materials of López-Romero et al. (Reference López-Romero, Stumpf, Kamminga, Böhmer, Pradel, Brazeau and Kriwet2023) through a series of Mantel tests in R (R v. 4.3.0 [2023-04-21 ucrt Already Tomorrow], R studio v. 2023.03.1 [Build 446 “Cherry Blossom”]; R Core Team 2025). Comparisons were made utilizing both base and squared data and compared using both Spearman’s rank and Pearson’s product-moment correlations. Statistical significance (p ≤ 0.05) was assessed in all tests using 999 permutations.
Theoretical Morphospace
Morphospace analyses were conducted in MATLAB (MathWorks 2023a, v. 9.14.0.2254940 [R2023a], update 2) using the theofun package (https://github.com/Bristol-Palaeobiology/theofun, outlined in Berks et al. [Reference Berks, Milla Carmona and Donoghue2025]) using the following parameters. Elliptical Fourier analysis was carried out to quantify and normalize outline shapes using 12 harmonics; theoretical shapes then were obtained as (x,y) outlines by back-transforming normalized coefficients into 500 landmarks. A random selection of outlines were visually examined to ensure a sufficient number of harmonics were used to capture the empirical shape. Theoretical morphospaces were constructed by performing principal components analysis (PCA), phylogenetic PCA (phyPCA) (Revell Reference Revell2009), and phylogenetically aligned component analysis (PACA) (Collyer and Adams Reference Collyer and Adams2021) and then computing theoretical shapes mapping shape variation onto the first two PC axes at regular intervals. The range of PC axes was set to expand the empirical morphospace by 20%.
Performance Surfaces and Optimality Landscape
Theoretical shapes were converted to meshes containing 2500 2D constant strain triangular elements for functional analyses. The theofun package contains built-in analyses for both rotational efficiency and von Mises stress finite element analysis (FEA), which were used as functional proxies for jaw closure speed and bite force, respectively (a stronger jaw can withstand higher bite forces). These analyses were each run using 1000 randomized iterations that varied the locations of the jaw joint and bite points by ±5% from the initial estimate. The mean rotational efficiency and von Mises stress values generated from these iterations were used to determine the theoretical jaw shape optimality using a Pareto ranking framework.
Optimality was measured using the Pareto rank ratio (PRR), described in Deakin et al. (Reference Deakin, Anderson, den Boer, Smith, Hill, Rücklin, Donoghue and Rayfield2022) and Berks et al. (Reference Berks, Milla Carmona and Donoghue2025) (https://github.com/Bristol-Palaeobiology/theofun). Pareto optimality is a framework through which to identify the subset of optimal solutions within a set of solutions to some multi-objective optimization problem. It is a binary characterization, splitting the set into optimal and suboptimal forms. As there are many nonfunctional biases on the evolution of morphology, we do not expect morphologies to be totally optimal within a trade-off. To measure the proximity of solutions to the Pareto front, we apply two ranks to the dataset: an optimal ranking, RO, which is the result of a standard Goldberg Pareto ranking (Goldberg Reference Goldberg1989), then a suboptimal ranking, RS, which is the result of a Goldberg ranking with reversed optimality. The PRR is defined by the following formula:
 $$ \mathrm{PRR}=\frac{{\mathrm{R}}_{\mathrm{S}}}{{\mathrm{R}}_{\mathrm{O}}+{\mathrm{R}}_{\mathrm{S}}},{\mathrm{R}}_{\mathrm{O}}\ne 0,{\mathrm{R}}_{\mathrm{S}}\ne 0 $$
If RO and RS = 0, then the PRR is set to 1.
Phylomorphospace Analyses
Phylogeny construction, analysis of the morphospace for phylogenetic signal, and ordination of the morphospace were carried out in R (R Core Team 2025) using functions from the ape (v. 5.8-1; Paradis and Schliep Reference Paradis and Schliep2019), phytools (v. 2.4-4; Revell Reference Revell2012), castor (v. 1.8.3; Louca and Doebeli Reference Louca and Doebeli2018), phangorn (v. 2.12.1; Schliep Reference Schliep2011), strap (v. 1.6-1; Bell and Lloyd Reference Bell and Lloyd2015), paleotree (v. 3.4.7; Bapst Reference Bapst2012), geomorph (v. 4.0.10; Adams and Otárola-Castillo Reference Adams and Otárola-Castillo2013), and morphospace (v. 0.0.1; Milla Carmona Reference Milla Carmona2023; Milla Carmona et al. Reference Milla Carmona, Lehmann, Deakin, Soto and Soto2025) packages. A bespoke tree containing all sampled taxa was constructed for this analysis by combining the trees of López-Romero et al. (Reference López-Romero, Stumpf, Kamminga, Böhmer, Pradel, Brazeau and Kriwet2023), Greif et al. (Reference Greif, Ferrón and Klug2022), and Klug et al. (Reference Klug, Coates, Frey, Greif, Jobbins, Pohle, Lagnaoui, Haouz and Ginter2023). Additional extant taxa were added according to their cladistic position in the WoRMs and FishBase databases. Additional extinct taxa were positioned based upon their classification in the Paleobiology Database and existing literature (see Supplementary Material). The resulting tree was dated with the paleotree package using the first-appearance dates recorded for fossil species in the Paleobiology Database and set as 0 for extant species. The tree was rooted with Ptomacanthus as the earliest branching chondrichthyan as per Greif et al. (Reference Greif, Ferrón and Klug2022) and the minimum age equal to the earliest currently known chondrichthyan, Fanjingshania renovata (Andreev et al. Reference Andreev, Sansom, Li, Zhao, Wang, Wang, Peng, Jia, Qiao and Zhu2022), while key internal nodes were dated using mean posterior age estimates from Irisarri et al. (Reference Irisarri, Baurain, Brinkmann, Delsuc, Sire, Kupfer, Petersen, Jarek, Meyer, Vences and Philippe2017).
An additional tree was constructed based on the topology recovered by Coates et al. (Reference Coates, Finarelli, Sansom, Andreev, Criswell, Tietjen, Rivers and La Riviere2018) and Dearden et al. (Reference Dearden, Stockey and Brazeau2019), with Acanthodes as the earliest branching chondrichthyan and equivalent age estimates for comparison (see Supplementary Material). Additional morphospace examination was conducted by rotating the theoretical morphospace to find ordination axes capturing different components of variation. In addition to a regular PCA (capturing the directions of maximum overall shape variation), a PACA maximizing phylogenetically structured shape variation and a phyPCA maximizing shape variation independent of phylogenetic history were run. Phylogenetic relationships were projected into the resulting PC axes to create a series of phylomorphospaces, assuming a standard Brownian model of evolution. Phylogenetic signal was estimated as the multivariate K-statistic (K mult) using the physignal function included in the Geomorph package. To further showcase potential trends in the first PC axis through time, phenograms were constructed.
Results
Mantel Tests
Comparison between the 2D outline and 3D landmark/semilandmark morphospaces revealed a strong positive correlation using both Pearson’s product-moment (r = 0.7688, squared data r = 0.6889) and Spearman’s rank (r = 0.7184, squared data r = 0.7184) between the two datasets, with all four variations finding p-values > 0.001. The strong correlation between the 3D and 2D datasets indicates the broader 2D dataset should be generally informative of the morphological trends identified in the 3D data.
Empirical and Theoretical Morphospace
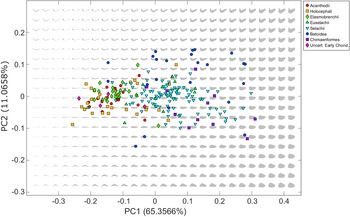
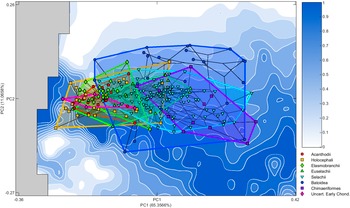
Ninety-five percent of the empirical lower jaw shape disparity is recovered in the first 8 component axes, with 65.36% accounted for by PC 1 alone (Fig. 2). Morphologically the trend across PC 1 shows an increase in medial depth of the Meckel’s cartilage. PC 2 is linked to relative dorsoventral curvature of the jaw tip and accounts for 11.07% of the disparity. PC 3 accounts for a further 7.85% of the disparity and primarily relates to the thickness of the medial cartilage (included in Supplementary Material with PC 4–PC 8).
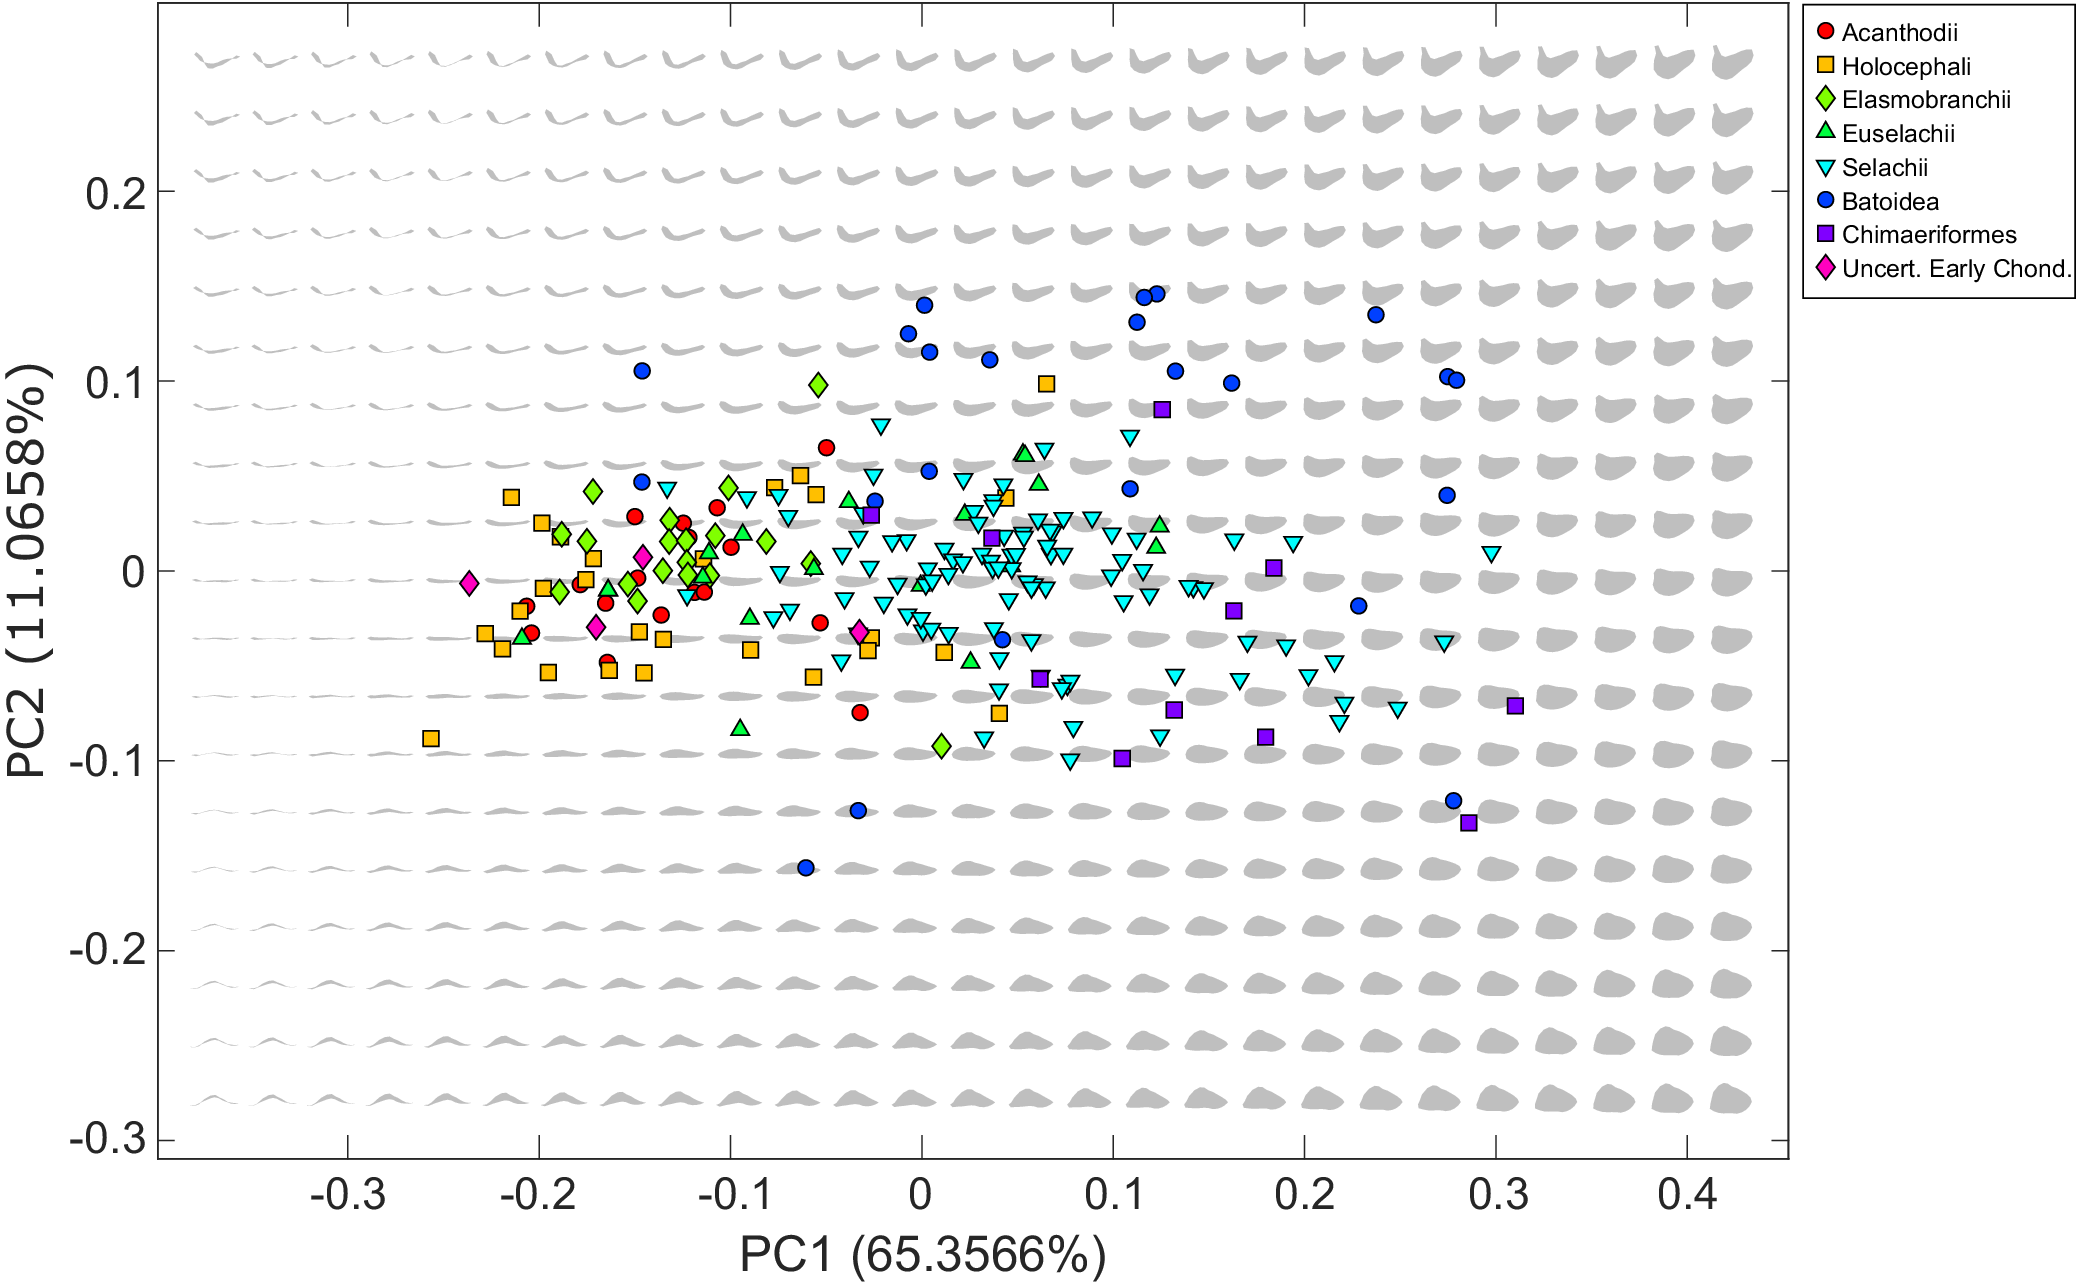
Figure 2. Theoretical chondrichthyan morphospace (gray jaw shapes) generated from the entire chondrichthyan dataset, with empirical jaw shapes (colored symbols) projected onto theoretical space.
The theoretical space contains a total of 513 theoretical shape outlines arranged in a 27 × 19 grid (Fig. 2). The theoretical space includes biologically impossible jaw shapes resulting from the mathematical modification of the shapes causing self-intersection of the theoretical Meckel’s cartilage outline. These impossible shapes form a concave area in shape space positioned in the negative area of PC 1 where the Meckel’s cartilage is thinnest.
Functional Performance Surfaces and Optimality Landscape
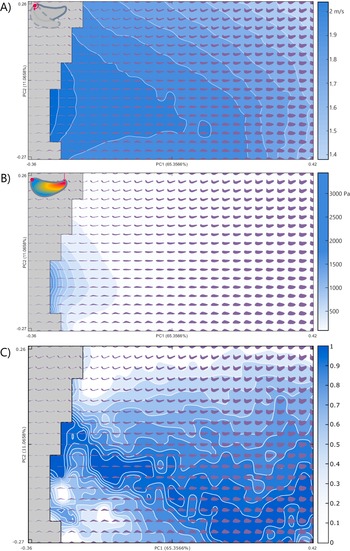
The area of thin jaws immediately on the edge of impossible space is found to be better suited for rotational efficiency, with the highest efficiency in jaws showing medial or a minor dorsal curvature of the jaw tip in PC 2 (Fig. 3A). The rotational efficiency steadily declines with increases in PC 1. Conversely, in the von Mises stress functional surface, jaw morphologies with low PC 1 scores were found to perform poorly in the FEA with high relative stress. Jaw stress decreases (and by inference, jaw strength increases) with increased PC 1 scores (Fig. 3B). The lowest stress resistance (highest stress) in PC 2 was found in shapes with medial or a minor dorsal curvature of the jaw tip, mirroring the highest rotational efficiency shapes.
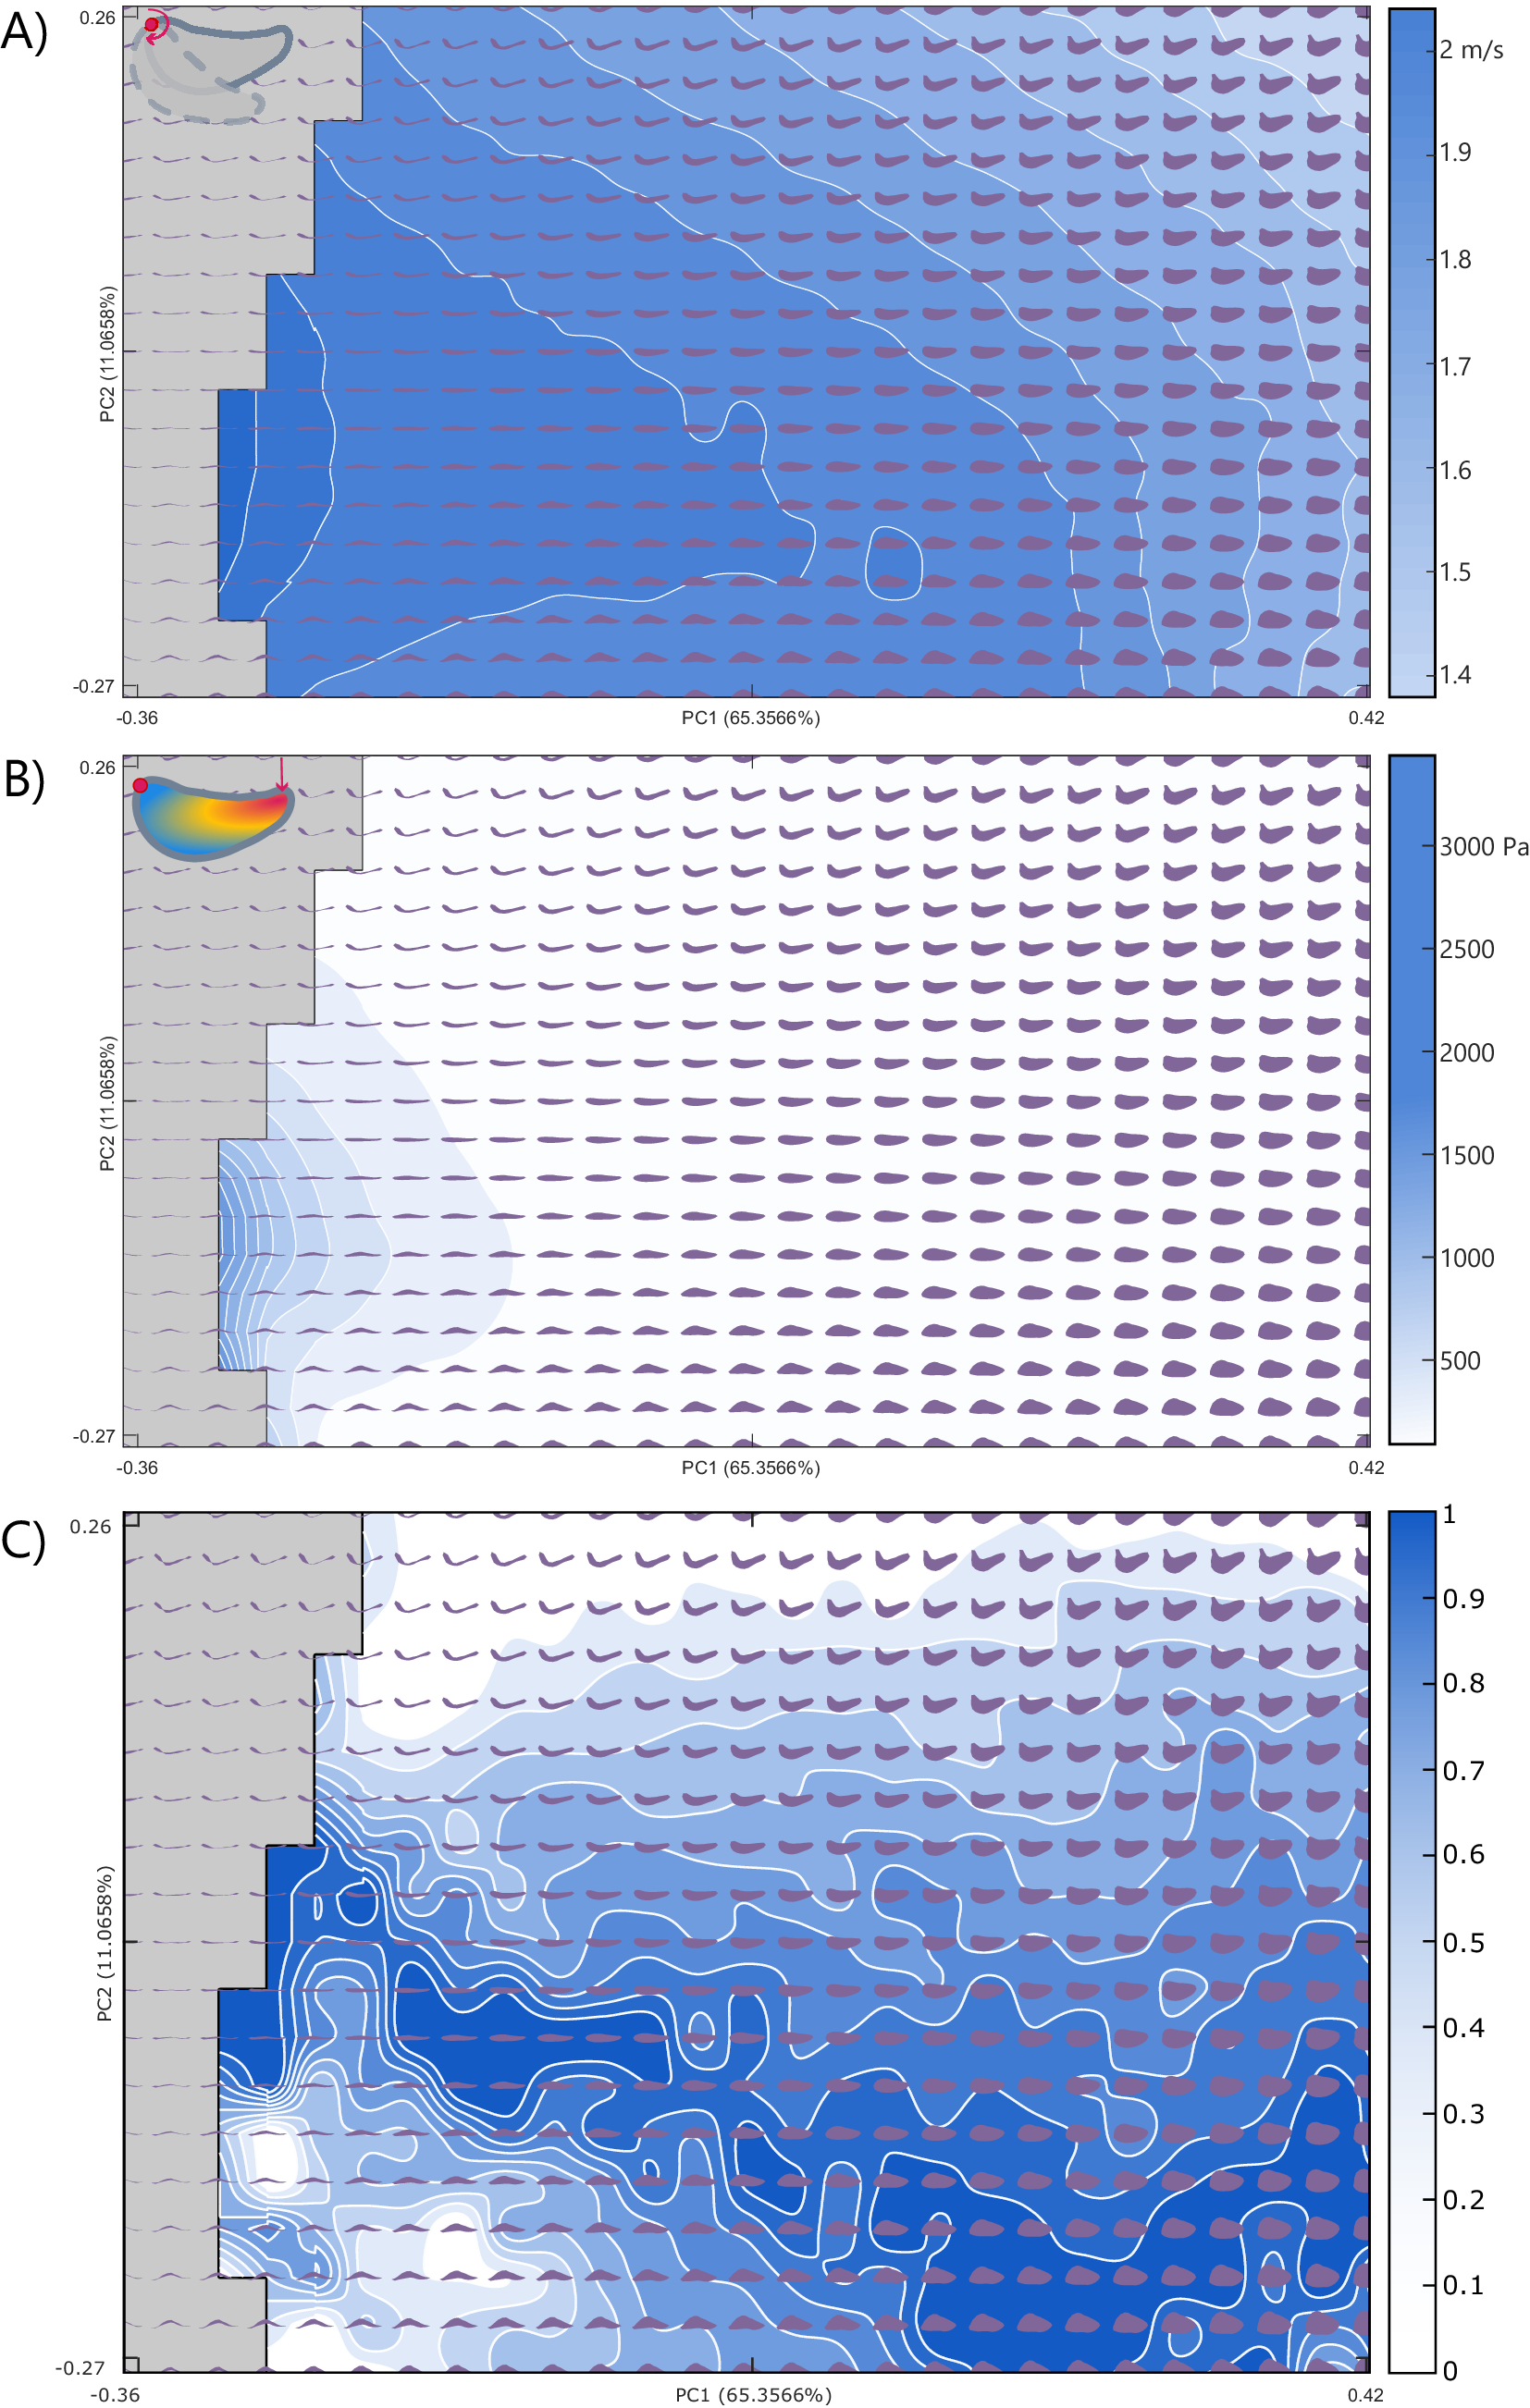
Figure 3. Component performance surfaces of theoretical jaws: A, Rotational efficiency; B, von Mises stress; and C, the resultant Pareto optimality surface for the trade-off between A and B. The theoretical morphologies represented as dark gray-blue shapes increase in optimality from 0 to 1 as indicated by Pareto rank ratio value, while gray areas indicate areas of impossible morphospace (extreme shapes generated by the theoretical approach with intersecting outlines). Explanatory cartoons in the top left have been included to visually showcase the functional performance being examined. PC, principal component.
The Pareto optimality landscape (Fig. 3C) created from the ranking of the combined rotational efficiency and von Mises stress performance spaces shows a pronounced optimality peak running from low PC 1 values with moderate PC 2 values to high PC 1 and low PC 2 values. The areas of low optimality are found at high values for PC 2 and at low PC 1 values that are also low PC 2 values. When the empirical taxa are overlain on the optimality landscape, they primarily occupy areas of medium optimality, clustering in the center of the theoretical optimality landscape (Figs. 4, 5).
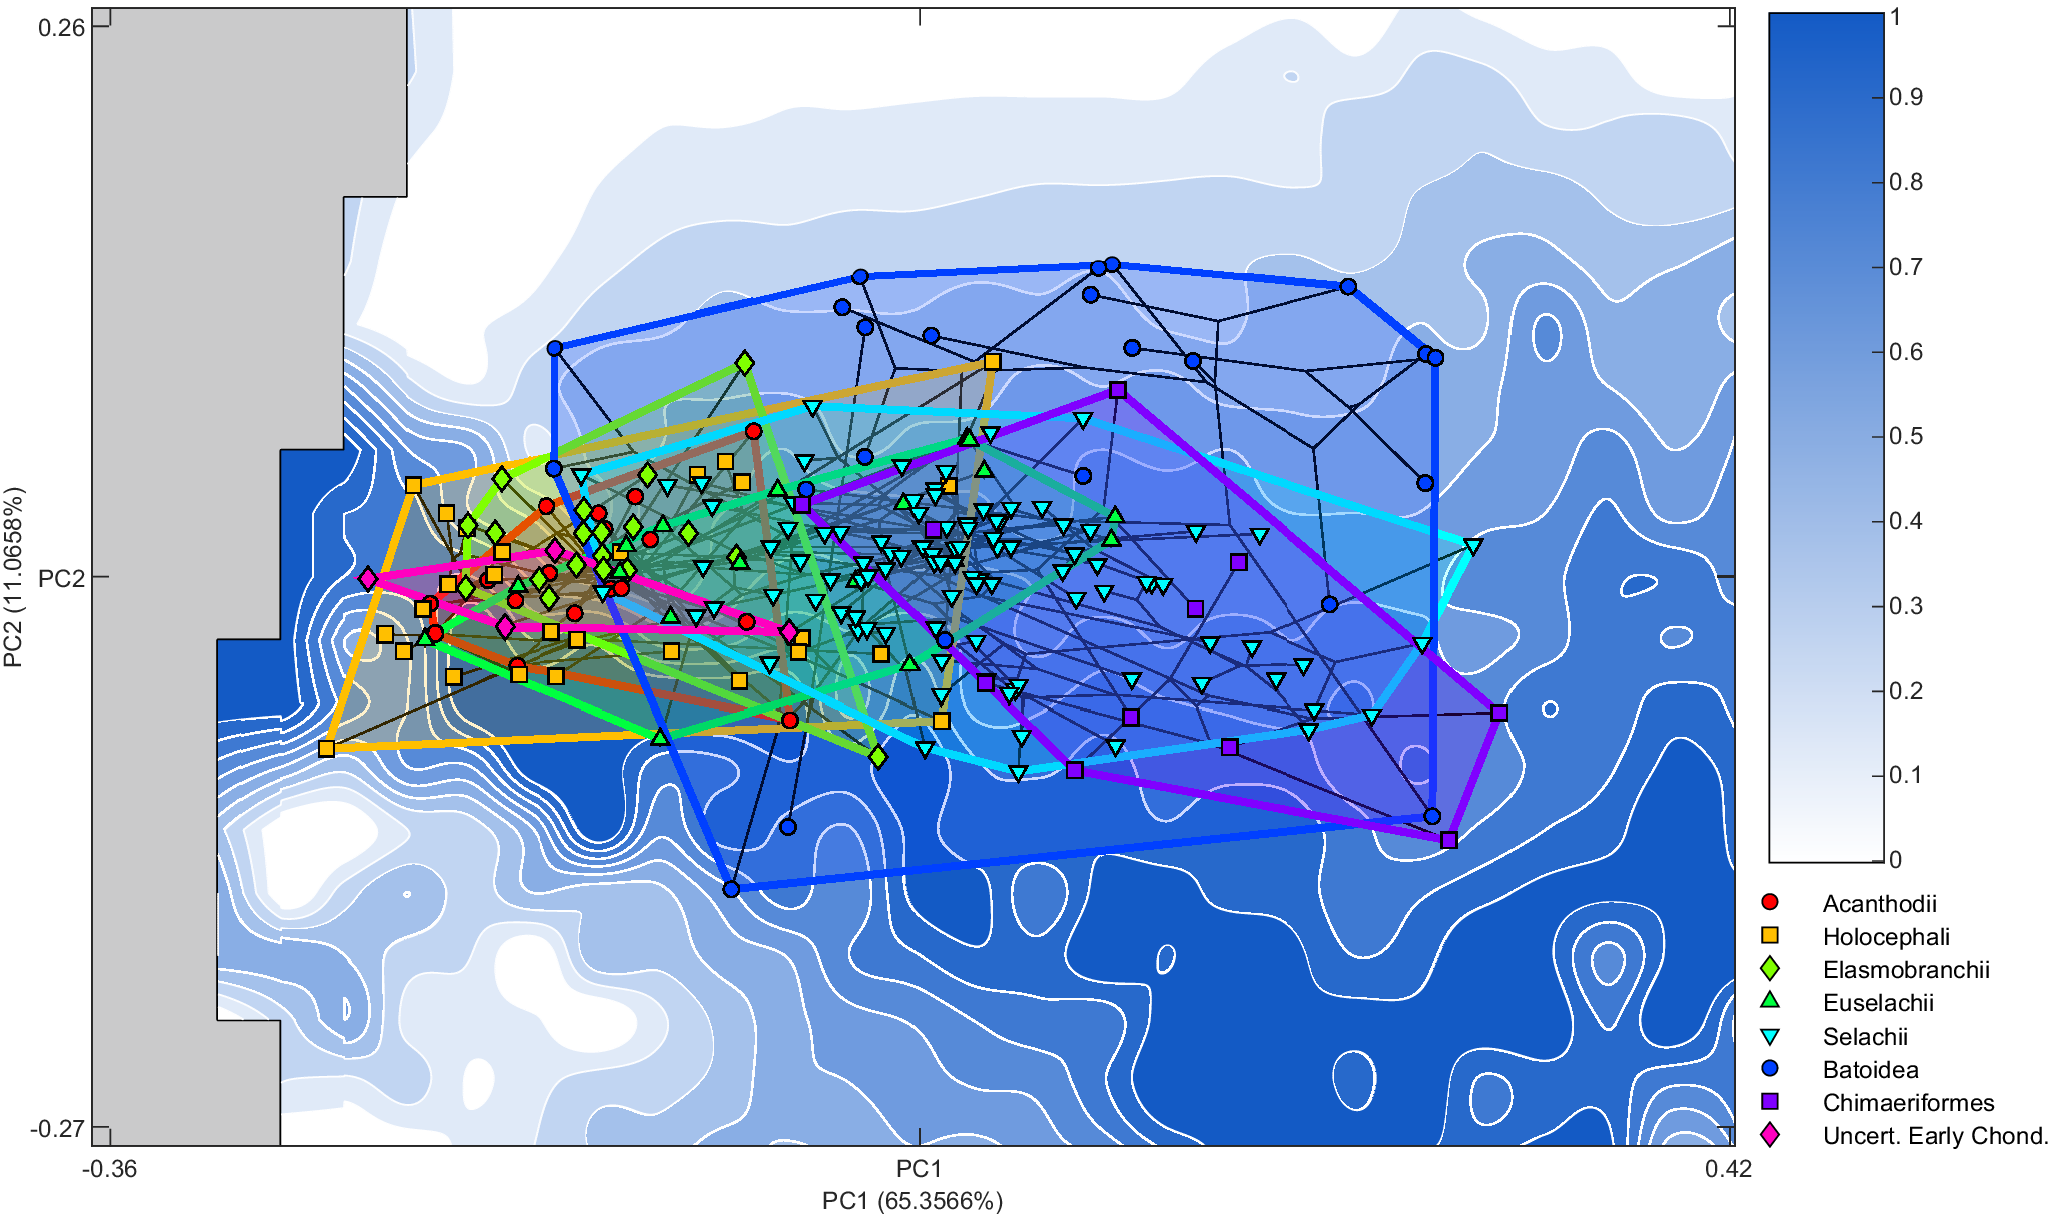
Figure 4. Optimality surface for the trade-off between jaw closure speed and bite force. Darker blue indicates increased optimality as indicated by the Pareto rank ratio. Overlain phylomorphospace with convex hulls illustrates higher-level generalized groupings. PC, principal component.
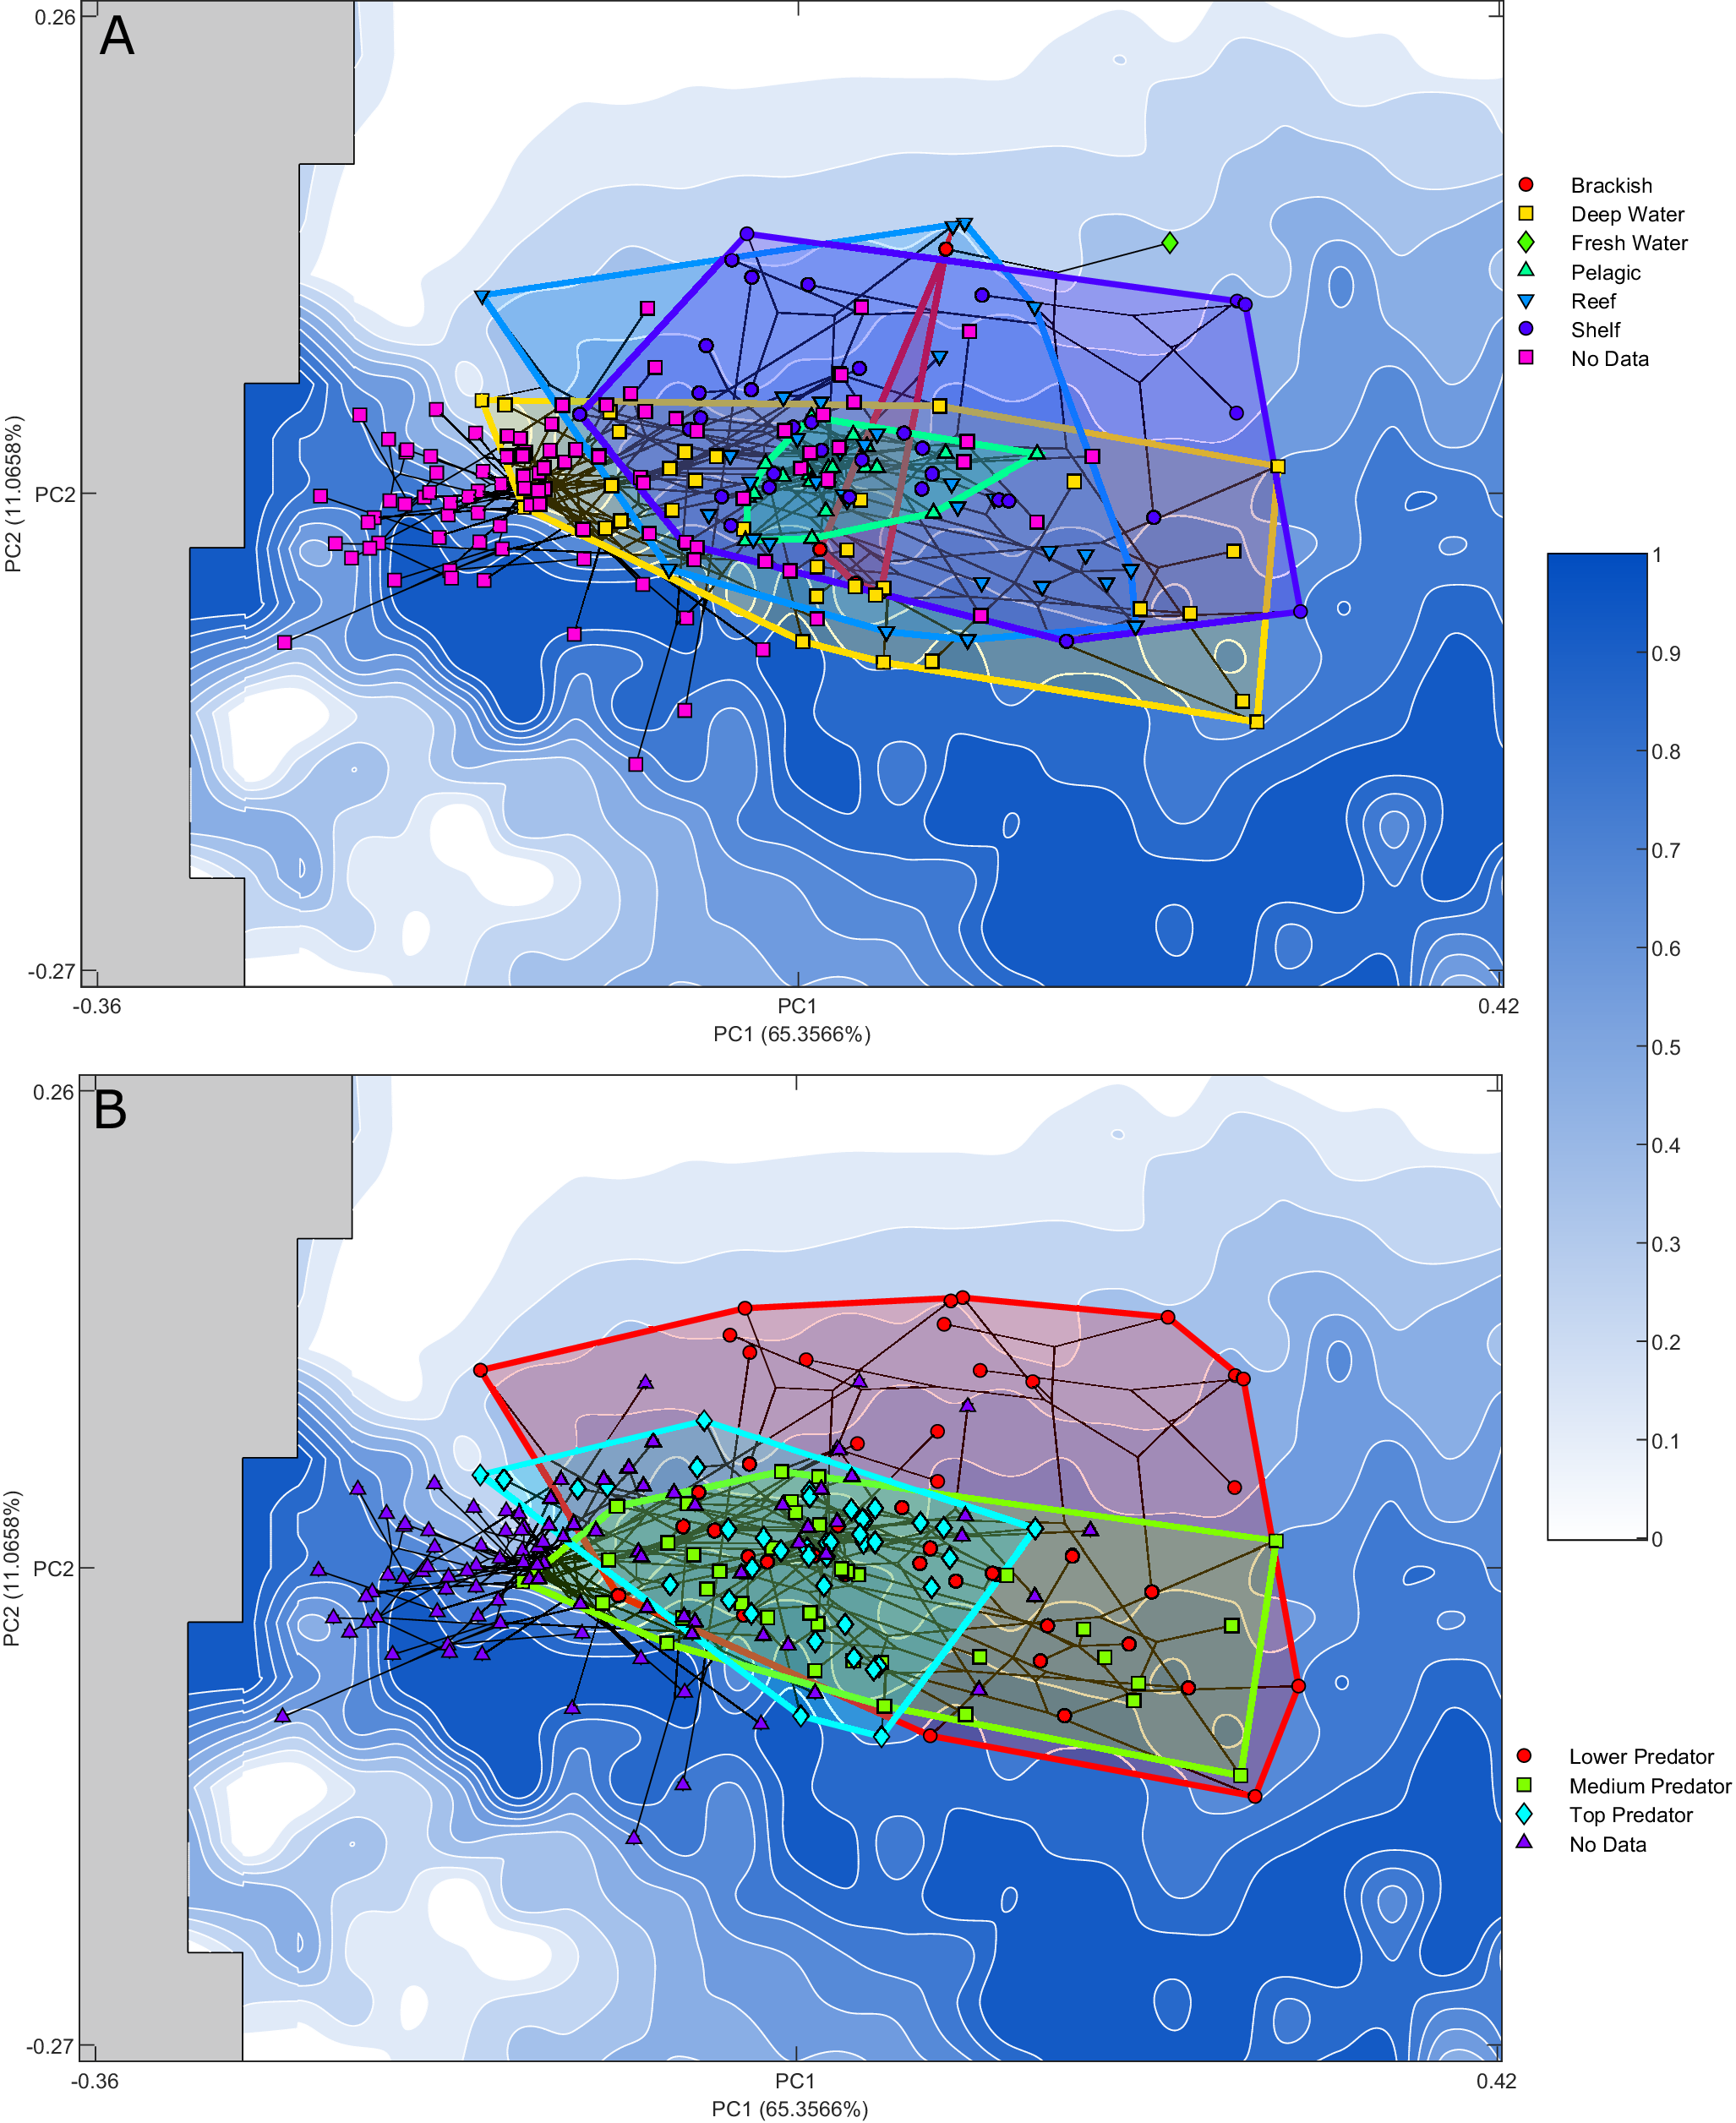
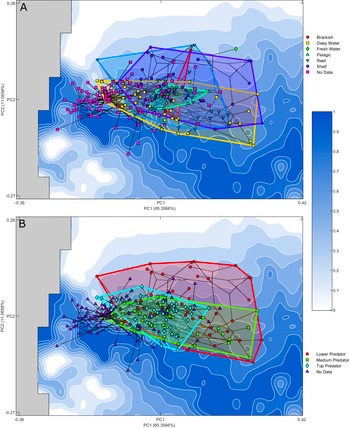
Figure 5. Optimality surface for the trade-off between jaw closure speed and bite force. Darker blue indicates increased optimality as indicated by the Pareto rank ratio. Overlain phylomorphospace with convex hulls indicates ecological groupings of extant taxa: A, Habitats; B, trophic level. Extinct taxa are marked as “No Data.” PC, principal component.
Phylomorphospace
The following results follow the more generalized groupings outlined in Table 1 as opposed to more restrictive clade definitions.
Batoidea (crown-group skates and rays) occupies the largest area of theoretical morphospace, followed by Selachii (crown-group sharks) and Chimaeriformes (crown-group holocephalans and crownward stem-group members), both of which largely fall within the area occupied by Batoidea. These three groups occupy the center of the phylomorphospace (Fig. 4). Euselachii (stem-group elasmobranchs with a close relationship to the crown-group) and Holocephali (stem-group holocephalans, including related fossil taxa) exhibit overlap with all three modern groups but they are offset toward lower PC 1 values, while the Elasmobranchii (stem-group elasmobranchs with a distant relationship to the crown-group) and Acanthodii (stem-group chondrichthyans) are further offset, only overlapping with Batoidea and Selachii. These offset groups are primarily occupying moderate PC 2 values and primarily fall within the middle of the area occupied by the Holocephali.
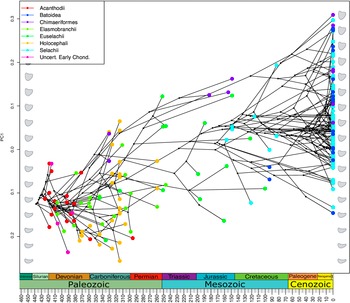
The empirical occupation of theoretical morphospace exhibited a significant phylogenetic signal (K = 0.1592, p = 0.001). This K value is low, suggesting that inter-clade variation is lower than expected under a Brownian motion model. This potentially could be due to trait lability or convergent evolution acting on the Meckel’s cartilage. Projection of the phylogeny into the optimality landscape (Fig. 4) shows the ancestral occupation to be focused close to the trade-off optimality peak in low PC 1 and moderate PC 2 values. The occupation by groups that contain extant taxa, the Batoidea, Chimaeriformes, and Selachii, shifts to encompass a wider range of PC 1 and PC 2 values, the majority of which are farther from the adaptive optimality ridge. The phenogram of PC 1 shows the clear directional trend through time toward areas of the morphospace representing more robust shapes (Fig. 6). This trend is preserved with the early-branching acanthodian topology (see Supplementary Material).

Figure 6. Phenogram showing changes in chondrichthyan lower jaw morphology through time. The y-axis (PC 1) contains 68.4% of the morphological variation in the theoretical morphology jaw shapes (gray silhouettes). Empirical jaw shapes (colored symbols) are projected onto the theoretical jaw shape variation.
For the PACA (see Supplementary Material), the PAC 1 axis shows a similar change in robustness as the regular PCA, while PAC 2 shows the lower jaw tip depth decreases with increasing PAC 2 values. This analysis restricts the morphospace occupation of Batoidea to largely overlap with Chimaeriformes in an area of lower PAC 2. Selachii are positioned in an area of morphospace slightly higher in PAC 2 than the rest of the modern taxa, while the fossil taxa are located in an area of lower PCA 1. Projecting the phylogeny into the phylogenetic PC axes (see Supplementary Material) results in condensation of morphospace occupation by fossil taxa in PC 2. Phylogenetic PC axes also show separation of Batoidea from the rest of the extant chondrichthyans into lower areas of PC 2. The morphological trend in PC 1 shows an increase in relative tip depth, PC 2 shows a change in the medial depth.
Ecology
The shelf, reef, and deep-water ecological groups each occupy a substantial area of the explored morphospace. The deep-water group covers the largest range, this exploration is largely in PC 1, with more limited exploration of PC 2 than the shelf and reef groups. The pelagic and brackish groups occupy a limited area in the center of the landscape, nested within the larger groups. The pelagic group explores primarily along PC 1, while the brackish morphological variation falls along PC 2; however, this is a much smaller taxon sample. Noticeably the freshwater group is located in an area of the landscape that is unexplored by the other groups. As this group is composed of a single taxon, Plesiotrygon iwamae, the inclusion of more taxa within this ecological niche is required to determine whether this exploration is taxon specific or a freshwater ecology supports exploration of this area of morphospace. The shift along PC 1 toward more robust forms maintains an area occupied by fossil taxa at lower PC 1 values.
Trophic level–based ecological groupings are nested within the explored morphospace. The largest grouping, lower predators, encompasses both other groups, covering almost the entirety of the explored landscape in both component axes but offset from the lower PC 1 areas explored by the fossils. The medium predator grouping is restricted in the exploration of PC 2 but has explored extensively in PC 1, remaining within areas of higher optimality. Top predator, the most limited group with regard to morphospace occupation, is more limited in its exploration of higher PC 1 value morphologies. This group remains closer to the center of the landscape.
Discussion
Though the occupation of morphospace by the Chondrichthyes has increased temporally, with the extant groups covering a wide range of jaw morphologies, there remain large areas of morphospace that have either not been explored or for which we lack evidence of occupation. With the exception of the impossible regions of morphospace that we identified, represented by theoretical jaw morphologies with intersecting outlines, the remaining jaw morphospace is physically plausible with varying degrees of functional performance. This includes areas of higher optimality than are currently inhabited by extant taxa, especially in areas with thicker Meckel’s cartilage and ventrally directed jaw tips. Unrealized, but viable, theoretical morphologies are unlikely to occur because of an attraction to a functional optima between bite force and jaw closure speed as crown chondrichthyans have moved away from the largely more optimal position occupied by early stem-Chondrichthyes. These regions must be unoccupied as a consequence of other factors, considered in the following subsections.
Insufficient Time to Explore Theoretical Shape Space or Missing Evolutionary History?
It is possible that the unoccupied regions of theoretical morphospace result simply from there having been insufficient time for random variation to explore all viable morphologies. However, our phylomorphospace (Figs. 4, 6) indicates that exploration of morphospace has been constrained principally to variation along PC 1 (slender to robust jaws, accounting for 65% of variation), suggesting that there is there is an attractor to this axis of variation or, otherwise, a constraint against other axes of variation. Alternatively, it is possible that theoretical shape space has been saturated during the evolutionary history of Chondrichthyes but evidence of this is lost to the vagaries of the fossil record. After all, skeletons composed of unmineralized or poorly mineralized cartilage have low preservation potential compared with the disarticulated and mineralized teeth, spines, and skin denticles that dominate the fossil record of chondrichthyans (Kim et al. Reference Kim, Balk, Sibert and Whitenack2024; Schnetz et al. Reference Schnetz, Dunne, Feichtinger, Butler, Coates and Sansom2024), with the earliest history dominated by the latter (Andreev et al. Reference Andreev, Coates, Karatajūtė-Talimaa, Shelton, Cooper, Wang and Sansom2016, Reference Andreev, Coates, Karatajūtė-Talimaa, Shelton, Cooper and Sansom2017, Reference Andreev, Zhao, Wang, Smith, Li, Cui, Zhu and Sansom2020). However, analyses of Paleozoic chondrichthyan diversity that account for preservation biases (Schnetz et al. Reference Schnetz, Dunne, Feichtinger, Butler, Coates and Sansom2024) do not suggest that we have failed to sample a significant cryptic diversity.
Phylogeny
In contrast to their post-Paleozoic relatives, Paleozoic chondrichthyans plot close to the trade-off optimality peak in theoretical shape space, represented by jaws with thinner dorsoventral Meckel’s cartilage with moderately curved jaw tips. Modern orders are more clearly separated, exhibiting more robust jaws that are less optimal for the trade-off between strength and speed, but more optimal for strength alone. Of these more recent higher groups, Batoidea occupy a substantial proportion of the shape space, with the majority of extant Batoidea possessing jaws of lower optimality with higher degrees of curvature (with the notable exception of Aetobatus narinari). This broad exploration of morphology may be due to the decoupling of the jaws from the neurocrania allowing jaw shape evolution to occur independently (Gayford et al. Reference Gayford, Brazeau and Naylor2024). Chimaeriformes and Selachii overlap within shape space; however, Chimaeriformes explore slightly higher-value regions of PC 1 where the Meckel’s cartilage is deeper. Selachii tend to remain closer to the optimality peak, as did their Paleozoic forebears, but they do not converge on the thinner jaw morphologies exhibited by Paleozoic taxa. The phylomorphospace shows a trend of increased exploration of morphospace through time, principally along PC 1, linked to jaw thickness (Fig. 6), which is maintained even when the adjusting by phylogeny in the PAC and phyPCA analyses (see Supplementary Material). Extension into areas of morphospace that are less optimal for the trade-off between jaw speed and bite force mirrors the trend found more generally for early jawed vertebrates, which shows an expansion of shape space occupation from early, more optimal forms (Deakin et al. Reference Deakin, Anderson, den Boer, Smith, Hill, Rücklin, Donoghue and Rayfield2022). This may be linked with the radiation following the Hangenberg extinction (Friedman and Sallan Reference Friedman and Sallan2012). A further directional shift during the Jurassic and Cretaceous sees the previously occupied lowest areas of PC 1 unrepresented in among the extant taxa sampled. The timing of this shift coincides with the Jurassic diversification of early sharks and batoids (Kriwet and Klug Reference Kriwet and Klug2004) followed by the expansion into deep-water habitats by squaliformes (Klug and Kriwet Reference Klug and Kriwet2010).
Functional Optimality
Our results found limited interaction between morphology and the functional trade-off between rotational efficiency and jaw stress (as a proxy for bite force) in Chondrichthyes. The theoretical morphology optimality landscape produced by this trade-off has multiple peaks forming a distinct ridge across the morphospace; however, our taxon sample does not cluster around these optimality peaks. Instead, taxa show a distinct temporal trend along PC 1 toward morphologies with greater robustness. This temporal trend is consistent across both PACA and phyPCA (see Supplementary Material). The sampled taxa avoid the lowest areas of optimality, indicating that this trade-off may serve more to restrict these less optimal areas from being explored than to drive the morphology toward an optimum through time.
The unoccupied areas of theoretical morphospace that are optimal for the trade-off between strength and speed may also be less optimal for a different function, serving to limit the occupation by affecting fitness. This may also occur because chondrichthyans have departed from generalism in their feeding ecology, specializing in just speed (such as for suction feeding) or strength (such as for durophagy). Indeed, chondrichthyans are known to have undergone a shift to a more durophagous, crushing, diet in the mid-Paleozoic (Salamon et al. Reference Salamon, Gorzelak, Niedźwiedzki, Trzęsiok and Baumiller2014; Richards et al. Reference Richards, Sherwin, Smithson, Bennion, Davies, Marshall and Clack2017) and as part of the Marine Mesozoic Revolution (Vermeij Reference Vermeij1977; Walker and Brett Reference Walker and Brett2002). Specialization in durophagy and manipulation of harder-shelled prey by the Chimaeriformes and Batoidea (Dean et al. Reference Dean, Wilga and Summers2005) may have further reduced the importance of jaw closure speed, which in conjunction with changes to the internal structure of the jaws (Maisey et al. Reference Maisey, Denton, Burrow and Pradel2021; Clark et al. Reference Clark, Chaumel, Johanson, Underwood, Smith and Dean2022), allowed great exploration of shape space by these modern groups, preventing exploration of other regions of shape space that are better adapted to other feeding ecologies. The morphology of the jaw may also be constrained by the shape of the wider feeding system, as the lower jaw needs to work in concert with the upper jaw, hyoid arch, labial cartilage, and the teeth (Wilga et al. Reference Wilga, Wainwright and Motta2000; Wilga Reference Wilga2002; Dean et al. Reference Dean, Wilga and Summers2005; Maisey Reference Maisey2008), potentially requiring any morphological change in one component to be complemented in the others in order to feed correctly. A further non-trophic functional constraint that may be affecting the occupation is biting utilized as part of reproduction (Klimley et al. Reference Klimley, Porcher, Clua and Pratt2023), as this behavior is known to influence dental morphology (de Sousa Rangel et al. Reference Sousa Rangel, Santander-Neto, Rici and Lessa2016). Finally, regions of viable shape space may be unexplored due to functional constraints independent from biting, such as hydrodynamic constraints on swimming speed (i.e., increased drag) affecting jaw shape in pursuit-based predators.
Ecology
Habitat
In terms of general morphospace occupation, deep-water, reef, and shelf taxa each cover a large portion of the explored jaw forms and show substantial overlap. Pelagic taxa are located centrally, overlapping with jaw shapes that are associated with the other habitats but limited in exploration in PC 2. The sole extant freshwater taxon included within this study, Plesiotrygon iwamae, does appear in an isolated area of the morphospace, but further sampling of freshwater chondrichthyans is needed to determine whether or not freshwater ecology is associated with distinctive jaw morphologies. Overall, these findings are consistent with the identification of the deep-water environment as a diversity hotspot for sharks (Klug and Kriwet Reference Klug and Kriwet2010; López-Romero et al. Reference López-Romero, Stumpf, Kamminga, Böhmer, Pradel, Brazeau and Kriwet2023) and wider elasmobranchs (Gayford et al. Reference Gayford, Brazeau and Naylor2024), as well as teleost fishes (Martinez et al. Reference Martinez, Friedman, Corn, Larouche, Price and Wainwright2021). Deep-water species exhibit the broadest range of variation along PC 1, while reef- and shelf-associated morphologies cover the widest array of forms in PC 2.
There is only limited evidence for an association between habitat and the functional trade-off between speed and strength, although the shift in jaw morphology for extant chondrichthyans does align with the component strength landscape. The deep-water taxon Centrophorus uyato does, however, occupy one of the optimality peaks exhibiting moderate cartilage thickness and slight curvature of the Meckel’s cartilage. The limited exploration of morphospace by pelagic taxa may be tied to the reduction in the diversity of feeding structures, as pelagic taxa do not exhibit the specialized durophagous diets that may increase the drive to explore wider morphologies, similar to what has been described in teleost fish (Knapp et al. Reference Knapp, Lázaro, Friedman, Johanson, Evans, Giles, Beckett and Goswami2023).
Trophic Level
Higher trophic levels occupy more restricted areas of morphospace. The low trophic level grouping covers almost the entire range of theoretical morphologies occupied by extant chondrichthyans. Despite the large area of morphospace covered, the low trophic level morphologies are uninhibited by impossible space and do not adhere to the contours of the optimality landscape, suggesting that this trade-off is not constraining these morphologies beyond preventing the exploration of the lowest optimality areas at the highest values of PC 2. Both medium and higher trophic level predators were found closer to the optimal peaks with lower PC 2 values. The highest trophic level of top predators is restricted in its exploration of morphospace, approximating the optimal peak occupied by fossil taxa, while medium predators vary further along PC 1. Medium and top predators exhibit wide morphological distribution along PC 1 but limited variation along PC 2. This indicates that lower predators are free to explore a wider range of morphologies, especially the more robust yet slower forms, but increases in trophic level from lower to medium predator may require a minimum level of optimality in the trade-off between strength and speed. Many of the highest PC 2 values occupied solely by lower predators are composed of batoid taxa. The loss of the ethmopalatine ligament and shift in articulation between the jaw and the rest of the crania seen in batoids (Dean and Motta Reference Dean and Motta2004; Gayford et al. Reference Gayford, Brazeau and Naylor2024) may have allowed these lower predators to expand their occupation to areas with a lower level of optimality between jaw closure speed and jaw strength. The top predators are then even further constrained than the medium predators in their exploration of specialist jaw shapes. Interestingly, the top predators include all of the pelagic taxa, indicating that the constraints on the jaw shape of this group may also relate to the specialization in long-distance pursuit predation within the geologically recent shift to occupy the pelagic realm (Sternes et al. Reference Sternes, Schmitz and Higham2024) in addition to the lack of drive to explore morphologies better suited to durophagy. Trophic level is closely tied to total body size (Dalponti et al. Reference Dalponti, Guariento and Caliman2018), and so it is possible that size differences (which were not included in our analysis) could serve to strengthen this ecological trend.
Limitations
Phylogenies introduce potential sources of uncertainty, as temporal range of taxa, inter-taxa relationships, and timing of divergences are difficult to determine. While this limitation has no bearing on the functional and morphometric aspects of our analysis that were performed independently, the phylogenetic uncertainty may have some effect on interpretations for occupation based on phylogenetic grouping and morphological trends through time. As the groupings used were order level, both phylogenetic hypotheses examined, nested Acanthodii (Fig. 1) and early-branching Acanthodii (Supplementary Material), returned largely equivalent phylomorphospace occupation (Fig. 4, Supplementary Material) and phenograms (Fig. 5, Supplementary Material). While the limitations from phylogenetic uncertainty may influence these phylogenies, the broader-scale trends examined in this study appear to be robust.
A more prominent limitation of this study is the use of 2D outlines to capture of morphology. While the Mantel tests do indicate that the relationships between the 2D and 3D data that have been published by López-Romero et al. (Reference López-Romero, Stumpf, Kamminga, Böhmer, Pradel, Brazeau and Kriwet2023) are unlikely to be random, the highest r value reached was 0.7688. Although this is a moderately strong relationship there remain some differences between the two datasets. This difference is quite likely to be the result of the loss of dimensionality in describing the morphology using 2D, especially in the batoids, which have undergone extensive reorientation of the jaw and wider neurocrania (Dean and Motta Reference Dean and Motta2004; Gayford et al. Reference Gayford, Brazeau and Naylor2024). This limitation must be weighed against the benefit of using 2D outlines. While using purely 3D data is ideal to avoid this limitation, it severely limits the number of taxa that can be examined through deep time, as very few fossils are preserved undistorted in 3D. It should also be noted that the 2D outlines from the empirical taxa compared by the Mantel test only served as the basis for the wider array of theoretical morphologies that were subsequently tested.
Conclusion
In general, chondrichthyans have moved away from morphologies optimal for the trade-off between speed and strength as well as those with the lowest optimality through their evolutionary history. This trade-off between strength and speed does not substantially limit the exploration of possible morphologies, likely serving more as a minimum level of optimality as opposed to a peak that needs to be reached. Chondrichthyan jaw morphologies have diversified through evolutionary history, shifting away from morphotypes that are optimized for strength and speed, toward more robust shapes. This likely reflects a general shift from ecological generalists to specialists, associated in particular with durophagy and, potentially, pursuit predation. Despite a broad exploration of theoretical morphospace, there remain a broad range of seemingly viable morphologies that are unrepresented in chondrichthyan evolutionary history. This is unlikely to be a consequence of insufficient exploration time or an artifact of an incomplete fossil record, but rather functional and perhaps developmental constraints from departing from the principal axis of shape variation.
Acknowledgments
We thank W. Deakin for invaluable support and assistance with the theofun coding package and phylomorphospace analysis and two anonymous reviewers who greatly improved the quality of this article with their suggestions and insights.
Funding Statement
We acknowledge support of the John Templeton Foundation (grant ID no. 62574 to E.J.R. and P.C.J.D.) and the Leverhulme Trust (RF-2022-167). R.P.D. was supported during this work by the European Union Marie Skłodowska-Curie grant agreement no. 101062426
Author Contribution
B.G.: data collection and curation, formal analyses, methodology, writing–original draft, writing–review and editing; J.N.K. supervision, methodology, software, writing–review and editing; P.S.M.C.: supervision, methodology, software, writing–review and editing; Z.J. data collection, writing–review and editing; R.P.D.: data collection, writing–review and editing; P.C.J.D.: conceptualization, funding acquisition, project administration, supervision, writing–review and editing; E.J.R.: conceptualization, funding acquisition, project administration, supervision, writing–review and editing.
Competing Interests
The authors declare no competing interests.
Data Availability Statement
Data relating to this study are stored in the University of Bristol online data repository at https://doi.org/10.5523/bris.387v6fzc6i2e22s0ze2m0ms2jc or http://data.bris.ac.uk/data/dataset/387v6fzc6i2e22s0ze2m0ms2jc.

 Open access