


1. Introduction
Aligned with global trends, glaciers in Aotearoa/New Zealand (NZ) are rapidly diminishing in response to rising temperatures (Vargo and others, Reference Vargo2020; Anderson and others, Reference Anderson2021), with potential for complete deglaciation should global mean temperatures increase by 3°C (Rounce and others, Reference Rounce2023). An updated glacier inventory determined there were ∼2900 glaciers in NZ in 2016 (∼790 km2) (Baumann and others, Reference Baumann2021), although 264 had already wasted away between 2000 and 2016 (Paul and others, Reference Paul, Baumann, Anderson and Rastner2023). Of those remaining glaciers, only two have current direct measurement of their mass balance; namely, Brewster Glacier (Anderson and others, Reference Anderson2010; Cullen and others, Reference Cullen2016; Abrahim and others, Reference Abrahim, Cullen, Conway and Sirguey2023) and Rolleston Glacier (Purdie and others, Reference Purdie2015) (Fig. 1).

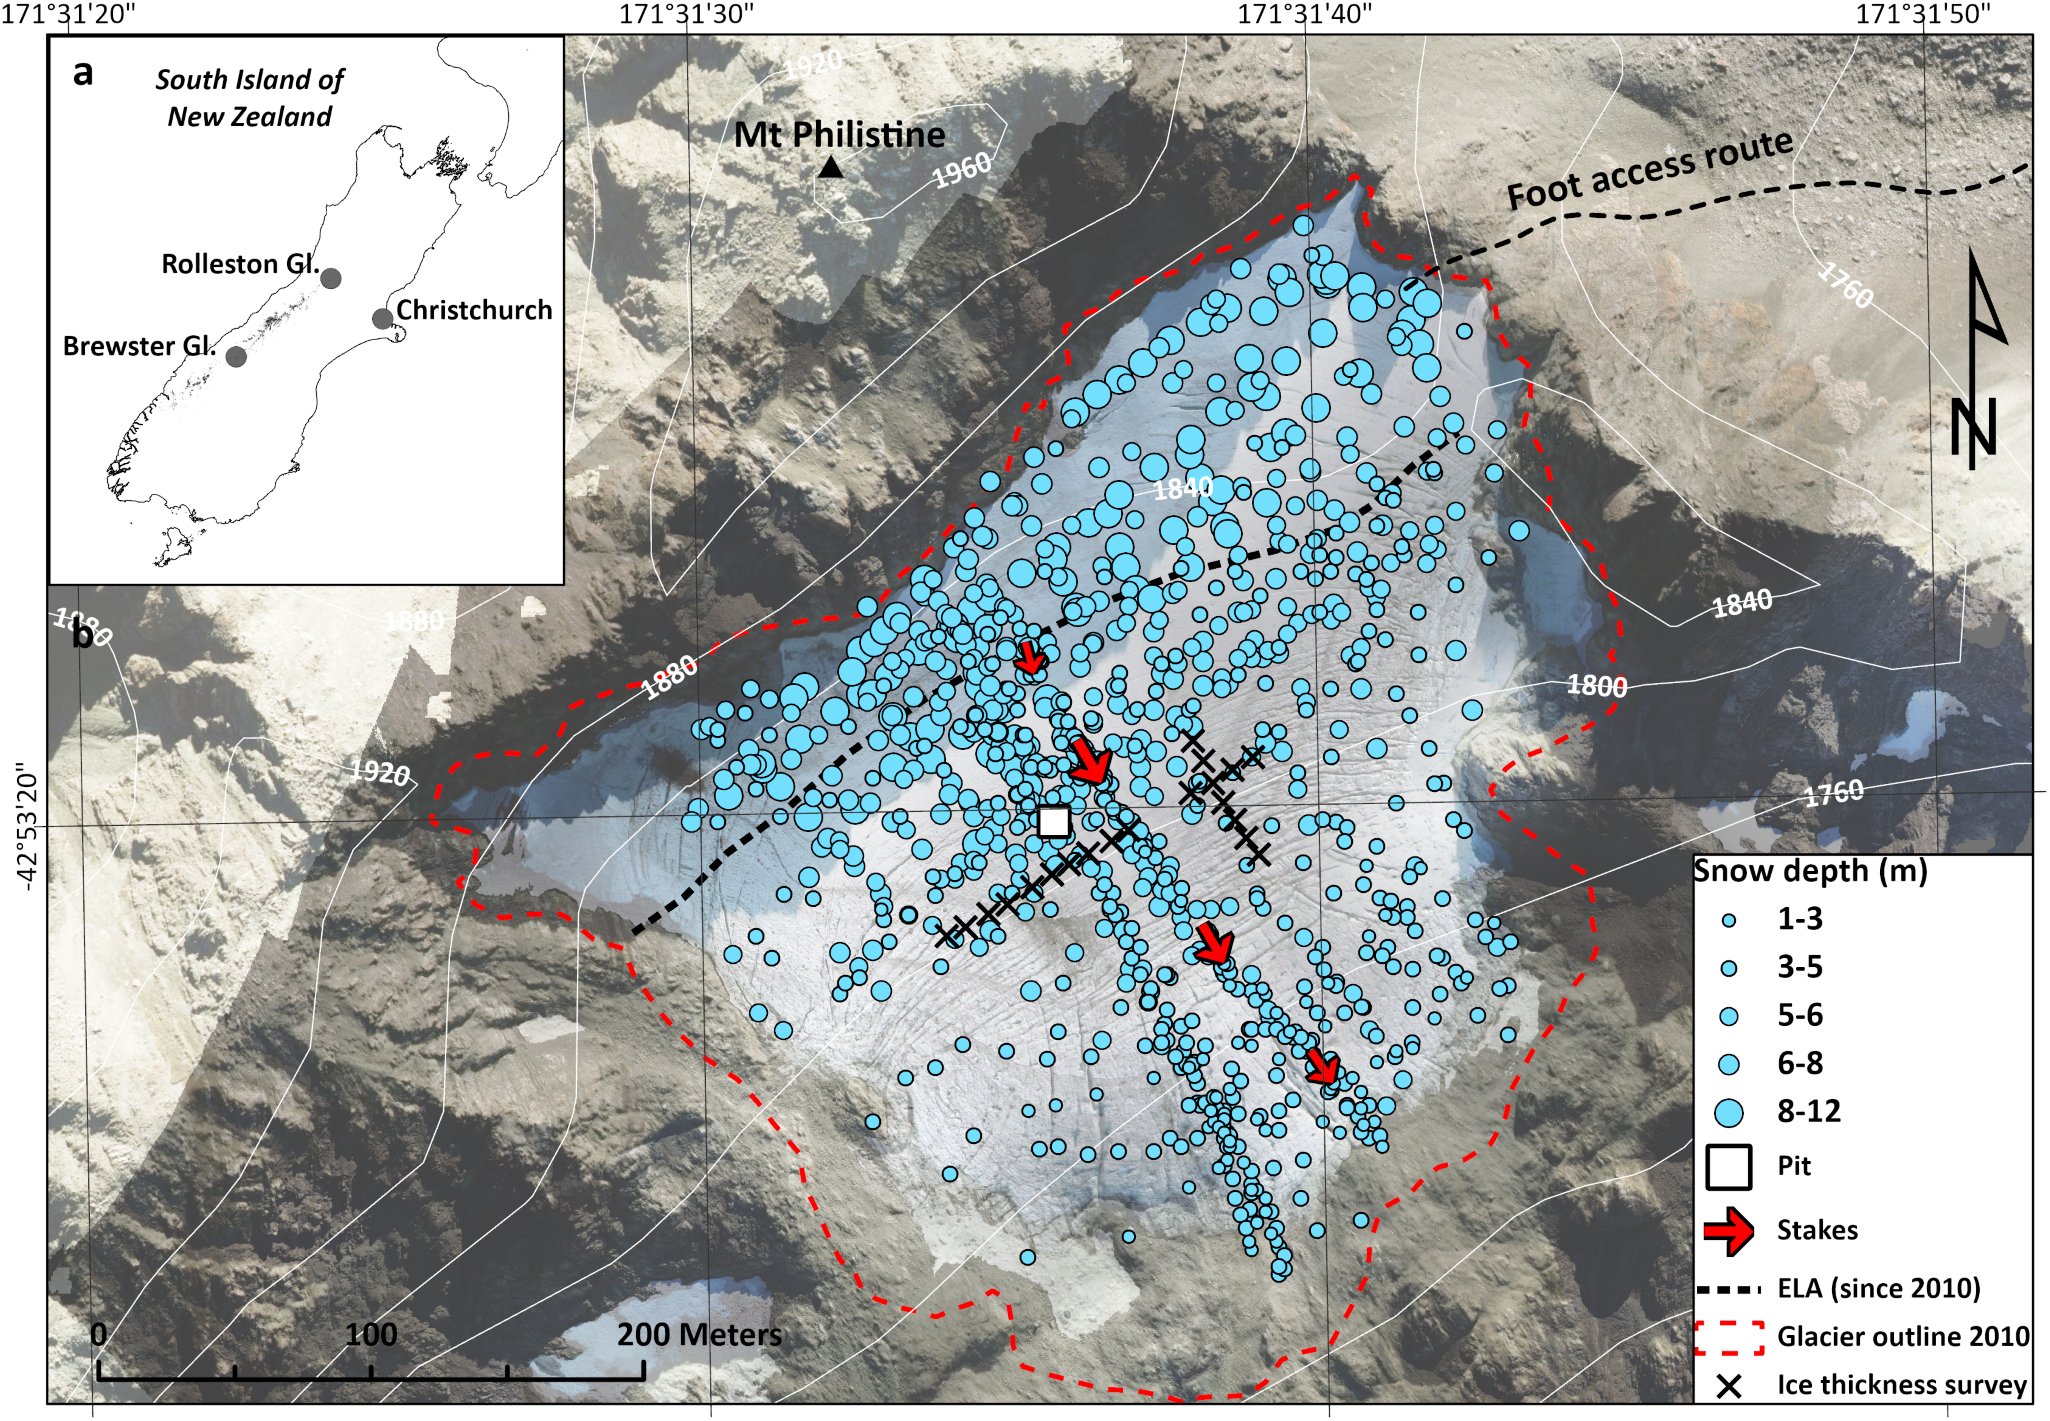
Figure 1. Location map of the Rolleston Glacier (a) in relation to the South Island of New Zealand, (b) key mass balance monitoring components including snow depths used in this study, location of snow pit, mass balance stakes (also average surface velocity), average ELA since 2010 and location of previous ice thickness measurements. Background image is the orthophoto from the 2022 lidar survey, and red dashed line shows the glacier outline in 2010. For reference, cross-glacier ice-thickness points are approximately 150 m from the glacier headwall, also see Figure S1.
NZ’s maritime climate makes glaciers in Kā Tiritiri o Te Moana/The Southern Alps highly sensitive to temperature variability (Anderson and others, Reference Anderson2010, Reference Anderson2021). An analysis of snowline trends by Lorrey and others (Reference Lorrey2022) revealed a persistent and increasing trend in glacier equilibrium line altitudes, and estimated a further 200 m increase in snowline elevation in the coming decade. For a small cirque glacier like the Rolleston, this would locate the snowline above the current glacier (Macara, Reference Macara2024).
However, in steep mountainous regions, snow that has accumulated above the elevation limit of a glacier can contribute to mass gain through avalanche deposition (e.g. Hewitt, Reference Hewitt2011; Lazarev and others, Reference Lazarev, Turchaninova, Seliverstov, Komarov and Sokratov2018); a characteristic observed at Rolleston Glacier (Purdie and others, Reference Purdie2015). A sensitivity study of glaciers in the Swiss Alps concluded that while up to 52% of very small glaciers will completely disappear by 2040, avalanche deposition will enable a few to persist, and these may even reach a quasi-equilibrium as winter precipitation rates increase with warming (Huss and Fischer, Reference Huss and Fischer2016).
While it is well recognised that avalanche deposition can be important to mass gain, its contribution to total snow accumulation is highly variable ranging from 10–60% (Lossev and Jloceb, Reference Lossev and Jloceb1967). Avalanche input also varies over space (Hewitt, Reference Hewitt2011; Kneib and others, Reference Kneib2024a) and time. For example, Hynek and others (Reference Hynek2024) found that avalanche activity from a single storm contributed nearly 20% of total winter accumulation at Freya Glacier (Greenland). However, topographic interaction in complex terrain creates difficulty in separating snow delivered by avalanche from that derived by wind processes (e.g. Tangborn and others, Reference Tangborn, Mayo, Scully and Krimmel1977), specifically, preferential deposition (Lehning and others, Reference Lehning, Lowe, Ryser and Raderschall2008; Dadic and others, Reference Dadic, Mott, Lehning and Burlando2010) and snow drift (Liston and Sturm, Reference Liston and Sturm1998). Direct measurements of avalanche input are challenging (Lossev and Jloceb, Reference Lossev and Jloceb1967), although numerical modelling techniques can be used to estimate proportions of snow attributable to avalanche or wind processes (Terleth and others, Reference Terleth, van Pelt and Pettersson2023; Kneib and others, Reference Kneib2024b).
Here, we utilise a combination of glaciological and geodetic data to examine mass balance characteristics of Rolleston Glacier and consider whether avalanche input and other secondary accumulation processes might make a difference to glacier survival.
2. Study site and data sets
Rolleston Glacier (−42.89°S, 171.53°E) is a small (∼0.1 km2) cirque glacier located on the southeast slopes of Mt Philistine (1967 m above sea level; a.s.l.) just west of the Main Divide of the Southern Alps. Its elevation range is only 160 m (1720–1880 m a.s.l., 2022 lidar data; unpublished), with the upper section surrounded by rocky headwalls with slope angles of 50–60° (Fig. 1). This limited elevation range means we expect minimal change in snow-rain partitioning over the glacier area. The climate is dominated by prevailing westerlies, resulting in approximately 4–6 m a−1 precipitation and an estimated average annual temperature of 0.5°C (Kerr and others, Reference Kerr, Owens, Rack and Gardner2009).
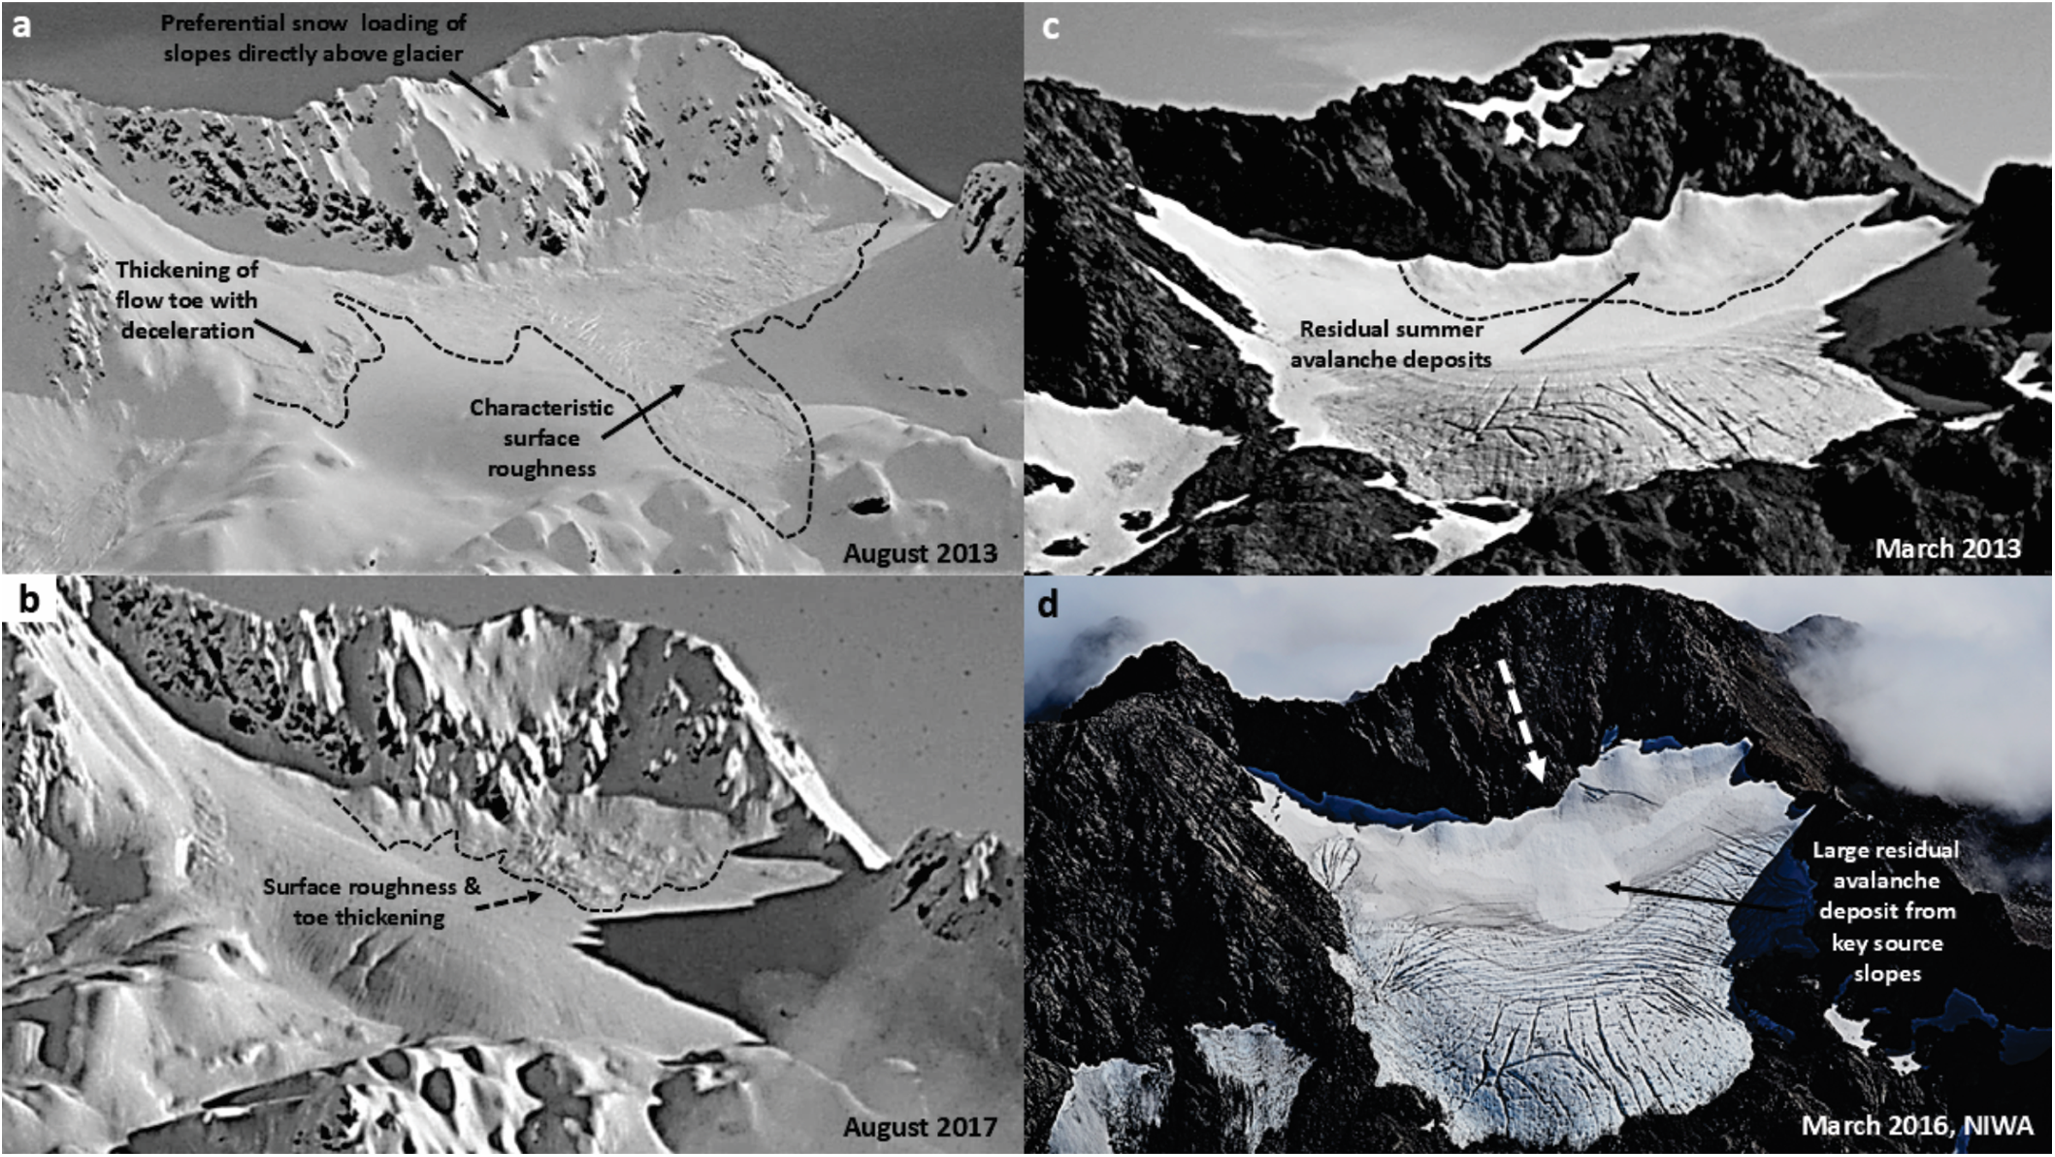
Direct measurement of the mass balance of the Rolleston Glacier began in 2010 (Fig. 2). Researchers visit the glacier twice each year. In November, measurements of snow depth and snow density are made, and four ablation stakes are installed. At the end-of-summer, in late March, the stakes are remeasured to record the surface melting, and the depth and density of any remaining snow are measured. These data are submitted to the World Glacier Monitoring Service (WGMS, Reference Zemp, Nussbaumer, Gärtner-Roer, Bannwart, Paul and Hoelzle2021). Since the start of the programme, only 3 years have recorded a positive mass balance. Cumulative mass balance 2010–25 was −11.5 m w.e. (−0.8 m w.e. a−1), and since 2017 the rate of loss has increased to −1.2 m w.e. a−1 (Fig. 2). Year-to-year, the winter balance (bw) is relatively consistent, averaging around + 2.7 m w.e. (standard deviation ± 0.4 m w.e.), while summer balance (bs) varies from −2.3 to −4.7 m w.e. ± 0.8 m w.e. The long-term equilibrium altitude (ELA), as determined by end-of-summer snowline (EOSS) monitoring, is 1763 m a.s.l., but since 2010, the average ELA has been 1820 m a.s.l. (Fig. 1b) (Macara, Reference Macara2024). In some years, field observations at the end-of-summer record that the only snow remaining on the glacier is in the avalanche run-out and snow deposited immediately below the glacier headwall (Fig. 3c and d).
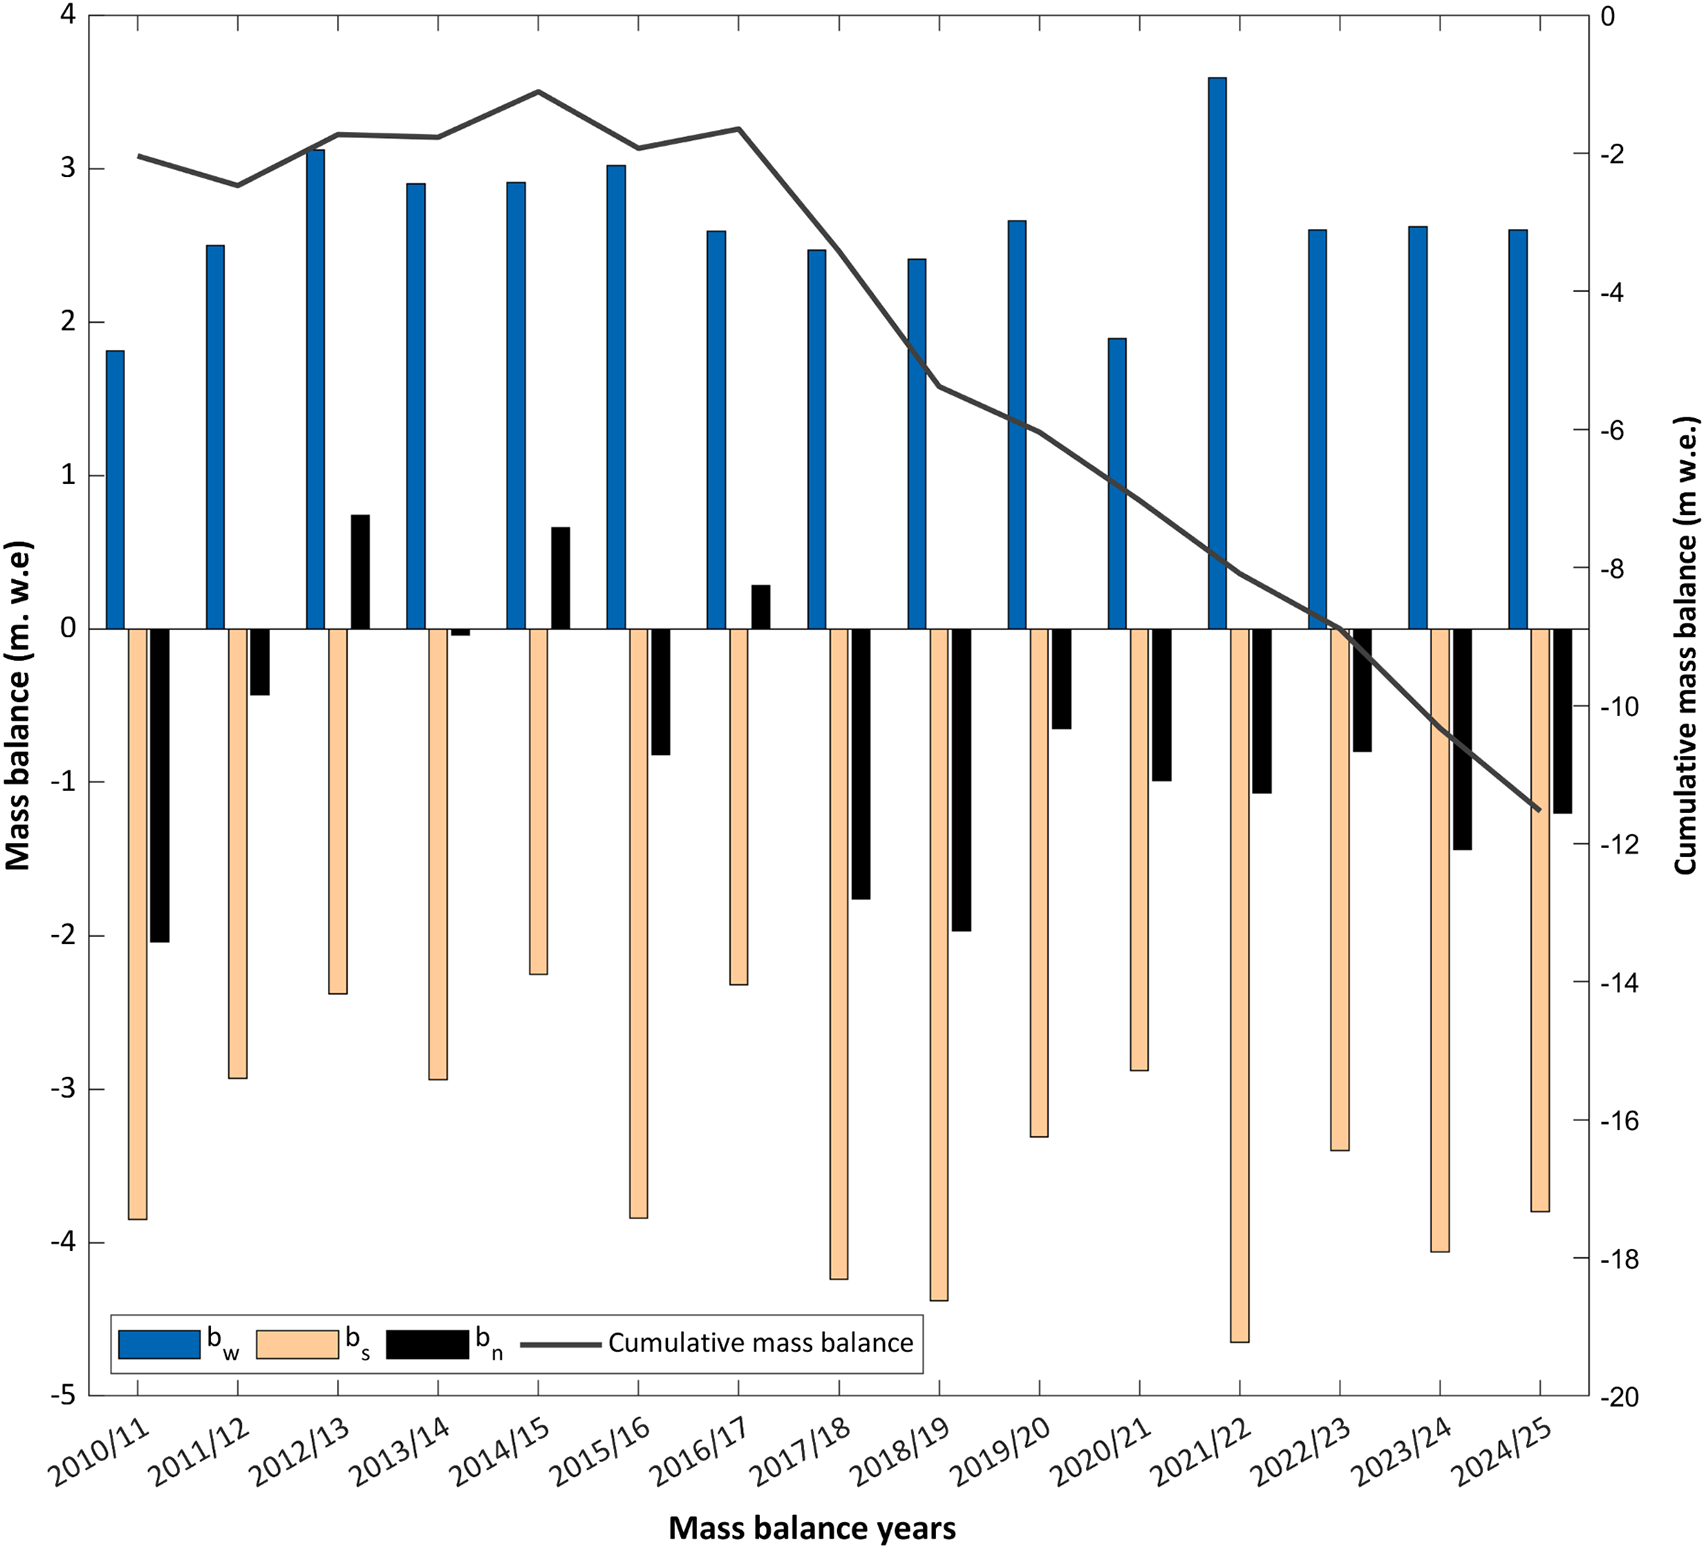
Figure 2. Directly measured mass balance for Rolleston Glacier, showing the winter (bw), summer, (bs) and net (bn) balances as well as the cumulative balance (grey line) for 2010–25.

Figure 3. Development (a, b) and persistence (c, d) of avalanche accumulated snow in winter at Rolleston Glacier. Images a–c were captured by remote camera, and image d by the 2016 NIWA end-of-summer snowline survey (Willsman and others, Reference Willsman, Chinn and Macara2017).
In addition to mass balance data derived from direct measurement, snow depth was measured by ground penetrating radar (GPR) in 2012 and 2013 (see S1 and Purdie and others, Reference Purdie2015, for details). Surface velocities, measured between 2010 and 2015, indicated that glacier dynamics are subdued, with annual average velocities <10 m a−1. A maximum velocity (9.7 m a−1) was recorded at the stake closest to the snow pit, and a minimum (3.4 m a−1) at the uppermost stake (Fig. 1b). In 2008, point measurement of ice thickness estimated that the glacier was ∼ 70 m thick (B. Anderson, unpublished, Fig. 1b); subsequently, the glacier has thinned by 20 m. A remote camera installed on a ridge directly opposite the glacier recorded intermittent oblique imagery during 2013, 2016 and 2017. At the end-of-summer in 2021 and 2022, lidar surveys were flown from which high-resolution digital elevation models (DEMs) were generated, and we obtained two DEMs generated from late summer Pléiades satellite imagery for 2018 and 2023 (Berthier and others, Reference Berthier2024) (see S2 and S3 for processing details).
3. Methods and results
Our first step is a qualitative assessment of the development and persistence of avalanche deposition at Rolleston Glacier captured by a remote camera (Fig. 3a–c) and the EOSS survey (Willsman and others, Reference Willsman, Chinn and Macara2017) (Fig. 3d). During winter and spring, the eastern slopes of Mt Philistine are preferentially loaded with snow, due to their location lee to prevailing westerly wind. Snow then avalanches down onto the glacier. This can occur as sluffing, which builds distinct cone features close to the glacier headwall (Fig. 3b), or as larger events depositing snow across the full length of the glacier (Fig. 3a). These winter deposits exhibit characteristic toe thickening associated with flow deceleration (Li and others, Reference Li, Sovilla, Jiang and Gaume2020). The avalanched snow then persists through summer (Fig. 3c), often as smaller snow cones close to the glacier headwall (Fig. 3c) but in some years as larger deposits (Fig. 3d).
To gain a first approximation of the enhanced snow accumulation in the upper part of the glacier, we combined all 15 years of our end-of-winter snow depth measurements (n = 911) in a Geographic Information System. Most data were collected with a snow probe but supplemented with snow depth derived from the 2013 GPR survey. Our probe measurements often underestimate snow depth close to the headwall due to the depth exceeding probe length, so the GPR data helps fill this gap. We acknowledge this creates bias towards the 2013 snow depth data. To minimise this bias, snow depths obtained by GPR data were averaged at 20 m intervals (n = 154), to align with the spacing of annual probe data. For each snow depth, we calculate the distance of each point from the glacier headwall (Figs. 4a and S1). We find that snow depth is generally 2–4 m greater within 100 m of the glacier headwall than it is further down-glacier (Figs. 1b and 4a).
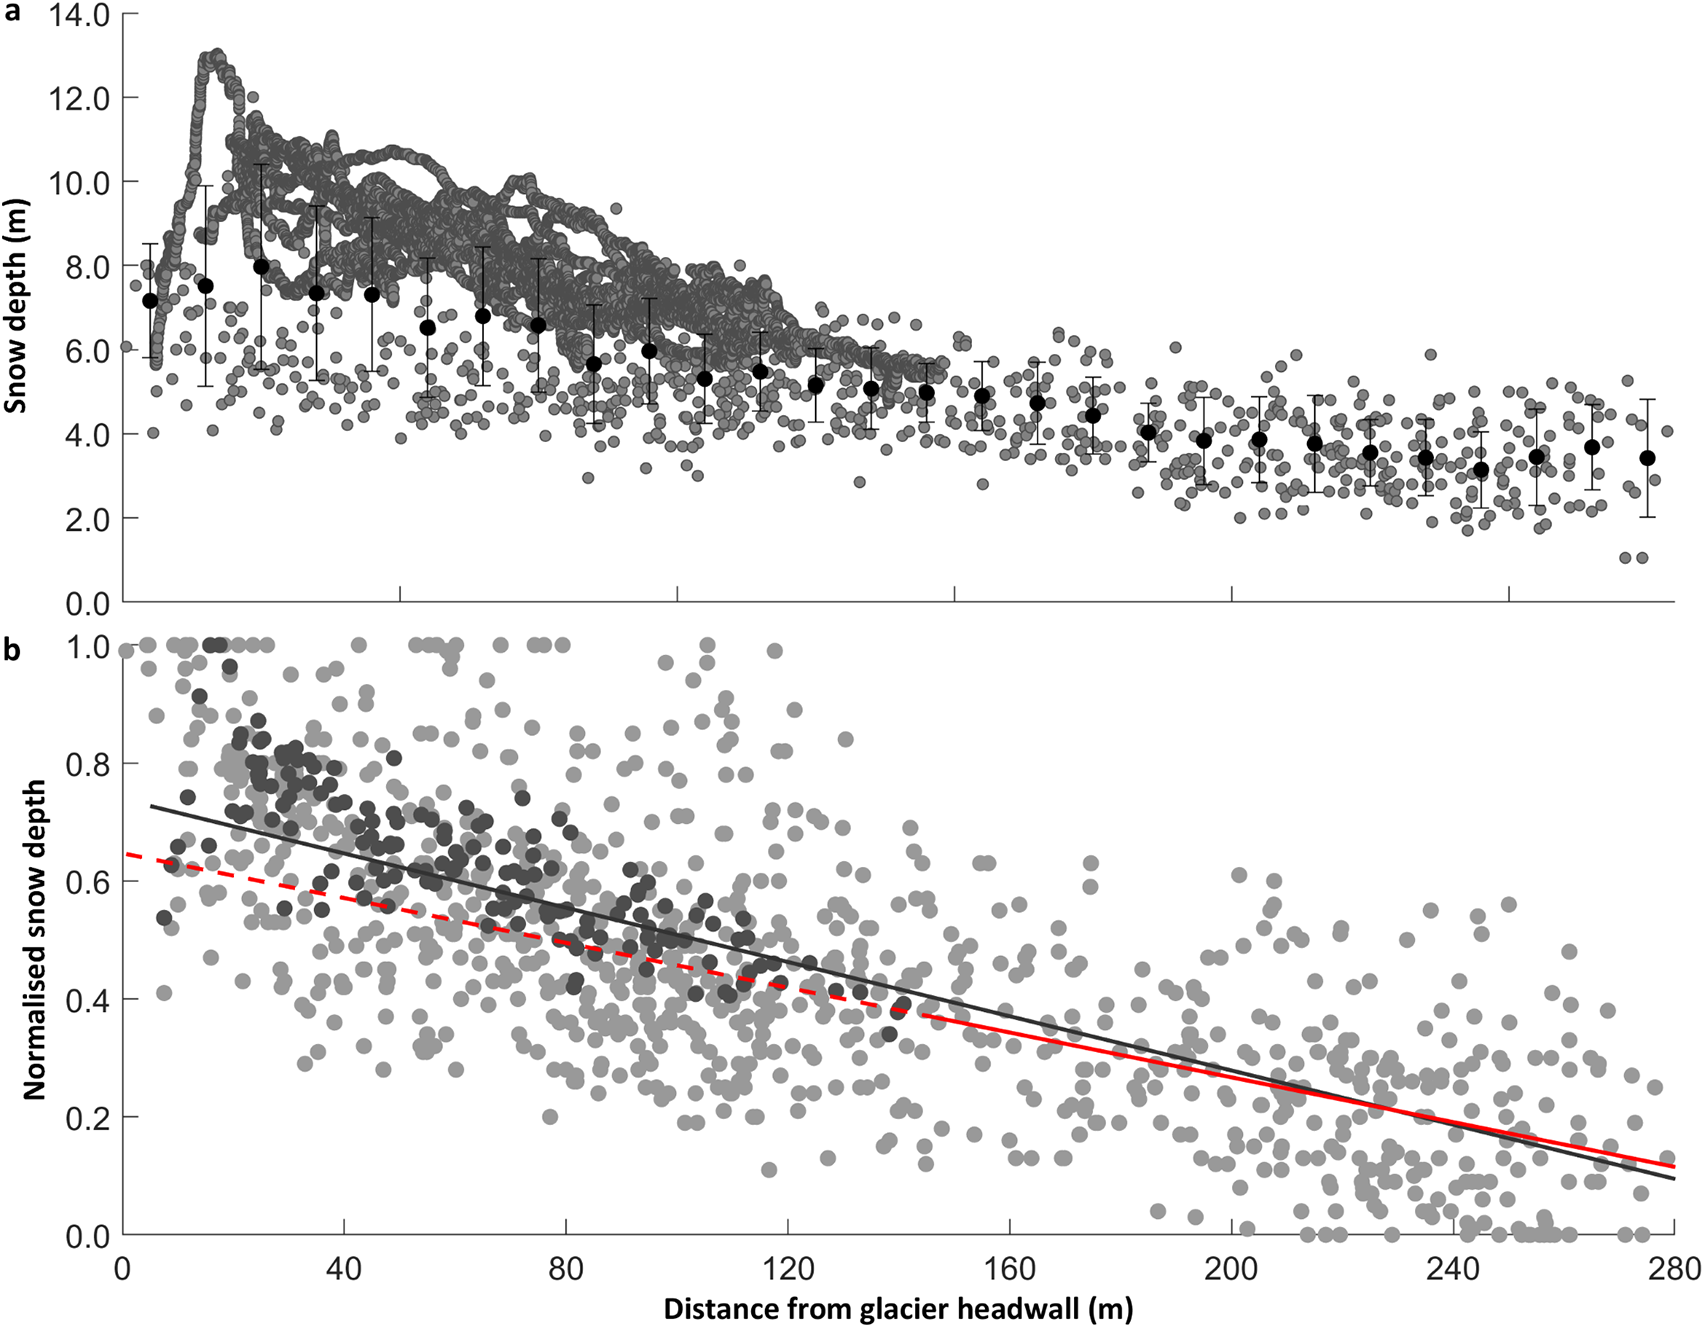
Figure 4. (a) Measured winter snow depth (probe + GPR, grey points) and average snow depth (black) with distance from the glacier headwall. Averages calculated for 20 m bins and error bars are 1 standard deviation (1 SD), (b) normalised winter snow depth (probe, light grey + GPR, dark grey) in relation to distance from the glacier headwall. The solid grey line shows a linear down-glacier trend in normalised snow depth, and the solid red line the linear trend based on data points beyond the avalanche run-out (≥150 m). The dashed red line is the estimated normalised accumulation after subtraction of the headwall enhancement (also see S1).
To remove interannual variability and estimate what snow depth might be without the additional avalanche input, we first normalise the snow depth data using a maximum-minimum approach (S1). We plot the linear trend of all normalised snow depths against distance from the glacier headwall, then fit a second trendline to data beyond the observed avalanche runout (≥150 m) (Figs. 3 and 4b). We apply a linear relationship, derived from measured snow depth on the lower glacier (beyond the avalanche runout), to estimate snow depth at each measurement point on the upper glacier (Fig. 4b). Finally, we calculate a percentage change between the sum of measured snow depth and the sum of the modelled snow depth, finding a difference of 8% ± 2%, which we attribute to secondary accumulation processes (S1), acknowledging the large uncertainties associated with taking a simple linear approach.
Finally, to explore whether the observed avalanche input makes a measurable difference to net changes at the glacier-scale, we apply geodetic methods (Robson and others, Reference Robson, Nuth, Nielsen, Girod, Hendrickx and Dahl2018), focusing on the time-period of accelerated mass loss (i.e. 1.2 m w.e. a−1 post 2017, Fig. 2). Utilising a combination of Pléiades satellite derived DEMs made available through the Pléiades Glacier Observatory (2018 and 2023) (Berthier and others, Reference Berthier2024), as well as airborne lidar (2021 and 2022) data. DEMs were co-registered and differenced over various time steps. The resulting surface elevation changes (Fig. 5) were converted to mass by assuming a density of 850 ± 60 kg m−3 (following Huss, Reference Huss2013), before being integrated over the glacier area to determine the geodetic mass balance (Table 1). Systematic uncertainties were determined using the method set out by Hugonnet and others (Reference Hugonnet2022). We make no correction for ice velocity due to the glaciers’ subdued dynamics. For further details of the method, see supplementary material S2 and S3.
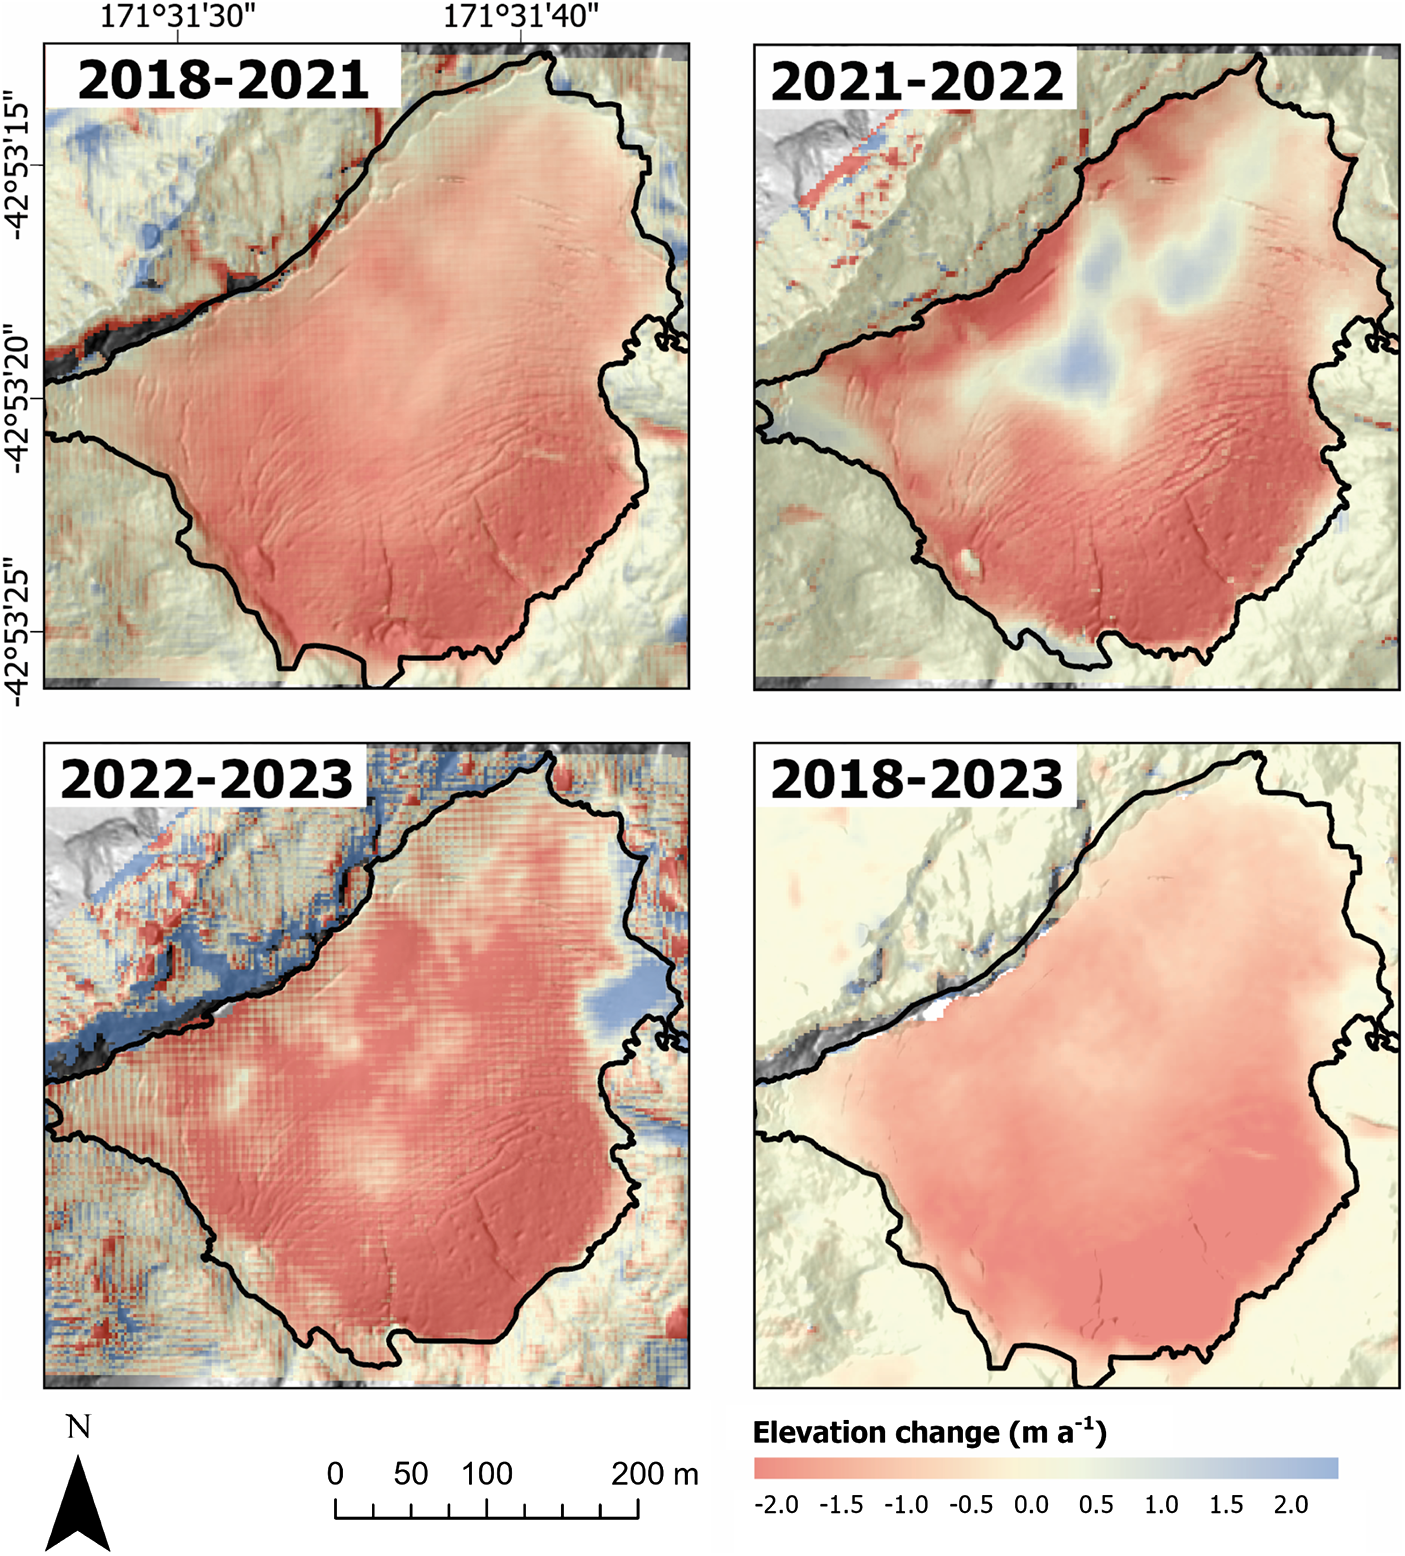
Table 1. Comparison of mass balance estimates (m w.e.). From direct measurement and geodetic measurement 2018–23. An adjustment was applied to the geodetic estimate to align the different time periods between methods (S3).
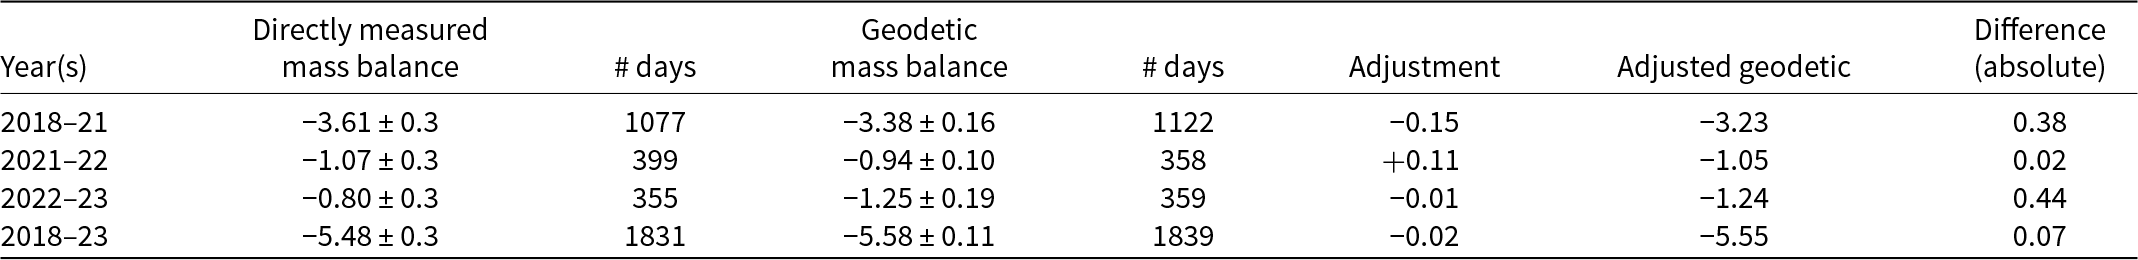
Comparison of the directly measured mass balance with the geodetic mass balance demonstrates that any differences are within the envelope of error estimation (Table 1). The only time period with any notable increase in surface elevation was 2021/22 (Fig. 5). That year was characterised by the most positive bw but also the most negative bs of the mass balance time series (Fig. 2). Despite the large bw, significant surface lowering still occurred in the upper accumulation area (Fig. 5). In the 2022/23 mass balance year, a small increase in surface elevation was identified at the eastern glacier margin (Fig. 5). This wedge likely formed from a combination of avalanche deposition and snow drift from prevailing west-north-west winds trapping snow against the protruding ridgeline. In March 2025, it was observed that this region had become detached from the main glacier, separated by newly exposed bedrock. Notably, the overall trend is glacier thinning, even in the headwall region where we observe the avalanche input.
4. Discussion
The 15 years of mass balance monitoring at Rolleston Glacier highlights that despite relatively consistent bw, year-on-year the glacier is losing mass (Fig. 2). We set out to examine mass balance characteristics of Rolleston Glacier and consider whether avalanche input might make a difference to glacier survival. However, despite estimating that secondary accumulation processes contribute approximately 8% more snow to the glacier, our geodetic analysis revealed net thinning over the entire glacier including regions subject to avalanche deposition.
We acknowledge our methodological approach does not enable the separation of avalanche input from snow delivered by preferential deposition or wind drift. Indeed, preferential deposition will drive initial snow loading on the slopes immediately above the glacier headwall (Lehning and others, Reference Lehning, Lowe, Ryser and Raderschall2008; Dadic and others, Reference Dadic, Mott, Lehning and Burlando2010), highlighting that secondary accumulation processes are not mutually exclusive. While sensitivity studies can help to tease out uncertainties in accumulation attribution (e.g. Terleth and others, Reference Terleth, van Pelt and Pettersson2023; Kneib and others, Reference Kneib2024b), a general lack of site-specific wind data has been (e.g. Liston and Sturm, Reference Liston and Sturm1998; Oerlemans, Reference Oerlemans2001; Lehning and others, Reference Lehning, Lowe, Ryser and Raderschall2008; Dadic and others, Reference Dadic, Mott, Lehning and Burlando2010) and still remains a key limitation to modelling efforts (Sauter and others, Reference Sauter2025).
Avalanche deposits are characterised by increased surface roughness (Kneib and others, Reference Kneib2024b) and density (de Scally, Reference de Scally1992). Indeed, our previous attempts to sample the density of avalanche runout were unsuccessful, the snow is too compact for standard density samplers. The albedo of avalanched snow is also commonly lower than its source snow due to debris entrainment (de Scally, Reference de Scally1992), so although the higher density contributes more mass, the lower albedo enhances snow melt (de Scally, Reference de Scally1992). However, large avalanche deposits, which persist through summer, can create regions of albedo that are higher than ice (Fig. 3d), meaning the impact of avalanche deposition on surface albedo is complex. Further feedback associated with longwave radiation will also occur as glacier area shrinks and the remaining ice is increasingly surrounded by exposed rock (Fig. 1b) (Aubry-Wake and others, Reference Aubry-Wake, Zéphir, Baraer, McKenzie and Mark2017).
An attribution study by Vargo and others (Reference Vargo2020) found that negative balances in the Southern Alps of NZ, especially the very negative years of 2011 and 2018 were more likely to occur under the influence of anthropogenic warming than they would by natural climate variability alone. Uncertainty remains around the impact of climate warming on snow accumulation and avalanche activity (e.g. Laute and Beylich, Reference Laute and Beylich2018; Mayer and others, Reference Mayer2024). However, previous work has demonstrated that on a global scale, NZ’s maritime glaciers are particularly sensitive to temperature (Anderson and others, Reference Anderson2010, Reference Anderson2021). Given the minimal elevation range of Rolleston Glacier, any future gain will likely be short-lived as the snow-rain threshold rises above surrounding topography. Although Rolleston Glacier receives some additional nourishment from avalanches, based on its current rate of mass loss, we expect it will join the Global Glacier Casualty list (Boyer and Howe, Reference Boyer and Howe2025) by mid-2060.
5. Conclusions and recommendations
Here, we add to the increasing body of literature documenting rapid and accelerating mass loss at a small alpine glacier. Although secondary accumulation processes provide additional snow to Rolleston Glacier, we observe that this extra nourishment is not enough to offset summer melt rates. Mass balance feedback associated with ongoing ice mass thinning in complex mountain terrain is likely contributing to a regime shift, where the glacier no longer sustains an area of net accumulation. Our next steps are to tune a distributed mass balance model to Rolleston Glacier, to allow partitioning of avalanche and wind processes and enable consideration of mass and energy exchange beyond the immediate glacier margin.
Supplementary material
Supplementary material. The supplementary material for this article can be found at https://doi.org/10.1017/aog.2025.10032.
Acknowledgements
The authors would like to acknowledge all the volunteers who have helped maintain the mass balance monitoring programme over the past decade. We thank the University of Canterbury for financial contribution to the mass balance programme, NIWAs ‘Climate Present and Past’ and ‘Alpine Climate’ helped support mass balance and end of summer snowline photography and the Department of Conservation for supporting our research permit. The Pléiades satellite data used in this study were provided by the Pléiades Glacier Observatory (Berthier et al. Reference Berthier2024), funded by DINAMIS, the French national infrastructure for shared access to very high-resolution satellite imagery.


 Open access