Introduction
Porphyry copper deposits are the major source of Re as a by-product (Dill, Reference Dill2010) and molybdenite is the only economically significant carrier of this element. Rhenium is currently ranked as a critical metal in very short supply in Russia (Trach and Beskin, Reference Trach and Beskin2011), making the study of the rhenium distribution in known deposits very relevant. For this reason porphyry copper deposits of the Urals have recently attracted attention as potential sources of both molybdenum and rhenium. General features of rhenium distribution in Uralian porphyry copper deposits were discussed by Grabezhev (Reference Grabezhev2013) while the rhenium behaviour of individual deposits and within single grains of molybdenite has been described recently (e.g. Grabezhev and Shagalov, Reference Grabezhev and Shagalov2010; Grabezhev and Gmyra, Reference Grabezhev and Gmyra2014; Grabezhev and Hiller, Reference Grabezhev and Hiller2015; Grabezhev and Voudouris, Reference Grabezhev and Voudouris2015; Plotinskaya et al., Reference Plotinskaya, Grabezhev and Seltmann2014a, Reference Plotinskaya, Grabezhev and Seltmann2015). Among the numerous porphyry deposits and occurrences known in the Urals (Plotinskaya et al., Reference Plotinskaya, Chugaev and Seltmann2017a,Reference Plotinskaya, Grabezhev, Tessalina, Seltmann, Groznova and Abramovb) the area of the Birgilda-Tomino ore cluster is one of the most interesting due to a remarkable variability of styles of mineralization (Plotinskaya et al., Reference Plotinskaya, Grabezhev, Groznova, Seltmann and Lehmann2014b) and it is economically promising because of the large Tomino porphyry copper deposit. The rhenium distribution in molybdenite from the Tomino deposit was described by Grabezhev and Hiller (Reference Grabezhev and Hiller2015).
The present study has provided new mineralogical, electron microprobe analysis (EMPA) and laser ablation inductively coupled plasma mass spectrometry (LA-ICP-MS) data from molybdenite from two porphyry copper deposits of the Birgilda-Tomino ore cluster, Kalinovskoe and Birgilda. The main goal of this paper is to describe, at the scale of single molybdenite flakes, the distribution of rhenium and other trace elements as well as to discuss the controls of this distribution.
Geological background
The general geology and tectonic setting of the Birgilda-Tomino ore cluster were described in detail by Puzhakov (Reference Puzhakov1999), Grabezhev et al. (Reference Grabezhev, Kuznetsov and Puzhakov1998) and Plotinskaya et al. (Reference Plotinskaya, Grabezhev, Groznova, Seltmann and Lehmann2014b, Reference Plotinskaya, Chugaev and Seltmann2017a,Reference Plotinskaya, Grabezhev, Tessalina, Seltmann, Groznova and Abramovb). The ore cluster is located within the East-Uralian Volcanic Terrane (the shaded area in the inset of Fig. 1a) which is interpreted as a series of fragments of intra-oceanic arcs of Silurian to Devonian age (Yazeva and Bochkarev, Reference Yazeva and Bochkarev1995; Samygin and Burtman, Reference Samygin and Burtman2009; Puchkov, Reference Puchkov2017). The northeastern part of the area (Fig. 1a) comprises the Early to Middle Ordovician Sargazy Formation with a maximum thickness of 1500 m. It is composed of aphyric basalt and andesitic basalt supplemented by minor porphyric basalt and basaltic volcanoclastic rocks, as well as rhyolite and rhyolite tuffs metamorphosed to greenschist facies (Puzhakov, Reference Puzhakov1999). This formation hosts all known porphyry copper deposits in this area. In the central part of the area, the Sargazy basalts are overlain by Middle Ordovician to Lower Silurian limestones and marbles of the Biksizak Formation that host the Biksizak base-metal carbonate replacement deposit. The Sargazy basalts and the Biksizak Formation are overlain in turn by volcanics of the Bereznyakovskoe Formation which hosts epithermal Au-Ag deposits and occurrences, including the Bereznyakovskoe ore field. The Bereznyakovskoe Formation comprises andesitic dacite volcanoclastic rocks up to 1000 m thick and minor andesitic dacite lavas with rare limestone interlayers (Grabezhev et al., Reference Grabezhev, Kuznetsov and Puzhakov1998; Puzhakov, Reference Puzhakov1999). Younger sediments include Upper Silurian to Middle Devonian limestone, Givetian to Famennian sediments (siltstones, schists, sandstones with minor limestone), Visean volcanics, and Visean to Moscovian terrigenous-carbonate sequences (Puzhakov, Reference Puzhakov1999). Numerous diorite and andesite porphyry stocks of the Birgilda–Tomino Igneous Complex, dated as 428 ± 3 Ma and 427 ± 6 Ma (Grabezhev et al., Reference Grabezhev, Bea, Montero and Fershtater2013), are believed to have produced both porphyry and epithermal-style mineralization (Grabezhev et al., Reference Grabezhev, Kuznetsov and Puzhakov1998; Puzhakov, Reference Puzhakov1999). The Chelyabinsk Pluton, located in the northernmost part of the area, comprises several Late Devonian to Permian intrusive phases (Kallistov, Reference Kallistov2014).
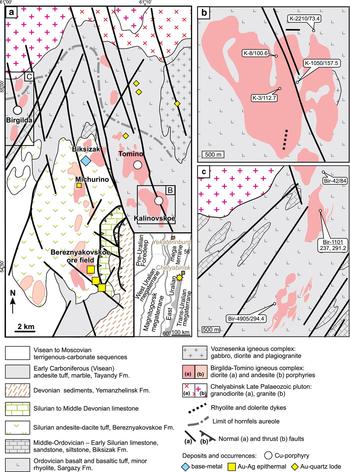
Fig. 1. Geological maps of the Birgilda-Tomino ore cluster: (a) the Kalinovskoe deposit, modified after Grabezhev et al. (Reference Grabezhev, Sazonov, Murzin, Moloshag, Sotnikov, Kuznetsov, Pyzhakov and Pokrovsky2000); (b) modified after Chelyabinskgeolsiomka JSC and Puzhakov (Reference Puzhakov1999); (c) The Birgilda deposit, simplified after Narykova et al. (Reference Narykova, Kurchevskaya and Yakhno2015). The inset in (a) shows the East-Uralian volcanic terrane highlighted in grey and the yellow star indicates the position of the Birgilda-Tomino ore cluster.
The Kalinovskoe deposit
The Kalinovskoe porphyry copper deposit (Fig. 1b) together with the neighbouring Tomino deposit and several smaller occurrences make up the Tomino porphyry copper ore field. Porphyry-style mineralization is confined to a large stock, ~2 km in diameter, composed of quartz diorite, amphibole plagioclase diorite and porphyritic varieties, which belong to the Birgilda-Tomino Igneous Complex. The mineralization occurs both in diorites and in hosting Ordovician basalts. In the central zones of the diorite stocks, phyllic alteration accompanies chalcopyrite ± bornite ± molybdenite mineralization, while in the peripheral zone, propylitic alteration dominates with pyrite-chalcopyrite mineralization and occasional magnetite and hematite. The latest-stage mineralization, which occurs in the periphery of the Kalinovskoe deposit, includes various Bi-sulfosalts (bismuthinite–aikinite series, matildite), native gold, galena, sphalerite, tetrahedrite (Plotinskaya et al., Reference Plotinskaya, Grabezhev, Groznova, Seltmann and Lehmann2014b) with bornite, chalcopyrite and rare Au-Ag, Ag, Pb, Bi, and Hg tellurides. The oxidation zone is up to 40 m thick and contains malachite, azurite and chalcocite. The total reserves (Russian A + B + C categories) of the Tomino and Kalinovskoe deposits make up 331 Mt at 0.46 wt.% Cu and 0.1 g/t Au (Volchkov et al., Reference Volchkov, Kuznetsov and Nikeshin2015). Grabezhev (Reference Grabezhev2013) reported Cu/Mo ratios from 100 to 300, but Mo occasionally rises to 3–80 ppm which decreases the Cu/Mo ratios to 25–50.
The Birgilda deposit
The Birgilda deposit (Fig. 1c) was the first porphyry-style mineralization discovered in the area (Romashova, Reference Romashova1984). The mineralization is associated with two stocks of diorite and diorite porphyry known as South and North Birgilda, respectively; each ~1 km in size. The diorites are altered pervasively to quartz-sericite (phyllic) and mixed chlorite-sericite, while propylitic (chlorite ± epidote) alteration dominates in the host basalts. Pyrite, chalcopyrite and molybdenite are the main ore minerals. Both the mineralization and the alteration are similar to those at Kalinovskoe. The Birgilda deposit was reported by Pravda (2015) to contain 152.2 kt of Cu at 0.51 wt.% Cu. Grabezhev and Belgorodskii (Reference Grabezhev and Belgorodskii1992) noted a Cu/Mo ratio of 150.
Molybdenite assemblages and sampling
Molybdenite occurs in both study areas as μm- to mm-scale nests, usually in white to grey quartz veinlets or, sometimes, disseminated in the host rocks. It occurs mainly within the diorite intrusions where it is accompanied by quartz + sericite ± chlorite alteration, but it is also observed in the host basalt. Molybdenite is always associated with chalcopyrite, chlorite, sometimes with pyrite, white mica, and, occasionally, with epidote and carbonate.
Molybdenite-bearing samples were collected from exploration drill cores. Samples were selected for EMPA and LA-ICP-MS analysis to represent both the central and the peripheral zones of the deposits studied (Fig. 1b,c) as well as from diorite and basalt host rocks. A detailed description of both samples is given in Table 1 and images in Figs 2 and 3. The two most molybdenite-rich samples (K-3/112.7 and Bir-1101/237) were selected for Re-Os dating.
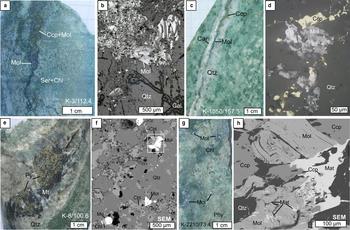
Fig. 2. Molybdenite from Kalinovskoe: (a,b) sample K-3/112.7, molybdenite (Mol) and chalcopyrite (Ccp) in quartz (Qtz) veinlet in a sericite-chlorite (Ser + Chl) rock; (c,d) sample K-1050/157.5, molybdenite and chalcopyrite cutting a quartz veinlet in an altered diorite; (e,f) sample K-8/100.6, pyrite (Py) and magnetite (Mt) in a quartz veinlet with minor molybdenite; (g,h) sample K-2210/73.4, quartz-sericite altered (Phy) diorite with nests of molybdenite; (h) molybdenite intergrown with chalcopyrite and overgrown by matildite (Mat). ‘SEM’– scanning electron microscope images; (a,c,e,g) – hand specimens; (b,d) – reflected light images.
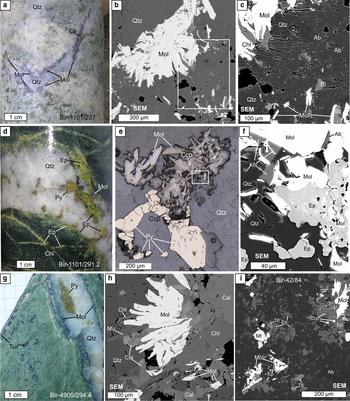
Fig. 3. Molybdenite (Mol) from Birgilda: (a–c) sample Bir-1101/237, molybdenite nests intergrown with chlorite, albite (Ab) and biotite (Bi) in selvages of a quartz veinlet; (d–f) sample Bir-1101/291.2, molybdenite intergrown with pyrite, chalcopyrite, epidote (Ep), albite and K-feldspar (Kfs); (g,h) sample Bir-4905/294.4, molybdenite overgrown by calcite (Cal), muscovite (Mu) and chlorite; (i) sample Bir-42/84, molybdenite flakes in basalt altered to an albite, epidote assemblage with magnetite, titanite (Tit) and chalcopyrite. ‘SEM’ – scanning electron microscope images; (a,d,g) – hand specimens; (e) – reflected light images.
Table 1. Molybdenite-bearing samples selected for this study.
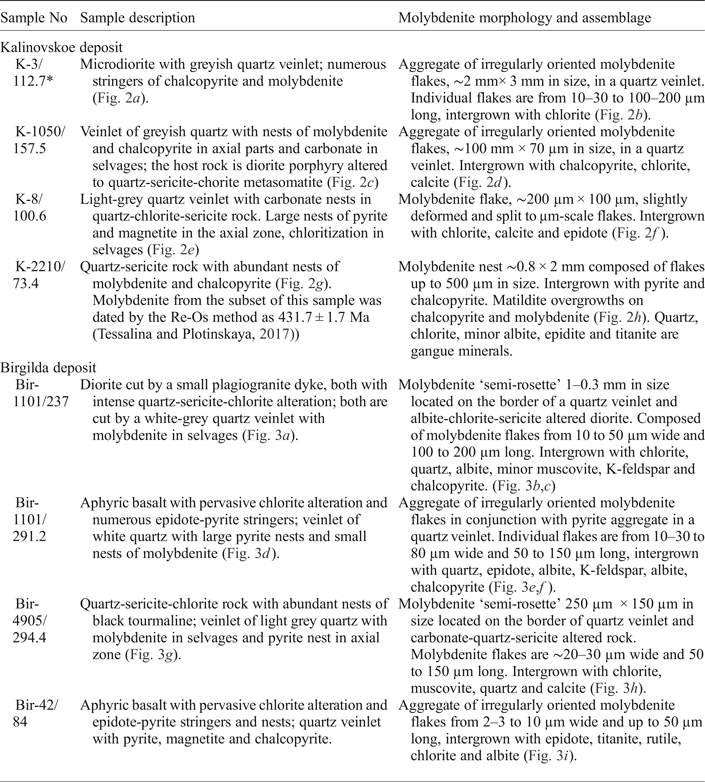
* Drill hole number/depth in m.
Analytical methods
Re-Os dating of molybdenite
Molybdenite-bearing samples were crushed and grains intergrown with molybdenite were handpicked using a needle under a binocular microscope. Molybdenite-rich separates (~25 to 30 mg) were transferred into Carius tubes resting in dry ice, followed by the addition of a mixed 188Os-190Os/185Re spike as recommended by Markey et al. (Reference Markey, Hannah, Morgan and Stein2003) and digested in ‘inverted aqua regia’. The sealed tubes were placed in an oven at 220°C and allowed to react for 48 h. Osmium was separated by solvent extraction, with a final purification of Os by microdistillation. Rhenium was separated from a portion of the residual liquid using anion exchange chromatography. Isotopic measurements were made by means of a Thermo-Ionization Mass-Spectrometer (TIMS) Triton™ instrument using the Faraday collectors for both Re and Os. Measured Os isotope ratios were first corrected for contributions from natural Os (based on preliminary isotope dilution calculations), then corrected for mass fractionation based on the 190Os/188Os ratio of the spike. 187Os was determined from the 187Os/188Os ratio of the mixture and corrected for minor contributions from total common Os (blank plus sample). Most of the error in both the Re and Os concentrations is from the uncertainties of the spike calibrations and the mass spectrometric measurements, an error magnification factor, uncertainties on blank corrections and, for the age determination, uncertainty in the decay constant for 187Re. The weighing error of the sample does not contribute to the uncertainty in the ages because of a mixed-double 188Os-190Os/185Re spike used (Markey et al., Reference Markey, Hannah, Morgan and Stein2003). Analytical blanks are insignificant for the age calculations, given the Re and 187Os concentrations of the samples studied and the sample size used in the analyses. Blank values were 1 pg/g for Re and 4 pg/g for Os with 187Os/188Os of 0.15. The uncertainty for each individual age determination does not exceed 0.5%, including the 0.3% uncertainty in the decay constant of 187Re.
EMPA study
The chemical compositions of ore and gangue minerals were determined using a Zeiss EVO 15LS scanning electron microscope with an Oxford Instruments X-Max EDX detector (Natural History Museum, London) using the following beam conditions: beam diameter 1–2 µm, accelerating voltage 20 kV, beam current 3 nA, and a counting time of 20 s. The 1σ analytical error was 0.06–0.08 for Mn and Cr and did not exceed 0.2 wt.% for all other elements. The detection limit was accepted as 1σ.
The molybdenite composition was determined using a Cameca SX-100 electron microprobe with five WDX spectrometers (Natural History Museum, London, UK). X-ray mapping using ReLα, ReMα, MoLα, SKα, CaKα, SiKα, FeKα, and ZnKα was carried out first, and points for single spot analysis were then selected from the resulting X-ray map data.
For the Kalinovskoe deposit the operating conditions were: beam diameter 1–2 µm, accelerating voltage 20 kV, beam current 20 nA, and analytical lines ReLα, MoLα, ZnLα and SKα. Counting time was: 60 s for S, 120 s for Zn, 240 s for Mo, and 240 s for Re. The peak overlaps were corrected for 0.002% Mo/S and 0.04% S/Mo. The detection limits were (wt.%): 0.06 for S, 0.03 for Re and Zn and 0.02 for Mo. Standard deviation was (wt.%): 0.33 for S, 0.03 for Re, 0.02 for Zn and 0.40 wt. for Mo.
For the Birgilda deposit the conditions were: beam diameter 1–2 µm, accelerating voltage 20 kV, beam current 40 nA, and analytical lines SiKα, SKα, FeKα, ZnLα, SeLα, MoLα, TeLα, ReLα, WLα. The counting time was: 20 s for Si and Zn, 30 s for Se, 100 s for Mo, and 120 s for S, Fe, Te, Re and W. The data were corrected for peak overlaps as following: 85.04% for Re/Zn, 4.16% for Mo/S, 0.35% for Zn/Mo, 0.16% for Si/Re, 0.14% for W/Re, 0.18% for W/Zn, 0.07% for W/Mo, −0.14% for S/Mo and −0.12% for Re/Mo. The detection limits were (wt.%): 0.04 for Re, S, Mo, and W, 0.05 for Zn, 0.03 for Fe, 0.02 for Se and Te, 0.01 for Si. Standard deviation was (wt.%): 0.04 for Re and Zn, 0.61 for S, 0.38 for Mo, 0.03 for W, 0.02 for Fe, Se and Te, and 0.01 for Si. The following reference materials were used: metallic Fe, W, Re and Mo, fayalite for Si, PbSe for Se, BiTe for Te and sphalerite for Zn and S.
LA-ICP-MS study
The trace-element data for molybdenite were acquired using the LA-ICP-MS system at IGEM RAS (Moscow). The LA-ICP-MS consists of a New Wave 213UP laser coupled with the Thermo X Series2 quadrupole ICP-MS. The following isotopes were measured Si29, S33, Fe57, Co59, Ni60, Cu65, Zn66, As75, Se77, Mo95, Ag107, Sn118,Sb121,Te125, W182, Re185, Re187, Au197, Pb208 and Bi209. For external calibration the following standard reference materials (SRM) were used: in-house pyrrhotite standard Fe0.9S, synthesized using the method of Wohlgemuth-Ueberwasser et al. (Reference Wohlgemuth-Ueberwasser, Ballhaus, Berndt, Stotter née Paliulionyte and Meisel2007) and calibrated with respect to concentration of elements against standards at UQAC (Sylvester et al., Reference Sylvester, Cabri, Tubrett, McMahon, Laflamme and Peregoedova2005) for Fe, Ag, Re, Au; MASS-1 polymetal sulfide (USGS) for the remaining elements and 33S was used as the internal standard based on molybdenite stoichiometry. GSE, a synthetic basalt glass with 25 wt.% Si, was used for Si calibration and verification of the other results with Mo as the internal standard. LA-ICP-MS analyses of external standards and molybdenite samples were conducted at the same conditions using a 40 to 60 µm diameter spot size, a laser frequency of 15 Hz, 5–7 mJ input power and 5 µm/s ablation speed for profiles. Acquisition time in spot mode was 30 s for the background and 30 s for the mineral analysis. The washout time was 30 s between measuring individual laser spots. All standards were run before and after each set of 15 unknowns as well as before and after each set of 40 and 60 µm spot sizes. LA-ICP-MS data were processed using the Iolite data-reduction software, v. 2.5 (Paton et al., Reference Paton, Hellstrom, Paul, Woodhead and Hergt2011).
Fluid-inclusion study
Microthermometric measurements of fluid inclusions were carried out on doubly polished thin sections using a LINKAM THM-600 heating-freezing stage at the Institute of Experimental Mineralogy Russian Academy of Sciences, Chernogolovka. The temperature of phase transitions was measured over the range –196 to +600°C with an accuracy of ±0.2°C between –20°C and +20°C and no less than ±1.0°C outside of this interval. The salt composition of the fluids was determined from the eutectic temperature (T e) according to Crawford (Reference Crawford, Hollister and Crawford1981); the salinity was estimated from the temperature of ice melting (T m) using the NaCl–H2O phase diagram (Bodnar and Vityk, Reference Bodnar, Vityk, De Vivo and Frezzotti1994). The measurements were carried out for groups of inclusions with similar relationships of phases to avoid errors related to the disintegration of vacuoles after fluid heterogenization (Roedder, Reference Roedder1984). Pressure was calculated using the method proposed by Kaluzhny (Reference Kaluzhny1982) for coexisting fluid inclusions of CO2 and water–salt composition using diagrams from Thiery et al. (Reference Thiery, Van den Kerkhof and Dubessey1994) and the FLINKOR software (Brown, Reference Brown1989).
Results
Re-Os ages of molybdenite
For the Kalinovskoe and the Birgilda deposits, the molybdenite samples yielded Re-Os ages of 431.9 ± 1.9 and 432.0 ± 1.7 Ma respectively (Table 2). The uncertainty of the individual age determination for both samples is in the order of 0.4%.
Table 2. Re-Os ages and abundance results for the molybdenite samples studied.

Molybdenite chemistry
Kalinovskoe deposit
The EMPA study revealed Re contents above the detection limit in three of the four samples from the Kalinovskoe deposit (Table 3 and Supplementary Material – Appendix 1). From those, the totals of only 41 analyses out of 100 were >98 wt.% because the molybdenite flakes were either too small or too thin. Significant negative correlation was noted between the Re and Mo contents in analyses with a total >99 wt.% (r = –0.56, n = 22) confirming substitution of Mo by Re.
Table 3. Summary EMPA data for trace elements in molybdenite (wt.%).
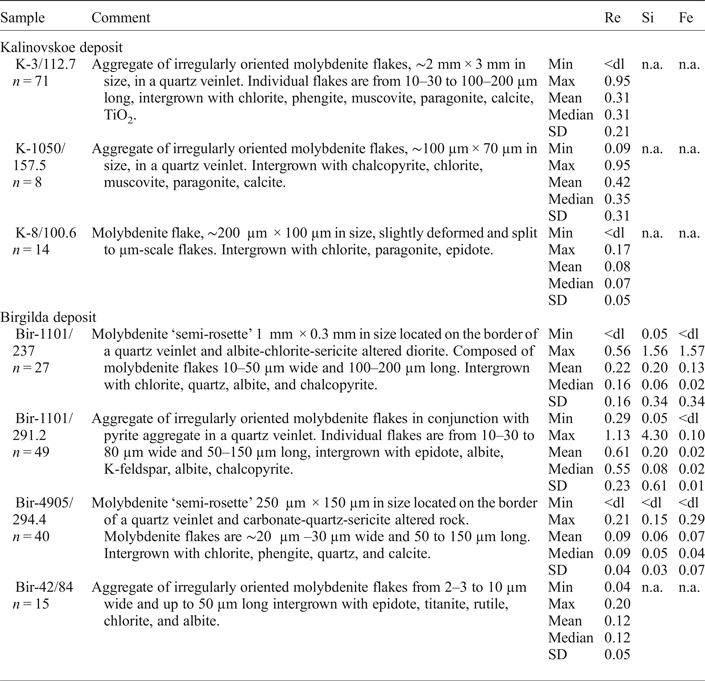
A full set of individual analyses is given in Appendix 1. <dl – below the detection limit; n.a. – not analysed.
X-ray mapping using the ReLα line combined with point analyses revealed an uneven rhenium distribution in all of the molybdenite flakes and, moreover, different distribution patterns in different samples. In sample K-8/100.6 (Fig. 4a,b) a deformed molybdenite flake has an elevated Re content in the central part (0.06 to 0.08 wt.%) and marginal zones (up to 0.17 wt.%) while the Re content of the remaining part of the flake is below the detection limit. In sample K-1050/157.5 (Fig. 4c,d), Re-rich molybdenite (up to 0.95 wt.% Re) overgrows Re-poor molybdenite (up to 0.1 wt.% Re). In sample K-3/112.7 (Fig. 4e,f) in a large aggregate of molybdenite flakes, high Re contents (~0.2 to 0.95 wt.%) form linear zones (up to dozens of μm wide) on the margins of the flakes, or, occasionally spots. K-2210/73.4 is the only sample where the Re contents are below the detection limit. In addition Grabezhev and Hiller (Reference Grabezhev and Hiller2015) reported Re contents as high as 0.05 to 0.07 wt.% in four of 130 point analyses of the subset of this sample.
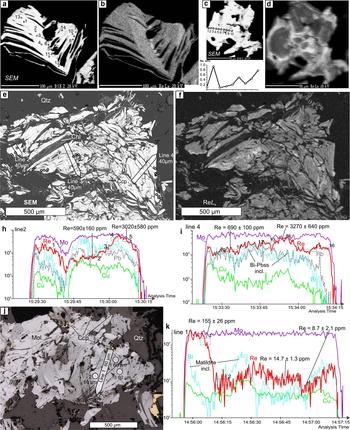
Fig. 4. Molybdenite from Kalinovskoe: (a,b) sample K-8/100.6, (a) SEM image of a deformed molybdenite flake showing the locations of the EMPA analyses; (b) ReLα X-ray map of the same area; (c,d) sample K-1050/157.5, (c) SEM image of a molybdenite flake with EMPA profile, (d) ReLα X-ray map; (e–i) sample K-3/112.7 – (e) SEM image of a molybdenite aggregate with the positions of the EMPA analyses and the LA-ICP-MS profiles, (f) ReLα X-ray map of the same area; (h,i) the LA-ICP-MS spectra for the profiles 2 and 4, respectively; (j) sample K-2210/73.4 with positions of the LA-ICP-MS analyses and profiles; (k) LA-ICP-MS spectra for line 1.
Molybdenite grains large enough to be analysed by LA-ICP-MS were observed only in samples K-3/112.7 and K-2210/73.4. In both samples, molybdenite shows highly variable trace-element concentrations (Table 4 and Supplementary Material – Appendix 2). Both samples show very high Fe contents (up to 34,900 ppm) and Cu (up to 7900 ppm), while sample K-3/112.7 also has a high Si content (up to 12,400 ppm), probably due to intergrowths with chalcopyrite and silicates. Both samples have up to several hundred ppm of Zn, Se and tens of ppm of As, Pb, Bi and Ag (Table 4). The contents of Co, Ni, Sn, Sb, Te and Au are below the detection limit in sample K-2210/73.4 but reach several ppm to tens of ppm in sample K-3/112.7. The opposite is true for W which is up to 4 ppm in sample K-2210/73.4 and mainly below the detection limit in sample K-3/112.7. The maximum Re content in sample K-3/112.7 is 4540 ppm which is in good agreement with the EMPA data (Fig. 4h,i). In sample K-2210/73.4 Re varies from 9 to 1144 ppm with a geometric mean of 75 ppm, in general agreement with the data of Tessalina and Plotinskaya (Reference Tessalina and Plotinskaya2017) who measured 81.5 ppm of Re within the same sample.
Table 4. Summary of molybdenite chemistry (LA-ICP-MS data); the full data are presented in Appendix 2.
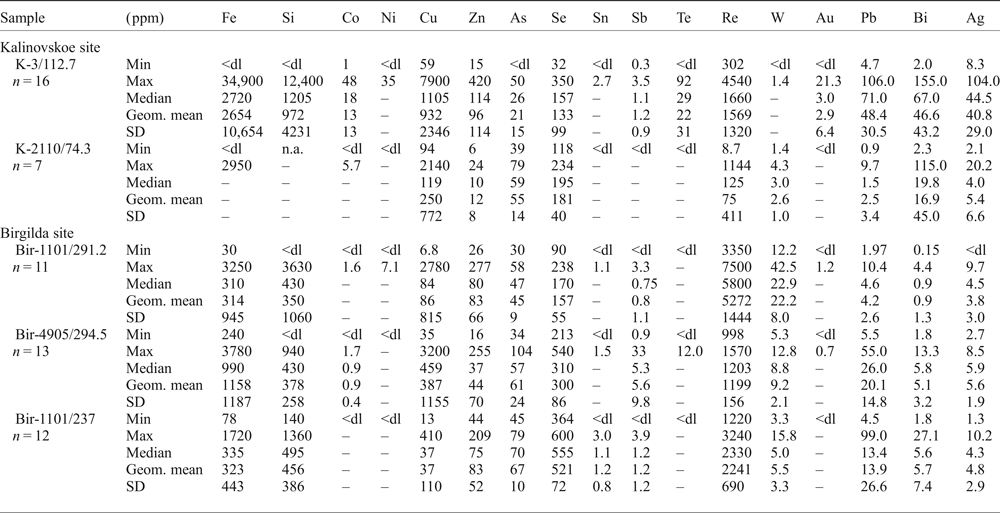
n – number of intervals within LA-ISP-MS profiles selected for calculation; Geom. mean = geometrical mean; dl = detection limit; the values below dl were treated as half dl in the statistical analysis; statistical parameters were not calculated for those datasets where more than half of the values were below dl; n.a. = not analysed.
Table 5. Correlation coefficients for trace elements in molybdenite from the Kalinovskoe site inferred from LA-ICP-MS data: significant* correlation coefficients are highlighted in bold.
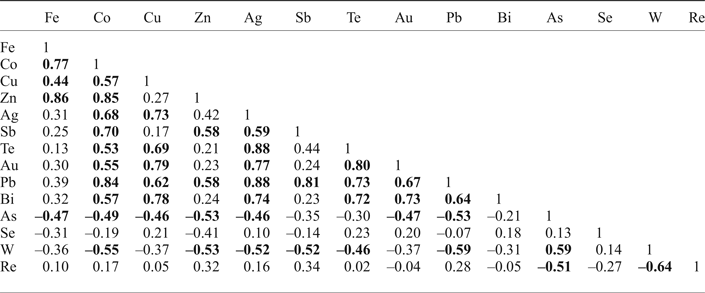
* Minimum significant correlation was accepted as 0.42 for n = 23 for 95% confidence, after (Fisher and Yates, Reference Fisher and Yates1963).
Pearson's correlation coefficients were calculated for the whole dataset of trace elements except for Ni and Sn as these elements are below detection limit in more than a half of all analyses (Table 5). There is a significant positive correlation between Fe, Co, Cu, Zn, Ag, Sb, Te, Au, Pb and Bi. In addition, in sample K-3/112 there is a strong positive correlation between Si and Fe, Co and Zn (0.85, 0.78 and 0.88, respectively, at minimum significant 0.5 for n = 16). Arsenic and W, in contrast, have negative correlations with most trace elements but a positive correlation with each other (0.59). Re has negative correlations with W and As and no correlation with other elements. Se doesn't have either positive or negative correlations with any trace elements.
Birgilda deposit
The EMPA study revealed Re contents above the detection limit in most analyses of all four samples from the Birgilda deposit (Table 3 and Supplementary Material – Appendix 1). The totals were >98 wt.% in 107 of 140 analyses due to the small grain size.
X-ray mapping using the ReLα line revealed an uneven distribution of Re in all the molybdenite flakes (Figs 5–7). In all four samples, Re-enriched zones encompass areas from several μm across in sample Bir-42/84 (Fig. 5a,b) to tens of μm wide (samples Bir-1101/237 and Bir-1101/291.2) and up to hundreds of μm long (Figs 6 and 7). These zones are confined to either axial or marginal parts of molybdenite flakes but are always parallel to the elongation of molybdenite flakes. In contrast, in sample Bir-4905/294.4 (Fig. 5c–f), Re is confined to several less clearly defined zones which are μm wide and tens of μm long striking across molybdenite flakes. The largest Re contents (0.29–1.13 wt.%) were detected in sample Bir-1101/291.2 while the smallest (0.04–0.21 wt.%) were recorded in sample Bir-4905/294.4 (Table 3).
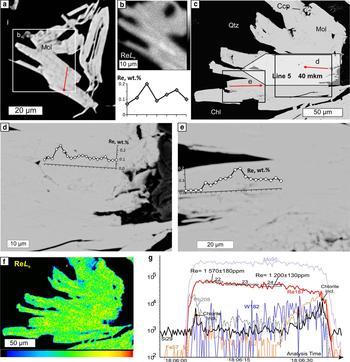
Fig. 5. Molybdenite from Birgilda, samples Bir-42/84 (a,b) and Bir-4905/294.4 (c). (a) SEM image of molybdenite flakes; (b) ReLα X-ray map of a fragment of a and the EMPA profile across the flake (the position is indicated by a red arrow); (c) SEM image of a molybdenite ‘semi-rosette’ with the positions of the EMPA and LA-ICP-MS profiles; (d,e) fragments of (c) with the EMPA profiles; (f) ReLα X-ray map of (c); (g) LA-ICP-MS spectra for line 5.
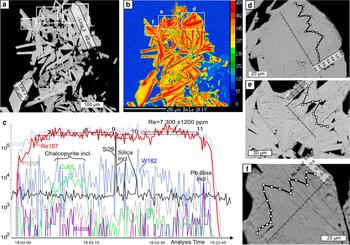
Fig. 6. Molybdenite from Birgilda, sample Bir-1101/291.2: (a) SEM image of a molybdenite aggregate showing the positions of the LA-ICP-MS profiles; (b) ReLα X-ray map of the same area; (c) LA-ICP-MS spectra for line 3; (d–f) fragments of (a) with EMPA profiles.
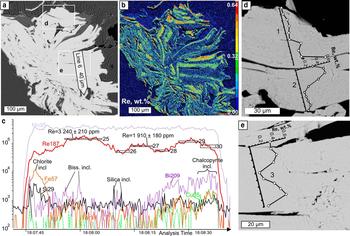
Fig. 7. Molybdenite from Birgilda, sample Bir-1101/237: (a) SEM image of a molybdenite ‘rosette’ showing the position of the LA-ICP-MS profile; (b) calibrated map of the Re content (wt.%); (c) LA-ICP-MS spectra for line 6; (d,e) fragments of (a) with EMPA profiles.
LA-ICP-MS analysis was carried out for three samples from the Birgilda deposit where molybdenite aggregates were large enough, i.e. Bir-1101/237, Bir-1101/291.2 and Bir-4905/294.4 (Table 4 and Supplementary Material – Appendix 2). Similar to molybdenite from the Kalinovskoe deposit, the Fe, Cu and Si contents reach thousands of ppm because of numerous inclusions of silicates and chalcopyrite. The Co, Ni, Sn, Te and Au contents are below the detection limit in most analyses but occasionally reach several ppm. All samples show similar ranges of Zn, As, Se (tens to a few hundreds of ppm), Ag, Pb, Bi and W (several ppm to a few tens of ppm). Sample Bir-4905/294.4 has the highest Sb content (up to 33 ppm compared to <4 ppm in the two other samples). Sample Bir-1101/291.2 is notable for the highest Re content (3350 to 7500 ppm) while the lowest Re content is observed in sample Bir-4905/294.4 (998–1570 ppm) which corresponds with the EMPA data.
Pearson's correlation coefficients were calculated for the entire trace-elements dataset except for Co, Ni, Sn, Te and Au because those elements were below the detection limit in more than a half of the analyses (Table 6). The highest positive correlations (>0.9) exist between Fe and Cu and between Pb and Bi. The Birgilda deposit is similar to the Kalinovskoe deposit with most trace elements showing positive correlations with each other, i.e. Si, Fe, Cu, Zn, Ag, Sb, As, Se, Pb and Bi. Rhenium has negative correlations with Pb, Sb, Bi, Se and As, while W has negative correlations with Se and As. For the Birgilda deposit, the calculation (Table 6) indicates a positive correlation (0.55) between Re and W. However, on a Re vs. W diagram (Fig. 8a), samples Bir-4905/294.4 and Bir-1101/237 and sample Bir-1101/291.2 clearly form two distinct trends each of which shows a significant negative correlation between Re and W (–0.62 for sample Bir-1101/291.2). This demonstrates that the W and Re behaviour in molybdenite from the Birgilda deposit is similar to that from the Kalinovskoe deposit. Despite the negative correlation between Re and Se for molybdenite from the Birgilda deposit (Fig. 8b), there is a positive Re vs. Se correlation for analyses with Re <2500 ppm (+0.64 at minimum significant 0.44, n = 20) and negative Re vs. Se correlation for analyses with Re >2500 ppm (–0.59 at minimum significant 0.5, n = 16).
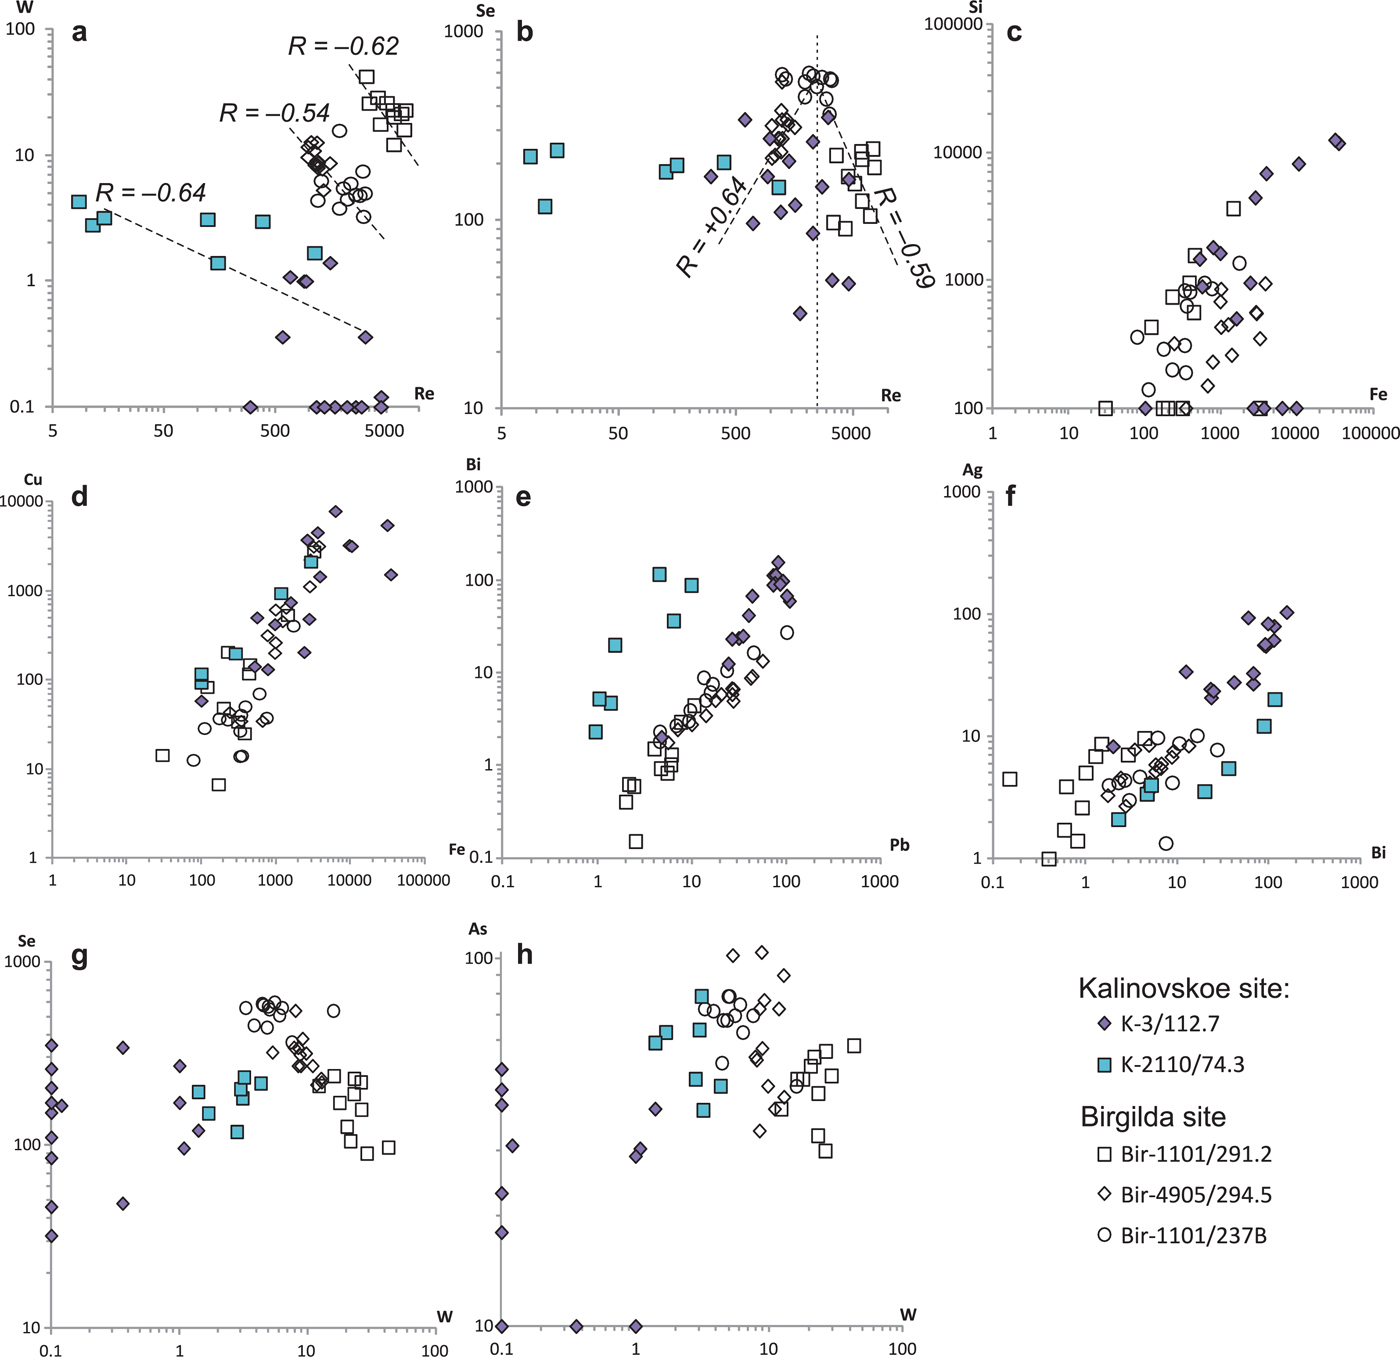
Fig. 8. Binary diagrams for selected trace elements in molybdenite (LA-ICP-MS data).
Table 6. Correlation coefficients for trace elements in molybdenite from the Birgilda site inferred from LA-ICP-MS data: significant* correlation coefficients are highlighted in bold.

* Minimum significant correlation was accepted as 0.34 for n = 36 for 95% confidence, after Fisher and Yates (Reference Fisher and Yates1963).
Chlorite chemistry and thermometry
Molybdenite is intimately intergrown with chlorite in all the molybdenite-bearing samples studied (Figs 2f,g, 3c,i, 4e, and Supplementary Material – Appendix 3); the only exception is sample Bir-1101/291.2 where chlorite occurs only in the alteration halo. The chlorite chemical composition was obtained in order to evaluate its formation temperature (Table 7, Appendix 3 and Fig. 9). All the chlorite grains from both Kalinovskoe and Birgilda deposits belong to the clinochlore–daphnite series with minor but variable amounts of amesite (Bailey, Reference Bailey and Bailey1988); X(Mg) varies from 0.38 to 0.72 (Fig. 9). Each sample is characterized by a rather narrow X(Mg) range, e.g. 0.38–0.45 in sample K-2210/73.4 (the lowest observed value) and 0.70–0.72 in sample Bir-1101/237 (the highest value). Samples from the Birgilda deposit generally show higher X(Mg) values than samples from Kalinovskoe. Almost all chlorite grains contain MnO (up to 0.79 wt.%) but no K2O, Na2O and CaO were detected (Table 7 and Appendix 3). Cr2O3 (up to 1.49 wt.%) was detected only in sample Bir-1101/291.2 which may be due to the influence of the host basalt. The Si/Al ratio varies from 0.92 (at Kalinovskoe) to 1.16 (at Birgilda). Chlorite-formation temperatures were calculated according to (Cathelineau Reference Cathelineau1988; Kranidiotis and MacLean, Reference Kranidiotis and MacLean1987; Kotelnikov et al., Reference Kotelnikov, Suk, Kotelnikova, Tschekina and Kalinin2012) and these temperatures all lie between 244 and 368°C (Table 7).
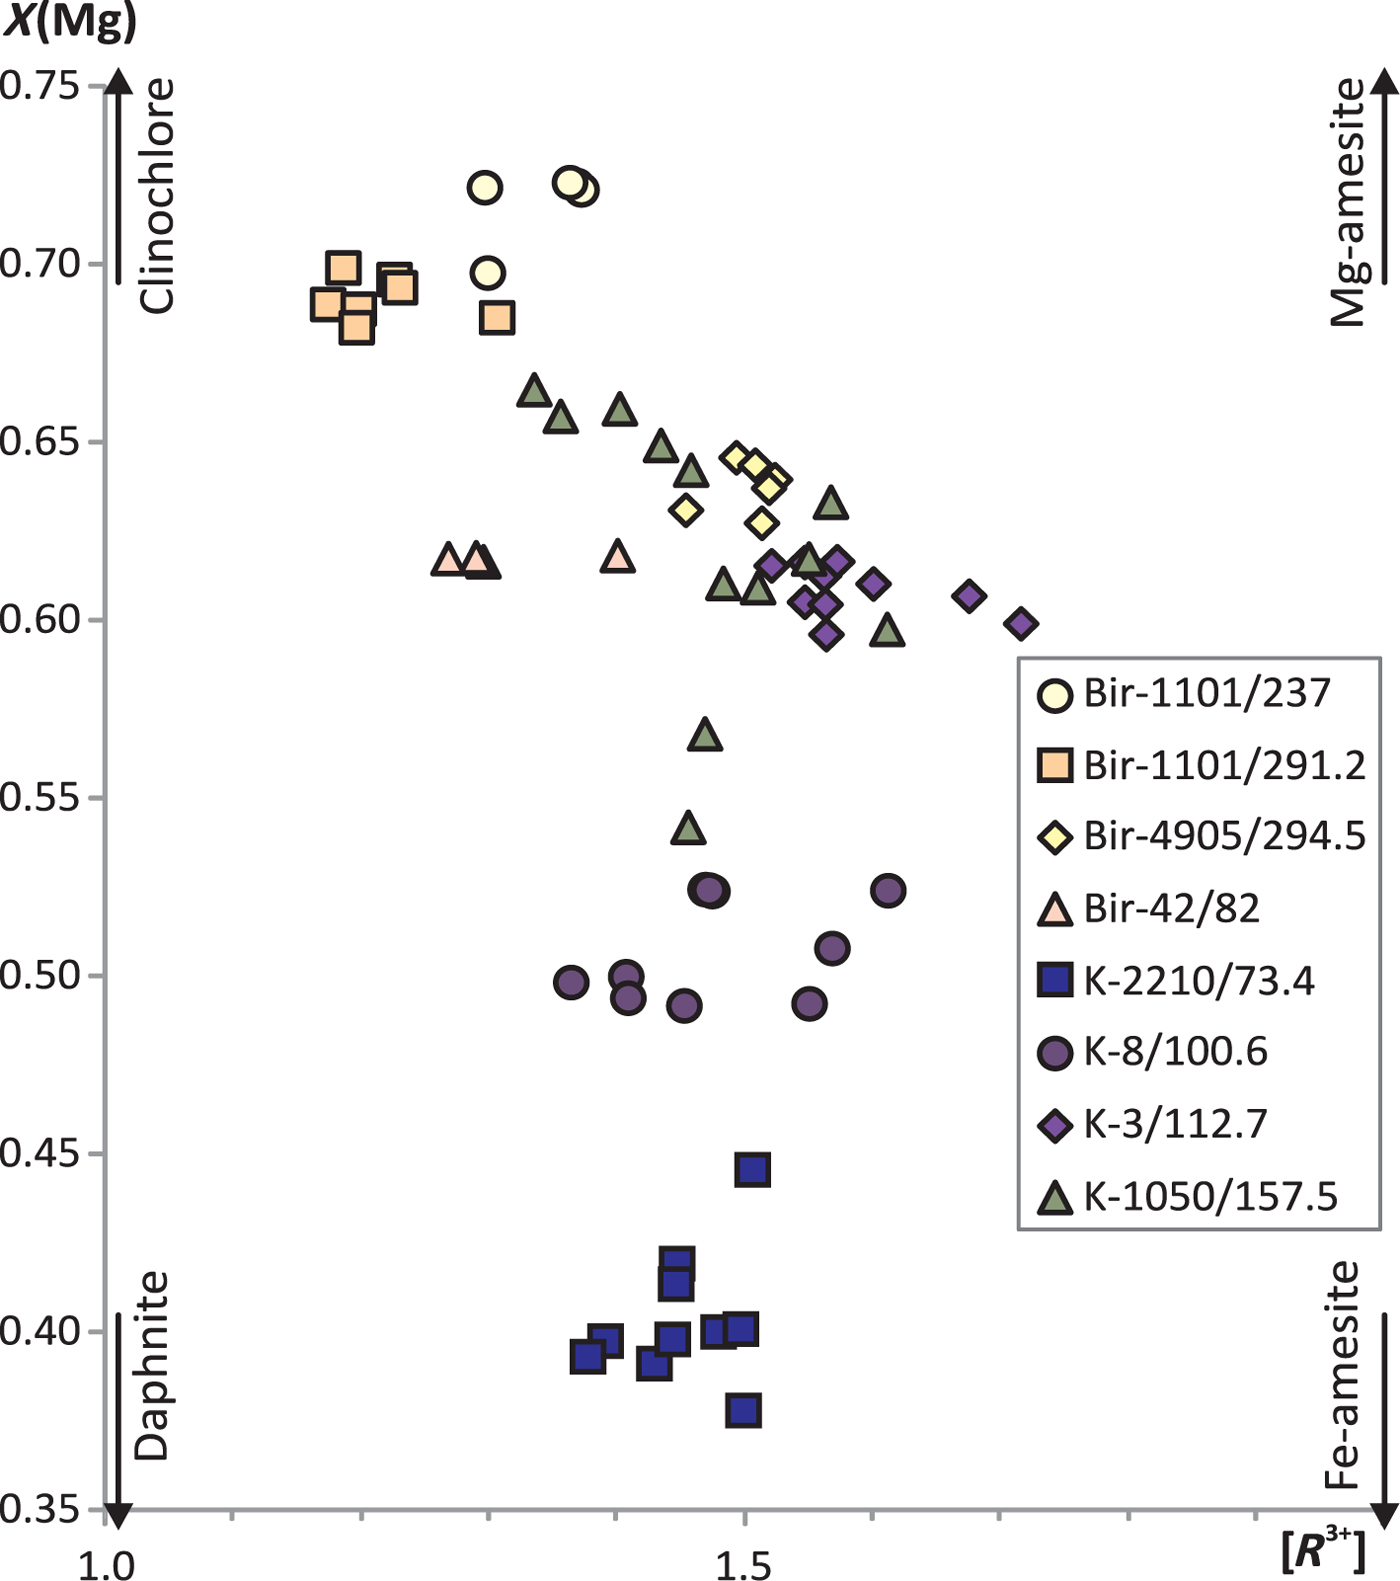
Fig. 9. Compositional variations of chlorite intergrown with molybdenite from Kalinovskoe and Birgilda. [R 3+] is the sum of the trivalent cations in the octahedral sites. Classification of chlorites after Bailey (Reference Bailey and Bailey1988).
Table 7. Chemical composition of chlorite (wt.%) associated with molybdenite and calculated temperature (°C); see Appendix 3 for the full data.
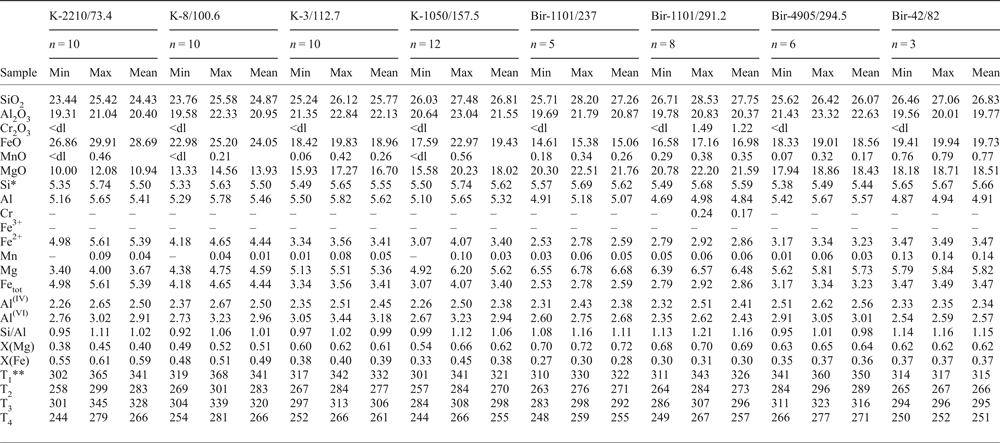
* Formula units are calculated on the basis of 20 cations.
** T 1 after Cathelineau (1988); T 2 and T 3 after Kranidiotis and MacLean (1987) for low-Al and high-Al environments, respectively; T 4 after Kotelnikov et al. (2012).
Fluid-inclusion study
Fluid inclusions appropriate for microthermometric studies were found in only four double-polished sections of samples K-2010/73.4 and K-8/100.6 from Kalinovskoe and Bir-1101/237 and Bir-4905/294.5 from Birgilda.
Fluid-inclusion petrography
In both the Kalinovskoe samples, fluid inclusions were observed in euhedral quartz crystals overgrown by molybdenite (Fig. 10a). The quartz is interpreted as preceding the molybdenite formation. At room temperature, two coexisting types of fluid inclusions were identified: (1) VL1L2-type fluid inclusions have oval or negative crystal shapes and range from 10 to 15 µm in size; they consist of aqueous liquid and vapour bubbles (30–50 vol.%) surrounded by a thin rim of carbonic liquid (Fig. 10b); and (2) V-type inclusions, 10–15 µm in size, consisting of vapour, sometimes with a thin rim of liquid.
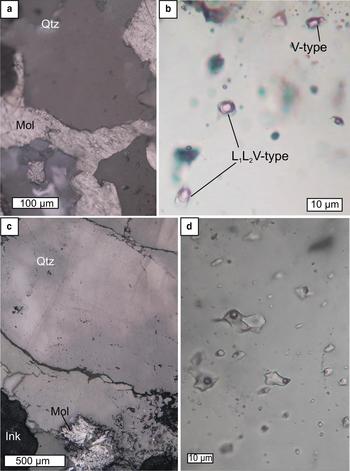
Fig. 10. Two types of fluid inclusions measured at the Kalinovskoe (a,b) and Birgilda (c,d) sites. (a) quartz overgrown by molybdenite, reflected light, sample К-2010/73.4; (b) enlarged fragment of (a) in transmitted light, inclusions of VL1L2- and V-types; (c) quartz intergrown with a molybdenite rosette, reflected light, sample Bir-4905/294.5; (d) enlarged fragment of (c) in transmitted light, inclusions of VL type.
In the two samples from Birgilda, fluid inclusions were found in anhedral quartz grains that form intimate intergrowths with molybdenite (Fig. 10c) and are cut by carbonate veinlets. The quartz grains are presumed to have formed at the same time as the molybdenite. They contain fluid inclusions of VL-type, which are irregularly shaped, range from 10 to 20 µm in size, and consist of aqueous liquid and a vapour bubble that occupies some 20–30 vol.% of the inclusions (Fig. 10d).
All these inclusions are considered to be primary according to the criteria proposed by Roedder (Reference Roedder1984). No daughter minerals or trapped solids were observed.
Microthermometry of fluid inclusions
The results of a microthermometric study are presented in Table 8 and Fig. 11.
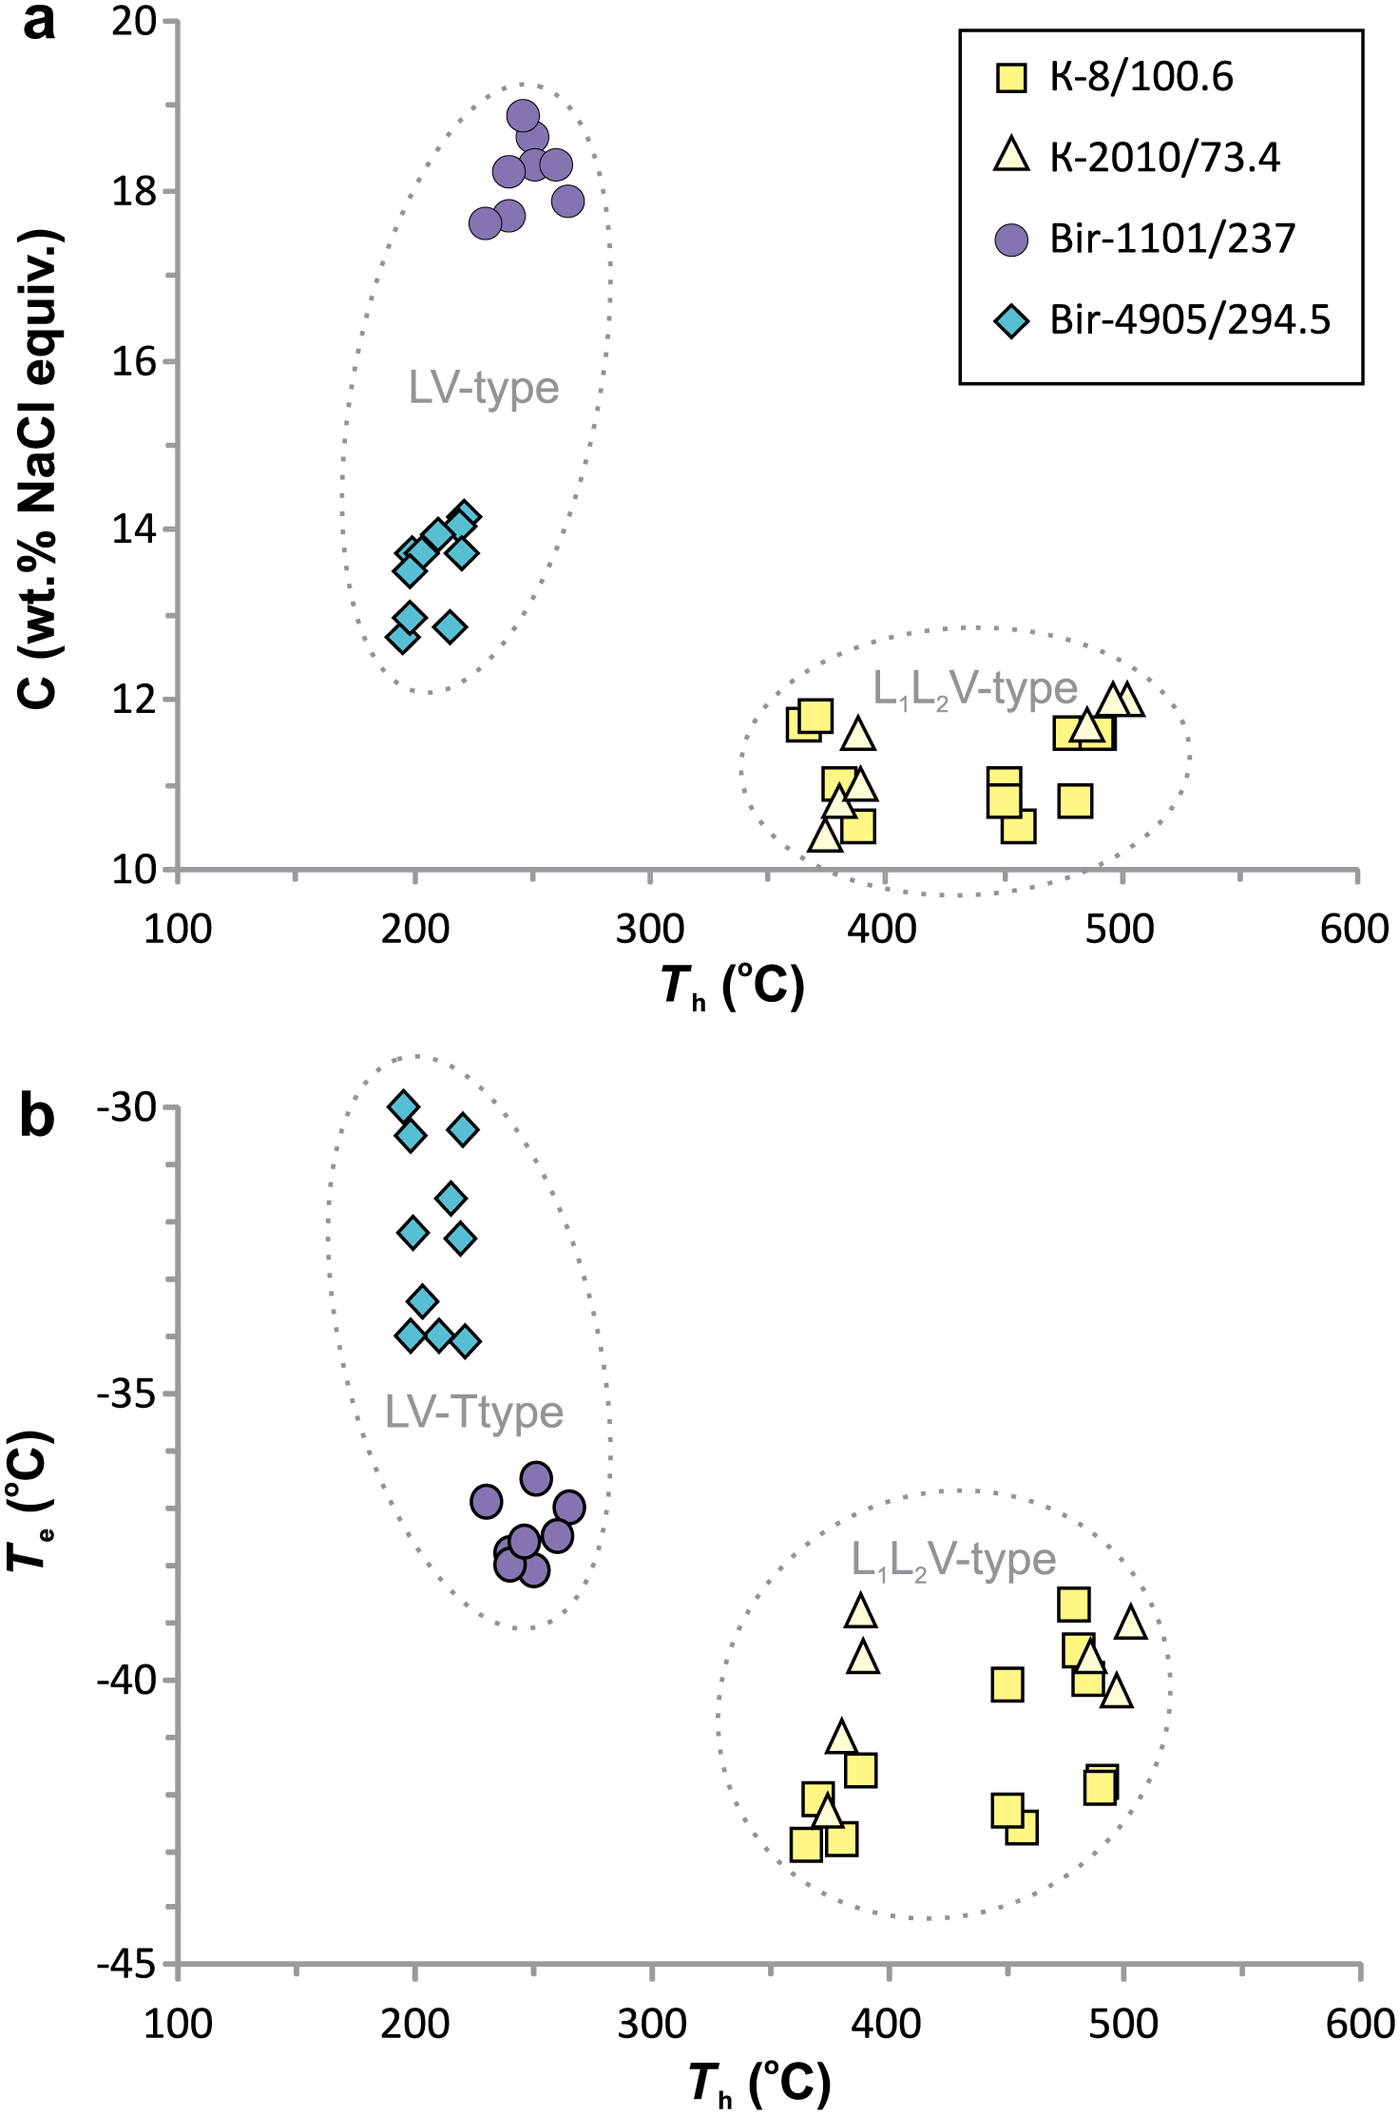
Fig. 11. Homogenization temperatures vs. salinity (a) and homogenization temperature vs. eutectic temperatures (b) for individual fluid inclusions.
Table 8. Microthermometric data for primary fluid inclusions in quartz from molybdenite-bearing samples from the Kalinovskoe and Birgilda sites.

Notes: T h – total homogenization temperature, T e – eutectic temperature, T m(CO2) – CO2 melting temperature; T h (CO2) – CO2 homogenization temperature, T m (clath) – clathrate melting temperature, T m (ice) – final ice melting temperature, C– salinity.
* – average value.
Fluid inclusions of the VL1L2 type from Kalinovskoe show low salinities (10.4 to 12 wt.% NaCl equiv.) and eutectic temperatures of –43 to –39°C indicating that divalent chlorides (Mg2+ and (or) Fe2+) are dominant. The VL1L2 and V types of inclusion both have T m(CO2) from –58.5 to −58.9°C which is lower than for pure CO2 (–56.6°C), suggesting a small admixture of CH4 (Collins, Reference Collins1979). VL1L2-type inclusions homogenize to the liquid phase upon heating at 365 to 502°C. Pressure, as calculated for single-phase CO2-bearing inclusions from Kalinovskoe, corresponds to 650–802 bar. These data are in agreement with previous results for Kalinovskoe (Groznova et al., Reference Groznova, Plotinskaya, Abramov, Borovikov, Milovska, Luptakova and Seltmann2015).
Fluid inclusions of the VL type from Birgilda show moderate salinities (12.7–18.9 wt.% NaCl equiv.) and eutectic temperatures of –38.5 to –30°C indicating the presence of both NaCl and divalent chlorides. They homogenize to the liquid phase at 195–265°C.
The coexistence among the VL1L2 and V types of fluid inclusion in the Kalinovskoe samples suggests that the fluids had undergone CO2 effervescence. In this case the estimates of T h can be regarded as real trapping temperatures (Roedder, Reference Roedder1984). For VL-type inclusions from Birgilda the T h estimates may be considered as minimum trapping temperatures. It is worth noting that the T h estimates for sample Bir-1101/237 (230–265, mean 248°C) overlap with the temperature estimates obtained for chlorite (248–259, mean 255°C, Table 7) calculated after Kotelnikov et al. (Reference Kotelnikov, Suk, Kotelnikova, Tschekina and Kalinin2012). The T h estimates for sample Bir-4905/294.5 (195–221, mean 208°C) are somewhat lower than the temperatures obtained from chlorite geothermometry (249–267, mean 257°C, Table 7). There is no reliable pressure estimate for the Birgilda samples but the pressure was probably similar to that estimated for late-stage mineralization at Kalinovskoe and in the range 190–350 bars (Groznova et al., Reference Groznova, Plotinskaya, Abramov, Borovikov, Milovska, Luptakova and Seltmann2015). Pressure corrections for the homogenization temperatures (Potter, Reference Potter1977) will, in this case, increase the temperature estimate by 30°C, to 225–351°C. If the pressure is higher and ~760 bar as suggested for the early Kalinovskoe assemblages, then the correction will reach 70°C (265–271°C). Both intervals overlap with the temperatures calculated from chlorite geothermometry (Kotelnikov et al., Reference Kotelnikov, Suk, Kotelnikova, Tschekina and Kalinin2012).
Discussion
Re-Os dating of molybdenite
Previous Re-Os dating of three molybdenite samples from the marginal zone at Kalinovskoe (Tessalina and Plotinskaya, Reference Tessalina and Plotinskaya2017) gave ages of 427.1 ± 3.3 Ma to 431.7 ± 1.7 Ma; the latter result relates to the low-Re molybdenite (sample K-2110/74.3) described in the present study. The age obtained during the present study using the high-Re molybdenite sample (K-3/112.7) from the central part of the Kalinovskoe deposit (431.9 ± 1.9 Ma) agrees well with the previous data. The age obtained for the high-Re molybdenite from the Birgilda deposit (432.0 ± 1.7 Ma) is similar. The two ages presented here and those from the earlier work can be considered to represent a single age population, within the analytical uncertainty, that concurs with the emplacement age of the ore-bearing porphyry diorite stock at Tomino (428 ± 3 Ma) obtained by zircon dating (Grabezhev et al., Reference Grabezhev, Bea, Montero and Fershtater2013).
Trace elements in molybdenite
The trace-element contents of molybdenite from Kalinovskoe and Birgilda are generally similar (Tables 3, 4). Molybdenite from Kalinovskoe is slightly higher in Ag and Bi but lower in W and it also shows a wider range of Re content than that from Birgilda. Overall, the Re content of both sites is similar to molybdenite from the Tomino deposit, where Grabezhev and Hiller (Reference Grabezhev and Hiller2015) reported 0.04 to 0.38 wt.% Re by EMPA point analyses and 0.05 to 0.26 wt.% by ICP-MS analyses of molybdenite mineral fractions. This is also similar to calculated Re contents from spectrophotometry analysis of bulk samples which gave values of 440–3140 ppm Re in molybdenite (Grabezhev, Reference Grabezhev2013).
Correlation analysis revealed a group of elements with positive correlations: Si, Fe, Co, Cu, Zn, Ag, Sb, Te, Pb and Bi. For Kalinovskoe this group includes Au, while As and Se are included at Birgilda. Mineralogical data provide evidence that all these elements form mineral inclusions in molybdenite. Numerous discrete regions within the LA-ICP-MS profiles indicating elevated proportions of these elements (Figs 4h,i,k, 5g, 6c, 7c) support this conclusion. The Si–Fe correlation, most evident in sample K-3/112.7 (Fig. 8c), is likely to be the result of multiple intergrowths of molybdenite with chlorite and, to a lesser degree, with epidote (Figs 2b,f, 3c,f,h,i, 4e). Numerous inclusions of chalcopyrite (Figs 3e, 4j, 5c) resulted in positive Fe–Cu correlations (Fig. 8d). Inclusions of matildite (Fig. 2h), and, perhaps, of other Bi- and Pb-sulfosalts and tellurides led to positive correlations for Pb–Bi, Bi–Ag (Fig. 8e,f), Bi–Cu and Bi–Te.
Rhenium, which has either no correlation or a negative correlation with the other trace elements (using LA-ICP-MS data) also shows a negative correlation with Mo in the EMPA analyses and is most likely to be incorporated in the molybdenite lattice. Inclusions of rheniite, similar to those described by Voudouris et al. (Reference Voudouris, Melfos, Spry, Bindi, Kartal, Arikas, Moritz and Ortelli2009) and too small to be detectable by SEM cannot, however, be ruled out. Other elements including W and Se can be incorporated into the molybdenite structure with Re (see review in Pašava et al., Reference Pašava, Svojtka, Veselovský, Ďurišová, Ackerman, Pour, Drábek, Halodová and Haluzová2016 for detailed references). However, W demonstrates extremely irregular LA-ICP-MS spectra (Figs 4–6) suggesting the presence of inclusions of W-bearing minerals. High Se contents (1000 ppm or more) bound isomorphically to molybdenite were proven by Ciobanu et al. (Reference Ciobanu, Cook, Kelson, Guerin, Kalleske and Danyushevsky2013) based on an LA-ICP-MS study. Moreover, Kalinin et al. (Reference Kalinin, Savchenko and Selivanova2013) reported up to 15 wt.% of Se in molybdenite based on EMPA data. In the Birgilda deposit, positive Re vs. Se correlation for analyses with <2500 ppm Re suggests that some Se may be incorporated in the molybdenite lattice. However, our previous mineralogical study of the Kalinovskoe ore (Plotinskaya et al., Reference Plotinskaya, Grabezhev, Groznova, Seltmann and Lehmann2014b) revealed up to 0.69 wt.% Se in matildite and 0.57 wt.% Se in tetradymite which, in addition to a positive Se–Bi correlation (Table 5), provides evidence that Se is mainly due to mineral inclusions in molybdenite.
Deposit-scale variations of rhenium
The limited number of samples investigated does not allow any conclusions to be drawn on variations of the Re content of molybdenite on a deposit scale. Most samples from Kalinovskoe and Birgilda have high Re contents averaging 1200 to 5700 ppm (Table 4). No correlation with the host rocks is evident; diorite- and basalt-hosted samples have similar molybdenite Re contents. The only exception is sample K-2210/73.4 with Re contents considerably lower than the other samples and averaging 71 ppm. This value is close to two other samples from the same ore body (drill hole K-2210) reported by Tessalina and Plotinskaya (Reference Tessalina and Plotinskaya2017) with Re contents of 147 and 228 ppm Re. Perhaps this is a feature of this peripheral ore body, but that requires further investigation.
Rhenium distribution in individual grains of molybdenite
All the samples investigated demonstrate extremely irregular Re distributions in single molybdenite flakes. The Re contents vary by one or two orders of magnitude, e.g. from 302 to 4540 ppm in sample K-3/112.7, or from <10 to >1000 ppm in sample K-2210/73.4 (Table 4). The irregular distribution of Re in molybdenites from deposits of various genetic types has been identified by EMPA (Kovalenker et al., Reference Kovalenker, Laputina and Vyalsov1974; Voudouris et al., Reference Voudouris, Melfos, Spry, Bindi, Kartal, Arikas, Moritz and Ortelli2009; Maksimyuk and Kulikova, Reference Maksimyuk and Kulikova2013; Rathkopf et al., Reference Rathkopf, Mazdab, Barton and Barton2017), by LA-ICP-MS (Ciobanu et al., Reference Ciobanu, Cook, Kelson, Guerin, Kalleske and Danyushevsky2013; Bogdanov and Krumov, Reference Bogdanov and Krumov2016; Kovalenker et al., Reference Kovalenker, Trubkin, Abramova, Plotinskaya, Kiseleva, Borisovskii and Yazykova2018, etc.), and by NanoSIMS (Barra et al., Reference Barra, Deditius, Reich, Kilburn, Guagliardo and Roberts2017). Aleinikoff et al. (Reference Aleinikoff, Creaser, Lowers, Magee and Grauch2012) and Ciobanu et al. (Reference Ciobanu, Cook, Kelson, Guerin, Kalleske and Danyushevsky2013) also noted variations in W and Se. This suggests that the irregular distribution of rhenium in single grains of molybdenite is a common phenomenon.
X-ray mapping using the ReLα line (Figs 4b,d,f, 5b,f, 6b, 7b) showed that most Re-enriched areas form linear zones up to tens of μm wide. Similar linear distribution patterns were revealed in molybdenites from other porphyry Cu-(Mo) deposits of the Urals by X-ray mapping, such as the Verkhneuralskoe Mo-porphyry occurrence (Grabezhev et al., Reference Grabezhev, Bea, Montero and Fershtater2013; Plotinskaya et al., Reference Plotinskaya, Grabezhev and Seltmann2014a), the Voznesenskoe Cu-porphyry deposit (Grabezhev and Voudoris, 2014) and the Mikheevskoe Cu-porphyry deposit (Grabezhev and Shagalov, Reference Grabezhev and Shagalov2010; Plotinskaya et al., Reference Plotinskaya, Grabezhev and Seltmann2015). Perhaps there are Re-enriched layers, or groups of layers, within the molybdenite structure. It has been assumed that such layers could be formed of the 3R-polytypes of molybdenite (e.g. Newberry, Reference Newberry1979; Rekharskii et al., Reference Rekharskii, Savel'eva and Lange1983; Filimonova et al., Reference Filimonova, Zhukov and Malyavskaya1984; Melfos et al., Reference Melfos, Vavelidis, Filippidis, Christofides, Evangelou, Pagel and Leroy1991; Maksimyuk and Kulikova, Reference Maksimyuk and Kulikova2013). However, the presence of high Re contents in both natural (Voudouris et al., Reference Voudouris, Melfos, Spry, Bindi, Kartal, Arikas, Moritz and Ortelli2009; Ciobanu et al., Reference Ciobanu, Cook, Kelson, Guerin, Kalleske and Danyushevsky2013) and synthetic (Drabek et al., Reference Drabek, Rieder and Bohmova2010) molybdenites formed of the 2H-polytype suggests other mechanisms of incorporation of Re into the molybdenite structure. For example, Ciobanu et al. (Reference Ciobanu, Cook, Kelson, Guerin, Kalleske and Danyushevsky2013) attributed a high Re content to lattice defects in 2H-molybdenite.
Controls of Re incorporation in molybdenite
The controls of Re incorporation in molybdenite have been discussed by Berzina et al. (Reference Berzina, Sotnikov, Economou-Eliopoulos and Eliopoulos2005) and in experimental studies by Xiong et al. (Reference Xiong, Wood and Kruszewski2006). It has been established that lower temperatures and a decrease in f O2 are favourable for the formation of high-Re molybdenite. Both the high- and low-Re molybdenite observed in this study have similar assemblages (chalcopyrite, pyrite, chlorite, epidote, muscovite, calcite) which does not allow any estimation of differences in variation of f O2. Chlorite, however, can be used to test the temperature influence on the incorporation of Re in molybdenite. The chlorite thermometer of Kotelnikov et al. (Reference Kotelnikov, Suk, Kotelnikova, Tschekina and Kalinin2012) was selected because it gives a better agreement with the fluid-inclusion results from the two Birgilda samples. Figure 12 shows mean the Re contents vs. mean calculated temperatures. Samples with higher Re contents (K-1050/157.5, K-3/112.4, Bir-1101/291.2 and Bir-1101/237) were formed at lower temperatures than those with lower Re contents (K-2210/73.4, K-8/100.6, and Bir-4905/294.5). Sample Bir-42/84 is the only exception, but the temperature was calculated from only three chlorite analyses and, thus, may be unrepresentative. The remaining seven samples demonstrate a significant negative correlation (–0.81) between temperature and Re content.
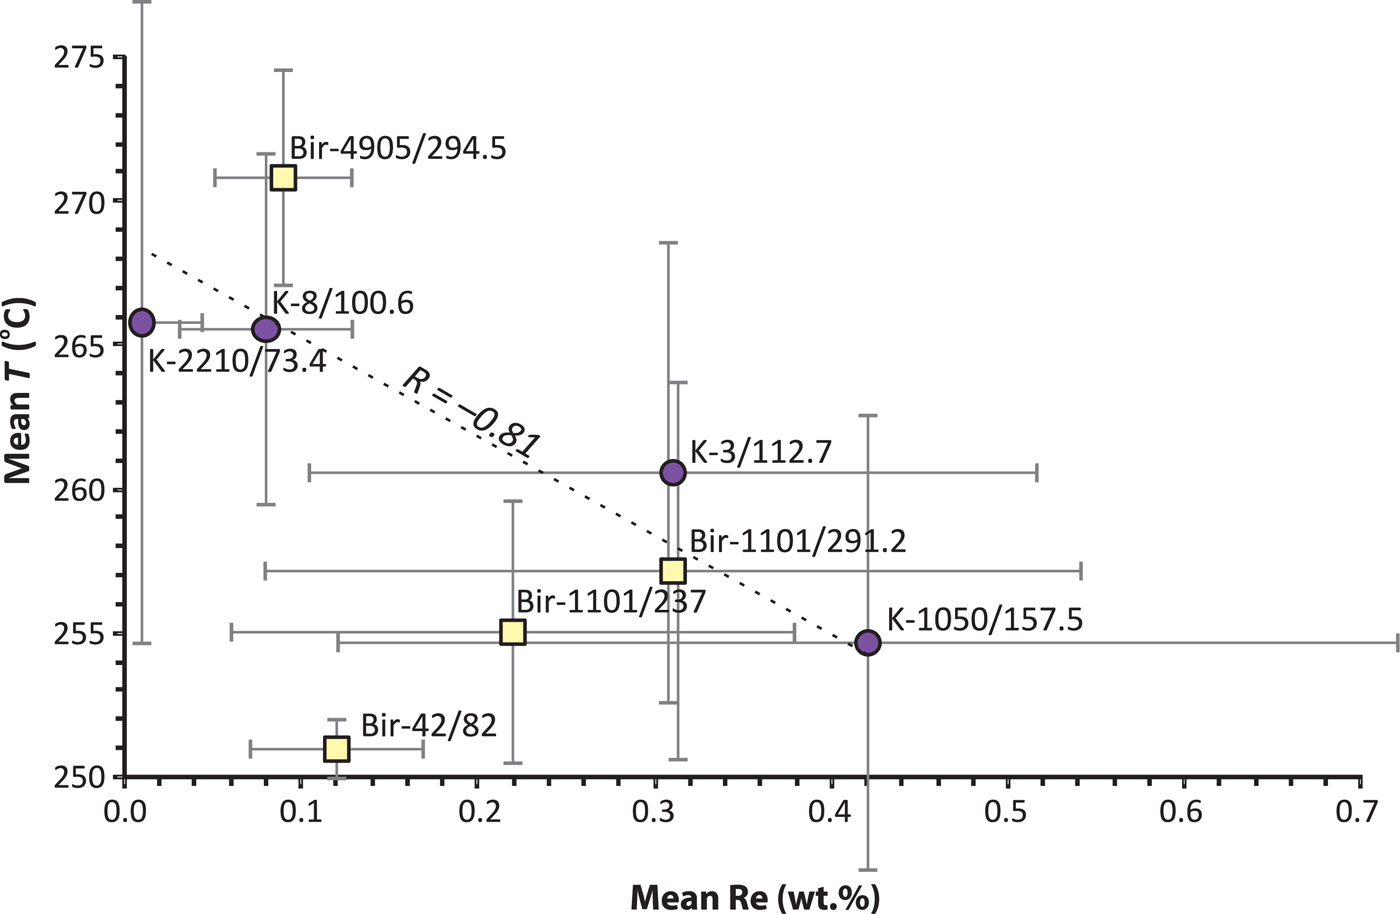
Fig. 12. Mean T (°C) vs. mean wt.% Re from the EPMA analyses (Table 3). Error bars are shown for 1 sd. The temperature was calculated after Kotelnikov et al. (Reference Kotelnikov, Suk, Kotelnikova, Tschekina and Kalinin2012) (Table 2). The correlation coefficient is given for the whole dataset excluding sample Bir-42/82.
Sources of rhenium and other metals
It has been suggested that high Re contents in molybdenite provide evidence for a mantle input (Stein et al., Reference Stein, Markey, Morgan, Hannah and Schersten2001; Sun et al., Reference Sun, Bennett and Kamenetsky2004, etc.). Reviews by Mao et al. (Reference Mao, Cheng, Liu, Yuan, Wu, Xiang and Luo2013) and Pašava et al. (Reference Pašava, Svojtka, Veselovský, Ďurišová, Ackerman, Pour, Drábek, Halodová and Haluzová2016), using data from the literature, propose that <10 ppm Re in molybdenite indicates crustal sources, 10–100 ppm indicates a mixed mantle/crustal source and >100 ppm Re in molybdenite indicates molybdenite derived from mantle sources. Therefore, the high Re contents of most molybdenites from Kalinovskoe and Birgilda may indicate a predominantly mantle source for the metals. The Sm-Nd systematics of the diorite porphyry intrusions of the Birgilda-Tomino igneous complex (Grabezhev, Reference Grabezhev2009) confirms a mantle-derived source of the magma and most of the metals. A lead isotope study (Plotinskaya et al., Reference Plotinskaya, Chugaev and Seltmann2017a) also provided evidence for a mantle-derived lead source. There was, however, the possibility of some input of both magma and metals from a crustal source such as might have been produced in a mature volcanic arc with the input of sediments containing crustal lead from denudation of pre-Cambrian crust into a subduction zone. This could explain the deposit-scale variation of Re content in molybdenite observed at the Kalinovskoe deposit.
Conclusions
The trace-element patterns of molybdenite from the Kalinovskoe and Birgilda porphyry copper deposits of the Urals are broadly similar. Most trace elements (Si, Fe, Co, Cu, Zn, Ag, Sb, Te, Pb, Bi, Au, As and Se) form mineral inclusions within molybdenite. Rhenium is most likely to be incorporated into the molybdenite lattice.
The present results demonstrate an extremely irregular distribution of Re within individual molybdenite flakes, with Re-enriched areas forming μm-scale linear zones. A negative relationship is shown between the Re contents of molybdenite and the temperature of formation of the co-existing chlorite.
The high Re contents (up to 1.13 wt.%) in molybdenite indicate a mantle-derived source.
Acknowledgements
This study was supported by the NHM, London (via the CERCAMS Fellowship Program), by the Presidium of the Russian Academy of Sciences (Program No. 48), and, partly, by the Russian Foundation for Basic Research, Project No 16-05-00622. RS acknowledges funding under NERC Grant NE/P017452/1 “From arc magmas to ores (FAMOS): A mineral systems approach”.
The authors thank the staff of the Russian Copper Company for assistance during the fieldwork. A.I. Grabezhev is acknowledged for providing a sample from the Birgilda deposit (Bir-42/84). A. Kearsly and T. Salge (NHM) are acknowledged for their assistance with the SEM/EDS analysis. The manuscript benefited from extensive reviews by two anonymous reviewers. Editorial assistance from K. Sundblad and J. Bowles is much appreciated.
Supplementary material
To view supplementary material for this article, please visit https://doi.org/10.1180/minmag.2017.081.106


