


Introduction
A growing body of research is showing that the number of small donors to US political campaigns has increased markedly since the turn of the 21st century (Bouton et al. Reference Bouton, Cagé, Dewitte and Pons2022; Ferguson et al. Reference Ferguson, Gimpel, Owens and Shaw2024; Jacobs and Imboywa Reference Jacobs and Imboywa2024). We do not yet know how uniform this development has been across the United States, whether this surge has occurred in only a few select places (e.g., states with the most hotly contested elections) or whether evidence can be found across all states. If broad based and far reaching, this is a historic and momentous development for several reasons. First, donating has always been a highly unequal form of participation, compared to easier forms (e.g., voting) (Sances and You Reference Sances and You2022). The inequality in participation through giving is evident in surveys of the socioeconomic status of donors, though the most affluent of high-dollar donors have always shown reluctance to be interviewed. By identifying their geographic location at granular scales, however, the uneven spatial distribution of large and small donors becomes readily evident (Gimpel, Lee, and Kaminski Reference Gimpel, Lee and Kaminski2006). Most political contributions spring up from large metropolitan areas and affluent neighborhoods within big central cities, such as New York, Los Angeles, San Francisco, Seattle, Chicago, Houston, Dallas, Atlanta, and others. Urban populations may be heavily disadvantaged in some respects, but they have played an outsized role in funding campaigns for both major US parties. Outlying areas, including secondary cities, smaller towns, and rural areas, associated with low and moderate income, less education, distance from major media markets, and related factors such as light density, self-employment, and small enterprise, are not known for being contributing nuclei.
If the terrain of campaign contributing is changing, there are far-reaching implications for political candidates and campaigns. Tapping into a growing pool of small donors means adapting a candidacy to their interests. This could potentially alter the mix of issues emphasized, shift a campaign’s allocation of internal resources, alter candidate travel, and bring voter and donor outreach efforts into closer harmony. The competitive campaign’s traditional focus on large dollar donors, located mainly in major metro areas and ingathered largely through in-person events, will have to give way to a focus on a very different fundraising source, reached through other means. While still maintaining an influential voice, elite donors will no longer be the only voice in the room.
Is the traditional landscape of giving changing? In US politics, representation is territorially based, so competition for office is geographically uneven. The competitive contests that activate donor attention are spread neither evenly nor uniformly across the nation’s political topography. Competition aside, some citizens are more inclined to make political donations than others as a function of individual traits, chiefly their income and level of political interest. As competitive circumstances and individual pre-conditions may change, even a small number of newly mobilized donors could reshape election outcomes in regions and legislative districts that had previously been unresponsive to fundraising appeals. If donors send contributions elsewhere, well outside their own states and districts, such activity could become a source of vigor and strength to candidacies that would not find much organic support locally (Baker Reference Baker2022; Gimpel, Lee, and Pearson-Merkowitz Reference Gimpel, Lee and Pearson-Merkowitz2008). Taken as a whole, the surge in small donations is a potential marker of strides toward less socioeconomic bias in the donor pool as well as the geographic decentralization of political influence. Our specific inquiry is about whether we see small donors emerging from locations outside of the established population centers that have long been hubs of donation activity. If the new donors are simply a local expansion of an already-concentrated geographic base – simply more of the same, just giving smaller amounts – the effects on campaigns, elections, and governing may be far less significant than they would be if they are emerging from previously quiescent areas, vastly underrepresented in elections past.
Geographic variation in campaign contributing
Previous research has revealed geographic variation in both nonprofit (Glanville, Paxton, and Wang Reference Glanville, Paxton and Wang2016; Paarlberg et al. Reference Paarlberg, Nesbit, Clerkin and Christensen2019; Ressler, Paxton, and Velasco Reference Ressler, Paxton and Velasco2021) and political giving (Antia, Kim, and Pantzalis Reference Antia, Kim and Pantzalis2013; Cho and Gimpel Reference Cho and Gimpel2007; Gimpel, Lee, and Kaminski Reference Gimpel, Lee and Kaminski2006). This variability is informative since more granular geographies commonly encompass populations of shared interests and values. These microregional spaces include workplaces, neighborhoods, and other social venues constrained by distance and subject to social influence (Bramlett et al. Reference Bramlett2011; Gimpel and Glenn Reference Gimpel and Glenn2019; Sances and You Reference Sances and You2022; Stuckatz Reference Stuckatz2022). Multiple social and economic processes draw together individuals with common interests and political views. Though it is surely possible to find isolated donors giving to causes largely independent of their local environments, it is also well known that campaign giving is associated with long-studied individual characteristics (e.g., income, political interest, occupation, and economic stakes) that are neither uniformly nor randomly distributed across space. Giving to campaigns is also a socially networked phenomenon, and the strength of network ties is influenced by proximity and bounded by geographic space (Gimpel and Reeves Reference Gimpel, Reeves and Thomas2022; Sinclair Reference Sinclair2012).
Related research has shown that the small donor revolution has changed the way campaigns message voters (Arbour Reference Arbour2020; Gaynor and Gimpel Reference Gaynor and Gimpel2024; Kim, Zilinsky, and Brew Reference Kim, Zilinsky and Brew2023). Although most money in highly competitive campaigns is still raised at in-person events from elite donors, an increasing share is arriving in smaller online parcels, in response to digital entreaties and phone contact. The emergent donor pool is substantially larger than the one of the old that is expected to meet the candidate face to face. Undoubtedly, large donors are still very influential, and typically, a single large contribution matters more than a dozen or more small ones. But campaigns can no longer ignore the pointed messaging that they have learned can stimulate small donations (Hassell and Monson Reference Hassell and Monson2014; Kim, Zilinsky, and Brew Reference Kim, Zilinsky and Brew2023). To accomplish this goal, campaigns and candidates are incentivized to communicate on issues that in previous eras they might have avoided as strategically imprudent (Glazer Reference Glazer1990; Page Reference Page1976; Shepsle Reference Shepsle1972). Practically speaking, the rise of small donations has had the tangible impact of changing political speech, raising the volume of previously inaudible voices (Cole Reference Cole1991; Fleishmen and McCorkle Reference Fleishmen and McCorkle1983). Campaigns for offices high on the ballot founded almost exclusively on small donations were unheard of several decades ago. While still not the standard, they are widely reputed to have become a more regular feature of the political landscape (Ferguson et al. Reference Ferguson, Gimpel, Owens and Shaw2024).
Usually, broader public participation in political campaigning is viewed as a step toward greater civic engagement (Boatright and Malbin Reference Boatright and Malbin2005; Graf et al. Reference Graf, Reeher, Malbin and Panagopoulos2006; Rubenstein Reference Rubenstein2022). Reservations arise from those observing that the small dollar contributor is highly motivated by political ideology, though we do not have room to test that connection explicitly in this paper (Baker Reference Baker2020; Barber Reference Barber2016a, Reference Barber2016b; Broockman and Malhotra Reference Broockman and Malhotra2020; Hill and Huber Reference Hill and Huber2017; Meisels, Clinton, and Huber Reference Meisels, Clinton and Huber2024). We direct interested readers to the related research cited here suggesting that small donors are both a cause and an effect of elite political polarization (Beckwith Reference Beckwith2024; Brown, Powell, and Wilcox Reference Brown, Powell and Wilcox1995; Byler Reference Byler2023; Culberson, McDonald, and Robbins Reference Culberson, McDonald and Robbins2019; Edsall Reference Edsall2023; Francia et al. Reference Francia, Green, Herrnson, Powell and Wilcox2003; Heerwig Reference Heerwig2018; Heerwig and Murray Reference Heerwig and Murray2019; Johnson Reference Johnson2010; Kates et al. Reference Kates, Manning, Mendelberg and Wasow2025; Kates and Thieme Reference Kates and Thieme2024; Keena and Knight-Finley Reference Keena and Knight-Finley2019; Magleby, Goodliffe, and Olsen Reference Magleby, Goodliffe and Olsen2018; Meisels, Clinton, and Huber Reference Meisels, Clinton and Huber2024; Pildes Reference Pildes2019; Rhodes, Schaffner, and La Raja Reference Rhodes, Schaffner and La Raja2018). We mention this ongoing discussion and believe that our evidence may bear on it insofar as small donations are extracted from previously non-contributing locations through the interaction of ideological identification and ideological appeals.
Our principal focus is whether the differences between large and small donors appear as geographic distinctions where these donors reside. Previous research has shown that donor geography is dissimilar to electoral geography (Gimpel, Lee, and Kaminski Reference Gimpel, Lee and Kaminski2006; Heerwig and McCabe Reference Heerwig and McCabe2019). The urban–rural divide seen in electoral politics is not nearly as pronounced in campaign contributing, because both Democratic and Republican donations originate from many of the same metro areas, even within the same towns and zip codes. This is because the most affluent donors to both parties share living spaces whereas the parties’ voter bases are more geographically disjoint.
Our curiosity extends not just to where we observe the emergence of large and small donors, but also any differences in origin between large and small donors within each political party. For the present research, we define small donors as those giving $200 or less across an election cycle to a candidate and large donors as those who give $201 or more. These amounts correspond to the present US federal campaign finance law requiring only the itemization of contributions of those giving $200 or more over a given cycle.Footnote 1 For contributions to federal campaigns as recorded by the Federal Election Commission, few contributions of less than $200 are reported by campaigns and related political entities, though some do get reported. By contrast, several states require reporting of all campaign contributions down to very small amounts, sometimes less than $1. We focus our effort on Washington State as an exemplar in the following pages. Current Washington state law requires disclosure of the donor’s identity for all contributions of $25 or greater, though even the smallest donations are also reported.
Why would the geographic origins of donations be at all informative about what drives some subset of local citizens to provide them? In answer to this question, we offer plausible explanations but do not pinpoint the precise causal mechanism. Individual attributes of the voters in an area can certainly predict giving, most specifically their wealth and income, their level of campaign attentiveness, and past involvement. Another plausible explanation, given what is known about giving, is that local social influence plays a role. Much political and charitable contributing takes place at social events, often in publicly observable settings (Bhati and Hansen Reference Bhati and Hansen2020, 4–5; Sanders Reference Sanders2017). People give to campaigns because they have been asked to do so by people they know, typically nearby, in the same workplace or neighborhood (Stuckatz Reference Stuckatz2022). In turn, people who feel socially excluded tend to give less. Partisan and ideological behaviors are a product of socialization through peer influence, which is itself constrained by spatially bounded localities of communication that shape human interaction, information flow, learning, and decision-making across many venues of activity (Gimpel and Reeves Reference Gimpel, Reeves and Thomas2022; Huckfeldt, Plutzer, and Sprague Reference Huckfeldt, Plutzer and Sprague1993; Iyengar, Konitzer, and Tedin Reference Iyengar, Konitzer and Tedin2018). Given how different these patterns of interaction and influence can be across locations, we could reasonably expect small donors to arise from locales different than the large donors if contributing is expressive of these geographically varying relations.
Put succinctly, our central research hypothesis is that small donor geography is distinctive from that of large donors. Small donations will not emerge from the same places as large donors but will expand the donor electorate outward from longstanding hubs of contributing activity. Small donors do not share the same characteristics as large donors, simply showing less generosity (Ferguson et al. Reference Ferguson, Gimpel, Owens and Shaw2024). They represent a centrifugal force in campaign fundraising that reflects the involvement of less affluent contributors outside of the areas of concentrated economic power. This is not to predict that there will be fewer small donors from metro areas, the traditional hubs of contributing. Small contributions can come from anywhere, but large donations do not. Populous areas can be expected to generate more contributions of all sizes as more money is raised. We simply anticipate more small donors appearing from places with little-to-no past contribution history.
By observing where contributions originate at the granular level of the zip code of residence, our research should be capable of making finer distinctions in the loci of behavior than would be the case if we were observing giving at a higher level of scale and aggregation – such as a region or state. Large aggregations from potentially diverse zones or regions contain population subgroups that when summed or averaged could mask important local variation in the micro contexts of behavior that shape giving. A group of high-income neighborhoods on one side of town, mixed with lower-income neighborhoods on another, produce a mean or median level of income that poorly captures the nature of the socioeconomic environments in which specific individuals live. In expansive metro areas, or even within larger cities, residents in one neighborhood may have little or no interaction with the residents of others. Defining everyone’s social boundaries to gauge neighborhood effects is a difficult undertaking, in part because citizens are not always aware of the influences that act on them (Huckfeldt and Sprague Reference Huckfeldt and Sprague1995, 258–9). For instance, Seattle residents may seldom venture beyond city limits to the eastern expanses of King County (e.g., Bellevue, Issaquah, Redmond). But exactly where within King County social influence fades might not be something they can precisely define, especially given that environmental influences are not entirely subject to choice. Measures aggregated from the diversity present in such large counties potentially misrepresent the nature of the socioeconomic environment at the true locus of behavior (e.g., donating) (Kwan Reference Kwan2012a, Reference Kwan2012b, Reference Kwan2018). In response to these unknowns, social science research has an obligation to pursue studies at alternative and multiple geographic scales.Footnote 2
Wherever possible we draw on information from the zip code level of observation. To be sure, these well-defined postal delivery districts can be internally heterogeneous, and some are expansive, encompassing variable economic activities, neighborhoods, and populations. But with an average population in 2024 of about 10,000, scattered across an average land area of 85 square miles, they are closer to capturing the size of a housing development, neighborhood, or small town than many alternative measures. They provide observations of contexts that are more suited to understanding donor behavior than do the coarse-grained geographies that might be available for this purpose. Fortunately, they are convenient for data analysis and important social and economic covariates are available, provided by the US Census Bureau.Footnote 3 They are arguably especially useful precisely because their boundaries are largely irrelevant to political officeholding at any level. Zip codes do not reflect explicitly politicized administrative boundaries in the way that legislative districts, school districts, and other governmental units of jurisdiction and representation do. These boundaries are incidental to politics, not determined (directly) by political considerations. Finally, zip codes are commonly the most granular level of the residential address reported in administrative records of political and charitable contributions and are widely used in the study of nonprofit giving (for example, Fovargue et al. Reference Fovargue, Fisher, Harris and Armsworth2019). Obtaining street address details to position donors at their rooftop coordinates usually is not possible as it is for registered voters. To explain the variability in contribution activity by donors’ residential addresses, zip code measures were collected for affluence, race/ethnicity, population size and density, and geographic distance from King County – the state’s largest labor market and considered the political center of gravity in Washington State politics.Footnote 4 We also account for the donor’s local partisan environment, as captured by county-level election results, given the lack of party registration in the state.Footnote 5 This information permits a test of the straightforward hypothesis that the more a potential donor’s locale favors one party over the other in recent presidential elections, the more small donations can be expected to flow to the favored party’s gubernatorial candidate.
Washington state gubernatorial elections and fundraising
The geographic setting for our data collection is Washington State with observations drawn from campaigns contributing to gubernatorial elections from 2000 to 2024. Washington state holds elections for the state governorship in presidential election years (since 1892), and incumbent governors are not term limited. The state has recently been considered reliably Democratic, with a long streak of Democratic electoral dominance offering confirming evidence. Republicans did not win a gubernatorial contest from 1980 to 2024. Even so, a closer look reveals mostly competitive general elections. After 1980, only once in 12 contests has the winning margin of victory exceeded 60% (62.2% for Booth Gardner in 1988). The 2004 contest was so close it was settled by 133 votes out of 2.7 million cast. Two recent gubernatorial candidates have cleared just over 55% of the popular vote: Democrat Jay Inslee in 2020 (55.6%), securing his third full term, and his Democratic successor Bob Ferguson in 2024 (55.5%). Still, Republicans have regularly come within striking distance, usually always taking the contest seriously, nominating a credible opponent, but consistently falling short. Though voters do not register to vote by political party preference, statewide polling unsurprisingly points to a Democratic edge in party allegiance. Through the early 2020s, the state legislature maintained a comfortable Democratic majority in the lower house and a less certain grip on control over the state senate. A fair rundown suggests that Republicans have not been as hopelessly locked out of power as they have been in more Democratic-dominated states such as California, Maryland, Massachusetts, Rhode Island, New York, and Illinois (Donovan Reference Donovan, Clayton, Donovan and Lovrich2020).
Like other states, the urban–rural divide in party support is canyon sized. The Seattle metropolitan area (three counties: King [Seattle], Snohomish [Everett], Pierce [Tacoma]) serves as the epicenter for Democratic Party concentration and loyalty among voters. All the counties bordering the Puget Sound on the west are reliably Democratic except the most rural one, Skagit, lying 60 miles north of Seattle, considered competitive between the major parties. Republican voting dominance can be found in Central and Eastern Washington, though all these locations except Spokane County cast small shares of the statewide vote. About half of the state’s votes are cast in just three of thirty-nine counties and these are unsurprisingly urban and Democratic dominated locales: King, Snohomish, and Pierce. What this adds up to is the common pattern of a densely concentrated Democratic vote and a more dispersed base of Republican support.
In the contemporary history of Washington campaign finance law, a significant event occurred in 1992, with the overwhelming passage of Initiative 134,Footnote 6 imposing campaign contribution limits that have henceforth regulated campaign giving in state and local elections. As with federal law, periodic inflation adjustments are made by the regulating authority, The Public Disclosure Commission. Present limits on individual contributions are set at $2,400 for state executive races and $1,200 for state legislature (as of April 1, 2023). Candidates can and do self-finance by contributing large sums from their personal funds. Importantly, the names of all individual contributors must be disclosed down to $25. Even smaller donations are required to be reported but need not be identified by the name of the contributor.
The contribution data we examine are limited to seven gubernatorial elections, including the data for the most recent 2024 cycle. Summary figures reporting total campaign contributions and the percentage that fall into small and larger categories (≤$200 and >$200) are reported in Table 1. The top panel of results reproduces the figures for both parties, the second panel for Republicans only, and the third panel for Democratic candidates.
Table 1. Total cash contributions flowing to Washington state gubernatorial candidates by party and by cycle, 2000–2024
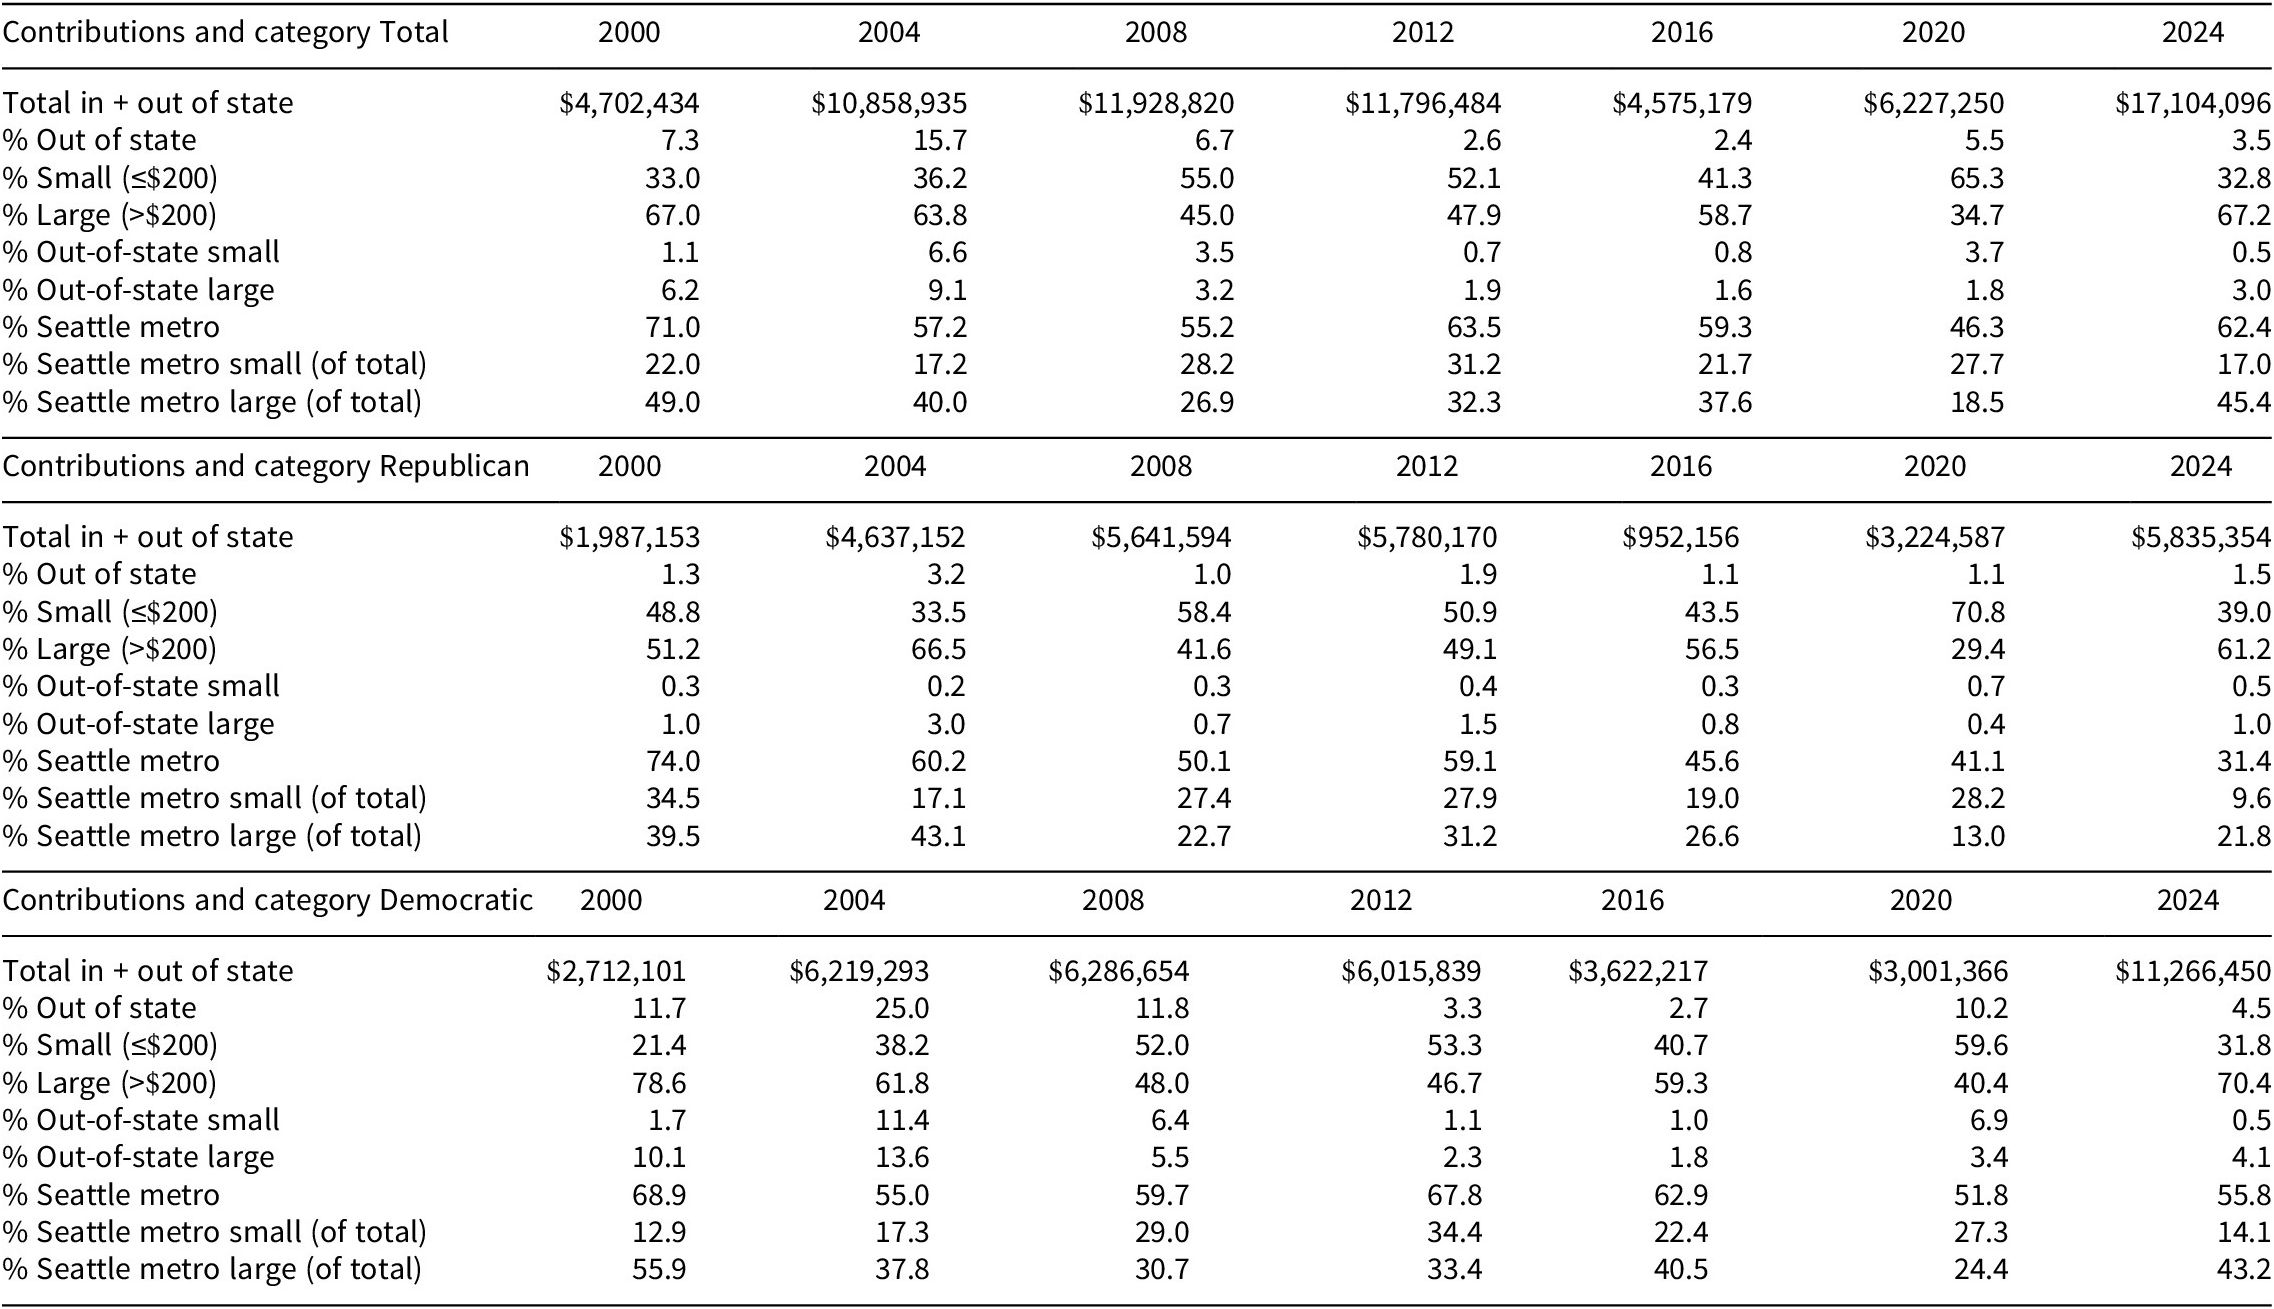
Source: Washington State Public Disclosure Commission, public files. https://www.pdc.wa.gov/political-disclosure-reporting-data/browse-search-data/contributions. Accessed February 3–5, 2025.
Amounts show total cash contributions from individuals to major party candidates, not campaign spending.
The first notable fact is that the dollar value of total contributions has not surged consistently upward as it has in other states. Washington State reported about 4.8 million voters by 2024. Though the figures in Table 1 reflect contributions, not what was actually spent by the campaigns, at least until 2024, the state’s elections have been relatively inexpensive to finance. As elsewhere (Patterson Reference Patterson1982), total contributing is responsive to the wavering intensity of competition for the governorship. In 2004, 2008, and 2012 the races were much closer than those held subsequently (see Table 2), with the 2004 and 2008 elections featuring the same candidates (Christine Gregoire[D] vs. Dino Rossi [R]). The 2012 and 2024 contests were open seat races, both seriously contested, while 2016 and 2020 were reelections for the Democratic incumbent, Jay Inslee (see Table 2).
Table 2. Candidates and general election outcomes in Washington state gubernatorial elections, 2000–2024
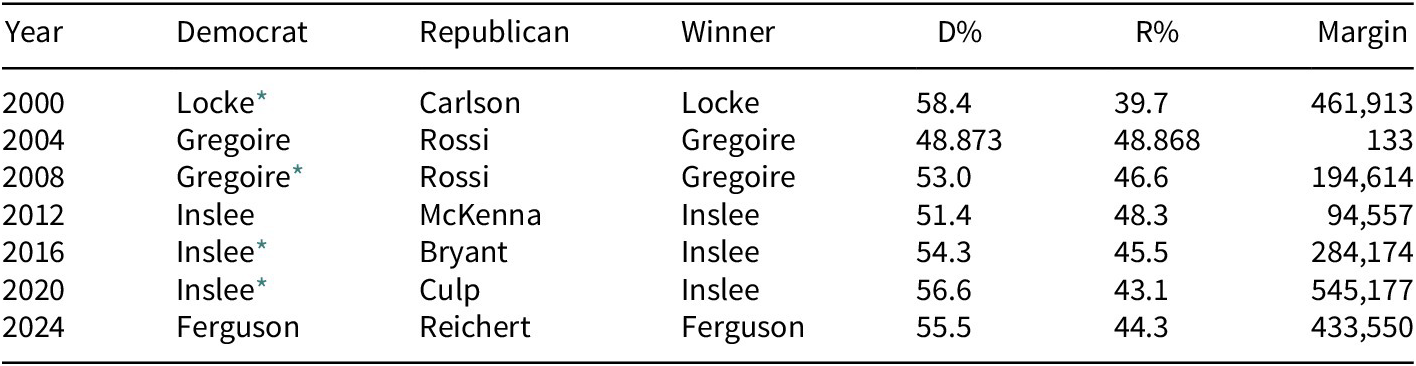
* indicates incumbent.
Second, the state has not seen a major surge in individual giving from outside its borders. Out-of-state giving peaked as a percentage of all contributions in 2004 at 16% but has since subsided, reaching just 5.5% of outside contributions in 2020, declining to 3.5% in 2024. Out-of-state contributions come from both large and small donors, with large outside contributions typically the greater share (except for 2008 and 2020, see Table 1). Small donations have unquestionably and dramatically surged across this period in both raw total and percentage terms (see Table 1). In 2000, just 33% of all contributions were from individual givers contributing $200 or less. By 2020, this had reached 67%, nearly doubling, though receding back again in 2024. Large donors have trended downward as a share of total contributions over time, dropping to 35% by 2020, but springing back sharply in 2024.
The share of total contributions sourced in the three Seattle metro area counties has also varied, dropping to just 46.3% of all contributions in 2020 before rising back to 62.4% in 2024. The proportion of the Seattle metro’s contributions originating from small donors shows peaks and troughs, dropping to a series low of just 17% in 2024. The remarkable 2020 peak in small donations was obviously not sustained in 2024 (expressed as a percentage of the total contributed in Table 1), but small donors are a much greater force to be attended to than in previous contests measured by the sums they now contribute.
Table 1 suggests that the two parties have been well matched in total individual contributions, except in 2016 and 2024. In 2016, the Republican candidate, Bill Bryant, struggled to raise funds to defeat Inslee, at the time, a one-term incumbent. Bryant still won 45.5% of the statewide vote, underlining that the campaign for votes does not mirror the campaign for money (Thomsen Reference Thomsen2023). In 2024, Ferguson (D) raised about twice as much as former US House member, Dave Reichert (R), on the way to securing an 11-point victory. Both parties have benefitted from a surge in the share of contributions coming from small donors, but those contributions were a much smaller share in 2024. Democrats have done better than Republicans in attracting out-of-state contributors, both large and small. Addresses in neighboring states suggest that most of these are donors are Washington State expats with family and commercial ties to the state, as opposed to residents or special interests situated in faraway locations such as Washington, D.C., or New York.
Maps for the state’s zip code level contributions to each party are presented in Figures 1 and 2. The first four display the contribution amounts for those giving between $0 and $200 in the 2000 and 2024 cycles, defined here as small donors (Figure 1a–d). The zip code figures for large donations (contributions>$200) are also presented (Figure 2a–d).
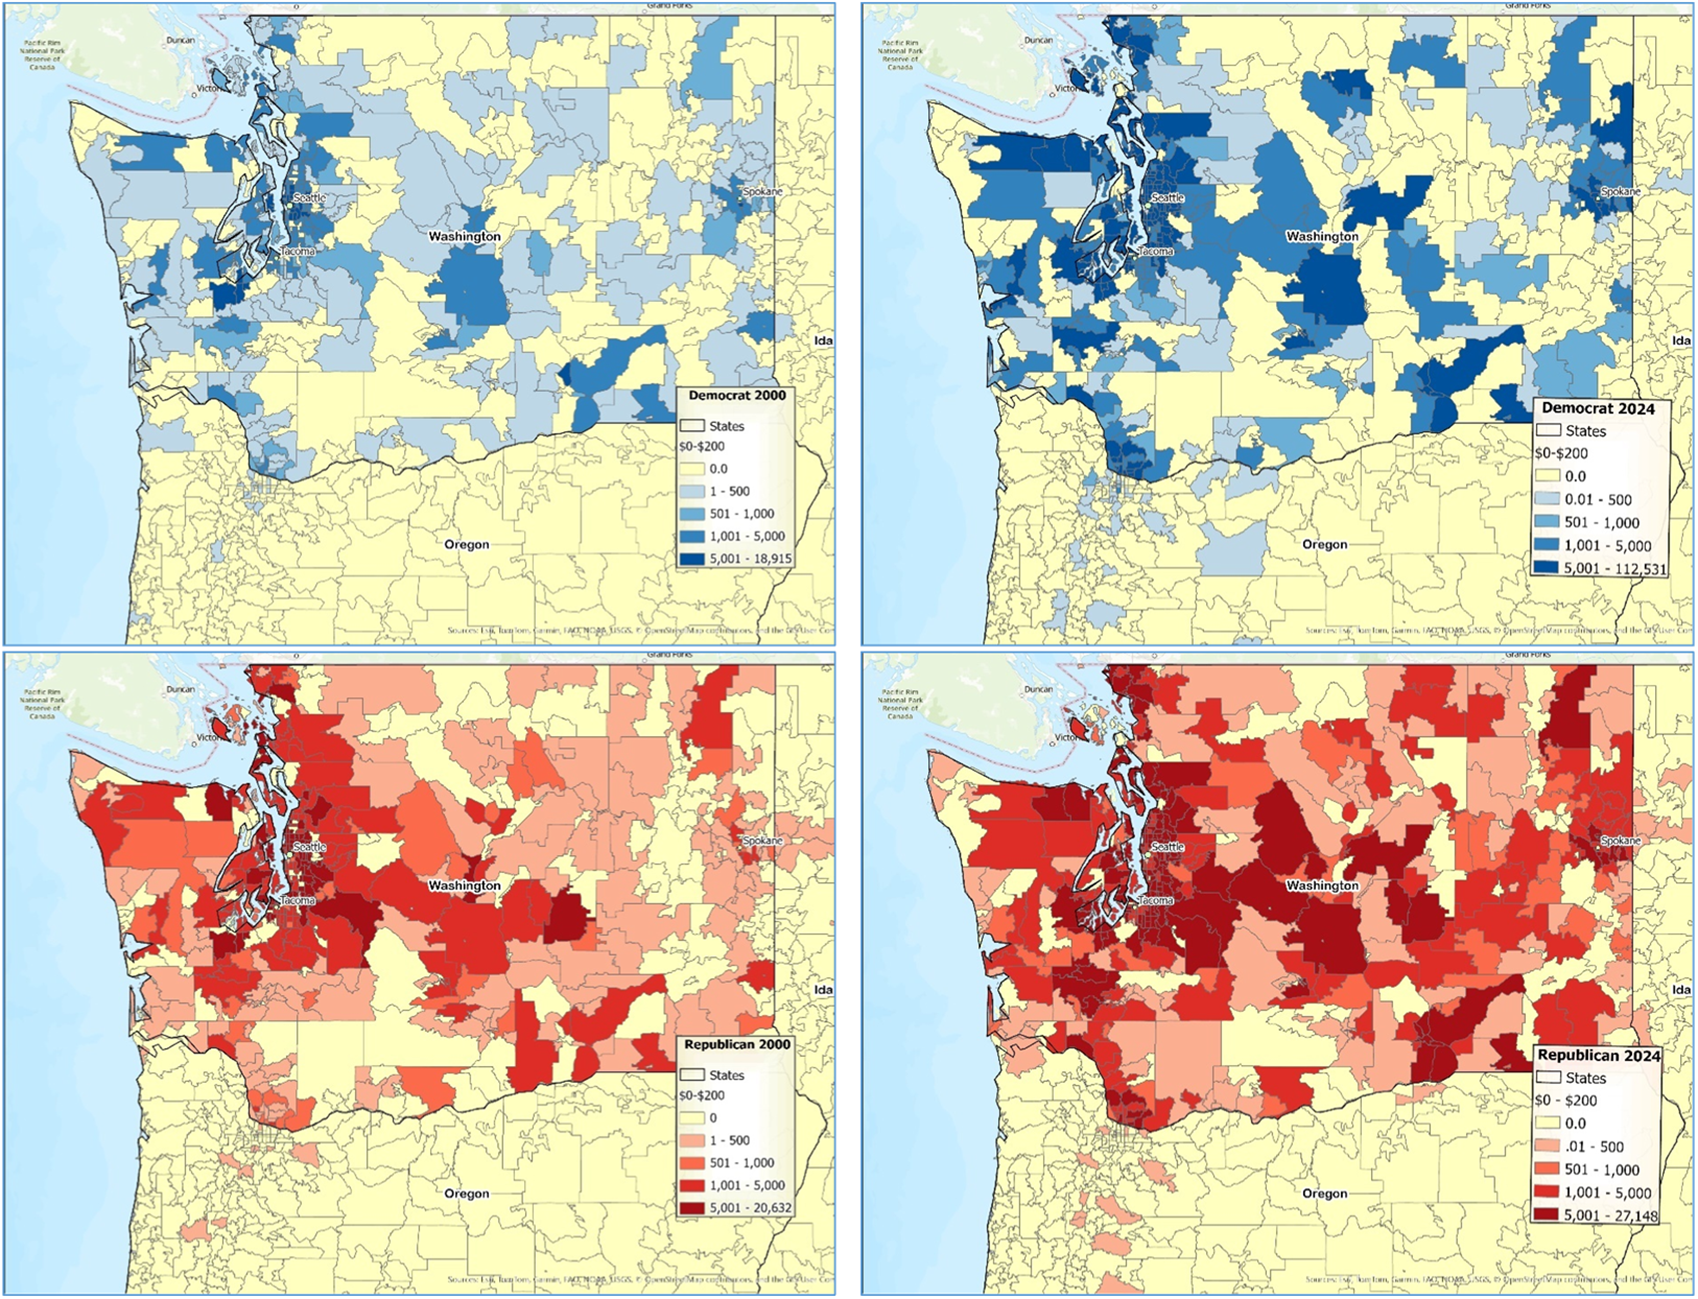
Figure 1. The changing geography of small donations (≤$200) in Washington state gubernatorial elections, 2000 (left) and 2024 (right), Democrats top, Republicans bottom.
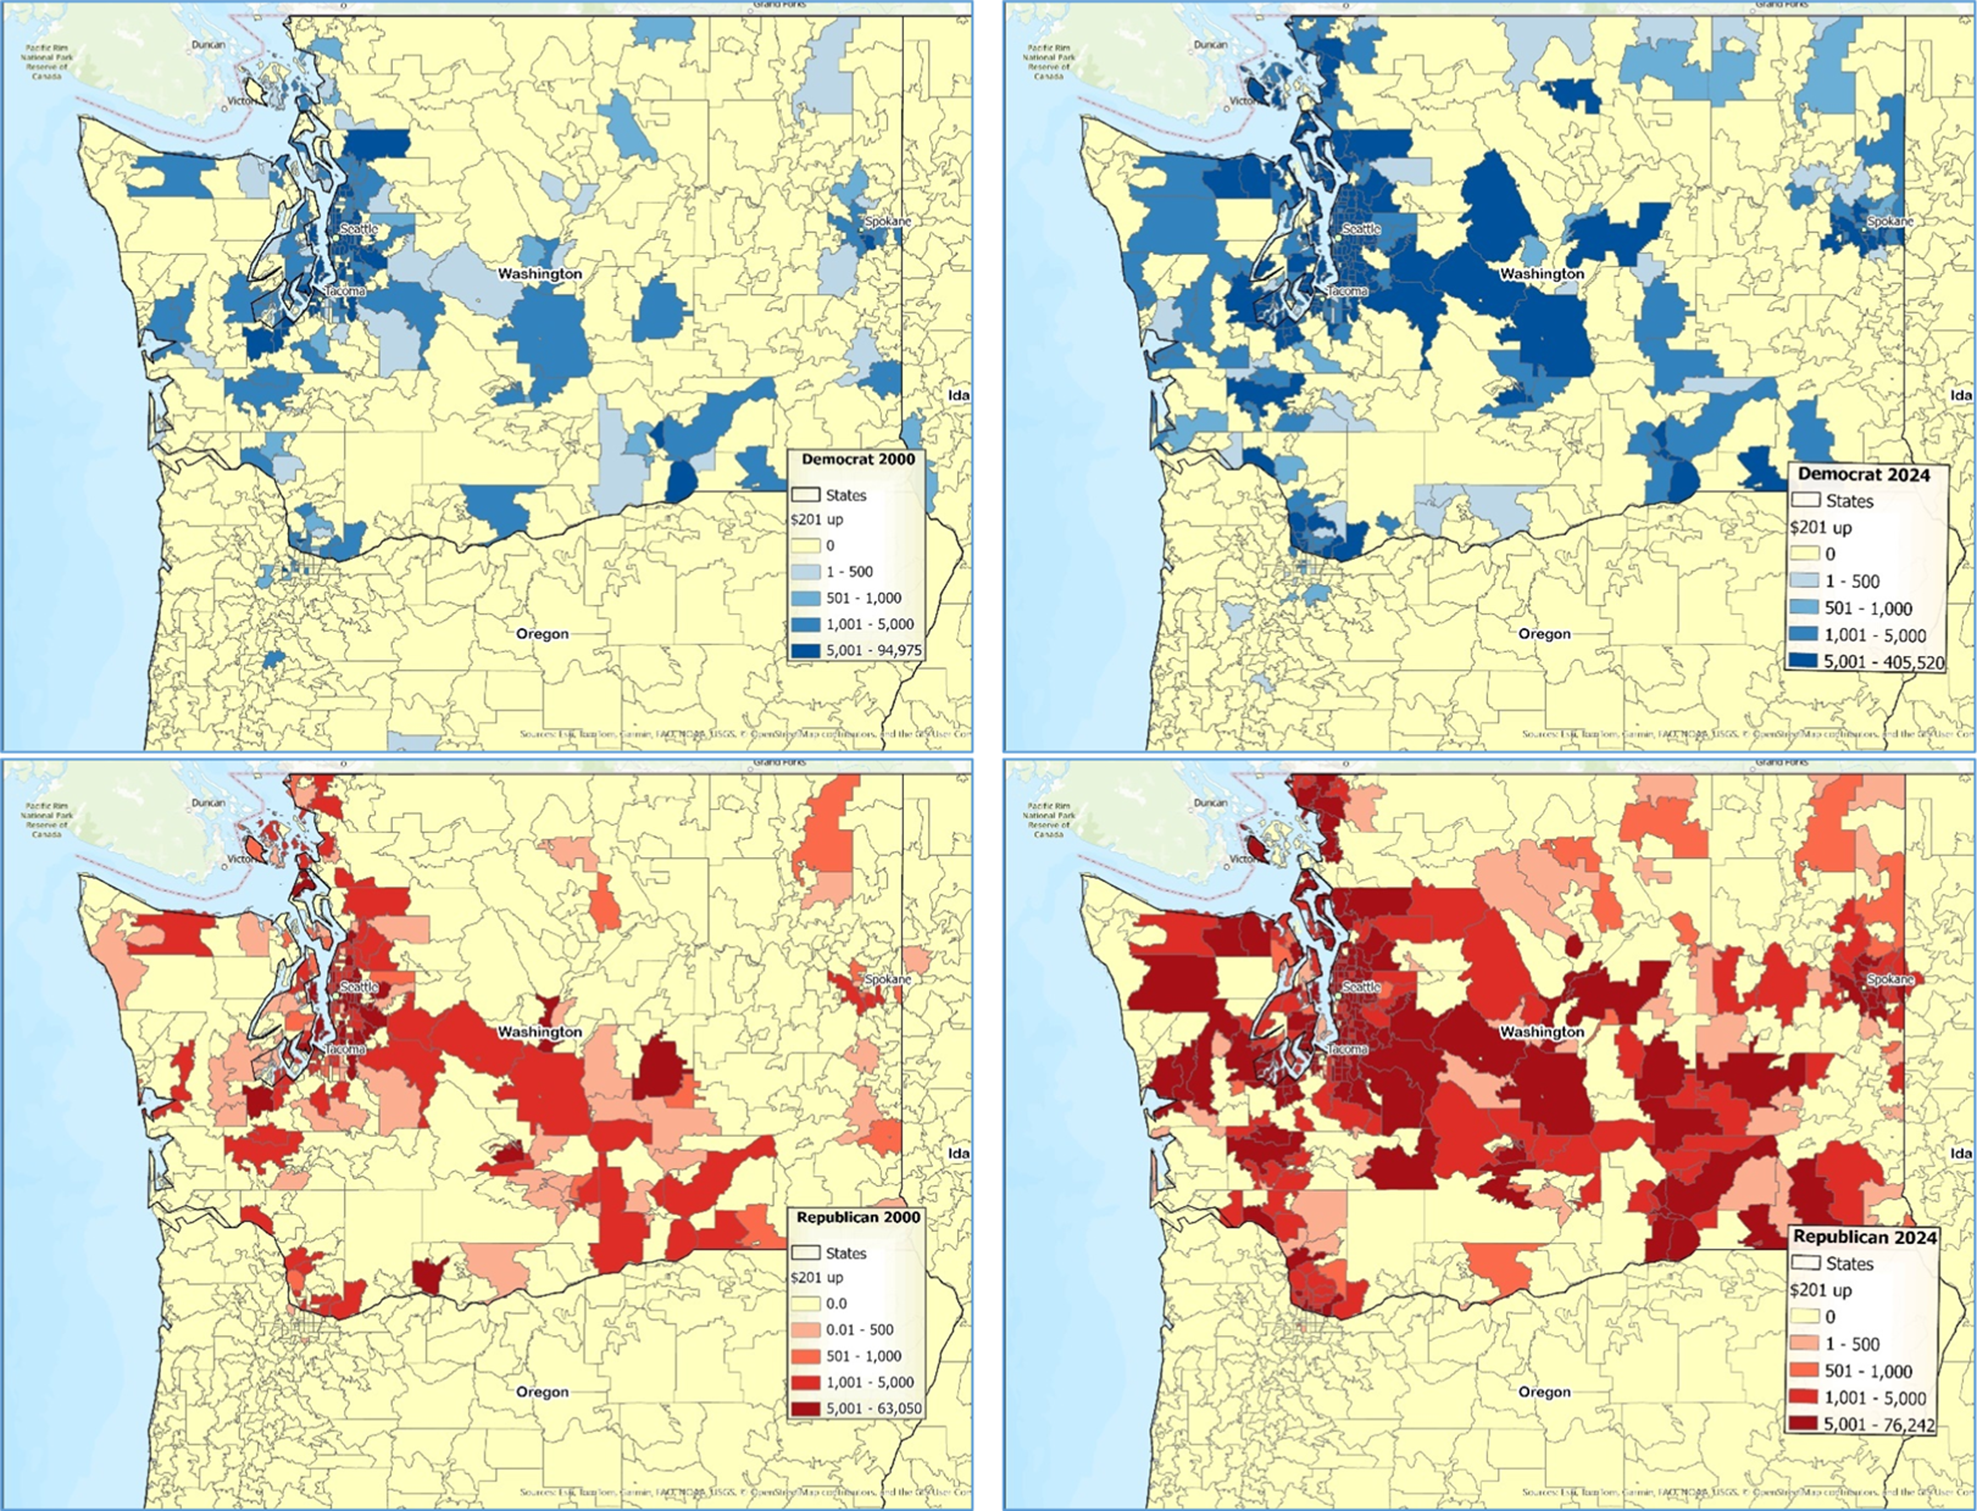
Figure 2. The changing geography of large donations (>$200) in Washington state gubernatorial elections, 2000 (left) and 2024 (right), Democrats top, Republicans bottom.
Readers should immediately notice the differences in the geographic expanse of the small donorate (see Figure 1). Defined in terms of both breadth (more locations contributing) and depth of giving (previous locations giving more), Democrats have built a much larger small donor pool. In the 2000 reelection bid of Democrat Gary Locke, donations came in preponderantly from the Puget Sound area – the assemblage of affluent communities “along the water,” as the colloquial local description goes. But by 2024, the Democratic campaign found many more donors mobilized to give $200 or less, and from far more places than before. Small donors to Ferguson’s election in 2024 also spilled across the borders into Oregon, but in 2000, those locations showed less interest. On the Grand Old Party (GOP) side, Republicans’ small donor geography has also expanded, and with vastly more small donations arriving by the end of 2024 (Figure 1 bottom). Financial support originates from more parts of the state but also shows deeper pockets of contributing in the places that had donated before.
As for the large donors, the two Democratic maps shown in Figure 2a,b (top) exhibit contributions to campaigns occurring more than two decades apart. To be sure, there is continuity, signaling fundraising habits among the wealthy. Of the top 20 contributing locations in both years, 13 were in the city of Seattle in 2000, 12 in 2024. Other hot spots in common included Bellevue, Kirkland, and Mercer Island (situated in Lake Washington between Seattle and Bellevue). But more than just greater depth of contributing, the Democratic large donor map has also expanded outward from previous locations – registering a 190% increase in the number of contributing zip codes across a generation.Footnote 7
For Republicans (Figure 2, bottom), large donor sums lag well behind the Democratic opposition in both the 2000 and 2024 elections, mainly a function of nominees who were running against better-known Democrats who were entering the contests with polling leads and therefore less able to attract elite “investors.” Even so, Republicans reaped large donation amounts from 438 distinct locations across the state (and nationally) in 2024, compared to just 224 in 2000, a considerable 96% increase (see Figure 2c,d for visible contrast).
A major takeaway from the maps is that small donors have geographically dispersed the money chase for both parties in the Evergreen State. The difference across more than two decades has been greater for Democrats since they raise more total dollars, but even for the consistently second-place Republicans, there has been a blossoming of donations from places that had never contributed before. Certainly, this growth reflects the greater ease of online giving on party platforms such as WinRed and ActBlue (Kim and Li Reference Kim and Li2023). But it also suggests that more voters have learned to augment their level of political participation from simply voting to now donating at least small sums.
Modeling the large and small donor bases
If small donations are an emergent phenomenon, they are not necessarily democratizing the voices behind campaign giving if they are emerging from the same neighborhoods that the large donors reside. It is entirely possible that the small contributions arise principally from the same loci of support that the large ones do. Substantial intersection would certainly hint that there are few substantive differences between the two, they are largely the same people, in the same walks of life, simply choosing to give smaller sums. To the end of evaluating these differences, we begin by setting forth some descriptive statistics for contributions to the major party general election candidates across seven gubernatorial election cycles. We then use multivariate statistical tools to evaluate the differences between the amounts contributed by those giving under $200 per cycle, compared with those contributing more than $200.Footnote 8 To address the question of whether the two bases of support are intersecting or disjoint, we explicitly look for zip code variation in economic, demographic, geographic, and political characteristics hypothesized to stimulate or suppress giving, including population size in number of households; median housing value; median income; the percent African American; percent Hispanic; distance the donor resides from King County, Washington, the state’s economic and political balance point; and the partisan political inclination of the county of residence.
These specific tests for difference are advanced for familiar reasons anchored in the earlier cited works. Both asset wealth (housing value) and money income are expected to be positively associated with the amounts contributed. Campaigns prospect chiefly among those who have given before and among those who have the disposable income to contribute. These citizens are largely found in the most affluent areas of any state. Our straightforward expectation is that small donations will be less contingent on the wealth of the originating neighborhoods than the larger ones, and that this will become truer as small-dollar contributing becomes more common.
Consistent with previous research, we expect locations with large Latino and African American populations to give less to candidates of both parties as a function of having fewer resources than white voters (Grumbach and Sahn Reference Grumbach and Sahn2020; Verba et al. Reference Verba, Schlozman, Brady and Nie1993). Not only are these populations less prosperous, on average, but they may also sense less of a connection to politics, expressing shallow interest in participating in ways other than voting. Once again, however, a reasonable expectation is that small donations will emerge more plentifully out of these diverse locales than high-dollar ones. Even voters with modest incomes may be coaxed by campaigns to contribute $5, $25, or $50 in a highly competitive contest when the stakes are made clear. In our multivariate estimates, we also account for population size (reexpressed in 1,000s), as simply having more people will be predictive of more contributors.
We account for distance in miles to King County (Seattle and suburbs) to account for the dispersion of current and former residents of Washington outward from the state’s political power center. Those beyond the state’s borders may be either permanent expatriates or temporary, but we hypothesize that some will offer small donor support to gubernatorial candidates. Because of the well-known social science finding that the influence of a central location decays with distance, we expect to find a decrease in the amounts given as distance from the center of state economic and political gravity increases. To be sure, not all distant contributions will flow from members of the diaspora of Washington State natives, per se. Others may contribute simply because they like a particular candidate or the policies that candidate promotes, but we would still expect this support to diminish with distance.
We also expect to find that small donors emerge out of an increasingly partisan and policy-motivated electorate and are not simply wealthy people living around the corner from established big donors only giving less. Small donations are hypothesized here to be less contingent upon the affluence of the neighborhood and the presence of existing donors and therefore emerging from a broader diversity of locations. Specifically, we hypothesize that the small donorate will be more representative of the geography of partisan loyalty in the electorate, since these contributions hinge less on affluence and more on the issue orientation and ideological commitments of activists (Barber Reference Barber2016b). The data analysis will likely show that Republican small donors will increasingly be observable giving from very Republican-heavy locations, while Democratic donations can be expected to arrive from areas where that party is a majority presence. Washington does not register voters by political party, and although we do not have zip code data on the partisan commitment of voters in the state, or of partisan performance in elections, we draw upon the county-level Republican and Democratic percentage of the presidential vote (averaged over the previous three elections) as an approximate and recognizable measure of local electoral leaning.Footnote 9
Accounting for spatially related contributions
While we expect to find small donors emerging in previously donor-barren places, we still must address the well-known fact that contributors tend to be clustered in space. To this end, we incorporate the effects of the spatial influence and proximity of donors to each other by estimating models with spatially lagged dependent variables.Footnote 10 Campaign contributions are known to follow a pattern of positive spatial dependency, exhibiting a clustering of similar values on neighborhood, zip code, and county maps (Anselin and Bera Reference Anselin and Bera1998). The similarities in giving across nearby areas are reflective of both the concentration of affluence and the presence of donor networks responsible for heightened activism (Cho and Gimpel Reference Cho and Gimpel2007; Gimpel, Lee, and Kaminski Reference Gimpel, Lee and Kaminski2006). Because donors across neighboring zip codes share much the same political and economic context, there is typically substantial similarity across locales in both opinion and behavior. They may also communicate with each other and live close enough to observe one another directly. These communications and observations are thought to exert a kind of social influence that contributes to the regular observation of similar values of the dependent variable across adjacent areas.
Across US elections in many states, we do observe campaigns that do not rely on individual contributions but are largely self-financed by the candidate joined by a few affluent associates. If a candidate self-finances, or relies solely on family and friends for support, there may not be much geographic variation to explain, little diffusion, and certainly no regional clustering of financial support. Having pointed out this possibility, we generally hypothesize the presence of a positive spatial lag effect indicating that a location’s giving will be closely related to the giving of nearby areas.Footnote 11 Precisely because it is not obvious that every campaign will attract donations that exhibit spatial dependency, we explicitly test for it in the reported data analysis.
To accomplish this goal, we estimate spatially lagged regression models, implementing a weights matrix that linked the average small (or large) donor sum from the zip codes lying within a 20-mile distance band to compute a local mean that is then included as an explanatory variable (Anselin Reference Anselin2002). There is nothing particularly magical about including the zip codes within 20 miles, as opposed to 15, or 30. Our decision was informed mainly by the variable land area and population density of the state’s zip codes, as well as exploration of the variable patterns of contributions, showing peaked patterns of high donor activity across short distances, with less donation activity further away. Given this geographic pattern, if too many neighboring areas are included, the regional average produced is too small to capture the highly peaked nature of contributing from especially active donor locales. The spatial dependency in the errors may not disappear by making such an overly broad adjustment. On the other hand, if too few neighboring locations are included, the regional average produced may be too large, reducing spatial clustering in the error in areas of extremely high donor activity, but not in outlying areas of moderate and low contributing. Evaluating the alternatives included the study of semivariograms of contributions (Karl and Maurer Reference Karl and Maurer2010; Palmer Reference Palmer2002) and led us to settle on a 20-mile distance band as a suitable middle ground between sparsity and density. Post-estimation tests of the residuals produced from the spatially lagged regression models show that we reduce Moran’s I to negligible and acceptable levels (see bottom row of regression output).
Results from estimation
Estimation results from regression models with spatially lagged dependent variables are shown in Table 3 for each gubernatorial election from 2000 to 2020, and in Table 4 for 2024, by party and contribution amount. Though there is a large volume of results to report, a few consistent findings stand out. Most obviously, the coefficient for the spatially lagged dependent variable is always positively related to contributions at the location of interest and is highly statistically significant. In 2016, the relationship among neighboring zip codes weakened somewhat for Republicans, demarcating new patterns of giving that year, but by 2020, this distinctiveness subsided. Clearly, neighboring zip codes are alike in their behavior, perhaps attributable to the arbitrariness of zip code boundaries and the routine interactions of network donors across them. Population size, an indicator of the number of potential contributors in a locale, is typically associated with higher donation amounts for both parties, as we expected. Another common pattern is that donations decline with distance from Seattle, for both parties, in every election. Having said that, the steepness of the decline with distance does shrink for the 2016 and 2020 contests, suggesting the geographic dispersion of donations, including an increase in out-of-state contributions. Home value appears to operate similarly to population size. Just living in an area with higher asset values means more disposable income can flow to campaigns for both parties. More people from more affluent neighborhoods means more contributions. Interestingly, larger amounts flow in from locations with higher percentages of white residents, but the share of black residents is also positively associated with larger contribution amounts – for both political parties. The locations with sizable black populations do contribute more to Democrats than to Republicans, however. Even so, the positive and significant coefficients across the board suggest that more money flows to campaigns from locations where there is a diverse racial and ethnic presence, the state’s larger cities.
Table 3. Influences on gubernatorial campaign contributing by party of candidate, contribution size, and election cycle, Washington state 2000–2020
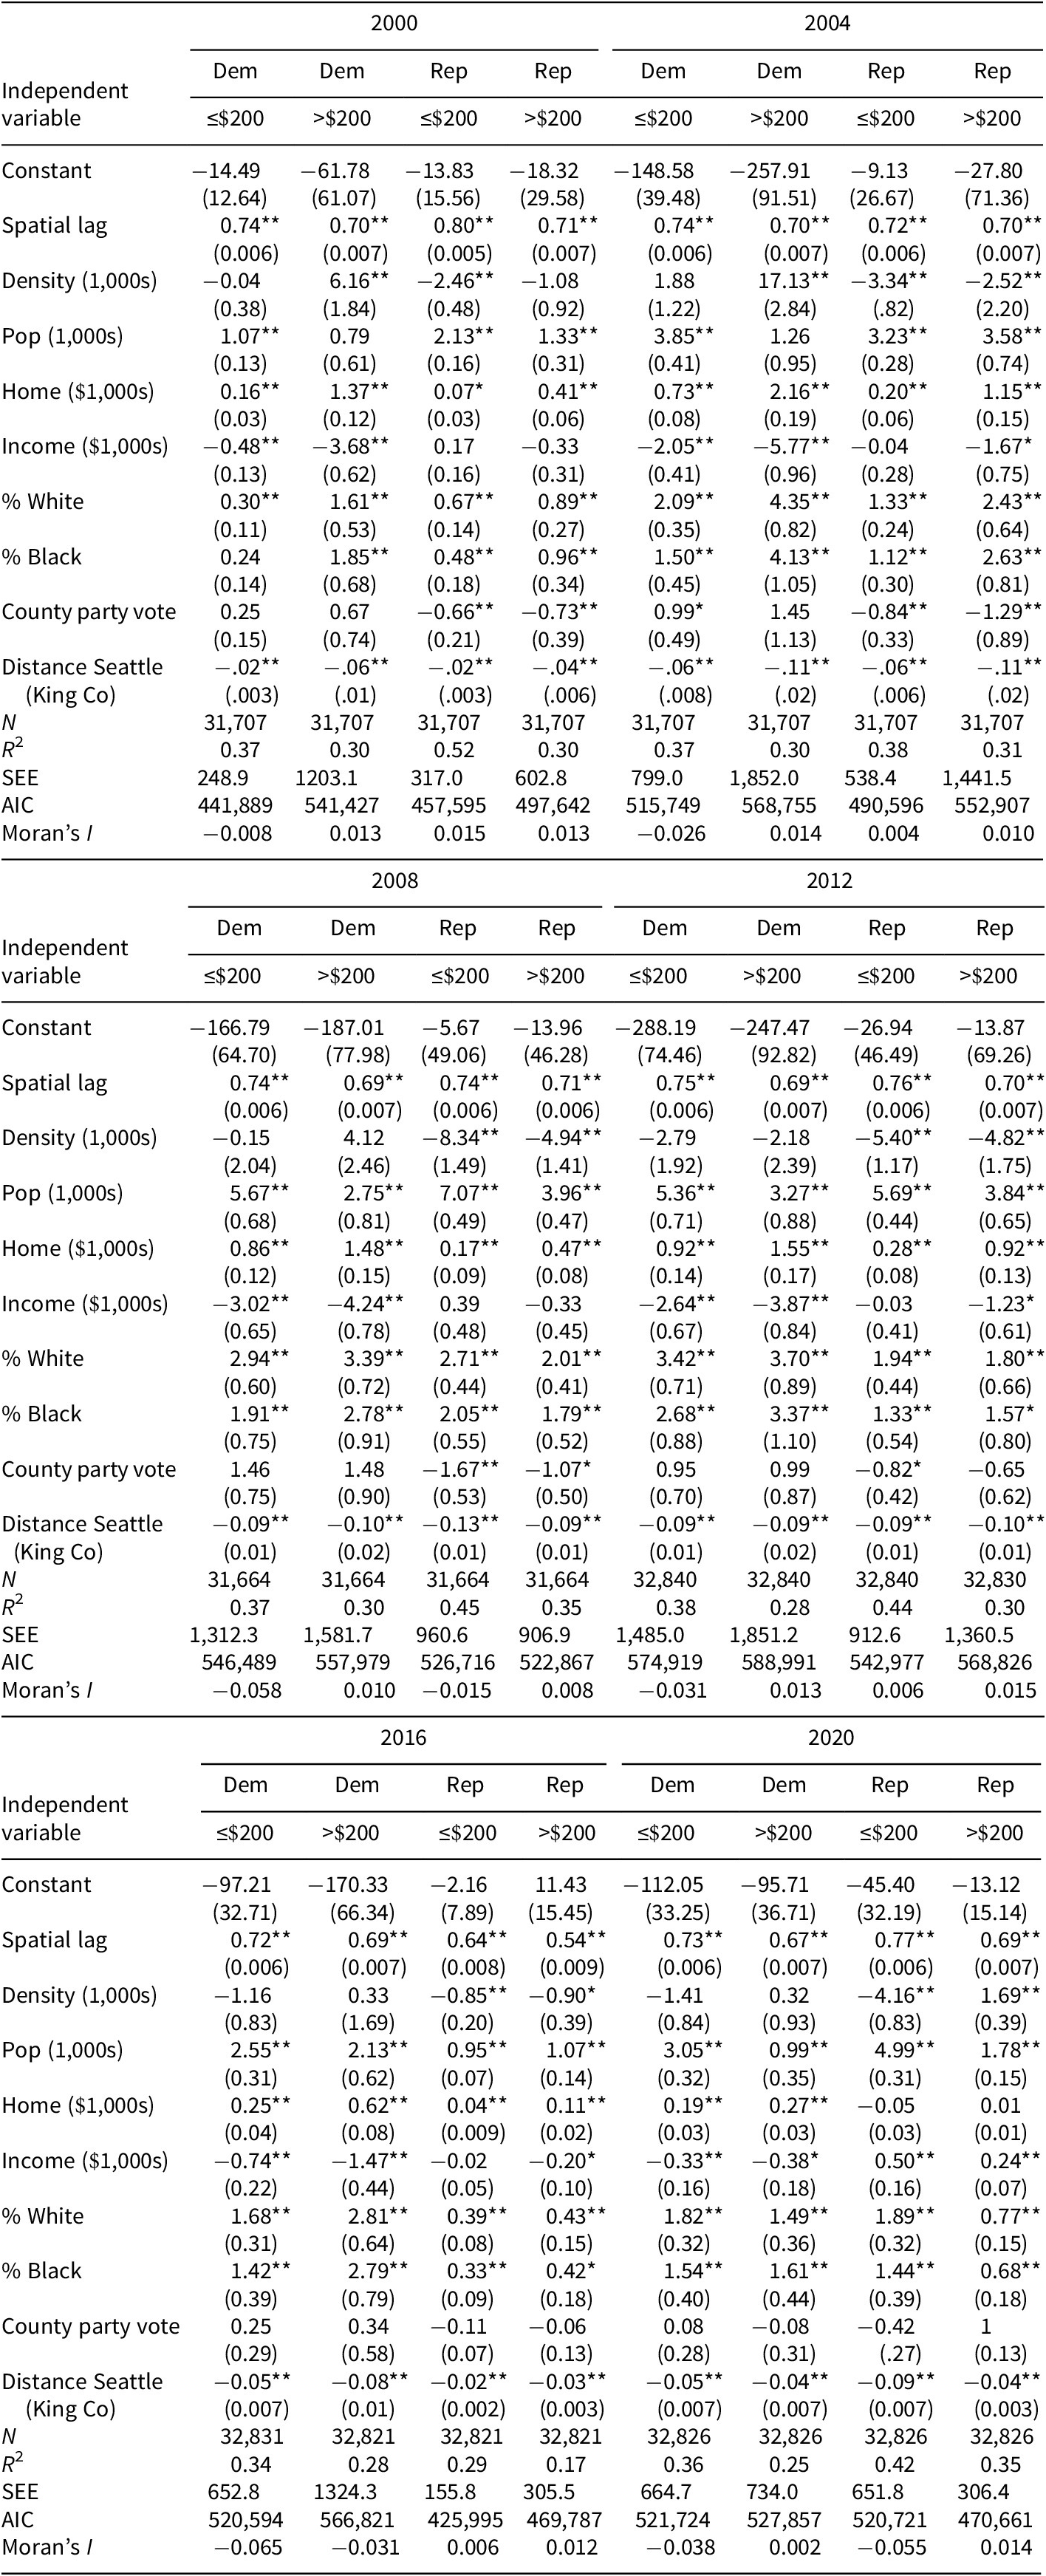
Multivariate regression, spatial lag estimation (20-mile distance band).
Dependent variable. Amount contributed by zip code in designated amounts on columns by election cycle and political party receiving the contribution.
*p ≤ 0.05; **p ≤ 0.01.
Table 4. Influences on gubernatorial campaign contributing by party of candidate, contribution size, and election cycle, Washington state 2024
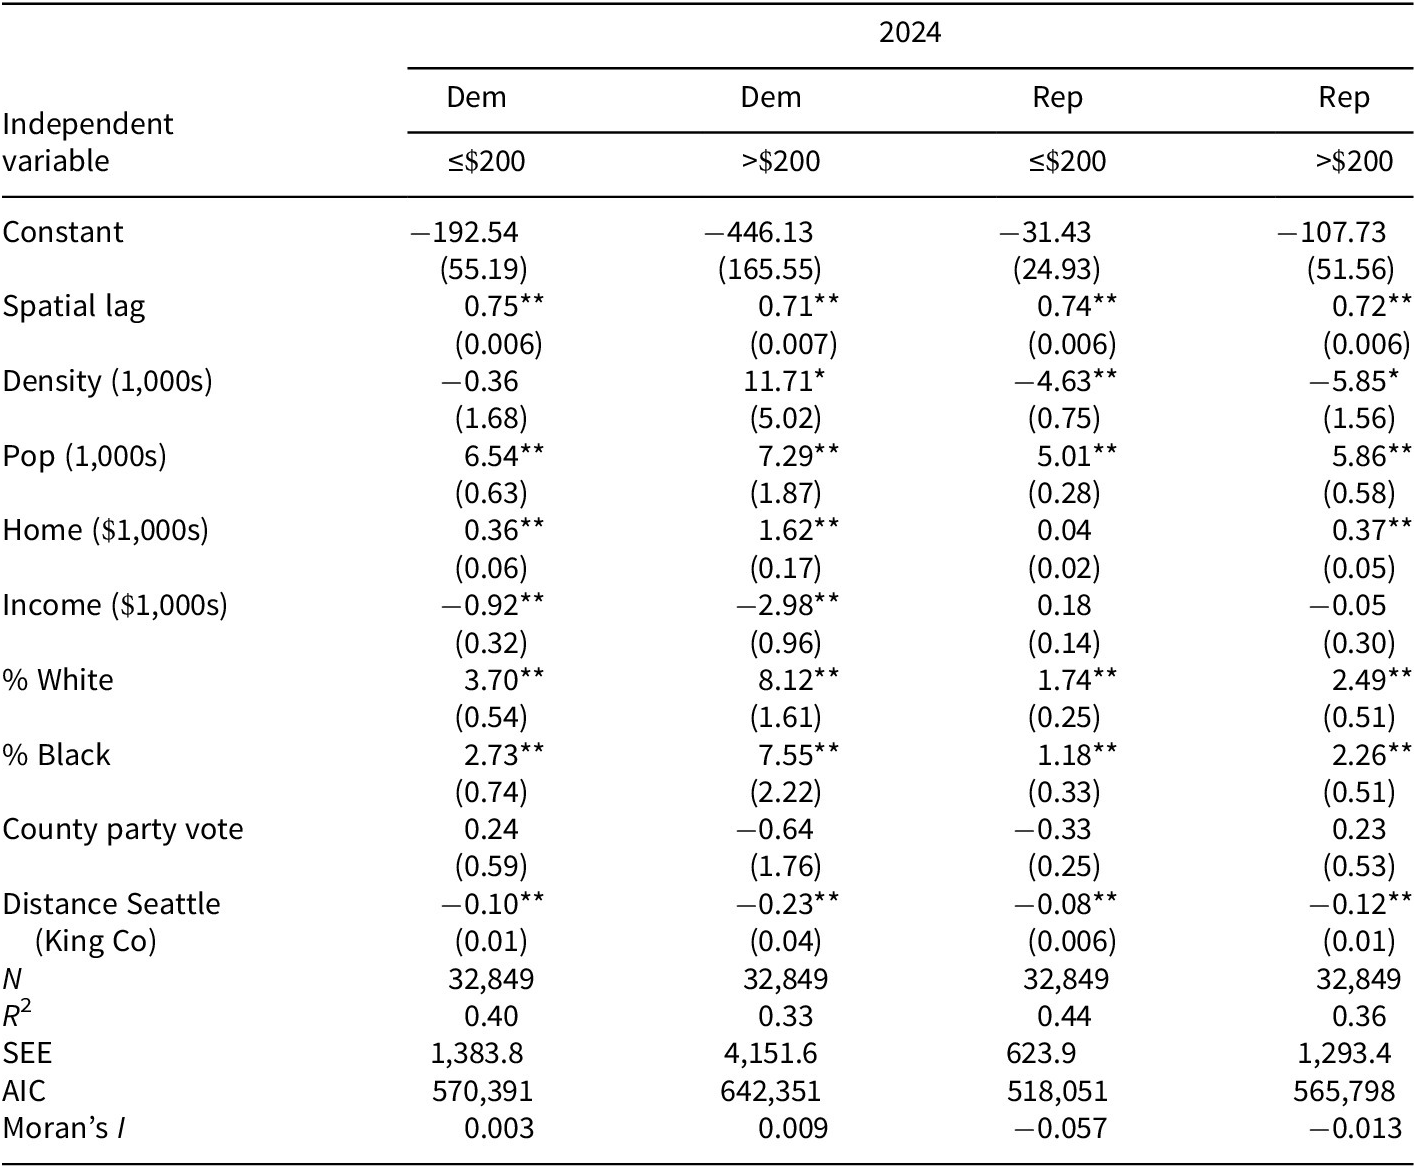
Multivariate regression, spatial lag estimation (20-mile distance band).
Dependent variable. Amount contributed by zip code in designated amounts on columns by election cycle and political party receiving the contribution.
*p ≤ 0.05; **p ≤ 0.01.
Other relationships in the analysis appear to be contingent upon either party, contribution size, the specific election cycle, or all three. Republicans, for example, show less of a tendency to contribute from places where their party has recently won presidential elections by wide margins. Undoubtedly, these are more rural areas of the state where Republican identifiers are a lopsided majority, but the populations are unaccustomed to contributing money to political campaigns. In all results for Republicans giving up to 2016, the coefficient for the county’s co-partisan support is negative and statistically significant. For 2016 and 2020, the relationship is still negative, though not statistically significant, evidently a sign that some sparsely populated locations exhibiting strong Republican support began to contribute, likely for the first time. For Democrats, there is not always a statistically discernible relationship between the county vote for Democrats, and zip code level support for Democratic gubernatorial candidates, though unlike Republicans, the association runs in a negative direction only once (in 2020 and not significantly so).
Population density, a measure of urban residence capturing high- or low-density settlement, has the intriguing impact of heightening Democratic giving or having no statistically consequential impact at all. For Republicans, however, density is always associated with less giving and nearly always to a statistically significant degree. These results indicate that not all Democratic donors come from urban districts but far more do than Republicans.
High income was hypothesized to increase large donations to both parties. In fact, it does not always have that impact. For Democratic campaigns, higher-income locations are regularly associated with larger sums from small donors, once we account for other explanatory factors, including home value. Importantly, there are neighborhoods with high home values, but registering moderate median income, a pattern present in cities exhibiting high economic inequality. Certainly, Democratic donors are not always residents of high-income neighborhoods, which would be the case if they reside in Seattle and other large cities in neighborhoods that are heterogeneous by socioeconomic status. Republicans from locations registering high median income do not appear to give more on a consistent basis, the exception being 2020 – but giving is generally not well predicted by the income of the donor’s zip code of residence. High home values (asset wealth), on the other hand, present mainly in the Puget Sound region, are predictive of giving to candidates of both parties across nearly every election.
Where are the differences by size of contribution to be observed? A key difference appears in the distance estimates for Democratic giving. These coefficients often show that the large donations to Democrats emerge from locations more proximate to Seattle and Western Washington and decline more rapidly with greater distance than the small donations do. This finding reflects the mapped patterns that display the small donations flowing from a wider variety of locales. Large dollar gifts to Democrats also originate from locations that are populous and diverse (e.g., Seattle metro), compared to their small donations. The 2024 contest (see Table 4) shows the reliance of the Ferguson campaign on big-city contributors – one standard deviation (σ = 5.2) increase in 1,000s of people per square mile – increased donations from large donors by $58.55, but dropped contributions to Reichert by $30.42. Large donors to Democrats still exhibit their historic urban origins, whereas their small donations have emerged increasingly from a diffuse geographic base. Again, drawing on the results presented in Table 4, with every 30 miles outward from King County as a simple linear function, Democratic large donations drop by about $6.90, but their small donations drop by only $3.00, showing the more even geographic dispersion of the small contributors.
Republicans were never as reliant principally on big cities for contributions as Democrats, so their larger and smaller donors were found more often in outlying suburban areas of the Seattle metro, as well as in the secondary cities (e.g., Spokane, Yakima) and smaller towns. In 2024, Republican large donations dropped about $3.60 for every 30 miles of distance from King County, with small donations dropping about $2.40 over that same distance. Across these elections, what has changed most about Republican contributing is that more small contributions are flowing in from areas that were previously known for giving only large contributions.
Conclusions
Observations from Washington State offer insight in the development of the small donorate because it is neither as large as California, Texas, or Florida nor as closely monitored by the rest of the country as many other states. In recent years, it has not been considered an electoral battleground, and yet it is not as lopsidedly one party as other reputedly “blue” states have been. Republicans have been shut out of the governorship since 1985, but gubernatorial elections are not usually decided by landslide margins. This means that campaign contributions count, and donors can see that their involvement could matter to the outcome. Politicians from the state are not invisible but have not been showered with attention as potential presidential prospects. Governor Jay Inslee ran briefly for president in 2020, emphasizing an environmental platform, but dropped out of the race quite early (August 2019). What this state’s political milieu might predict is a steady stream of contributions flowing to the state’s most competitive races, but no expansion of the donor base consistent with patterns observed higher on the ballot, in presidential contests, and in other states (Ferguson et al. Reference Ferguson, Gimpel, Owens and Shaw2024). But instead, we see the emergence of a robust “plutopopulist” donorate (Kates et al. Reference Kates, Manning, Mendelberg and Wasow2025), not at all unique to Donald Trump. On the contrary, these developments in campaign contributing are a general phenomenon, extending back in time, well down the ballot, and in both major parties.
Here’s the bottom line: despite its peripheral status in the grand vista of US politics, we do see the same expansion of the small donorate in Washington State that is visible in presidential elections and in contests in states considered more visible on the national stage. We should not forget the election calendar, and the fact that the state’s gubernatorial elections are held in presidential election years. Undoubtedly, the same small donors that were activated by the candidacies of Barack Obama, Bernie Sanders, Hillary Clinton, Joe Biden, and Donald Trump were also inclined toward involvement in the coincident gubernatorial contests. Patterns that emerge in the contest for the presidency will likely influence Washington State’s local politics more than in nearby Oregon, Nevada, or Idaho, holding governor’s races in off years.
There has been no staggering rise in individual donations from outside the state, consistent with what Ferguson et al. (Reference Ferguson, Gimpel, Owens and Shaw2024) observed in Texas elections. Within Washington State, however, the small donor revolution is as vigorous and active as in states with a higher national profile. Apparently, political learning spreads quickly across the federal system, not just among voters, but among candidates and campaign professionals who are adopting new strategies to heighten grassroots engagement. The ease of giving small donations using online platforms has facilitated small donor development (Kim and Li 2003), but voters must still come by the motivation to sign in and give. Convenience helps but it would be hard to argue it is the first cause of heightened small-donor engagement.
What tangible and measurable impact the new activism has on state politics and policy may not be visible for some time. In states with unlimited individual contributions, legions of small donors are required to contribute at a level that would displace the “plutocrats.” The low ceiling on contributions in Washington State is a potentially important factor here. If small donors are a transformative force, their greater involvement should register in states with low contribution ceilings far more quickly than it would in states with higher ceilings or none. In Washington State, neither party appears to be disadvantaged in the competition to attract the involvement of smaller donors. That does not mean that Democrats will face the same pressures from the influence of small donors that Republicans do. To the extent that small donors within each party hold more polarized policy views than larger ones, further right, and further left, we might well expect an accelerated drift to the poles. On the other hand, a heightened polarization may only be temporary, lasting only until the small donorate expands to encompass partisans of more middling and moderate ideological temperament. For this to happen, however, campaign contributing needs to be viewed as an important and vital form of civic participation, as critical as voting, and less as a corrupting force. The small donation needs to become a new norm in US political participation, not just for single-issue voters and those highly motivated by policy goals.
Funding statement
None declared
Competing interests
The authors declare none.
Author biographies
Isabelle M. Gibson is a Ph.D. student in the Department of Government at the University of Maryland, College Park, and hails originally from Seattle, WA.
James G. Gimpel is a Professor in the Department of Government at the University of Maryland, College Park.


 Open access