INTRODUCTION
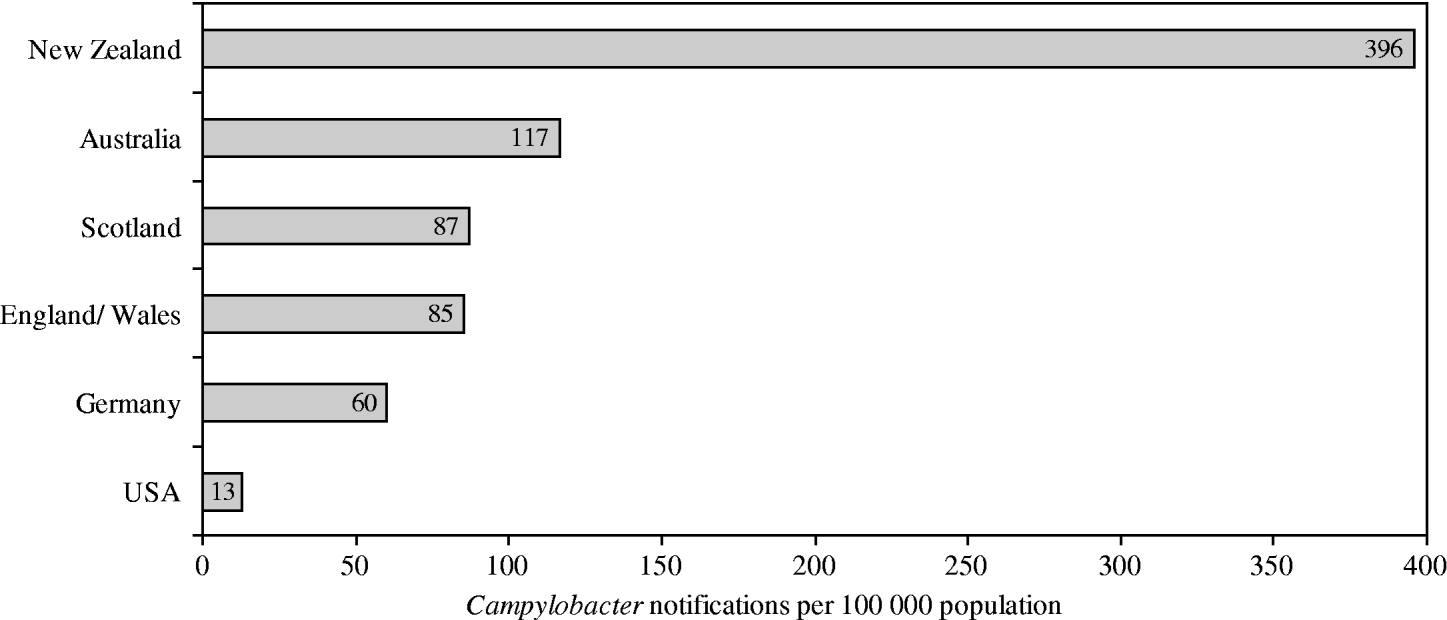
Although different surveillance systems complicate international comparisons, New Zealand's rates of campylobacteriosis are among the highest reported rates worldwide (Fig. 1). Rates in New Zealand have increased from 14/100 000 population in 1980, when the disease became notifiable, to 396/100 000 population in 2003 [Reference Baker, Sneyd and Wilson1]. For this increase no conclusive reasons have yet been clarified. While the disease is usually self-limiting within 3–7 days, severe sequela can arise, including reactive arthritis (1%), respiratory and severe neurological dysfunctions (0·1%), or death (0·1%) [2, 3]. Hospitalization arises in about 13% of cases [2]. The total annual economic costs (medical and non-medical) of Campylobacter infections in New Zealand have been estimated at NZ$40 million, which is about 73% of the country's total economic cost of foodborne infectious diseases [Reference Scott4].

Fig. 1. Notification rates for selected affluent nations in 2003. (Adapted from Baker et al. 2006 [Reference Baker, Sneyd and Wilson1].)
Regulated by the Health Act 1956 and the Tuberculosis Act 1948, any suspected or diagnosed case of campylobacteriosis is required to be reported to the local public health service. On suspicion of a case, clinicians and general practitioners (GPs) request laboratory tests and send a notification message to the respective public health unit (PHU) on confirmation of an infection. Since 2007 laboratories are required to report test results directly to one of the 20 PHU offices across New Zealand where the national notifiable disease database (EpiSurv) is maintained [5, 6]. EpiSurv provides the basis for surveillance activities including the identification and monitoring of campylobacteriosis, the investigation of risk factors, and the evaluation of morbidity and mortality trends.
Across New Zealand, there are distinct temporal and spatial variations in the distribution of Campylobacter rates. One recent national study identified three dominant spatial and seasonal patterns: low summer incidence and low inter-seasonal variation in rural areas mainly across the North Island; higher summer incidence and greater degree of seasonality in urban areas mainly across the North Island; and highest summer incidence and greatest inter-seasonal variation in urban areas mainly across the South Island [Reference Hearnden7]. These observed trends are generally consistent with those reported from other affluent nations such as the UK, Denmark and Finland [Reference Kovats8–Reference Nylen10]. However, the explanation for the spatial distribution of campylobacteriosis in New Zealand is poorly understood, and study designs adopting a spatial approach to consider the aetiology of campylobacteriosis are rare. Earlier research can be grouped into (i) studies which have examined underlying environmental factors, including factors affecting the distribution of Campylobacter (e.g. climate, land use patterns), and (ii) work concerned with characteristics of the population and associated reporting or surveillance mechanisms (e.g. demographic characteristics, deprivation) [Reference Nygård11, Reference Sandberg12].
In order to explain the geographical distribution of Campylobacter, rainfall and different water sources have received some attention [Reference Louis9, Reference Curriero13, Reference Hänninen14]. Heavy rainfall often initiates extreme run-off events which can result in a significant increase of microbiological loads in surface waters. In the environment, the pathogen occurs more frequently during the winter months because the organism grows well in water below 10°C. However, freezing, drying, acid conditions (pH⩽5), UV light, and salinity reduce its growth [Reference Kovats8, Reference Louis9, Reference Altekruse15, Reference Newell16].
Further, drinking water and recreational water have been considered to be significant transmission routes from the environment to humans, and the faecal indicator organism E. coli can be used to estimate the possible presence of Campylobacter in different water sources [Reference Khan, Voice and Phillips17]. A study in Sweden investigated associations between the spatial distribution of Campylobacter incidence and environmental factors related to water and livestock, and water was concluded to be an important transmission route for Campylobacter infections [Reference Nygård11]. In New Zealand, Savill et al. [Reference Savill18] found Campylobacter prevalent in shallow groundwater (75%), river water (60%), roof water (38%), and drinking water (29%). In particular, private wells and roof-water supplies in rural areas are at risk of being faecally contaminated from cattle and wild birds, respectively, as these water supplies remain predominantly untreated [Reference Hänninen14, Reference Gallay19, 20]. A recent study investigating the microbiological quality of roof-collected rainwater of private dwellings in New Zealand concluded that at least 30% of the samples collected were faecally contaminated [Reference Abbott, Douwes and Caughley21].
Pastoral farming is another key aspect in determining the survival and reproduction of Campylobacter in the environment [20]. This factor is likely to be particularly pertinent in New Zealand where about 40% of the land cover is pastoral (e.g. high- and low-producing grassland, scrub/tussock) [22, 23]. Studies investigating the appearance of Campylobacter in rural areas of New Zealand [Reference Devane24, Reference Savill25] identified the pathogen in human as well as in animal faeces, including faeces from dairy cattle, beef cattle, sheep, pigs and ducks. The results indicate that for the examined rural population a range of transmission routes can be related to infected animals. In particular, farm and meat-processing workers, abattoir and meat freezing-plant workers, and veterinarians are at risk of becoming infected [Reference Kapperud26, Reference TeckLok, On and Michie27].
Other risk factors include diet, particularly the consumption of fresh poultry and fresh fruits or vegetables from retail outlets or restaurants, ready-to-eat chicken products and other fast foods [Reference Baker28].
Various characteristics of the exposed population are also significant in understanding the spatial distribution of campylobacteriosis. In New Zealand, the average annual Campylobacter incidence for the period 2001–2003 was significantly higher in males (326/100 000 population) than in females (296/100 000 population), as well as in children (aged <15 years) and young adults (aged <45 years). The reasons for children and young males being particularly susceptible to developing campylobacteriosis have not been clarified. Explanations range from underlying immunological differences between the genders, and children being more likely to see a doctor and thus their infection being notified more frequently. In New Zealand, Europeans show the highest notification rates (329/100 000 population) compared to all other ethnic groups (Māori 94/100 000 population; Pacific people 70/100 000 population; other ethnicities 193/100 000 population) which is linked frequently to socio-economic deprivation. It has been suggested that some of the ethnic differences are associated with poorer access to primary care and health services resulting in lower notification rates for non-European ethnicities compared to Europeans [Reference Baker, Sneyd and Wilson1]. Prior studies from New Zealand found, for example, a negative relationship between disease rates and unsafe water supplies (e.g. outdated sanitary installations, less monitored water supplies) occurring more frequently in socio-economically deprived areas compared to less deprived areas [20, Reference Hales29]. Moreover, differences in laboratory procedures (e.g. detection techniques) or reporting practices between GPs may partially account for the observed spatial patterns in New Zealand [Reference Baker, Sneyd and Wilson1, Reference Scott, Marwick and Crampton30]. Although underestimation of absolute Campylobacter rates has not been quantified, a study from Auckland found that only 49% of the actual cases of giardiasis were notified which indicates that the notified Campylobacter cases might only capture a fraction of the true prevalence of the disease [Reference Hoque31].
This ecological study investigates the spatial distribution of campylobacteriosis in New Zealand for the period 1997–2005. The study has two objectives. First, we identify areas with particularly high and low rates of the disease, and examine whether there are parts of the country where rates have increased more than in others. Second, we identify whether geographical factors such as climate, land use, water and the food retail environment as well as local socio-demographic characteristics are associated with the spatial distribution of campylobacteriosis. Approaching this topic with a spatial focus will contribute to a better understanding of the mechanisms affecting the distribution of campylobacteriosis in New Zealand, a basic requirement for reducing rates and the costs involved.
DATA AND METHODS
Data sources and data manipulation
For all Territorial Local Authorities (TLAs), excluding the Chatham Islands (n=73), the campylobacteriosis notification data (cases/100 000 population per TLA=dependent variable) were obtained from the notifiable disease database EpiSurv for each of the years 1997–2005 [32]. TLAs are statistical units with a median population of 27 393 in 2001 (Fig. 2). Due to confidentiality constraints, no individual-level information was available.

Fig. 2. Territorial Local Authorities in New Zealand.
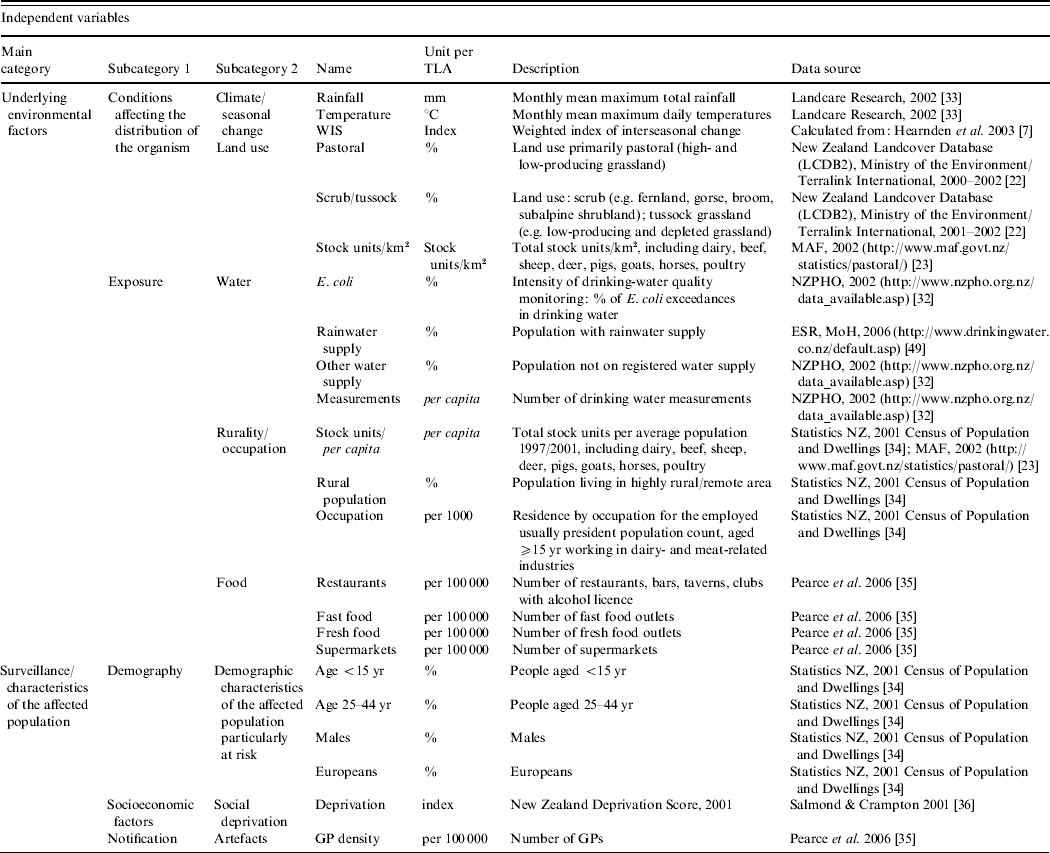
For each TLA, a range of potential area-level explanatory variables were developed (see Table 1). The climate data [Reference Leathwick, Wilson and Stephens33] were aggregated to the TLA level. An index for the degree of seasonal change in Campylobacter rates was calculated for each TLA using data published elsewhere [Reference Hearnden7]. To emphasize higher summer incidence and seasonal variation in certain TLAs, this index was weighted, using the three types of seasonal grouping developed by Hearnden et al. [Reference Hearnden7]. To ensure the comparability of different loads of livestock as a measurement of pastoral intensity, the total number of livestock (cattle, horses, pigs, sheep, goats, deer, poultry) were transformed into stock units (stock units/km2, stock units/capita) (e.g. 1 dairy cattle=1 stock unit; 1 sheep=0·2 stock units) [23, 34]. In order to estimate the possibility of becoming infected from contaminated food, it was assumed that the risk of exposure increased with better access to food retailing. For each TLA, the density of restaurants, fast food outlets, fresh food outlets and supermarkets was calculated (proportion of food outlets and supermarkets/100 000 population) [Reference Pearce, Witten and Bartie35].
Table 1. Campylobacteriosis in New Zealand, 1997–2005, classification and description of the independent variables included in the regression analysis

As outlined above, children are particularly at risk of becoming infected [Reference Baker, Sneyd and Wilson1]. Both of the <5 and 5–14 years age groups were significantly related with the Campylobacter rate (results not shown) and combined as one age group (<5–14 years) to obtain a greater population. To represent socio-economic characteristics of the affected population, a TLA-level measure was derived by aggregating the 2001 New Zealand Deprivation index from the small Census Area Units [Reference Salmond and Crampton36]. The deprivation index is a population-weighted area-level aggregation of nine variables from the 2001 New Zealand Census including, for example, unemployment and low professional education. The higher the index score, the greater the level of socio-economic disadvantage [Reference Salmond and Crampton36]. For all other variables, the original data were either available at or aggregated to the TLA level.
Analysis
In order to determine whether there was an increase or decrease in Campylobacter rates within the study period, the percentage change in the number of incidents reported for 2005 compared to 1997 was calculated per TLA. A standard deviation (s.d.) classification scheme was used to identify areas deviating significantly from the national mean, calculated for the entire study period. The spatial autocorrelation statistic, Moran's I, was calculated to assess statistical significance of spatial clustering which is indicated when the results of the test are >0. For these analyses ArcMap™ 9.1 (ESRI Inc., USA) was used.
Linear regression analysis was applied to investigate whether each of the potential explanatory variables were associated with the aggregated TLA-level rates of campylobacteriosis (1997–2005), using SPSS 13.0 (SPSS Inc., USA). Our a priori assumptions were that all but one of the explanatory variables showed positive associations with the Campylobacter rate; for the variable ‘temperature’ an inverse relationship was expected. The independent variables were entered in a predetermined order based on theoretical considerations [Reference Blakely37, Reference Duncan, Jones and Moon38]. First, 23 univariate models were derived. The subsequent multivariate modelling steps explored how the effects of each of the variables changed with increasing complexity of the regression models within the predefined variable categories, excluding those coefficients for which effects of multicollinearity were observed. Multicollinearity was indicated when high correlation coefficients occurred between the independent variables. Tabachnick & Fidell [Reference Tabachnik and Fidell39] recommend not to include two variables with a bivariate correlation close to r⩾0·7. Modelling step 2 incorporated five models (climate/seasonal change, land use, water, food, demographic characteristics of the affected population), excluding the categories of ‘rurality/occupation’, ‘social deprivation’ and ‘artefacts’ since each of those included only one variable. Modelling step 3 consisted of two models incorporating those variables classified into the categories ‘conditions affecting the distribution of the organism’ and ‘exposure’. The fourth modelling step consisted of two models describing the associations between the variables classified in the categories ‘underlying environmental factors’ and ‘surveillance characteristics’. The fifth modelling step combined all of the variables. Subsequently, the standardized residuals of the final model were tested for the assumption of normality of the error term (one-sample Kolmogorov–Smirnov procedure) and spatial independency (Durban–Watson statistic).
RESULTS
The spatial distribution of campylobacteriosis
The average annual rate across all TLAs for the entire study period was 285/100 000 population. The rates of campylobacteriosis for the period 1997–2005 were not uniform across New Zealand, ranging from 97/100 000 population (Opotiki District) to 526/100 000 population (Wellington City). Over the study period, there has been an increase of Campylobacter rates in 85% of the TLAs (62/73 TLAs) (Fig. 3). The highest increase was in Nelson City (+377%), followed by the Wairoa District (+363%), and the Central Hawke's Bay District (+270%). Of the 11 TLAs with a rate reduction, the largest decrease was in the Banks Peninsula District (−71%), followed by the Opotiki District (−42%), and the Ruapehu District (−36%).

Fig. 3. Percentage change in Campylobacter rates, New Zealand, 1997–2005.
Higher and lower rates (s.d.>±1) appeared to be slightly clustered with a concentration of higher rates in the South Island. Wellington had very high rates of Campylobacter notifications (s.d.>+2), followed by the Selwyn District, Queenstown-Lakes District and the South Wairarapa District (s.d.>+1 to +2), whereas rates in Kawereau, Far North and the Opotiki District were particularly low (s.d.<−1 to −2). The results of the autocorrelation statistic confirmed low, but statistically significant clustering for the Campylobacter rate 1997–2005 (Moran's I=0·11, P=0·01).
Results of the regression analysis
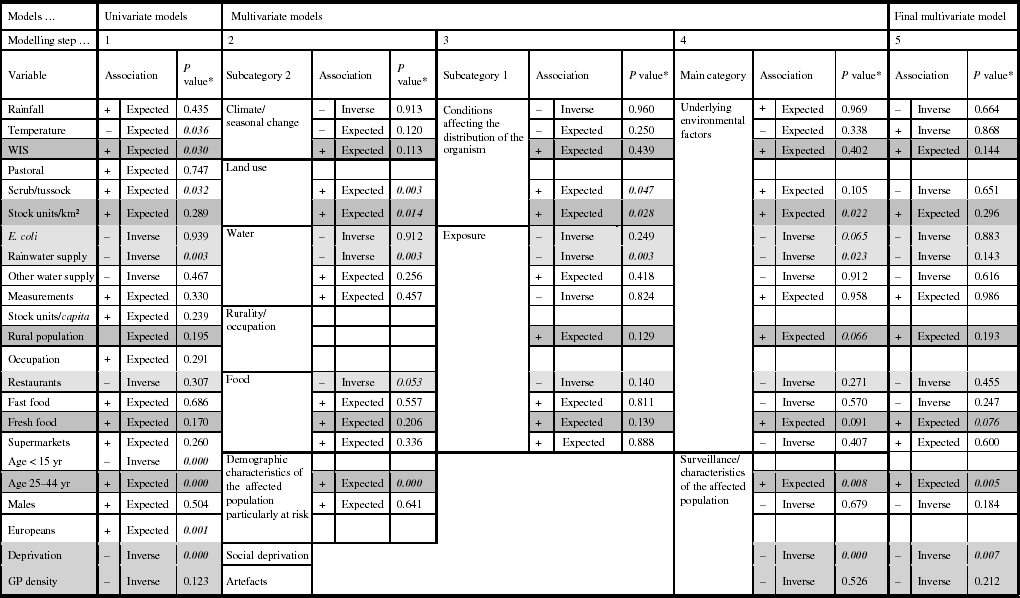
The results of the univariate modelling showed that for 16/23 explanatory variables the associations were in the anticipated direction, and eight coefficients were significantly related with the Campylobacter rate (Table 2). Multicollinear effects were observed for the variables pastoral and stock units/km2, stock units/capita and occupation, stock units/capita and males, occupation and males, population aged <15 years and Europeans, population aged <15 years and deprivation, Europeans and deprivation; hence, five variables were excluded from the subsequent models.
Table 2. Associations from the univariate and multivariate regression models predicting Campylobacter rates in New Zealand, 1997–2005

* Significant P values; P values are very close to being significant at the <0·05 level.
Shading in cells: Dark grey, the relationships are stable and show the expected associations throughout the modelling process.
Light grey, the relationships are stable and show inverse associations throughout the modelling process.
White, the relationships are unstable throughout the modelling process.
The second modelling step showed that 11/15 associations were in the anticipated direction, and four of the variables were statically significantly related to the Campylobacter rate (scrub/tussock, stock units/km2, rainwater supply, and population aged 25–44 years). Modelling steps 3 and 4 showed changes in the direction of associations for six variables, including, for example, rainfall and fast food outlet density. There were no major changes in the levels of statistical significance; only the association between the disease rate and the variable ‘scrub/tussock’ became statistically insignificant.
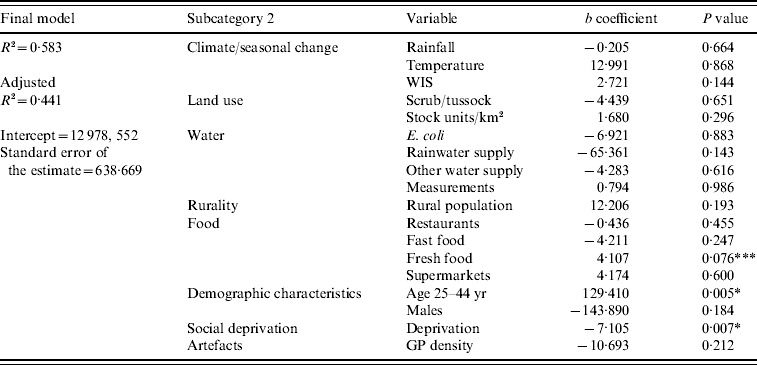
The results of the final multivariate model indicated that higher rates of campylobacteriosis occurred in TLAs with a high proportion of people aged 25–44 years (age 25–44: P<0·01) and a low deprivation index (deprivation: P<0·01) (Table 3). The variable representing a high density of fresh food outlets was close to reaching statistical significance (fresh food outlets: P=0·076). The final model's residuals resembled a normal distribution and indicated a low tendency of negative autocorrelation; consequently, there was no serious violation of the assumption of normality of the error term.
Table 3. Regression coefficients from the final multivariate regression model predicting Campylobacter rates in New Zealand, 1997–2005

* Significant at the 0·01 level; *** close to significance at the <0·05 level.
Evaluating the entire modelling procedure, 5/23 independent variables showed expected and stable associations throughout the regression analysis with no change of the direction of association; those were variables representing seasonality (WIS), pastoral land use (pastoral), rurality (rural population), fresh food outlet density (fresh food outlets), and the 25–44 years age group. Five explanatory variables showed stable, but inverse associations with the disease rate (E. coli, rainwater supply, restaurants, deprivation, GP density); the other variables had unstable associations throughout the modelling procedure.
DISCUSSION
This study examined the spatial distribution of campylobacteriosis in New Zealand. We found that the observed spatial patterns were in line with previous national studies [5, Reference Hearnden7]. Further, our analysis gained insight into the relative importance of plausible area-level determinants of this disease. Some of the variables relating to the underlying environmental factors (e.g. stock units/km2, rural population) and characteristics of the affected population (25–44 years age group) showed expected associations throughout the modelling process, indicating that these variables were independently related to the disease rate [Reference Eberhart-Phillips40, Reference Eyles41].
Interestingly, this analysis provides statistical evidence for a relationship between campylobacter rates and socio-economic deprivation. For New Zealand, there has been little evidence of a distinct association between socio-economic deprivation and campylobacteriosis [20, Reference Hales29], and our results showed a consistent and statistically significant negative relationship throughout the modelling procedure. This finding is contrary to most other health outcomes as worse health (e.g. higher morbidity/mortality rates) is commonly found in areas of lower socio-economic status [Reference Pearce and Dorling42]. Potential differences in food consumption patterns between areas stratified by socio-economic deprivation may explain this relationship. In terms of campylobacteriosis, Evans et al. [Reference Evans, Ribeiro and Salmon43] and Eberhart-Phillips et al. [Reference Eberhart-Phillips40] identified the consumption of fresh vegetables, drinking bottled water and eating out as independent risk factors of becoming infected. These patterns of consumption tend to be associated with higher socio-economic status [Reference Giskes44–Reference Shohaimi46]. Consequently, there could be a higher risk of becoming infected from the consumption of fresh fruits and vegetables in areas of higher socio-economic status. Linking the inverse association identified here between socio-economic deprivation and the Campylobacter rate to the positive association with the variable fresh food outlet density, this study suggests statistical evidence for an interconnection between socio-economic status, the distribution of fresh food outlets and Campylobacter notifications.
Several of the other explanatory variables, however, did not have a consistent or expected relationship with the disease rate. For example, national and international findings have demonstrated a significant underestimation of Campylobacter cases related to contaminated water supplies [Reference Nygård11, Reference Abbott, Douwes and Caughley21, Reference Wilson47], but our study showed little evidence that water is a significant independent contributor to notification rates in New Zealand. However, there is some evidence that higher rates of campylobacteriosis occur during the summer months when outdoor activities such as swimming may increase the probability of infections [Reference Eyles41]. Further, the inverse association between E. coli presence and Campylobacter notifications observed here may be due to regional differences in detection procedures [Reference Khan, Voice and Phillips17]. Frequently, the concentration of E. coli is too low to detect faecal contamination of water. Even if the indicator organism is not detected, the water might be contaminated nevertheless. Conversely, a high level of E. coli exceedances in water is not a conclusive indicator for contamination with Campylobacter [Reference Savill18].
This study has three key limitations. First, applying an ecological study design, the evaluation of the results is confronted inherently with issues related to the ecological fallacy, and it is not possible to infer causality from the observed associations. Second, there are several reasons for inconsistencies between the reported and actual prevalence of campylobacteriosis between regions. People might not seek medical attention for various reasons (e.g. unequal access to healthcare facilities, different view of sickness); hence, their illness is not notified which in turn results in an undercount of cases. Further, the disease might not specifically be diagnosed as campylobacteriosis, but more generally as gastrointestinal infection [Reference Abbott, Douwes and Caughley21].
Finally, the fully adjusted regression model did not account for all of the assumed impacts of different land-use categories, occupational effects, ethnicity and age. Future research could concentrate on identifying those unspecified determinants of campylobacteriosis and on minimizing the multicollinear effects detected here. New data sources and the improvement of the national notification system, including the EpiSurv messaging system provide enhanced surveillance sources. For example, SurvINZ, including the databases EpiSurv and WINZ (Water Information New Zealand), is a new platform where surveillance activities have been integrated to provide more comprehensive and timely information to analyse morbidity trends and to investigate mechanisms affecting the distribution of campylobacteriosis in New Zealand [6]. In particular, it would be interesting to investigate the possibly underestimated role of water in the circle of infection with Campylobacter since the different dimensions of this relationship have not been quantified on a broader scale (e.g. impact of recreational water contact, consumption of tap or bottled water, cross-contamination of drinking water). It might also be useful to study areas where disease rates are lower than expected in order to identify and understand protective factors potentially limiting the increase in rates in some areas. Moreover, it is important to investigate determinants of campylobacteriosis separately for urban and rural areas (e.g. differences in consumption patterns, the exposure to risk factors such as infected cattle or contaminated water supplies), and to study the aetiology of outbreaks and sporadic cases, respectively.
For reducing high rates of campylobacteriosis in New Zealand, banning of fresh poultry from sale and improving consumer education are the most discussed public health implications. In Belgium, for example, the Campylobacter rate dropped significantly when fresh poultry potentially contaminated with the chemical pollutant dioxin was banned from sale for 4 weeks during 1999. Interventions to change consumer behaviour include, for example, information about the thorough cleaning of kitchen utensils, cutting boards, taps, and the rinsing of fresh fruits and vegetables [Reference Baker48].
In conclusion, area-level characteristics exerted an influence on Campylobacter rates in New Zealand over the period 1997–2005, and the observed plausible associations between fresh food outlet density, higher socio-economic status and an increased disease rate cast light on currently relatively unexplored dimensions of campylobacteriosis. Infections with Campylobacter present a complex, persistent, increasing and expensive public health issue. Regarding the high rates of campylobacteriosis, current public health interventions appear to be insufficient, and further research is necessary to effectively target particular causes of the infection. Socio-economic conditions might be a key factor in explaining spatial differences in Campylobacter notifications across New Zealand.
ACKNOWLEDGEMENTS
This research was funded by the GeoHealth Laboratory, a joint initiative between the University of Canterbury and the Ministry of Health, New Zealand.
DECLARATION OF INTEREST
None.


