The Hospital Anxiety and Depression (HAD) rating scale (Reference Zigmond and SnaithZigmond & Snaith, 1983) has been established as a much applied and convenient self-rating instrument for anxiety and depression in patients with both somatic and mental problems, and with equally good sensitivity and specificity as other commonly used self-rating screening instruments (Reference HerrmannHerrmann, 1997; Reference Bjelland, Neckelmann and Tangen HaugBjelland et al, 2001). According to these reviews, however, several psychometric issues of the HAD scale are in need of further clarification because most psychometric studies of the scale have been done on small (n<250) and selected samples of patients with cancer or other somatic illnesses:
(a) Factor structure of the HAD scale. From a sample of 226 Belgian cancer patients, Razavi et al (Reference Razavi, Delvaux and Farvacques1990) concluded that the HAD scale should be considered a unidimensional scale of mental distress. In contrast, Moorey et al (Reference Moorey, Greer and Watson1991) found that principal component analysis (PCA) demonstrated two dimensions of the HAD scale in a sample of 568 British cancer patients. A two-factor solution on the scale using PCA is also reported in clinical samples by Sigurdardóttir et al (Reference Sigurdardóttir, Bolund and Brandberg1993) (89 patients), Hammerlid et al (Reference Hammerlid, Ahlner-Elmqvist and Bjordal1999) (357 patients) and Savard et al (Reference Savard, Laberge and Gauthier1998) (162 patients). In contrast, Lewis (Reference Lewis1991) reported a three-factor model in a sample of 117 patients but it showed a poor ‘goodness of fit’. On samples from general populations, both Spinhoven et al (Reference Spinhoven, Ormel and Sloekers1997) and Lisspers et al (Reference Lisspers, Nygren and Söderman1997) did PCA and found support for a bifactorial solution. Using confirmatory factor analysis, Dunbar et al (Reference Dunbar, Ford and Hunt2000) reported empirical support for the tripartite model of Clark & Watson (Reference Clark and Watson1991).
(b) Intercorrelation of the sub-scales. Pearson's correlation coefficient between the HAD scale's anxiety and depression sub-scales (HAD—A and HAD—D) is reported to be 0.49-0.63 (Reference LewisLewis, 1991; Reference Moorey, Greer and WatsonMoorey et al, 1991; Reference Leung, Ho and KanLeung et al, 1993; Reference Watson, Clark and WeberWatson et al, 1995; Reference Spinhoven and van der DoesSpinhoven & van der Does, 1997; Reference Savard, Laberge and GauthierSavard et al, 1998). A tendency towards higher correlations is reported in studies with more somatic pathology compared with healthy samples. Such values demonstrate a moderate intercorrelation between the anxiety and depression sub-scales that is in accordance with both clinical findings and theoretical viewpoints regarding the co-occurrence of such symptoms (Reference Üstun and SartoriusÜstun & Sartorius, 1995; Reference Mineka, Watson and ClarkMineka et al, 1998).
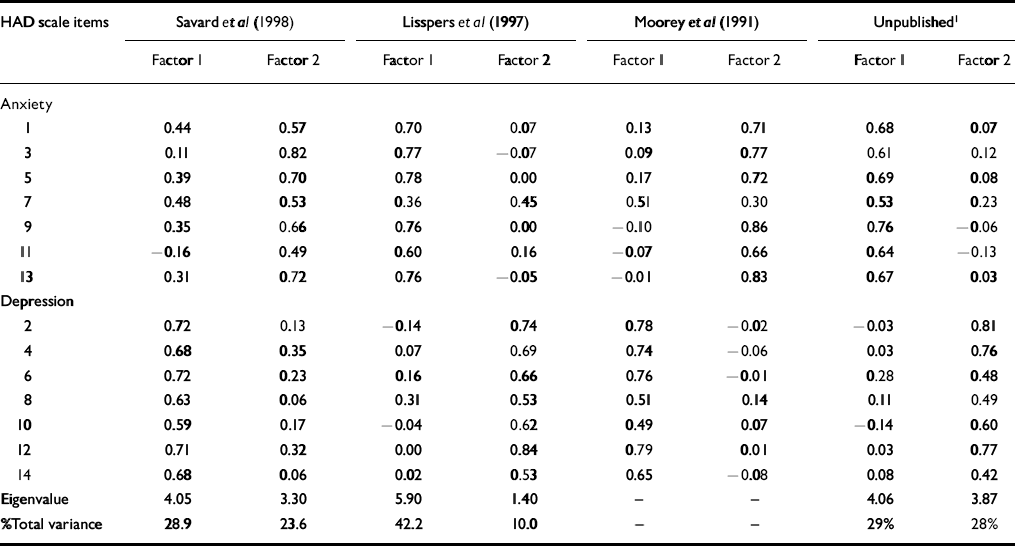
(c) Homogeneity of the sub-scales. Several studies have found that anxiety item 7 (‘I can sit at ease and feel relaxed’) loads higher on the depression sub-scale (Reference Moorey, Greer and WatsonMoorey et al, 1991; Reference Lisspers, Nygren and SödermanLisspers et al, 1997; Reference Savard, Laberge and GauthierSavard et al, 1998; Reference Hammerlid, Ahlner-Elmqvist and BjordalHammerlid et al, 1999). With some exceptions (Reference Lisspers, Nygren and SödermanLisspers et al, 1997; Reference Savard, Laberge and GauthierSavard et al, 1998), the other items have been found to load on their appropriate factors. The correlation between the score on each sub-scale item and the total sub-scale score is commonly reported as a reliability measure, but the correlations reported vary extensively between different studies (Reference Leung, Ho and KanLeung et al, 1993; Reference Savard, Laberge and GauthierSavard et al, 1998; Reference Hammerlid, Ahlner-Elmqvist and BjordalHammerlid et al, 1999).
(d) Internal consistency. It has been recommended that the internal consistency, as measured with Cronbach's coefficient α, should be at least 0.60 for a self-report instrument to be reliable and at least 0.80 when used as a screening instrument (Reference Nunnally and BernsteinNunnally & Bernstein, 1994). Several studies conclude that the HAD scale fulfils these criteria. Cronbach's α has been found to be 0.78-0.93 for HAD—A and 0.82-0.90 for HAD—D (Reference Moorey, Greer and WatsonMoorey et al, 1991; Reference El-Rufaie and AbsoodEl-Rufaie & Absood, 1995; Reference Lisspers, Nygren and SödermanLisspers et al, 1997; Reference Wettergren, Langius and BjörholmWettergren et al, 1997; Reference Savard, Laberge and GauthierSavard et al, 1998; Reference Hammerlid, Ahlner-Elmqvist and BjordalHammerlid et al, 1999; Reference Stordal, Bjartveit Krüger and DahlStordal et al, 2001). The stability of the findings on the internal consistency of the HAD scale in various languages supports the robustness of the scale as a screening instrument.
The aim of the present study was to examine the factor structure, intercorrelation, homogeneity of sub-scales and internal consistency of the HAD scale based on data from a large population.
METHOD
Study population
The Nord-Trøndelag Health Study (HUNT) was conducted during 1995-1997 in Nord-Trøndelag County, which is one of 19 counties in Norway, containing 3% of the population. Based on updated population register lists, all inhabitants received a mailed questionnaire containing, among others, the Norwegian translation of the HAD scale. Sub-populations of participants were identified by the HUNT questionnaire.
According to the Central Population Register of Norway, 92 100 individuals aged 20-89 years were eligible for HUNT. Of those eligible, 65 648 took part in the study and the PCA was based on complete HAD forms only (n=51 930).
Weighting procedures
Weighting according to the procedure used in the National Comorbidity Survey (Reference Kessler, McGonagle and ZhaoKessler et al, 1994) was performed to adjust for difference in response rate according to age and gender, and also age and gender differences between the population of Nord-Trøndelag County and the population of Norway.
Statistics
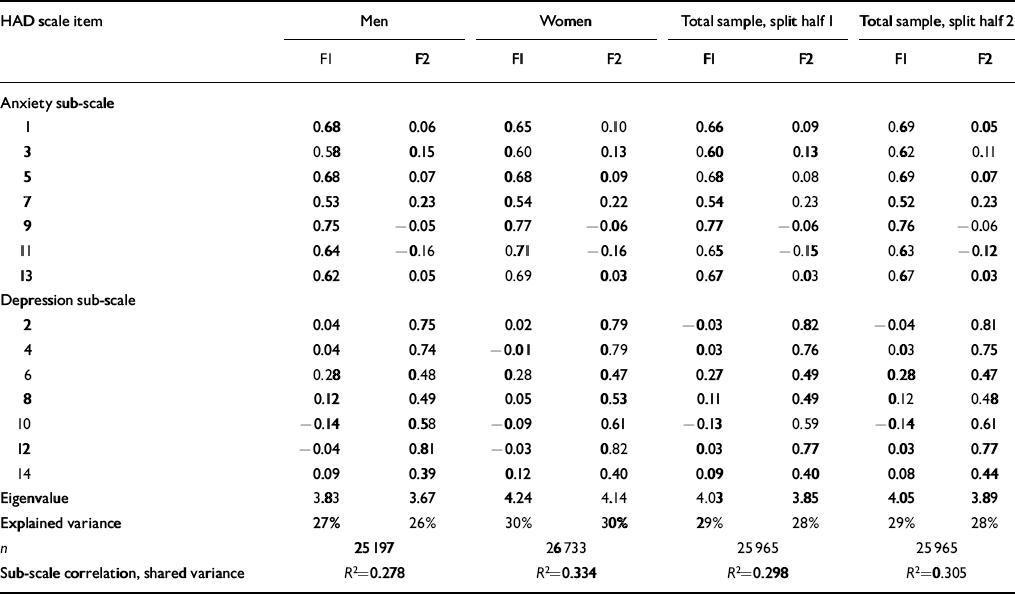
Different sets of PCA were performed on the HAD scale, with varying criteria for the number of factors, and on both subscales as well as the total scale. Results using oblique rotation are reported because the sub-scales share 30% of the variance; analyses with orthogonal rotation also were performed, with basically the same results.
In order to test the stability of the factor structure obtained, we repeated the analyses according to gender (men: n=25 197; women:n=26 733) and in randomly split halves of the sample. We also repeated the factor analyses in the groups who reported mental problems (n=2098) and chronic somatic problems (n=10 954). The analysis was carried out also in different age strata of 18-39 years (n=18 736), 40-59 years (n=21 037), 60-79 years (n=10 804) and 80-89 years (n=1353) and according to the highest level of basic education: elementary school (n=16 210), high school (n=23 426) and college/university (n=11 184).
The internal consistency of the HAD sub-scales was calculated by Cronbach's coefficient α. Pearson's correlation coefficients were calculated for estimation of the sub-scales' shared variance.
Ethics
HUNT was approved by the National Data Inspectorate and the Board of Research Ethics in health region IV of Norway.
RESULTS
Factor structure of the HAD scale
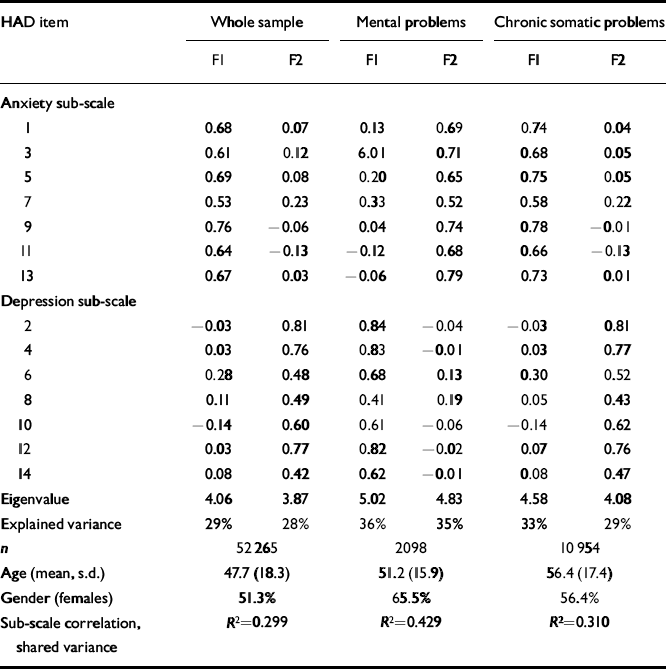
In PCA with the number of factors limited to two, a two-factor solution emerged where the depression and anxiety items loaded on separate factors. This result was found in the total sample and in all the defined sub-samples, and also was confirmed in the analysis of randomly split halves of the samples. Eigenvalues for the anxiety and depression sub-scales were 4.06 and 3.87, respectively, in the total sample; accordingly, the two-factor solution explained 57% of the total variance. The explained variance was even higher in the subsamples with mental or chronic somatic problems: 70% and 62%, respectively (Tables 1 and 2).
Table 1 Principal component analysis of the Hospital Anxiety and Depression (HAD) scale
| HAD item | Whole sample | Mental problems | Chronic somatic problems | |||
|---|---|---|---|---|---|---|
| F1 | F2 | F1 | F2 | F1 | F2 | |
| Anxiety sub-scale | ||||||
| 1 | 0.68 | 0.07 | 0.13 | 0.69 | 0.74 | 0.04 |
| 3 | 0.61 | 0.12 | 6.01 | 0.71 | 0.68 | 0.05 |
| 5 | 0.69 | 0.08 | 0.20 | 0.65 | 0.75 | 0.05 |
| 7 | 0.53 | 0.23 | 0.33 | 0.52 | 0.58 | 0.22 |
| 9 | 0.76 | -0.06 | 0.04 | 0.74 | 0.78 | -0.01 |
| 11 | 0.64 | -0.13 | -0.12 | 0.68 | 0.66 | -0.13 |
| 13 | 0.67 | 0.03 | -0.06 | 0.79 | 0.73 | 0.01 |
| Depression sub-scale | ||||||
| 2 | -0.03 | 0.81 | 0.84 | -0.04 | -0.03 | 0.81 |
| 4 | 0.03 | 0.76 | 0.83 | -0.01 | 0.03 | 0.77 |
| 6 | 0.28 | 0.48 | 0.68 | 0.13 | 0.30 | 0.52 |
| 8 | 0.11 | 0.49 | 0.41 | 0.19 | 0.05 | 0.43 |
| 10 | -0.14 | 0.60 | 0.61 | -0.06 | -0.14 | 0.62 |
| 12 | 0.03 | 0.77 | 0.82 | -0.02 | 0.07 | 0.76 |
| 14 | 0.08 | 0.42 | 0.62 | -0.01 | 0.08 | 0.47 |
| Eigenvalue | 4.06 | 3.87 | 5.02 | 4.83 | 4.58 | 4.08 |
| Explained variance | 29% | 28% | 36% | 35% | 33% | 29% |
| n | 52265 | 2098 | 10954 | |||
| Age (mean, s.d.) | 47.7 (18.3) | 51.2 (15.9) | 56.4 (17.4) | |||
| Gender (females) | 51.3% | 65.5% | 56.4% | |||
| Sub-scale correlation, shared variance | R 2=0.299 | R 2=0.429 | R 2=0.310 | |||
Table 2 Principal component analysis of the Hospital Anxiety and Depression (HAD) scale for men and women and for randomly selected split halves of total material
| HAD scale item | Men | Women | Total sample, split half I | Total sample, split half 2 | ||||
|---|---|---|---|---|---|---|---|---|
| F1 | F2 | F1 | F2 | F1 | F2 | F1 | F2 | |
| Anxiety sub-scale | ||||||||
| 1 | 0.68 | 0.06 | 0.65 | 0.10 | 0.66 | 0.09 | 0.69 | 0.05 |
| 3 | 0.58 | 0.15 | 0.60 | 0.13 | 0.60 | 0.13 | 0.62 | 0.11 |
| 5 | 0.68 | 0.07 | 0.68 | 0.09 | 0.68 | 0.08 | 0.69 | 0.07 |
| 7 | 0.53 | 0.23 | 0.54 | 0.22 | 0.54 | 0.23 | 0.52 | 0.23 |
| 9 | 0.75 | -0.05 | 0.77 | -0.06 | 0.77 | -0.06 | 0.76 | -0.06 |
| 11 | 0.64 | -0.16 | 0.71 | -0.16 | 0.65 | -0.15 | 0.63 | -0.12 |
| 13 | 0.62 | 0.05 | 0.69 | 0.03 | 0.67 | 0.03 | 0.67 | 0.03 |
| Depression sub-scale | ||||||||
| 2 | 0.04 | 0.75 | 0.02 | 0.79 | -0.03 | 0.82 | -0.04 | 0.81 |
| 4 | 0.04 | 0.74 | -0.01 | 0.79 | 0.03 | 0.76 | 0.03 | 0.75 |
| 6 | 0.28 | 0.48 | 0.28 | 0.47 | 0.27 | 0.49 | 0.28 | 0.47 |
| 8 | 0.12 | 0.49 | 0.05 | 0.53 | 0.11 | 0.49 | 0.12 | 0.48 |
| 10 | -0.14 | 0.58 | -0.09 | 0.61 | -0.13 | 0.59 | -0.14 | 0.61 |
| 12 | -0.04 | 0.81 | -0.03 | 0.82 | 0.03 | 0.77 | 0.03 | 0.77 |
| 14 | 0.09 | 0.39 | 0.12 | 0.40 | 0.09 | 0.40 | 0.08 | 0.44 |
| Eigenvalue | 3.83 | 3.67 | 4.24 | 4.14 | 4.03 | 3.85 | 4.05 | 3.89 |
| Explained variance | 27% | 26% | 30% | 30% | 29% | 28% | 29% | 28% |
| n | 25197 | 26733 | 25965 | 25965 | ||||
| Sub-scale correlation, shared variance | R 2=0.278 | R 2=0.334 | R 2=0.298 | R 2=0.305 | ||||
When performing PCA with the number of factors defined by eigenvalues ≥ 1.00, a three-factor solution emerged. The first factor contained items 1, 3, 5, 9 and 13 (all anxiety items), the second factor contained items 2, 4, 6, 8, 10 and 12 (all depression items) and the third factor comprised items 7, 11 and 14. Eigenvalues in the rotated three-factor solution were 3.82, 3.60 and 1.87, respectively. In the sub-samples we found this three-factor solution only in respondents aged 18-39 years and in the two subsamples with education from high school and college/university. In all other subsamples the two-factor solution emerged according to the original anxiety and depression sub-scales.
Principal component analysis done on each sub-scale separately, with the number of factors predefined by eigenvalues ≥1.00, gave only single-factor solutions in the total sample and in all subsamples.
A one-factor solution for the total HAD scale, as suggested by Razaviet al (Reference Razavi, Delvaux and Farvacques1990), accounted for only 35% of the total variance.
Intercorrelation of the sub-scales
The anxiety and depression sub-scales shared 30% of the variance. The sub-scale correlation was elevated in the subsample with mental problems (43%).
Homogeneity of the sub-scales
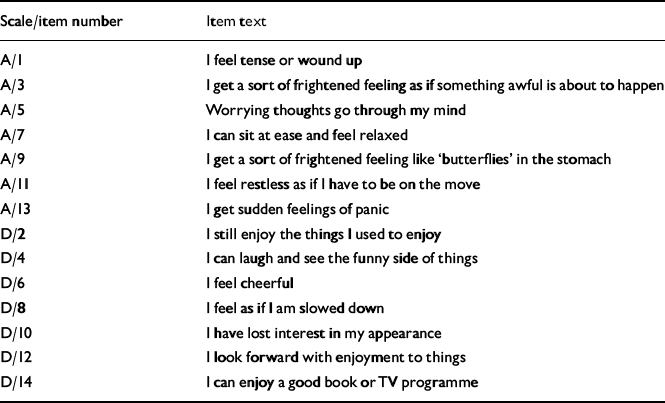
The anxiety items loaded more on the anxiety factor than on the depression factor, and corresponding results were found for the depression items. This homogeneous pattern was found in the total sample as well as in the subsamples. However, items 6 (‘I feel cheerful’) and 7 (‘I can sit at ease and feel relaxed’) diverged to some extent from this homogeneous pattern by loading substantially also on the other sub-scales (Tables 3 and 4).
Table 3 The Hospital Anxiety and Depression (HAD) scale item numbers and texts
| Scale/item number | Item text |
|---|---|
| A/1 | I feel tense or wound up |
| A/3 | I get a sort of frightened feeling as if something awful is about to happen |
| A/5 | Worrying thoughts go through my mind |
| A/7 | I can sit at ease and feel relaxed |
| A/9 | I get a sort of frightened feeling like ‘butterflies’ in the stomach |
| A/11 | I feel restless as if I have to be on the move |
| A/13 | I get sudden feelings of panic |
| D/2 | I still enjoy the things I used to enjoy |
| D/4 | I can laugh and see the funny side of things |
| D/6 | I feel cheerful |
| D/8 | I feel as if I am slowed down |
| D/10 | I have lost interest in my appearance |
| D/12 | I look forward with enjoyment to things |
| D/14 | I can enjoy a good book or TV programme |
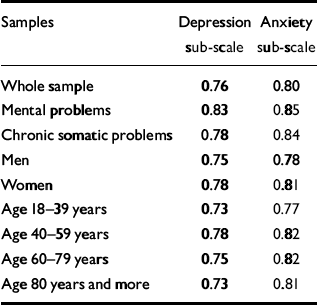
Table 4 Internal consistency of the Hospital Anxiety and Depression (HAD) scale sub-scales using Cronbach's α
| Samples | Depression sub-scale | Anxiety sub-scale |
|---|---|---|
| Whole sample | 0.76 | 0.80 |
| Mental problems | 0.83 | 0.85 |
| Chronic somatic problems | 0.78 | 0.84 |
| Men | 0.75 | 0.78 |
| Women | 0.78 | 0.81 |
| Age 18-39 years | 0.73 | 0.77 |
| Age 40-59 years | 0.78 | 0.82 |
| Age 60-79 years | 0.75 | 0.82 |
| Age 80 years and more | 0.73 | 0.81 |
Internal consistency
The internal consistency of the HAD scale, as calculated by Cronbach's α, was satisfactory in all the evaluated samples (values of 0.73-0.85) (Table 4).
DISCUSSION
Factor structure of the HAD scale
This large population-based study gave support to the bidimensional factor structure of the HAD scale, tapping the separate but related dimensions of anxiety and depression. We have found a considerably higher explained variance in the subsample with mental problems (70%) compared with the general population (57%) and the subsample with chronic somatic problems (62%). In contrast, factor solutions with more than two factors suggested in the literature typically fail to explain more than 55% of the variance. This explained variance indicates that quite a few individual response patterns in the HAD scale are unique, in the sense that they diverge from both conventional and alternative factor structures. The two-factor solution of the scale is valid in more individuals in subsamples with a high mental problems symptom level.
The factor structure of the HAD scale extracted with eigenvalues ≥1.00 as a criterion identified a third factor with a lower eigenvalue than the other two factors. In accordance with Leung et al (Reference Leung, Ho and Kan1993), we found support for this dimension in non-clinical samples only and we suggest that this factor can be named ‘restlessness’.
Intercorrelation of the sub-scales
Our results are in accordance with others, who have reported a shared sub-scale variance of 24-36%. We find higher sub-scale correlation in the subsample with mental problems.
Homogeneity of the sub-scales
Our finding that item 7 does not discriminate well between the two factors is in accordance with studies of general populations (Reference Lisspers, Nygren and SödermanLisspers et al, 1997) and clinical samples (Reference Moorey, Greer and WatsonMoorey et al, 1991) (Table 5). In our study we also have loadings on both factors in item 6. These findings suggest that items 6 and 7 are not unique in either anxiety or depression.
Table 5 Factor structure of the Hospital Anxiety and Depression (HAD) scale in different studies
| HAD scale items | Savard et al(Reference Savard, Laberge and Gauthier1998) | Lisspers et al(Reference Lisspers, Nygren and Söderman1997) | Moorey et al(Reference Moorey, Greer and Watson1991) | Unpublished1 | ||||
|---|---|---|---|---|---|---|---|---|
| Factor 1 | Factor 2 | Factor 1 | Factor 2 | Factor 1 | Factor 2 | Factor 1 | Factor 2 | |
| Anxiety | ||||||||
| 1 | 0.44 | 0.57 | 0.70 | 0.07 | 0.13 | 0.71 | 0.68 | 0.07 |
| 3 | 0.11 | 0.82 | 0.77 | -0.07 | 0.09 | 0.77 | 0.61 | 0.12 |
| 5 | 0.39 | 0.70 | 0.78 | 0.00 | 0.17 | 0.72 | 0.69 | 0.08 |
| 7 | 0.48 | 0.53 | 0.36 | 0.45 | 0.51 | 0.30 | 0.53 | 0.23 |
| 9 | 0.35 | 0.66 | 0.76 | 0.00 | -0.10 | 0.86 | 0.76 | -0.06 |
| 11 | -0.16 | 0.49 | 0.60 | 0.16 | -0.07 | 0.66 | 0.64 | -0.13 |
| 13 | 0.31 | 0.72 | 0.76 | -0.05 | -0.01 | 0.83 | 0.67 | 0.03 |
| Depression | ||||||||
| 2 | 0.72 | 0.13 | -0.14 | 0.74 | 0.78 | -0.02 | -0.03 | 0.81 |
| 4 | 0.68 | 0.35 | 0.07 | 0.69 | 0.74 | -0.06 | 0.03 | 0.76 |
| 6 | 0.72 | 0.23 | 0.16 | 0.66 | 0.76 | -0.01 | 0.28 | 0.48 |
| 8 | 0.63 | 0.06 | 0.31 | 0.53 | 0.51 | 0.14 | 0.11 | 0.49 |
| 10 | 0.59 | 0.17 | -0.04 | 0.62 | 0.49 | 0.07 | -0.14 | 0.60 |
| 12 | 0.71 | 0.32 | 0.00 | 0.84 | 0.79 | 0.01 | 0.03 | 0.77 |
| 14 | 0.68 | 0.06 | 0.02 | 0.53 | 0.65 | -0.08 | 0.08 | 0.42 |
| Eigenvalue | 4.05 | 3.30 | 5.90 | 1.40 | — | — | 4.06 | 3.87 |
| %Total variance | 28.9 | 23.6 | 42.2 | 10.0 | — | — | 29% | 28% |
Internal consistency
The internal consistency of the HAD scale was found to be satisfactory in our general population and somewhat higher in sub-populations with mental problems in our study, in accordance with others.
Significant aspects of the syndromes of anxiety and depression are not covered by the HAD scale. Somatic symptoms have been omitted in order to prevent false-positive cases in somatic hospital settings. However, other important components of depression, such as hopelessness, guilt and low self-esteem, are not assessed because the HAD-D focuses mainly on anhedonia (Reference SilverstoneSilverstone, 1991; Reference HerrmannHerrmann, 1997; Reference Bjelland, Neckelmann and Tangen HaugBjelland et al, 2001). This somewhat narrow concept of depression may be one reason for the robustness of the factor structure in the HAD scale.
In HUNT, non-participants were more prevalent among men and among those aged 40-69 years. We presume that non-responders are more prone to have a history of mental disorders (Reference Eaton and KesslerEaton & Kessler, 1981). However, the stability of the factor structures of the HAD scale across different subsamples indicates that selection bias due to non-attendance is of limited importance.
Psychometric analyses are more valid and reliable when based on large materials. Our results support the HAD scale as an instrument with good psychometric properties in terms of factor structure, intercorrelation, homogeneity and internal consistency.
Clinical Implications and Limitations
CLINICAL IMPLICATIONS
• Our results support the Hospital Anxiety and Depression (HAD) scale as an instrument with good psychometric properties in terms of factor structure, sub-scale intercorrelation, homogeneity and internal consistency.
• The properties of the HAD scale are found to be robust across a wide spectrum of subsamples, including groups with somatic problems, mental problems and different strata defined by age, education and gender.
• The explained variance of the two-factor solution is still higher when the HAD scale is used in groups of individuals with mental problems.
LIMITATIONS
• No factor solution explains more than 57% of the variance in the HAD scale in a general population (and 70% in a subsample with mental problems), leaving quite a few individual patterns of responses in the scale unexplained.
• The issue of the HAD scale as a case-finder is not addressed because there was no interview part of the HUNT study.
• The HAD scale version studied is the Norwegian translation.
Acknowledgements
The Nord-Trøndelag Health Study (HUNT) is a collaboration between the National Health Screening Service of Norway (Oslo), the National Institute of Public Health Community Research Unit (Verdal), Nord-Trøndelag County Council and The Norwegian University of Science and Technology (NTNU).


eLetters
No eLetters have been published for this article.