


Introduction
Omphacite is a single-chain silicate characterised by the general formula M1M2T 2O6, where T represents the tetrahedrally coordinated Si, and M1 and M2 denote six- and eight-coordinated sites, respectively. M1 is typically occupied by high-charge small cations such as Mg, Al, Cr, Mn, Fe2+ or Fe3+, whereas large divalent or monovalent cations such as Ca, Na or Li, are present in M2. The cation ordering process in omphacite results in the splitting of the M1 and M2 sites into non-symmetrically related pairs: M1 and M11, and M2 and M21, respectively. The M1 site is preferentially occupied by Al, M11 by Mg, whereas M21 is occupied by Na and M22 by Ca. Consequently, the presence of cation order in the M sites lowers the space group symmetry from C2/c to P2/n.
A recent high-pressure (HP) Raman spectroscopy study of natural P2/n omphacite, with composition close to Jd43Di57, up to 10 GPa revealed some changes in the Raman shifts and full width at half maximum (FWMH) at some wavenumbers that may be interpreted as due to changes in its elastic behaviour (Baratelli et al., Reference Baratelli, Murri, Alvaro, Prencipe, Mihailova and Cámara2024). In particular, the pressure dependence of the wavenumbers of a few Raman peaks changes at ∼5 GPa that could indicate a change in the detailed compression mechanisms in the six- and eight-coordinated sites within the ordered omphacite structure.
Several studies have already investigated the compressional behaviour of ordered P2/n and disordered C2/c omphacite by using single-crystal X-ray diffraction (SC-XRD) (McCormick et al., Reference McCormick, Hazen and Angel1989; Pavese et al., Reference Pavese, Diella, Levy and Hanfland2001; Nishihara et al., Reference Nishihara, Takahashi, Matsukage and Kikegawa2003; Pandolfo et al., Reference Pandolfo, Nestola, Cámara and Domeneghetti2012a; Reference Pandolfo, Nestola, Cámara and Domeneghetti2012b; Zhang et al., Reference Zhang, Hu and Dera2016; Xu et al., Reference Xu, Zhang, Fan, Dera, Shi and Zhou2019; Ye et al., Reference Ye, Fan, Li, Tang, Xu, Zhang and Zhou2022). Furthermore, the thermal behaviour of omphacite has been investigated (Pavese et al., Reference Pavese, Bocchio and Ivaldi2000; Nishihara et al., Reference Nishihara, Takahashi, Matsukage and Kikegawa2003; Pandolfo et al., Reference Pandolfo, Nestola, Cámara and Domeneghetti2012b; Xu et al., Reference Xu, Zhang, Fan, Dera, Shi and Zhou2019; Ye et al., Reference Ye, Fan, Li, Tang, Xu, Zhang and Zhou2022). Brillouin spectroscopy has been employed to determine the elastic properties of both disordered (Bhagat et al., Reference Bhagat, Bass and Smyth1992) and ordered (Hao et al., Reference Hao, Zhang, Pierotti, Ren and Zhang2019) omphacite at room conditions and room-temperature high-pressure, respectively.
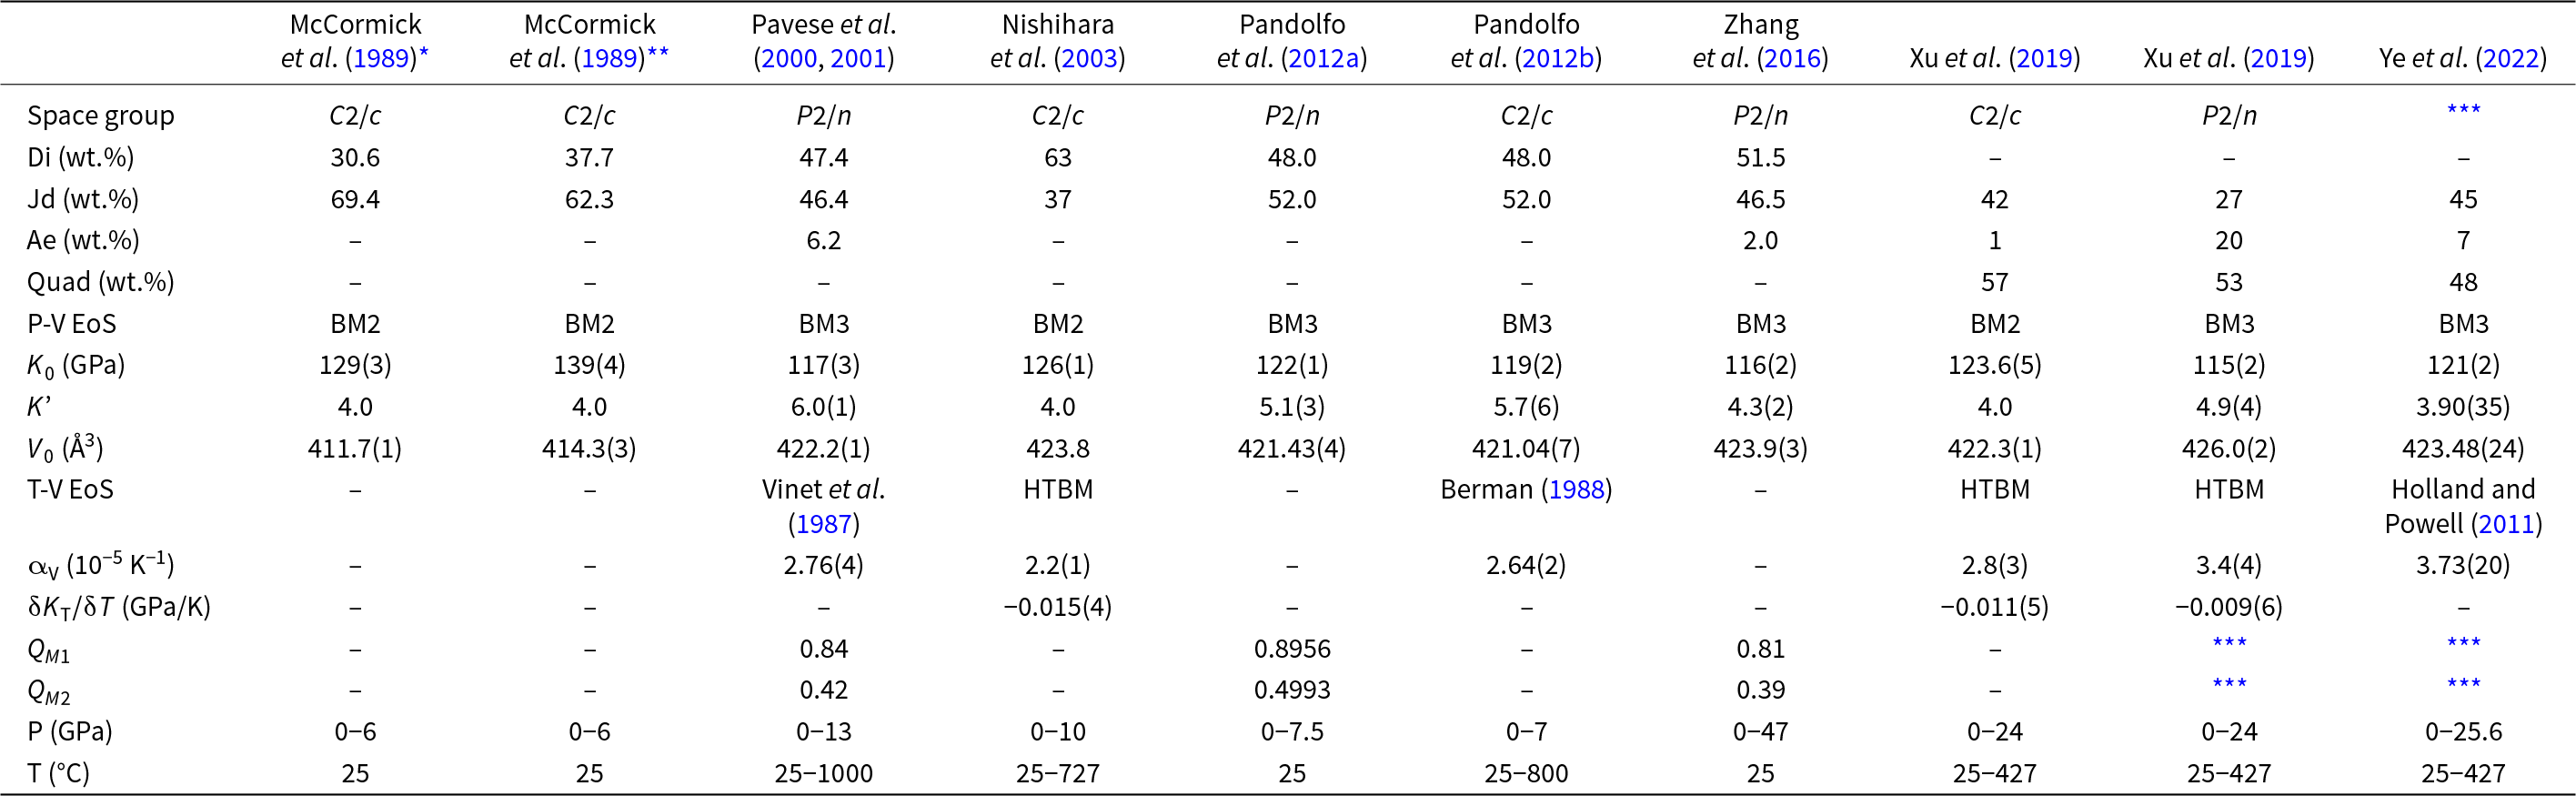
The isothermal equations of state (EoS) for omphacite reported in the literature, in terms of bulk modulus (K 0), its pressure derivative (K’), the zero-pressure volume V0 together with the order parameters and the composition are summarised in Table 1. K 0 for ordered omphacite ranges between 116(2) and 122(1) GPa (Pavese et al., Reference Pavese, Diella, Levy and Hanfland2001; Pandolfo et al., Reference Pandolfo, Nestola, Cámara and Domeneghetti2012a; Zhang et al., Reference Zhang, Hu and Dera2016), whereas for disordered omphacite it is 119(2) GPa (Pandolfo et al., Reference Pandolfo, Nestola, Cámara and Domeneghetti2012b). McCormick et al. (Reference McCormick, Hazen and Angel1989) showed that vacancies in the M sites increase the compressibility. Table 1 includes thermal EoS parameters (Pavese et al., Reference Pavese, Bocchio and Ivaldi2000; Nishihara et al., Reference Nishihara, Takahashi, Matsukage and Kikegawa2003; Pandolfo et al., Reference Pandolfo, Nestola, Cámara and Domeneghetti2012b; Xu et al., Reference Xu, Zhang, Fan, Dera, Shi and Zhou2019; Ye et al., Reference Ye, Fan, Li, Tang, Xu, Zhang and Zhou2022), in terms of the thermal expansion coefficient (αV) and the temperature derivative of the bulk modulus (δK T/δT), both at room conditions.
Table 1. EoS of omphacite from literature. The composition, EoS type, bulk modulus K 0, its pressure derivative K’, the zero-pressure volume V 0, thermal expansion αV, the bulk modulus temperature derivative ∂K T/∂T, as well as the order parameters QM 1 and QM 2, pressure and temperature conditions are listed for each study

Notes: For Zhang et al. (Reference Zhang, Hu and Dera2016) Q M2 is calculated based on the site occupancy factor, while Q M1 as a function of the bond distances (Carpenter et al., Reference Carpenter, Domeneghetti and Tazzoli1990a). In Xu et al. (Reference Xu, Zhang, Fan, Dera, Shi and Zhou2019) and Ye et al. (Reference Ye, Fan, Li, Tang, Xu, Zhang and Zhou2022) the composition Quad is defined as ferrosilite + enstatite + wollastonite. *Vacancy-rich omphacite; **vacancy-poor omphacite; *** not reported.
Despite these extensive studies, all of the HP structural studies published so far suffer from an incomplete exploration of reciprocal space that limits the refinement of the structure under variable pressure. In particular, the limited data coverage does not allow refinement of the anisotropic atomic displacement parameters (adp) for all atoms in the omphacite structure, which is necessary to follow accurately the geometrical changes with changing pressure. This limits the reliability of the structural parameters and thus the possible interpretation of results obtained by HP Raman spectroscopy. Moreover, the published HP studies of omphacites each contain only a limited number of pressure data points, and this means that subtle variations in compression mechanisms cannot be identified. To address these issues, we have conducted a HP SC-XRD study, on the same sample studied by Raman spectroscopy (Baratelli et al., Reference Baratelli, Murri, Alvaro, Prencipe, Mihailova and Cámara2024), at the Xpress beamline of the Elettra Synchrotron in Trieste, focusing efforts on accessing as much of the reciprocal space as possible and by collecting data at small intervals in pressure. The findings from this experimental study are compared with results from Hartree-Fock/Density Functional Theory (HF/DFT) simulations on a fully ordered Jd50Di50 omphacite up to 8 GPa and with the Raman spectra collected up to 10 GPa by Baratelli et al. (Reference Baratelli, Murri, Alvaro, Prencipe, Mihailova and Cámara2024).
Materials and methods
Sample description
We used an omphacite crystal from the Münchberg Massif, Bavaria (Matthes and Schmidt, Reference Matthes and Schmidt1974; O’Brien, Reference P.J1993), which belongs to the same omphacite sample (74AM41) that has been analysed previously by infrared spectroscopy and SC-XRD (Boffa Ballaran et al., Reference Boffa Ballaran, Carpenter, Domeneghetti and Tazzoli1998a; Reference Boffa Ballaran, Carpenter, Domeneghetti, Salje and Tazzoli1998b). The sample was selected for the low Fe content to avoid its effect on the Di–Jd solid solution and has the composition (Ca0.57Na0.43)(Mg0.50Al0.43Fe0.07)(Si1.96Al0.04)O6 (Baratelli et al., Reference Baratelli, Murri, Alvaro, Prencipe, Mihailova and Cámara2024). Refinement of SC-XRD data at room conditions allowed us to determine that the crystal exhibits extinction violations corresponding to the P2/n space group.
Single-crystal X-ray diffraction (SC-XRD)
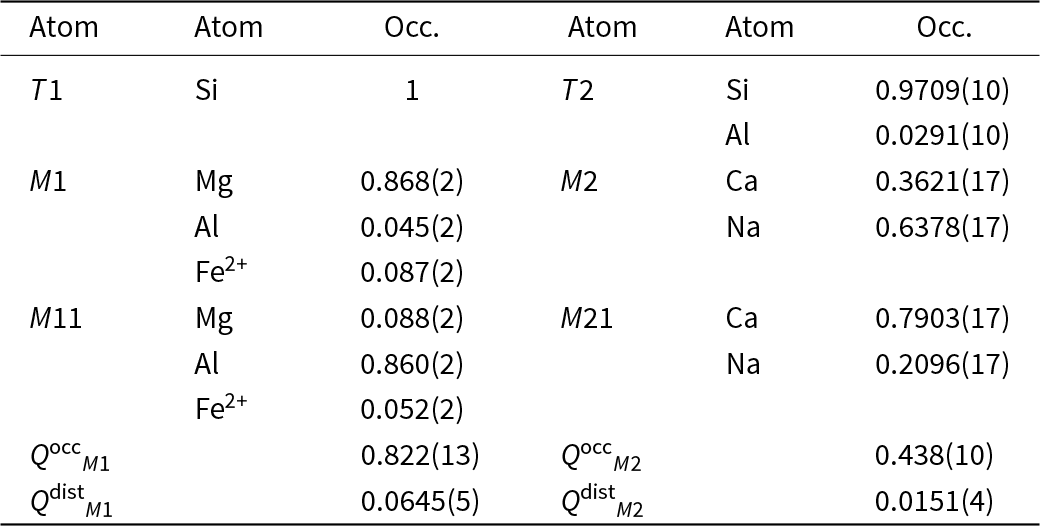
The structure of the selected omphacite crystal (107×131×229 μm) was determined by SC-XRD measurements at room temperature and ambient pressure using a Rigaku XtaLAB Synergy-S diffractometer equipped with a HyPix-6000HE HPC area detector, at the Department of Earth Sciences of the University of Milan. A monochromatic X-ray incident beam with an energy of 17.4 keV (λ = 0.71073 Å, i.e. MoKα) was used. The data collection strategy involved a stepwise ω-rotation in the range of ±58°, with a step width of 0.5°, and an exposure time of 3.5 s per step. Structure refinements were performed using the SHELXL program (Sheldrick, Reference Sheldrick2015). The structure was refined in the P2/n space group. Scattering curves were taken from The International Tables for Crystallography (Wilson, Reference Wilson1995). Neutral vs. ionised scattering factors were used to refine the occupancy of sites not involved in chemical substitutions (O sites and T 1Si in P2/n) (Hawthorne et al., Reference Hawthorne, Ungaretti and Oberti1995), while ionised atoms scattering factors were used for T 2Si and the six- and eight-coordinated sites (M1, M11, M2 and M21). The site partitioning (Table 2) was determined using the refinement model proposed by Boffa Ballaran et al. (Reference Boffa Ballaran, Carpenter, Domeneghetti and Tazzoli1998a) and chemical constraints from the EMPA data reported by Baratelli et al. (Reference Baratelli, Murri, Alvaro, Prencipe, Mihailova and Cámara2024). The refinement converged to R1 = 2.18% for 2919 observed reflections with I/σ > 4 and 118 parameters (Supplementary Table S1), yielding acceptable displacement parameters for all atoms. Atom fractional coordinates and displacement parameters are listed in Supplementary Tables S2 and S3, respectively.
Table 2. Site populations (Occ.) and degree of order (Q occ, Q dist) of the analysed Jd43Di57 omphacite

Note: order parameters calculated following Carpenter et al. (Reference Carpenter, Domeneghetti and Tazzoli1990a)
The crystal was then cut in two different perpendicular directions using a focused ion beam (FIB), to obtain two slices with dimensions ca. 50×50×30 and 60×40×30 μm. The FIB cut was done with the FEG-FIB Tescan Solaris at the Department of Geosciences of the University of Padova. This was intended to overcome the limitations in accessibility to reciprocal space in standard HP studies using a diamond-anvil cell (DAC) with only one crystal of low symmetry. This procedure enabled us to collect 57% of the reflections in one asymmetric unit at a resolution of d = 1.081 Å, while ∼30% coverage was achieved at a maximum resolution of 0.599 Å. The ratio of refined parameters (including adp) to data was ∼6.5.
The two omphacite slices were loaded in a BX-90 DAC. The pressure-transmitting medium used in this experiment was a mixture of methanol:ethanol in 4:1 proportions, which transmits pressure hydrostatically up to the maximum pressure reached in this experiment (Angel et al., Reference Angel, Bujak, Zhao, Gatta and Jacobsen2007; Klotz et al., Reference Klotz, Chervin, Munsch and Le Marchand2009). Ruby fluorescence was used as a pressure standard, and the estimated pressure uncertainty is ∼0.05 GPa (Mao et al., Reference Mao, Xu and Bell1986). In situ HP SC-XRD measurements were performed at the beamline Xpress of the Elettra synchrotron (Trieste, Italy). The data collection strategy involved a stepwise ω-rotation in the range of ± 32°, with a step width of 0.5°, and an exposure time of 0.5 s per step. The experimental setup featured a parallel monochromatic beam (E = 25 KeV, λ = 0.49585 Å), and diffraction patterns were collected by a PILATUS3 S 6M detector (from DECTRIS) flat-panel detector. The experiment was conducted up to 10 GPa, with a total of 24 pressure points (three of them on decreasing pressure) approximately equally spaced in pressure. The indexing of the diffraction data, unit-cell parameter refinement, and intensity integration were performed using the CrysAlisPro suite (Rigaku Oxford Diffraction, 2019). Semiempirical absorption (due to the DAC components) and background corrections were implemented using the ABSPACK routine implemented in the CrysAlisPro suite. The structural refinements for each HP point were handled with Jana2006 (20/02/2023 version) software (Petříček et al., Reference Petříček, Dušek and Palatinus2014). The reflection files of the two omphacite slices were used together with their own respective scale factors in a single refinement.
The values of the conventional agreement factor R1 as well as other details from every pressure step refinement are reported in Supplementary Table S1.
Computational methods
Ab initio hybrid HF/DFT simulations have been conducted with the CRYSTAL17 software (Dovesi et al., Reference Dovesi, Erba, Orlando, Zicovich‐Wilson, Civalleri, Maschio, Rérat, Casassa, Baima, Salustro and Kirtman2018) by using the WC1LYP functional. This functional has been shown to correctly reproduce the elastic and vibrational properties of crystals (Prencipe et al., Reference Prencipe, Scanavino, Nestola, Merlini, Civalleri, Bruno and Dovesi2011, Reference Prencipe, Mantovani, Tribaudino, Bersani and Lottici2012; Prencipe, Reference Prencipe2012, Reference Prencipe2019; Stangarone et al., Reference Stangarone, Tribaudino, Prencipe and Lottici2016). The WC1LYP functional is based on the generalised gradient approximation exchange functional WC (Wu and Cohen, Reference Wu and Cohen2006), mixed with 16% of the exact non-local HF exchange, and the Lee-Yan-Parr (LYP) correlation functional (Lee et al., Reference Lee, Yang and Parr1988). The grid for the numerical evaluation of the DFT exchange-correlation functionals was chosen by the keyword XLGRID in the CRYSTAL17 program (Dovesi et al., Reference Dovesi, Erba, Orlando, Zicovich‐Wilson, Civalleri, Maschio, Rérat, Casassa, Baima, Salustro and Kirtman2018) and corresponds to a total of 900,780 points in the unit cell. A measure of the numerical accuracy provided by such a grid is the evaluation of the total number of electrons in the unit cell, by the numerical integration of the electron density over the cell volume. For omphacite, we obtained 415.99999 electrons out of 416 for the reference volume at the static limit (no zero-point and thermal pressures due to vibrational effects included, see Prencipe et al., Reference Prencipe, Scanavino, Nestola, Merlini, Civalleri, Bruno and Dovesi2011) and at a static pressure of 0 GPa. The localised contracted atomic basis sets used were: Na 8-511(1d)G; Al 85-11(1d)G; Ca 865-11(3d)G; Mg 85-11(1d)G; Si 88-31(1d)G; O 84-11(1d1d)G (Valenzano et al., Reference Valenzano, Torres, Doll, Pascale, Zicovich-Wilson and Dovesi2006; Sophia et al., Reference Sophia, Baranek, Sarrazin, Rérat and Dovesi2014). Within the CRYSTAL code, the accuracy in evaluating the Coulomb and HF exchange series is controlled by the keyword TOLINTEG, for which we set the four T1, T2, T3 and T4 parameters to 9 and T5 to 22 (Dovesi et al., Reference Dovesi, Erba, Orlando, Zicovich‐Wilson, Civalleri, Maschio, Rérat, Casassa, Baima, Salustro and Kirtman2018). Diagonalisation of the Hamiltonian matrix was performed at 30 independent k vectors in the reciprocal space (Monkhorst net; Monkhorst and Pack, Reference Monkhorst and Pack1976) by setting the shrinking factor IS to 4 (Dovesi et al., Reference Dovesi, Erba, Orlando, Zicovich‐Wilson, Civalleri, Maschio, Rérat, Casassa, Baima, Salustro and Kirtman2018). Unit-cell parameters and fractional coordinates were optimised by analytical gradient methods, as implemented in CRYSTAL17 (Civalleri et al., Reference Civalleri, D’Arco, Orlando, Saunders and Dovesi2001; Dovesi et al., Reference Dovesi, Erba, Orlando, Zicovich‐Wilson, Civalleri, Maschio, Rérat, Casassa, Baima, Salustro and Kirtman2018). Geometry optimisation was considered converged when each component of the gradient (TOLDEG parameter in CRYSTAL17) was smaller than 0.00003 Hartree/Bohr and displacements (TOLDEX) were smaller than 0.00012 Bohr with respect to the previous step. Simulations of the structure of omphacite at the static limit have been performed at pressures ranging from –2 to 8 GPa with a step of 1 GPa. In order to directly compare the computational data with the experimental results, we followed the procedure reported in Ghignone et al. (Reference Ghignone, Prencipe, Manzotti, Bruno, Boero, Borghini, Costa, Ciriotti and Scaramuzzo2024) to estimate the EoS parameters at a temperature of 298 K. These estimations are made at the static level (Pstatic) and do not account for the influence of atomic vibrations (Pvib) in the solid, which typically leads to a reduction in K 0 (Prencipe, Reference Prencipe2019).
Results
Degree of order
The site populations determined by refinement to the diffraction data collected from the crystal in air (Table 2) were kept fixed in the structure refinements of diffraction data collected at HP, as it cannot change at room temperature. The chemical constraints are derived from the composition of sample 74AM41, which was studied by Boffa Ballaran et al. (Reference Boffa Ballaran, Carpenter, Domeneghetti and Tazzoli1998a). This is the same rock sample to which the crystal analysed belongs. This site population was used to calculate the order parameters Q occM 1 = 0.83 and Q occM 2 = 0.43, whereas Q distM 1 and Q distM 2 reported in Table 2 were calculated from the average bond lengths obtained with the same model at room-pressure. Q occ and Q dist were calculated with the formulas reported by Carpenter et al. (Reference Carpenter, Domeneghetti and Tazzoli1990a, Reference Carpenter, Domeneghetti and Tazzoli1990b).
Unit-cell parameters and volume evolution with pressure
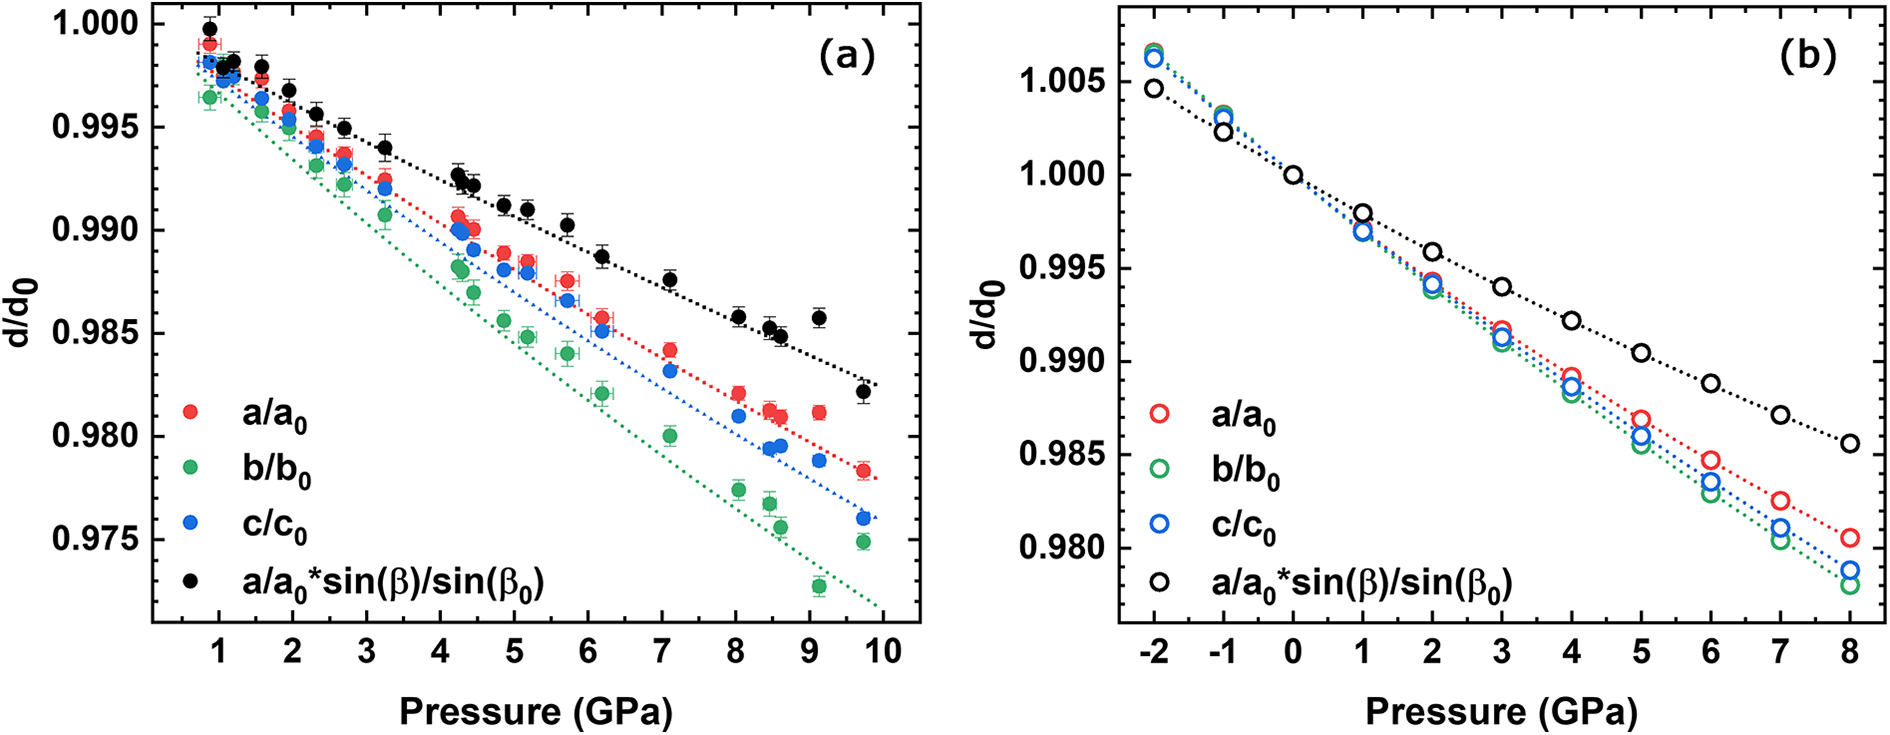
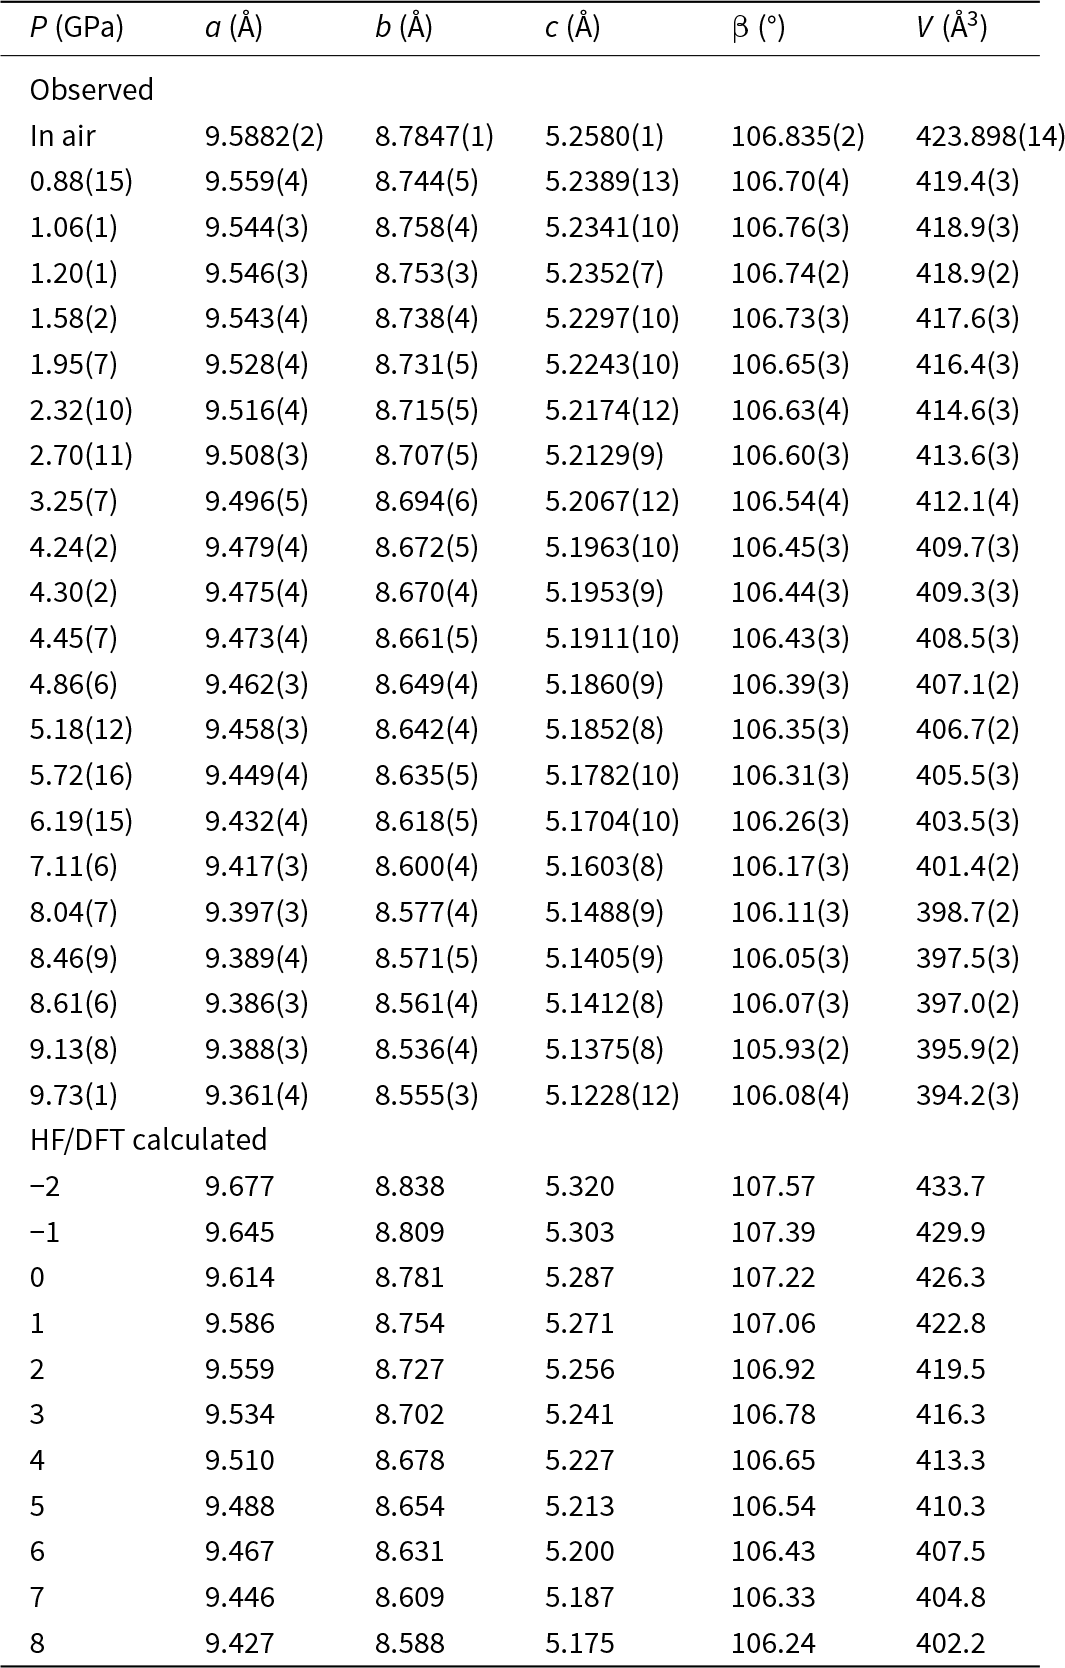
The unit-cell parameters and volume collected in air and at variable pressure conditions (21 pressure values and data collected up to 9.73 GPa, i.e. a pressure point every ca. 0.46 GPa) are reported in Table 3, as well as the ones from the ab initio simulations from –2 to 8 GPa. The unit-cell volume at ambient pressure (V0) could not be determined at the Elettra Synchrotron because the crystals were loaded into the DAC prior to the start of the experiment. Changes in the experimentally and HF/DFT calculated unit-cell parameters with pressure are illustrated in Fig. 1. The pressure dependence of the unit-cell volumes from both the experiment and HF/DFT calculations are shown in Fig. 2. A steady decrease of the a, b, c and β angles, and volume, V, was observed as a function of pressure with no evidence of discontinuities or clear changes in slope related to a phase transition in the studied pressure range. The behaviour of the a and c cell parameters is quite similar. However, the b cell parameter exhibits a change in the experimentally collected data, beginning to decrease more at ∼4 GPa, indicating a softening, while the a*sin(β) direction, which corresponds to the direction perpendicular to the one along which the tetrahedra chains extend, becomes stiffer. However, considering the ab initio data, the b cell parameter does not present any variation at ∼4 GPa, whereas it is confirmed that the a*sin(β) direction is the stiffest. The scattering in the HP data presented in these graphs (in particular for the point at 9.13 GPa) can be attributed to the limitations of experimental geometry, which is not the best to obtain accurate cell parameter determinations (Angel et al., Reference Angel, Downs and Finger2000), but the overall trends are clearly discernible.

Figure 1. Evolution of the (a) experimentally observed and (b) ab initio calculated unit-cell parameters.

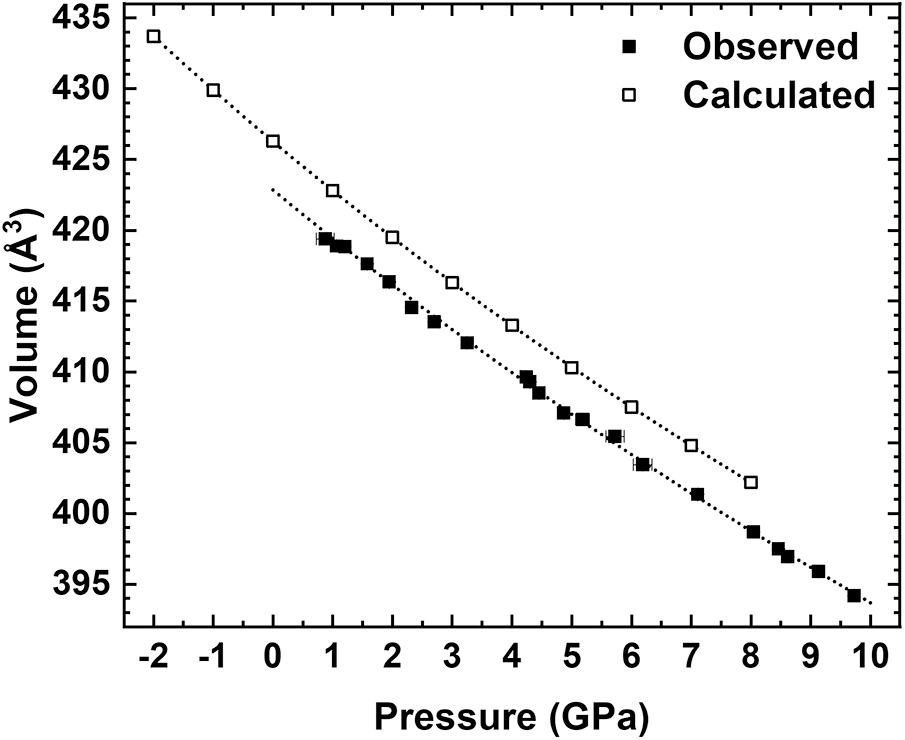
Figure 2. Evolution the unit-cell volume with pressure of the analysed crystal (Jd43Di57) compared to the HF/DFT calculated one (Jd50Di50).
Table 3. Unit-cell parameters at different pressures of omphacites

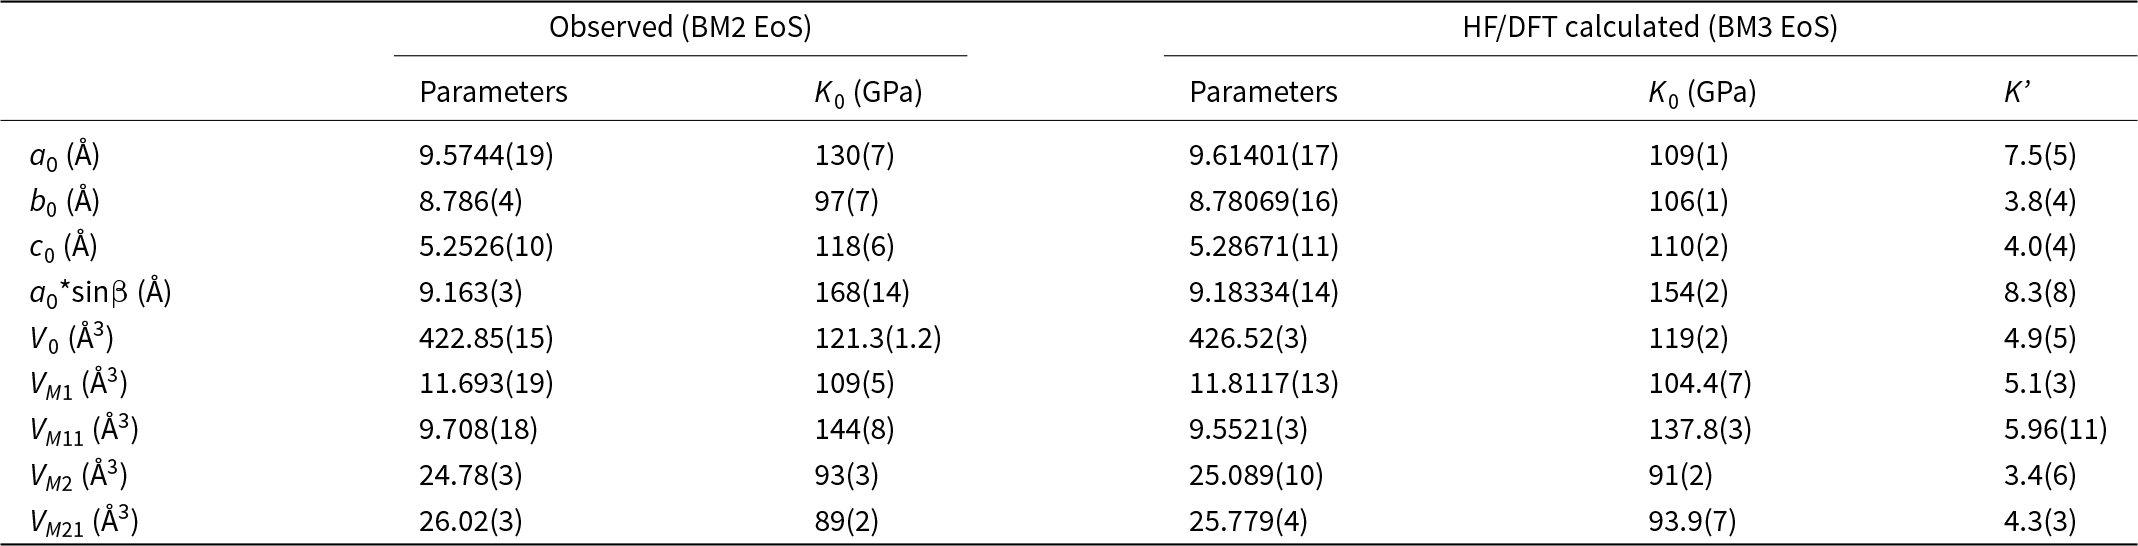
One way to demonstrate the quality of the experimental data is the fE–FE plot (Angel, Reference Angel2000) that shows the dependence of the Eulerian strain (fE = [(V 0/V)2/3–1]/2) on the normalised stress (FE = P/3 fE (1–2fE)5/2). As the fE–FE plot requires knowledge of V 0, which could not be measured, the selection of the EoS was based on the evaluation of the errors of the parameters, the goodness of fit and maximum misfit of pressure. Least-squares fits were weighted by the uncertainties of both pressure and volume in the EoSFit7-GUI software (Gonzalez-Platas et al., Reference Gonzalez-Platas, Alvaro, Nestola and Angel2016). A second-order Birch-Murnaghan (BM2) EoS fits the experimental data as well as a third-order BM EoS, while the refined value of K’ for the BM3 EoS deviates by less than 1 estimated uncertainty from the implied value of 4 for the BM2 EoS. The refined parameters for a BM2 EoS are V 0 = 422.85(15) Å3, and K 0 = 121.3(1.2) GPa (Table 4). The elastic parameters obtained are consistent with the general trends on the Di–Jd join (see Table 1). In Supplementary Fig. S1, the confidence ellipses were calculated for our samples and the datasets of ordered omphacite presented in Table 1, up to a confidence level of 68.3%. A parameterised form of the BM2 EoS was used to determine the axial moduli of a, b and c, and asinβ using EoSFit7-GUI with the data weighted by the uncertainties of both pressure and lattice parameters. The calculated EoS coefficients are reported in Table 4.
Table 4. EoS parameters of omphacites determined in this study

For the fully ordered Jd50Di50 omphacite, calculated with hybrid HF/DFT simulations, we employed a third-order Birch-Murnaghan EoS (BM3), and the fit of all data yields V 0 = 426.52(3) Å3, K 0 = 119(2) GPa, and K’ = 4.9(5) (Table 4).
Structure evolution with pressure
The fractional coordinates and displacement parameters obtained using the merged diffraction data of the two slices of the Jd43Di57 omphacite are reported in Supplementary Tables S2 and S3, respectively. Bond lengths, specific angles, polyhedral volumes and deformation parameters are listed in Supplementary Table S4. The corresponding structural parameters calculated with HF/DFT simulations are reported in Table S5. The full structural data has also been deposited in crystallographic information files (CIFs) as supplementary materials.
T sites
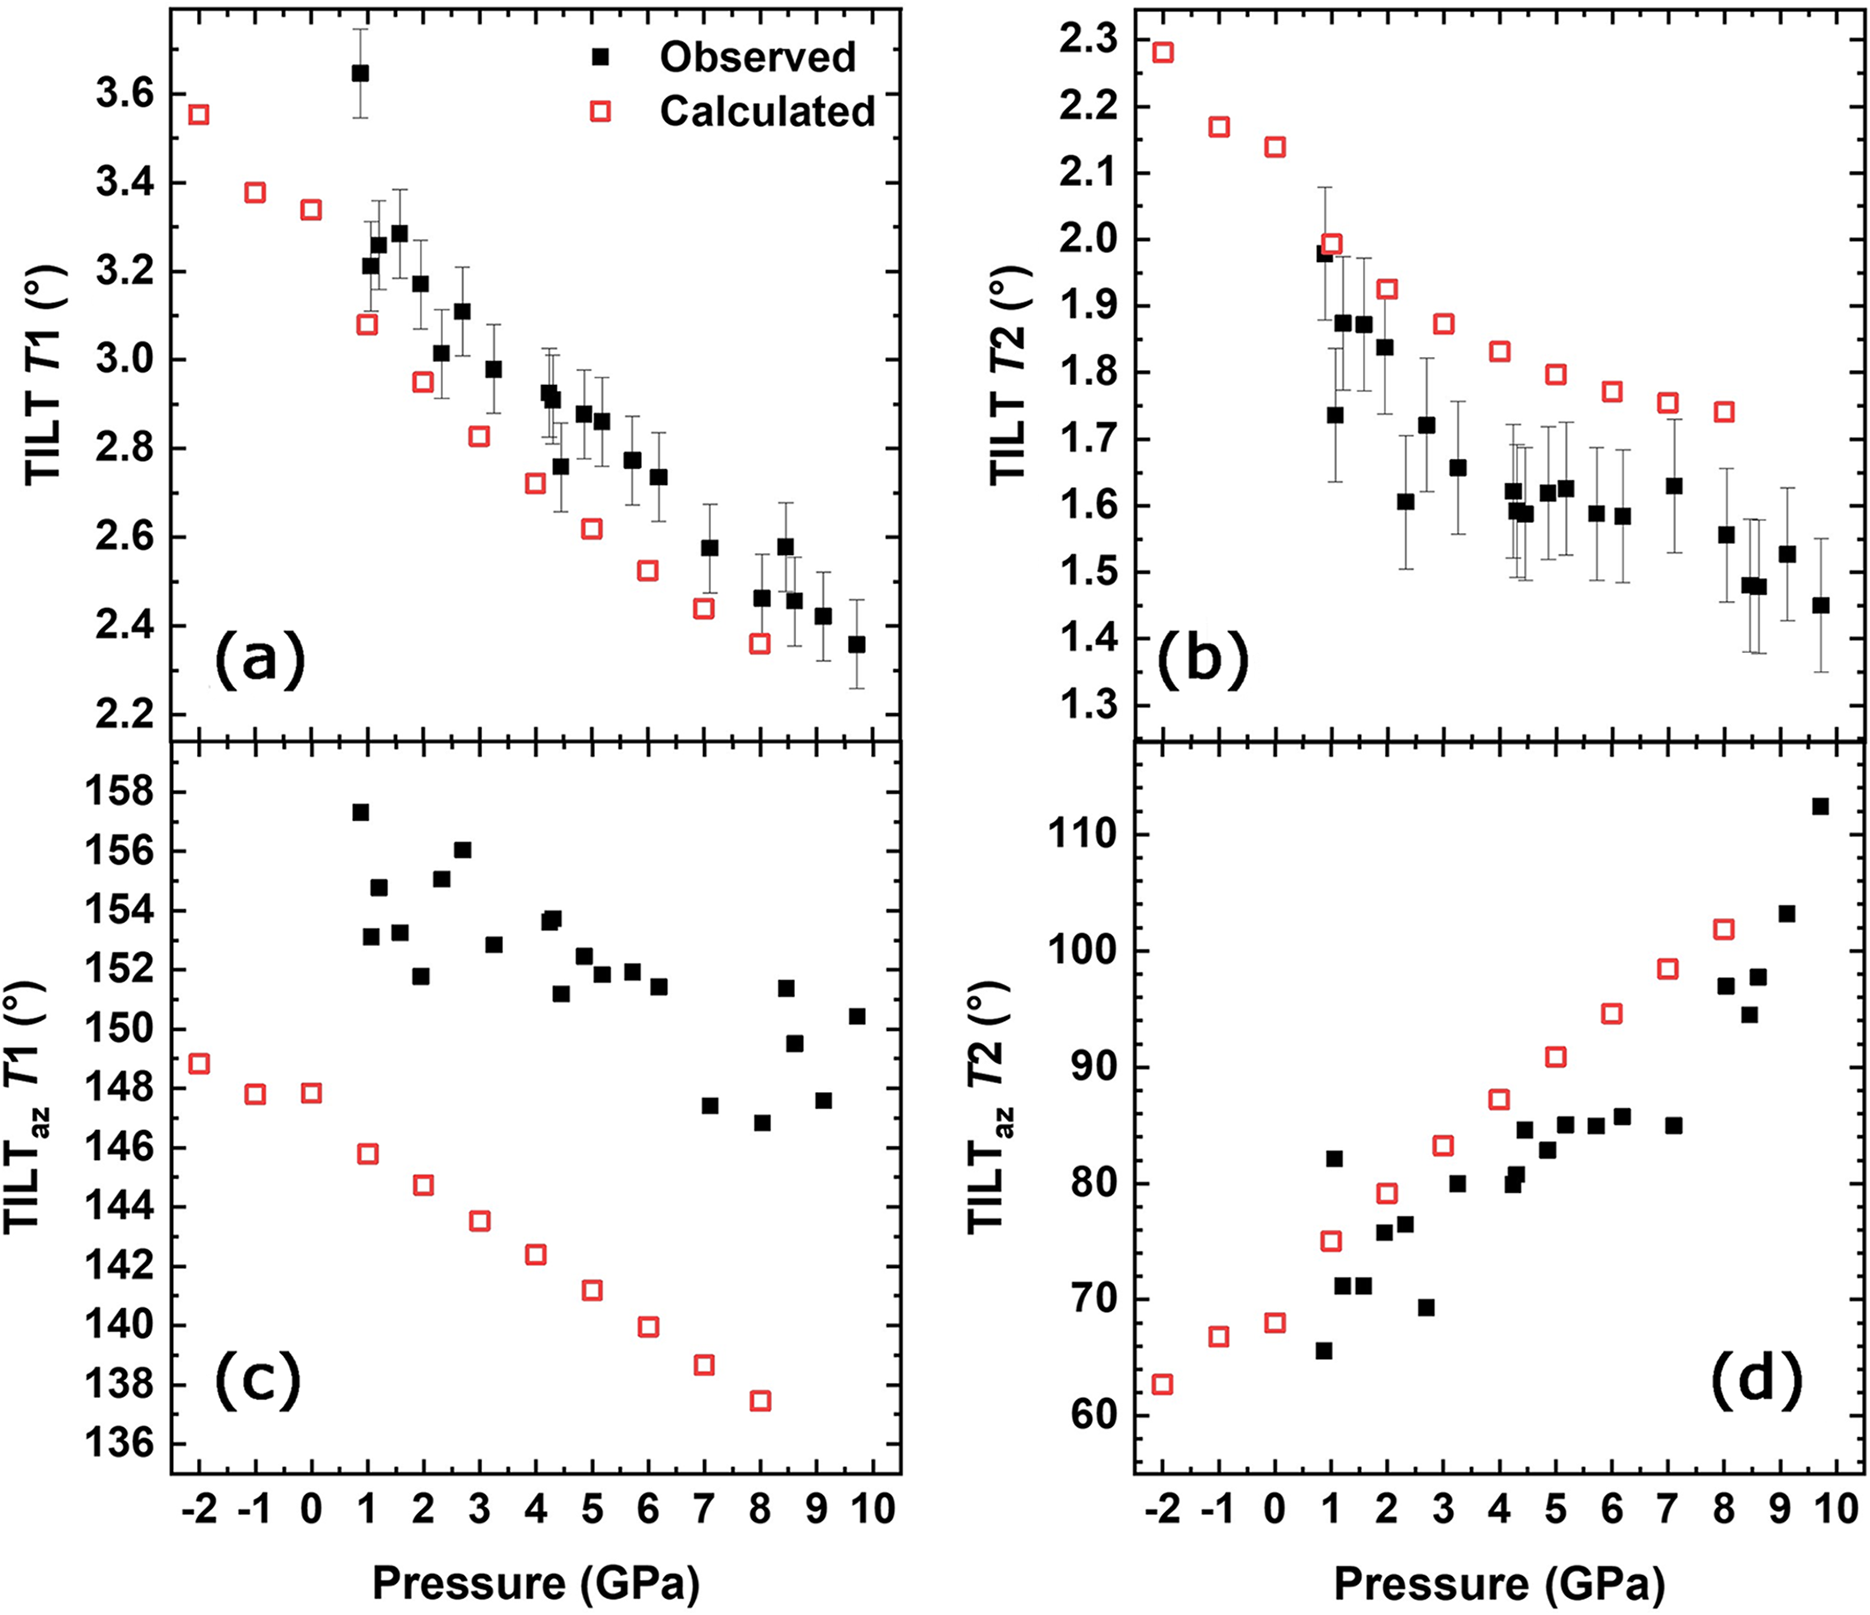
Although tetrahedral sites in minerals are often considered to be rigid, a small decrease in volume (∼3.6%) of both the T1 and T2 sites up to the maximum pressure was measured (Table S4). Nevertheless, the silicon tetrahedra remain the stiffest polyhedra in the structure, with K 0 of 308(29) GPa for T1 and 257(21) GPa for T2, respectively. The TILT angle is defined as the out-of-plane tilting of the basal face of the tetrahedra with respect to the plane (100) (Cameron et al., Reference Cameron, Sueno, Prewitt and Papike1973), and it is related to the way the M and T polyhedra accommodate each other. Therefore it is sensitive to the ordering process (as these change the M octahedra geometry; see Boffa Ballaran et al., Reference Boffa Ballaran, Carpenter, Domeneghetti and Tazzoli1998a and Cámara et al., Reference Cámara, Nieto and Oberti1998, for a description of the variation of TILT angle with cation order), but it is also sensitive to increasing pressure (Fig. 3a,b). As pressure is increased the tetrahedra basal faces tend to align parallel to the (100) plane. TILT of T2 (Fig. 3b), in particular, ceases to decrease at ∼3 GPa, and also ab initio simulations confirm that this angle starts to decrease slowly at ∼3 GPa and remains almost constant at higher pressure. The TILTaz represents the azimuthal component of the TILT angle (Boffa Ballaran et al., Reference Boffa Ballaran, Carpenter, Domeneghetti and Tazzoli1998a) for the two neighbouring tetrahedra T1 and T2. The TILTaz of T1 decreases with pressure (Fig. 3c), but the experimental data show a significant scatter. TILTaz of T2 is characterised by a stronger pressure dependence (Fig. 3d). Consequently, the changes in TILTaz of T2 indicates that this tetrahedron continues to rotate even after it stops tilting.

Figure 3. Pressure dependence of the TILT angle related to (a) T1 and (b) T2, and the TILTaz angle related to (c) T1 and (d) T2. The data are compared to the ones obtained with HF/DFT simulations.
The dihedral angle between the basal faces of the two tetrahedra ( ${\hat{\rm{T}}}$), which defines the bending of the chain of tetrahedra with respect to the c axis (see Supplementary Fig. S2), increases with pressure, leading to a flattening of the chain towards the (100) plane.
M sites
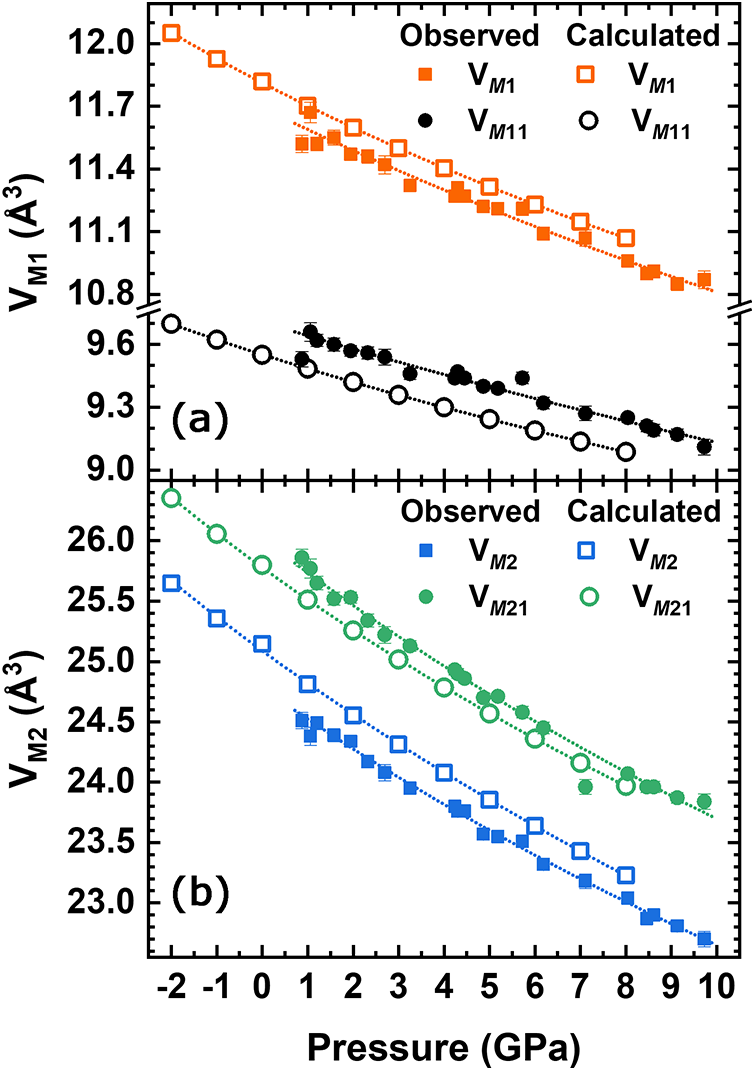
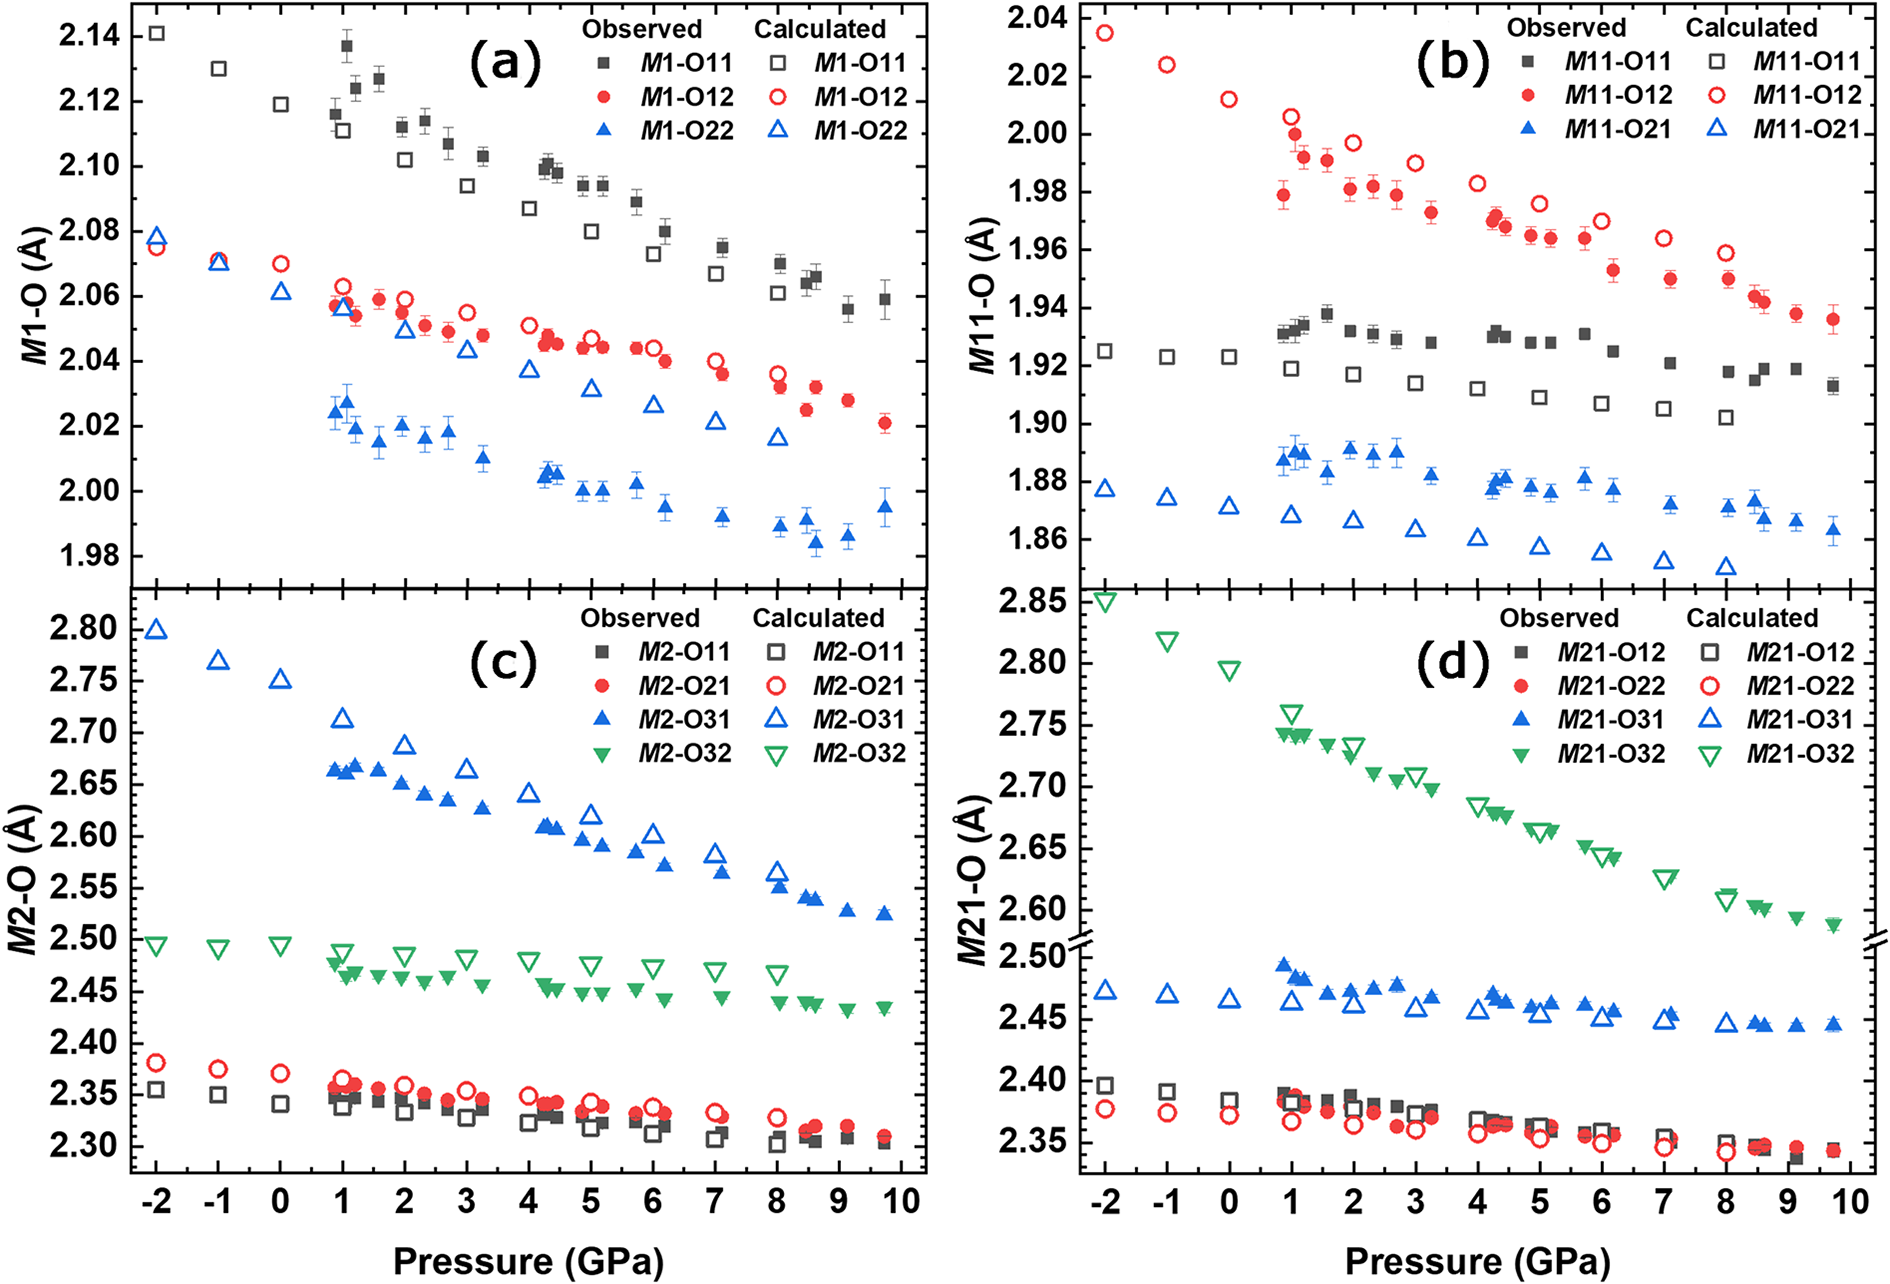
From the variation of the observed polyhedral volumes (Table S4) it is observed that the smallest compressibility of the M sites in the structure is displayed by the octahedral polyhedra (5.6% for M1 and 4.4% for M11). The evolution of the polyhedral volumes for the M sites, compared to the ones calculated with ab initio simulations is shown in Fig. 4. The estimated standard uncertainties reported in Fig. 4a,b and in Table S4 were calculated using the Crystal Palace software (Angel et al., Reference Angel, Mazzucchelli, Baratelli, Schweinle, Balic-Zunic, Gonzalez-Platas and Alvaro2025). The eight-coordinated polyhedra (M2 and M21) are the most compressible (see Table 4) and contribute the most to the unit-cell compression (7.3% for M2 and 7.8% for M21). A BM2 EoS weighted by the uncertainties of both pressure and volume was fitted to the polyhedral volume of M sites, while a BM3 EoS was used for the HF/DFT data. The results are reported in Table 4. Our data clearly shows the higher stiffness for the M11 site, as one can expect for a small octahedral site essentially populated by Al. Conversely, the higher compressibility observed for the M2 and M21 polyhedra seems to be independent of the chemistry of the site. The EoS parameters obtained with HF/DFT simulations agree with the experimental ones; only V 0 for each polyhedron is different due to the different site occupancy from the natural sample; in the simulated structure the M1 site is fully occupied by Mg, M11 by Al, M2 by Na, and M21 by Ca, leading to Q occM 1 = Q occM 2 = 1. At any rate, the M1 polyhedron is slightly softer than M11 and this is mainly due to the greater compressibility of the two bond lengths M1–O11 (Fig. 5a) and M11–O12 (Fig. 5b). The HP behaviour of the bond lengths within the M sites is further corroborated by the ab initio simulations. The experimental results show that the M1–O22 bond does not decrease further above ∼7 GPa. A larger deformation can be seen in the M2 polyhedron than in M1: in particular, the M2–O31 bond length shows a strong decrease with pressure (Fig. 5c). For the M21 polyhedron the M21–O32 bond length decreases more than the other bonds in this polyhedron (Fig. 5d). This significant difference may account for the greater volumetric reduction observed in the M21 polyhedron. Also, the M21–O31 bond length does not decrease beyond 8 GPa, remaining constant up to the maximum pressure. The long M(2,21)–O bond distances are related to the rotation (kinking) of the tetrahedral chain, i.e. the O32–O31–O32 angle between bridging oxygens in the chain, which decreases (Supplementary Fig. S2; Table S4) from 168.5° to 164.5°: it decreases linearly to 6 GPa, remains constant up to 8 GPa, and then decreases again up to 10 GPa. The HF/DFT simulations show that this angle decreases steadily through the entire pressure range.

Figure 4. Variation of (a) M1 and M11; and (b) M2 and M21 polyhedral volumes as a function of pressure, compared to the correspondent polyhedral volumes calculated by ab initio simulations. M1 is preferentially occupied by Mg, M11 by Al, M2 by Na, and M21 by Ca.

Figure 5. Pressure dependence of the bond lengths of the six- and eight-coordinated sites compared to the ones calculated by HF/DFT: (a) M1; (b) M11; (c) M2; and (d) M21 bond lengths.
Deformation parameters
The pressure-induced deformation of the M sites was determined with several distortion parameters calculated with VESTA software (Momma and Izumi, Reference Momma and Izumi2008), and are reported in Table S4.
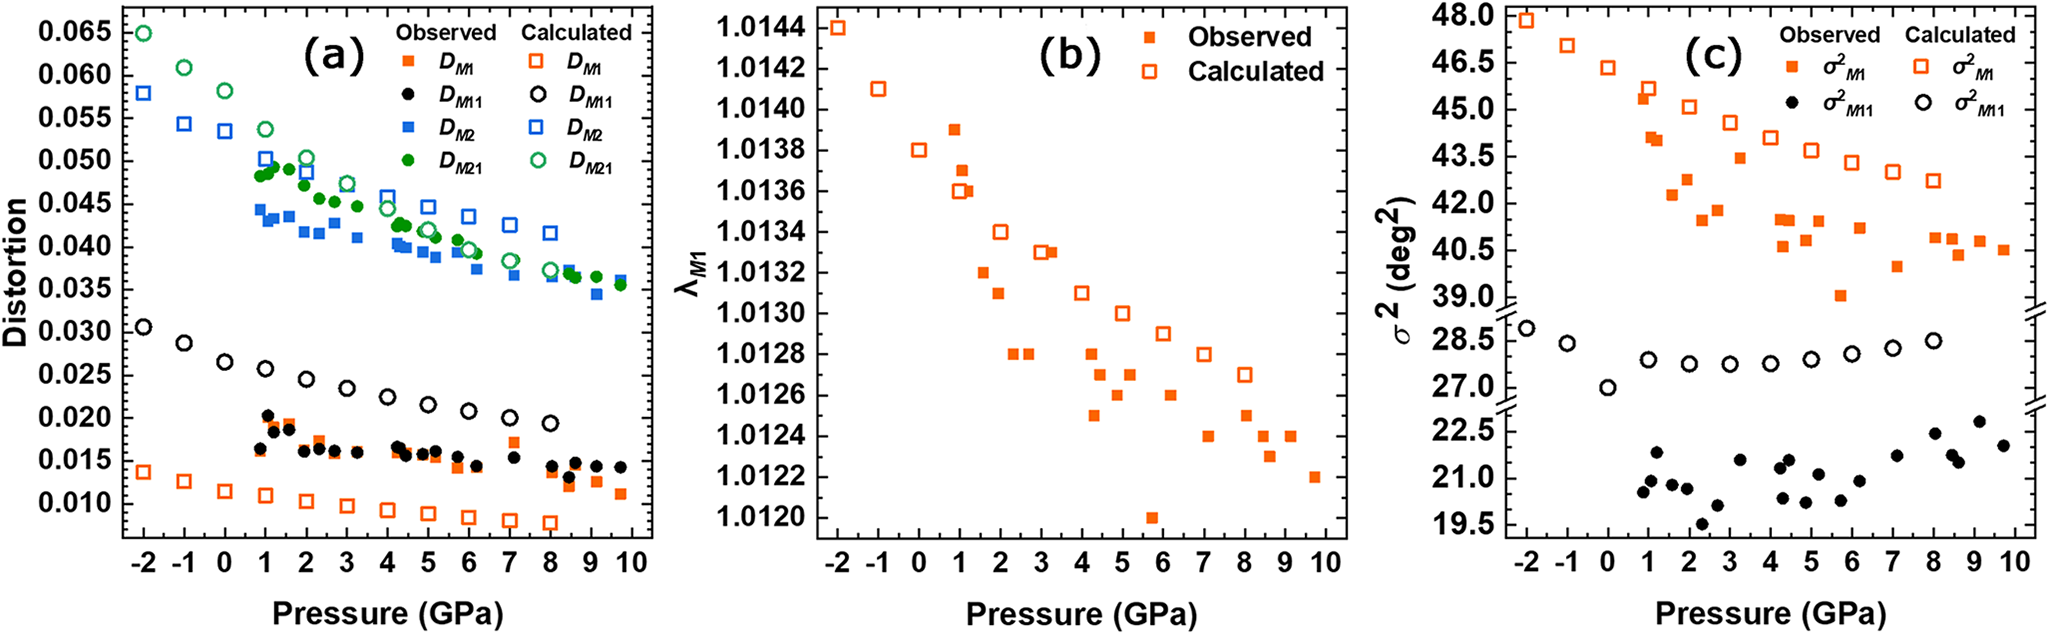
The parameter D (Baur, Reference Baur1974) is based on bond lengths, and Fig. 6a shows its pressure dependence: D is higher in the M2 polyhedra than in M1 and decreases with pressure. In addition, D for the M21 site that contains preferentially Na, decreases more than DM 2, up to ∼6 GPa, at which pressure D values of the two polyhedra are equal. The HD/DFT results show that DM 21 is higher than DM 2 up to ∼3 GPa, after which the distortion behaviour is inverted. The parameter λ (Robinson et al., Reference Robinson, Gibbs and Ribbe1971) provides a quantitative measure of polyhedral distortion which is independent of the effective size of the polyhedron. It has been observed that λ of the M1 octahedron decreases with increasing pressure (Fig. 6b), but the rate of decrease begins to slow after ∼4 GPa. The rate of decrease of λ for the M1 octahedron calculated with ab initio remains relatively constant in the studied pressure range. The pressure dependence of σ2 (the variance of the polyhedral angles, Robinson et al., Reference Robinson, Gibbs and Ribbe1971) of M1 and M11 are shown in Fig. 6c. The variation with pressure is antithetical for these sites. σ2M 1 shows a reduction from 45.34°2 to 41°2 at 4 GPa and remains almost constant, showing only a slight decrease at higher pressure. Instead, σ2M 11 remains almost constant at ca. 21°2 and then starts increasing above 6 GPa, reaching almost 23°2. The limited angle deformation of the M11 site is consistent with the higher stiffness of this polyhedron. Ab initio simulations confirm this behaviour: σ2M 1 decreases from ∼48°2 to 43°2 at 8 GPa, while σ2M 11 exhibits a slight reduction from ∼29°2 to 27.7°2 up to 3 GPa, after which it begins to rise, reaching 28.5°2.

Figure 6. Pressure dependence of (a) the distortion index D (Baur, Reference Baur1974) of the six- and eight-coordinated sites; (b) the quadratic elongation λ (Robinson et al., Reference Robinson, Gibbs and Ribbe1971) of M1; and (c) bond angle variance σ2 (Robinson et al., Reference Robinson, Gibbs and Ribbe1971) of M1 and M11.
Discussion and conclusions
The EoS parameters from both the experimental data and the ab initio calculations agree with those reported in the literature (Table 1). The values we obtained are consistent with those published by Zhang et al. (Reference Zhang, Hu and Dera2016), though these authors derived the BM3 EoS for averaged volumes for T1/T2, M1/M11 and M2/M21 as the independent values were badly scattered, which they attributed to refinement artifacts. This is due to their limited reciprocal space coverage (less than 22% full coverage) and they performed refinements with restrained isotropic displacement parameters. This validation not only reinforces the reliability of our computational methods but also allows for a more detailed exploration of the baric variation of the phonon spectrum of omphacite, enhancing our understanding of the vibrational dynamics.
In situ Raman spectroscopy conducted under HP conditions on a natural crystal of Jd43Di57 omphacite, described by Baratelli et al. (Reference Baratelli, Murri, Alvaro, Prencipe, Mihailova and Cámara2024), revealed some variations in its elastic behaviour under isothermal increasing pressure conditions. The pressure dependence of some Raman peak wavenumbers exhibited anomalous behaviour near 5 GPa. Pandolfo et al. (Reference Pandolfo, Nestola, Cámara and Domeneghetti2012a), in their SC-XRD study of a sample from the same locality and of very similar composition, had observed that both M1 and M11 polyhedral volumes apparently show a slight change in slope at ∼4 GPa, however the number of pressure data points and the accuracy of their refinements (limited access to reciprocal space and isotropic displacement parameters for oxygen atoms) did not allow them to draw any conclusions. This pattern has not been observed in our new dataset, where the volume of M1 and M11 octahedra remain almost constant between ∼4.8 and 5.7 GPa, although this discrepancy may be due to the scatter of data points at 5.72 GPa. Because diffraction data with nearly complete access to reciprocal space were obtained, providing good accuracy and precision in bond lengths and angles and thus data reliability, and because of the narrower sampling in pressure, we were able to perform a comparison with Raman results (Baratelli et al., Reference Baratelli, Murri, Alvaro, Prencipe, Mihailova and Cámara2024). In detail, the shift of the Raman wavenumber of the peaks at 1007 and 1024 cm–1 shows a discontinuity close to 5 GPa, whereas the pressure dependence of the wavenumbers (ω(P)) at 375 and 337 cm–1 shifts at ∼4.5 GPa, and the full width at half maximum (FWHM) of the peak at 271 cm–1 decreases above 5 GPa. Hybrid HF/DFT simulations revealed that the anomalous behaviour of the peak at ∼337 cm–1 can be attributed to two modes of the same symmetry approaching one another in energy but without energy crossing. Within this spectral range, there are actually two Ag modes, at 337 and 349 cm–1.
The 375, 349 and 337 cm–1 phonon modes are associated with SiO4 tilting and M-cation vibrations, and their anomalous behaviour should be linked to a change in the M–O–Si interactions. One possible explanation is that the enhancement of phonon–phonon interactions under pressure, between 4.5 and 5 GPa, induces a homogenisation of local elastic strains that are connected to the chemical ordering at the M sites. Pressure may lead to a redistribution of the local elastic strains due to the difference in the ionic sizes of the M-site cations, resulting in a tendency to unify MO6 volumes (Supplementary Fig. S3) and consequently, average effective M–O–Si force constants that appear to be the same as a state of site-occupancy disorder. This phenomenon could also be responsible for the anomaly in the averaged ω(P) of the Si–Onb bond stretching modes observed near 1007 and 1024 cm–1, because M–O interactions have a secondary effect on the energy of this phonon mode. The experimentally observed reduction of the FWHM of the 271 cm–1 peak, resulting primarily from M-cation vibrations, is also consistent with the assumption of a smaller variation in the MO6 sizes above ∼4.5 GPa.
The HP SC-XRD analysis conducted on an omphacite sample with the same composition (Jd43Di57) in this study has revealed a distortion variation in the M1 polyhedron expressed as σ2 (Fig. 6c). This distortion is influenced mainly by the M1–O22 bond length (Fig. 5a), which is also associated with the TILT angle of T2 tetrahedron (Fig. 3b). Notably, the TILT angle of the T2 tetrahedron stabilises at ∼3 GPa, which corresponds with a reduction in the rate of M1 polyhedron deformation. The T2 tetrahedron is connected to the M1 octahedron through the O22 oxygen, and the M1–O22 bond remains constant beyond ∼7 GPa. This bond is the shortest within the M1 polyhedron, indicating that this distance cannot decrease beyond ∼1.99 Å. Ab initio simulations indicate that the 337 cm–1 mode is related to the tetrahedral rotation around the c axis that can be related to the T2 tetrahedral TILT angle variation. Thus, both long-range (SC-XRD) and short-range (Raman spectroscopy) analysis supports the observed changes in polyhedral distortion of the M1 octahedra. In disordered omphacites, this behaviour cannot be observed due to symmetry constraints: in C2/c omphacite, only a single M1 polyhedron is present, exhibiting an average chemistry between the M1 and M11 sites of P2/n structure, resulting in a Raman spectrum that displays few Raman active modes.
In conclusion, for the first time, ab initio calculations and accurate short-range and long-range experimental data are shown to agree in a low symmetry chemically complex mineral paving the route to a better comprehension of the complexity of the elastic behaviour in geologically important crystalline materials. By clarifying how specific vibrational modes relate to structural distortions, especially in relation to symmetry constraints and polyhedral tilting, this study enhances our ability to interpret Raman spectra in terms of atomic-scale structural changes. Furthermore, these findings have important implications not only in mineral physics, but also in metamorphic petrology. The description of the elastic and structural behaviour of omphacite crystals during compression will provide deeper insight into the genetic processes of omphacite-rich rocks, such as eclogites, and the mechanical and seismic properties of eclogite-facies rocks, with implications for interpreting geophysical data from subduction zones and the deep crust.
Supplementary material
The supplementary material for this article can be found at https://doi.org/10.1180/mgm.2025.10107.
Competing interests
The authors declare none.
Acknowledgements
We thank RJ Angel for fruitful discussions that contributed to this work.
Funding statement
This work was funded by the Italian Ministry of University and research (MIUR) through a PhD grant to L. Baratelli and to F. Cámara and L. Baratelli through the project “Dipartimenti di Eccellenza 2023-2027”. This work was financially supported by the Fondazione Cariplo grant agreement #2023-2431 assigned to M. Alvaro by the PRIN-MUR project no. 2020WPMFE9 to G. Pennacchioni and no. 2022AL5MSN to M. Cremonesi.


 Open access