


Introduction
Public opinion polls play a crucial role in democracies, especially during election campaigns, where polls asking for citizens' voting intentions frequently attract significant interest. Citizens are now exposed to a historically high number of polling estimates. This development is accompanied by a longstanding academic and public debate on the potential effects of public opinion polls on citizens' voting intentions. On the one hand, several studies have shown that polls can be critical in influencing whether citizens decide to vote on election day and whom they vote for (Dahlgaard et al., Reference Dahlgaard, Hansen, Hansen and Larsen2017; Donovan & Bowler, Reference Donovan, Bowler, Blais, Laslier and Straeten2016; Stolwijk et al., Reference Stolwijk, Schuck and de Vreese2017; van der Meer et al., Reference van der Meer, Hakhverdian and Aaldering2016). On the other hand, some studies cast doubt on whether polls significantly impact election outcomes (e.g., Blais et al., Reference Blais, Loewen, Rubenson, Stephenson, Gidengil, Aldrich, Blais and Stephenson2018; Daoust, Reference Daoust, Durand and Blais2020).Footnote 1 A third group points to heterogenous effects across voters, indicating that individuals without partisan attachment and low levels of political sophistication are most likely to be affected by polling results (e.g., Roy et al., Reference Roy, Singh and Fournier2021; Singh, Reference Singh, Roy, Fournier, Blais, Laslier and Straeten2016).
Overall, opinion polls can provide voters with high‐quality information on the state of the voting preferences of their fellow citizens. However, sceptics have repeatedly underlined that pre‐election polls can damage the democratic process, as erroneous polling information can misdirect citizens' perceptions of political parties' public support prior to election day (Bartels, Reference Bartels1988; Mutz, Reference Mutz1998). In particular, polling inaccuracies, such as those before the 2016 and 2020 U.S. presidential elections or the 2016 Brexit referendum, have triggered substantial doubts regarding the credibility of opinion polls (Jennings & Wlezien, Reference Jennings and Wlezien2018; Kenett et al., Reference Kenett, Pfeffermann and Steinberg2018).
Uncertainties inevitably surround public opinion polls due to multiple factors, such as the potential sampling and weighting errors of pollsters or respondents being undecided about whom to vote for. In addition, estimates of the public preferences of some larger populations are accompanied by random sampling error. ‘Pure’ polling estimates necessarily communicate more precision about the state of an election campaign than would be appropriate. What drives academic and public concern is the possibility that voters base their voting decisions on polling estimates without taking their uncertainty into account.
As a (partial) remedy to these concerns, scholars and pundits have called for margins of error to be reported when publishing opinion polls (BBC, 2019; ESOMAR/WAPOR, 2014; Pew Research Center, 2016). Two factors support this approach. First, margins of error provide a more accurate and complete depiction of the electorate's voting intentions. Second, and more importantly, these margins can affect citizens' perceptions of the polls and the core information they are presenting. Consequently, voters are likely to respond differently to the same poll depending on whether margins of error are displayed.
In this article, we examine whether (and if so when) margins of error in public opinion polls alter citizens' voting intentions. We focus on election campaigns in which two major political parties compete to become the strongest force in the next legislature. We argue that showing margins of error underscores the openness of the electoral race. Based on theory of vote pivotality (Riker & Ordeshook, Reference Riker and Ordeshook1968) and strategic voting (Cox, Reference Cox1997, Reference Cox, Herron, Pekkanen and Shugart2018), we hypothesize that margins of error prompt citizens to vote for one of the two largest political parties.
We test these expectations via a large‐scale representative survey experiment with over 3000 respondents conducted in Germany several weeks prior to the 2021 parliamentary election. The results demonstrate that margins of error increase citizens' likelihood of casting their vote for one of the major parties. However, the results also show that this effect depends on two factors: (1) a close race (i.e., a small polling gap between the two largest parties) and (2) interpretative guidance provided with the polling results and their margins of error. Consequently, margins of error significantly influence citizens' voting choices only when accompanied by an interpretation that underscores the competitiveness of the electoral race. These findings demonstrate that journalists and their interpretations can considerably affect the impact of public opinion polls on citizens' voting behaviour and, ultimately, election outcomes.
To the best of our knowledge, this study is the first to develop a theoretical argument on the consequences of displaying margins of error in opinion polls and to offer a solid causal test of their impact on individuals' voting intentions. The findings of this study are important for three main reasons. First, they demonstrate that reporting margins of error can have a substantial causal effect on citizens' vote intentions. More specifically, our results indicate that citizens alter their voting choices once they are provided with clearly visualized margins of error and corresponding poll interpretations. Displaying polling estimates' uncertainty can thus have potentially positive effects on critical features of representative democracy, such as democratic accountability. Second, and in line with previous findings (e.g., van der Meer et al., Reference van der Meer, Hakhverdian and Aaldering2016), this study emphasizes the important responsibility of journalists and the media landscape, as the interpretation of the polls is a crucial factor in determining the impact of displaying the random sampling error on voting behaviour. Therefore, in contrast with the media's current tendency to focus on minor differences in polling estimates and interpret them as definite winning or losing margins (Bhatti & Pedersen, Reference Bhatti and Pedersen2016; Larsen & Fazekas, Reference Larsen and Fazekas2020), the media must not only report the uncertainties of opinion polls but also properly interpret them. Third, our results contribute to broader debates on how the results of scientific research should be communicated to the wider public (Podkul et al., Reference Podkul, Vittert, Tranter and Alduncin2020). Although other studies have cast doubt on the effectiveness of showing confidence intervals to a non‐scientific audience (Daoust & Bastien, Reference Daoust and Bastien2021), our results demonstrate that citizens are able to process the uncertainty that comes with public opinion surveys; however, this effect is dependent on journalists' appropriate interpretation of the estimates.
In the following sections, we discuss the role of margins of error in media reports on election polls and theorize their effects on individuals' voting intentions. Then, we present the experiment methodology and discuss the empirical results. The final section summarizes these results and reflects on the general implications of our findings.
Margins of error in public opinion polls
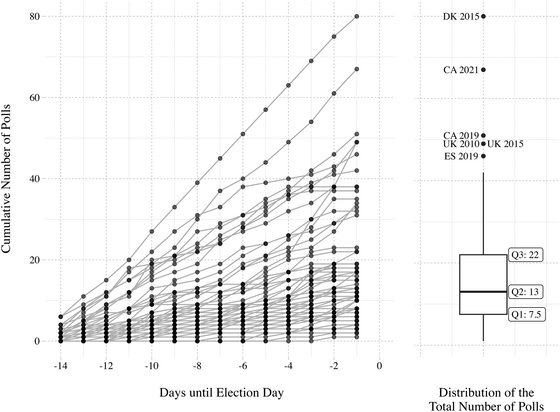
Public opinion polls are an increasingly important part of election campaigns, and their number is at an all‐time high in many countries. Figure 1 visualizes the number of polls published in 20 OECD democracies within a 14‐day window before election day between 2010 and 2022. For this time period, though opinion polls were less common in some countries, such as Finland or Greece,Footnote 2 their median number was 13. That is, on average, a new poll every day in half of the elections. At least seven polls were released in more than 75 per cent of the elections, which is roughly equivalent to a new poll every other day.

Figure 1. Evolution of the number of election polls published within 14 days before election day in 20 OECD countries, 2010–2022.
Note: The left panel of the figure shows the cumulative sum of polls published across 2‐week windows before election day in 20 OECD democracies between 2010 and 2022. Polls are counted based on the end of the corresponding survey fieldwork, and exit polls were not considered. The right panel shows the corresponding distribution of the total number of polls published within this period. Countries: Australia, Austria, Canada, Czech Republic, Denmark, Estonia, Finland, Germany, Greece, Iceland, Ireland, Italy, the Netherlands, Norway, Poland, Portugal, Slovenia, Spain, Sweden, and the United Kingdom. Q1: lower quartile; Q2: median; Q3: upper quartile. CA: Canada; DK: Denmark; ES: Spain; UK: United Kingdom. Sources: own data collection; Jennings and Wlezien (Reference Jennings and Wlezien2018) and Kayser, Orlowski, and Rehmert (2022). See Section A1 in the online Appendix for a detailed discussion of the data sources and their harmonization.
Although voters might ground their expectations about likely election results upon multiple factors (e.g., political parties' programmatic offerings, their performance in office or candidate characteristics), opinion polls undoubtedly constitute an important – if not the ‘most important’ (Irwin & Van Holsteyn, Reference Irwin and Van Holsteyn2008, p. 486) – source of information for the state of an election campaign. Consequently, polls are widely discussed in media reports and perceived by many voters.Footnote 3
Notably, sources of polling error are multifaceted. The response quality in surveys might be biased (e.g., due to late swing voters, differential ‘don't knows' or turnout over‐reporting). In addition, polling institutes determine how, when, and where to field the surveys. These factors can introduce additional biases resulting from the sampling and weighting approach, the mode of data collection, the wording and format of survey questionnaires, or the various ways of processing geographic and other subgroup heterogeneity in survey responses. Furthermore, polling institutes appear to engage in herding behaviour, potentially resulting in further distortions in public discussions of likely election outcomes (see for recent overviews: Jennings & Wlezien, Reference Jennings and Wlezien2018; Kenett et al., Reference Kenett, Pfeffermann and Steinberg2018; Prosser & Mellon, Reference Prosser and Mellon2018). Hence, design choices can substantially influence the accuracy and biases involved in public opinion polls. Consequently, poll estimates usually suggest more precision to their consumers than they actually contain.
Aside from methodological issues stemming from pollsters' design choices, survey estimates always carry uncertainty due to random sampling errors. The corresponding margin of error, which is a function of the pre‐defined confidence level, the estimated sample proportion and the sample size, can easily be included in opinion‐poll reports.Footnote 4 Visualizing the resulting confidence intervals can allow citizens to better understand how close they can reasonably expect a poll result to be to the true population value.
Although public opinion pundits frequently demand margins of error to be transparently reported (BBC, 2019; ESOMAR/WAPOR, 2014; Pew Research Center, 2016), the media often fails to provide this essential information (Beckers, Reference Beckers2021; Bhatti & Pedersen, Reference Bhatti and Pedersen2016; Welch, Reference Welch2002). Brettschneider (Reference Brettschneider, Donsbach and Traugott2008) found that only 2 per cent of the polling results reported in the German media between 1980 and 2002 included the corresponding margins of error. Despite a substantial increase in published polling estimates, Vögele and Bachl (Reference Vögele and Bachl2020) depict a similar occurrence, concluding that margins of error were reported in 4 per cent of news reports covering opinion polls between 2005 and 2017. In a case study of the 2011 Danish election campaign, Bhatti and Pedersen (Reference Bhatti and Pedersen2016) concluded that two‐thirds of all poll‐based comparisons were made using numbers that were not significantly different from each other.Footnote 5
For more recent elections, the coverage of margins of error has increased. Beckers (Reference Beckers2021) analysed television news during the U.S. 2020 presidential campaign and found that 76 per cent of the reported results of ‘in‐house’ polls included mentions of the corresponding margins, whereas the share was 39 per cent for ‘outside’ polls. Still, this information was only shown in small letters, and journalists explicitly referred to the margins of error in only 3 per cent of the cases. In the Netherlands, Louwerse and van Dijk (Reference Louwerse and van Dijk2022) have found that the reporting of margins of error has increased substantially from 5.9 per cent in 2010 to 64.9 per cent in 2017. For the 2021 German federal election under study in this article, we find that 23 per cent of the poll‐related news coverage mentioned margins of error, but only 2 per cent gave an interpretation of these margins when drawing conclusions about the state of the electoral race.Footnote 6

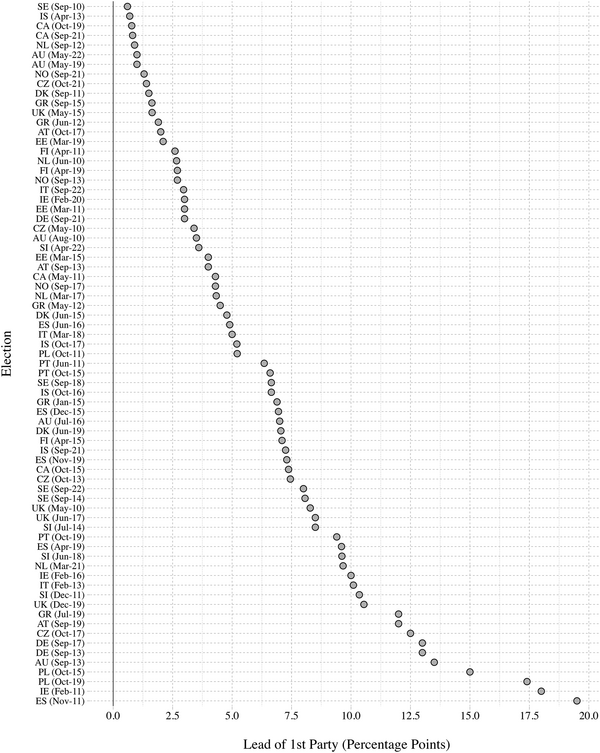
Figure 2. Pre‐election poll leads in 20 OECD countries, 2010–2022.
Note: The figure shows the poll gap between the two leading parties in the last public opinion poll published before the corresponding parliamentary election. The y‐axis shows the single elections. Country selection and sources identical to Figure 1. See Section A1 in the online Appendix for a detailed discussion of the data sources and their harmonization.
Figure 2 illustrates the closeness of parliamentary elections as indicated by pre‐election polls in 20 OECD countries since 2000. The points show the lead of the strongest party in the last poll published before the respective elections. In $\hskip.001pt 38$ of the $\hskip.001pt 73$ elections, the largest party had a six‐point lead (or less) in the polls. Assuming, for instance, a margin of error of three percentage points, the confidence intervals of the two main parties would have overlapped in $\hskip.001pt 52$ per cent of the cases.Footnote 7 In 27 per cent of cases ( $n=20$), the maximum lead was only three percentage points. Here, margins of error would have made voters aware that the electoral races were tightly contested. However, it remains unclear to what extent this information would have affected voting intentions and, consequently, election outcomes.
Hypotheses
How might displaying margins of error affect citizens' voting intentions? Based on the observation that ‘raw' poll estimates tend to overstate the gap in public support between the leading and the second‐placed political parties, we expect margins of error to inform voters that an electoral race is more tightly contested than the poll estimates alone would indicate. Consequently, once margins of error are displayed, citizens' voting intentions for these parties should increase. Two underlying mechanisms can drive this effect.
First, margins of error can affect citizens' beliefs that their vote can substantially influence the outcome of an election (Riker & Ordeshook, Reference Riker and Ordeshook1968). Research on vote pivotality in plurality systems has supported the expectation that more conclusive information about the state of a race depresses turnout. In contrast, information underlining the openness of a race mobilizes citizens to cast their votes. This connection has been repeatedly observed in observational studies (Cancela & Geys, Reference Cancela and Geys2016; Sudman 1986), quasi‐experimental work (Morton et al., Reference Morton, Muller, Page and Torgler2015) and field and survey experiments (Duffy & Tavits, Reference Duffy and Tavits2008; Levine & Palfrey, Reference Levine and Palfrey2007).Footnote 8
Second, considerations about future coalition governments can influence how citizens vote (Gschwend et al., Reference Gschwend, Meffert and Stoetzer2017). By and large, coalition‐oriented strategic voting assumes that citizens do not vote for their most preferred party to increase the likelihood that certain government coalitions form after the election (Bargsted & Kedar, Reference Bargsted and Kedar2009; Cox, Reference Cox1997; Indridason, Reference Indridason2011; Kedar, Reference Kedar2012). Although coalition‐based strategic voting can take different forms, such as policy balancing or threshold‐insurance voting (Gschwend & Meffert, Reference Gschwend, Meffert, Arzheimer, Evans and Lewis‐Beck2017; Indridason, Reference Indridason2011), ‘formateur optimization’ or ‘strategic sequencing’ (Cox, Reference Cox, Herron, Pekkanen and Shugart2018, pp. 267–268) is the most relevant in our study. In most multi‐party systems, the party affiliation of the head of government is, to a substantial extent, a function of party sizes in parliament (Ansolabehere et al., Reference Ansolabehere, Snyder, Jr Strauss and Ting2005; Bäck & Dumont, Reference Bäck and Dumont2008; Martin & Stevenson, Reference Martin and Stevenson2001). For supporters of smaller political parties, strengthening one of the leading political parties is a strategy to secure the latter party's influential position during government formation (Cox, Reference Cox1997). For instance, supporters of smaller radical left and eco‐socialist parties might decide to vote for a major centre‐left party to increase the probability that a left‐wing coalition is formed. This incentive may be stronger the more contested the electoral race between the major parties is. Hence, smaller political parties may lose some of their support to high‐ranking parties due to strategic sequencing (Cox, Reference Cox, Herron, Pekkanen and Shugart2018; Felsenthal & Brichta, Reference Felsenthal and Brichta1985; Irwin & Van Holsteyn, Reference Irwin and Van Holsteyn2008; Nachmias & Sened, Reference Nachmias, Sened, Shamir and Arian1999; Nixon et al., Reference Nixon, Olomoki, Schofield and Sened1996; Taagepera & Allik, Reference Taagepera and Allik2006).
These two effects further the general expectation that citizens are more likely to vote for one of the two major parties when they perceive that the race is tightly contested. In this regard, margins of error may signal that the anticipated winning margin of the leading party is smaller than the poll estimates alone would suggest. These perceptions should translate into increased voting intentions for one of the major parties. In light of this, we can draw the following hypothesis:Footnote 9
H1: Displaying margins of error in opinion polls increases citizens' voting intentions for one of the two leading political parties.
This effect is particularly likely if the race is highly contested. Suppose a poll has a margin of error of $\hskip.001pt 3$ percentage points, according to which Party A has 35 per cent of the support and the second‐placed Party B has 32 per cent of the support. In this scenario, displaying margins of error would make voters aware of the closeness of the electoral race. The support of Party A (32–38 per cent) and Party B (29–35 per cent) would indicate that both political parties could be ahead. In contrast, imagine a scenario where Party A enjoys an $\hskip.001pt 8$‐point lead over Party B. Showing margins of error, in this case, should help voters realize that the race is not substantially contested. We thus expect that the effect of showing margins of error is dependent on the closeness of the race:
H2: Displaying margins of error in opinion polls increases citizens' voting intentions for one of the two leading political parties if the race is highly contested.
Opinion polls are seldom presented in isolation; they are usually part of more extensive media stories. In this context, previous work indicates that poll results influence the nature of media reports about election campaigns (in terms of salience and tonality) and which candidates and parties are covered (Graber, Reference Graber1971; Patterson, Reference Patterson2011). Much attention has also been paid to the media's increased tendency to focus on narrow leads in the polls and to interpret them as definite win‐or‐lose margins (Larsen & Fazekas, Reference Larsen and Fazekas2020). This ‘horserace’ reporting becomes increasingly newsworthy closer to the election day (Aalberg et al., Reference Aalberg, Strömbäck and de Vreese2012; Vögele & Bachl, Reference Vögele and Bachl2020). Such media coverage has been found to affect citizens' political attitudes and political knowledge (de Vreese, Reference de Vreese2004; Irwin & Van Holsteyn, Reference Irwin and Van Holsteyn2008; Valentino et al., Reference Valentino, Beckmann and Buhr2001).
To the best of our knowledge, however, little attention has been paid to how different interpretations of the same public opinion poll can affect citizens' attitudes and political behaviour.Footnote 10 Anecdotal evidence gives reason to assume that journalists' interpretation of polling estimates is crucial for citizens' responses to polls. Prior to the Brexit referendum in June 2016 in the United Kingdom, several opinion polls were published that showed a narrow lead for the Remain camp. This caused media reports to conclude that the majority of voters would vote against Brexit as “Remain move[d] ahead in the polls”.Footnote 11 Such statements, however, would not have been warranted if the margins of error had been properly considered.
We assume that the interpretation of polls provided to voters plays a critical role in the impact of margins of error on voting intentions. Voters are not accustomed to interpreting polls while accounting for margins of error and evaluating them can be a challenging task. Consequently, voters might be more confident in their judgment if media reports provide guidance on how to read the polls. The effect of displaying margins of error in opinion polls is potentially dependent on the inclusion of an interpretation underlining the closeness of an electoral race.
H3: Displaying margins of error in opinion polls increases citizens' voting intentions for one of the two leading political parties if an interpretation underlines the closeness of the race.
Considering both arguments, margins of error should only be decisive for citizens' voting intentions when the gap between the two leading political parties in the polls is small and a corresponding interpretation underlines that the electoral race is tight. In these cases, voters might acknowledge the openness of the election outcome and might be more likely to vote for one of the two leading parties. The last hypothesis expects that margins of error only matter when both conditioning factors are present simultaneously.
H4: Displaying margins of error in opinion polls increases citizens' voting intentions for one of the two leading political parties if the race is highly contested and an interpretation underlines the closeness of the race.
Lastly, we should not expect the effect to be homogeneous across all voter groups. Instead, voters' responses to polling results should be dependent on their ideological orientation. In our study (and in most Western democracies), elections are contested by one major centre‐right and one major centre‐left party. We expect right‐leaning voters to move toward the strongest centre‐right and left‐leaning voters toward the main centre‐left party if the race is perceived to be close. Also, according to the theory on vote pivotality, citizens who would have otherwise abstained on election day will vote. Hence, all hypotheses will be analysed separately for left‐leaning and right‐leaning voters as well as (likely) non‐voters.
Research design, data and operationalization
Experimental study design
We draw on a factorial survey experiment, which was carried out in Germany in July and August 2021.Footnote 12 The survey was conducted a few weeks before the German federal election on 29 September 2021. The target sample size was approximately 3000, and respondents were sampled to be nationally representative of age, gender, education and place of residence (NUTS 2). In addition, cross‐quotas on gender and age were used.Footnote 13
An experimental setup is an effective method for testing the causal effect of margins of error for several reasons. First, margins of error are seldom correctly visualized and reported in media reports, which hinders the examination of their influence in real‐world settings. Second, where these margins are implemented, they are presented in various ways. Although they are sometimes shown graphically, they are often only noted below the poll in question without further explication. Third, polls are usually accompanied by a journalistic interpretation that potentially conditions and mediates the polls' effects on citizens' voting intentions. At the very least, these factors considerably complicate the causal identification of error margins' effects on voting behaviour using observational data. Employing a survey experiment, we can manipulate the display of margins of error, the closeness of the electoral race, and the interpretation of the polling results independently from each other. This allows us to estimate the isolated and combined effects of these three dimensions on citizens' voting intentions.
The electoral context
Conducting the experiment in Germany in July and early August 2021 is advantageous for testing the discussed hypotheses for three reasons.
First, our main aim is to determine whether voters are more inclined to vote for one of the two leading political parties if exposed to margins of error in opinion polls. For most of the German electoral campaign, the centre‐left Greens and the centre‐right Christian Democratic Union/Christian Social Union (CDU/CSU) were leading in the polls. Although the centre‐left Social Democratic Party (SPD) started to gather increasing support in the polls at the end of July and eventually won the election, the Greens were the most relevant competition for the incumbent CDU/CSU for the majority of the time (Faas & Klingelhöfer, Reference Faas and Klingelhöfer2022).Footnote 14 Following successful performances in the state elections of Rhineland‐Palatinate and Baden‐Württemberg in March 2021, the Greens managed to rank first in many opinion polls in April. Since July, the polls demonstrated substantial variation regarding which party had the most support among voters. For instance, a poll published by the public opinion polling institute Forschungsgruppe Wahlen on July 30, one day after the beginning of the experiment's fieldwork period, indicated a seven‐point lead for the CDU/CSU. About two weeks later (August 4), the institute Kantar published a poll in which the CDU/CSU had a lead of only two percentage points over the Greens.Footnote 15 As a result, survey respondents may have been exposed to polls that either displayed the CDU/CSU being ahead or suggested a close race between the Greens and the CDU/CSU. We see this as a major advantage with regard to the external validity of our study. Instead of using fictitious parties or polling results, we can test the proposed hypotheses in a real‐world setting.
Second, we focus on strategic votes in favour of one of the two leading parties. We want to ensure that other incentives of strategic voting are as constant as possible. At the time of the survey, no post‐election government coalition had been officially favoured by the competing parties. Government constellations ranging from a centre‐right coalition (CDU/CSU and the Free Democratic Party) to a ‘grand coalition’ (CDU/CSU and Greens) to a leftist coalition (Greens, SPD, and the Left) had been possible and publicly discussed by the leaders of all parties (Faas & Klingelhöfer, Reference Faas and Klingelhöfer2022). The decision on which coalition would be formed following the election thus hinged primarily on which political party won the most seats in parliament. As a consequence, incentives for policy balancing were low. Furthermore, none of the smaller parties were expected to fall below the 5 per cent electoral threshold at the time of the experiment's fieldwork period.Footnote 16 Alternative forms of strategic voting, such as avoiding wasted votes or threshold insurance voting, likely played a small role in voters' calculi. All in all, the campaign context in which the survey experiment was conducted should have motivated voters to focus on which political party would become the strongest in the election.
Third, numerous polls were conducted in the run‐up to the 2021 parliamentary election in which the uncertainty surrounding polling estimates was differently communicated. To systematically examine this variation, we collected all media reports on polling estimates in a 3‐month period before the general election on 26 September 2021. We focused on 10 nationally relevant online and print sources.Footnote 17 Based on this collection, we manually coded whether the corresponding reports showed or discussed a poll, whether margins of errors were mentioned, and whether the margins of errors were directly addressed. Out of 149 reports featuring polling estimates, about 23 per cent ( $N=34$) mentioned margins of error. However, 91 per cent ( $N=31$) of these reports restricted the coverage to a small note below the graphically depicted poll or at the end of an article. Only 9 per cent ( $N=3$) directly mentioned the corresponding margins of errors in the accompanying text. Overall, although margins of errors were covered in (some) news reports, this coverage was of minor relevance in the vast majority of the reports. In this context, it is worthwhile to investigate whether and to what extent a more detailed coverage would have possibly mattered for citizens' vote decisions.
Procedure
Treatments
We used a 2 $\times$ 2 $\times$ 2 full‐factorial design with eight experimental groups.Footnote 18 Each experimental group was exposed to a vignette featuring a polling result that varied along three dimensions: the display of margins of error, the gap in the polling estimates between the two major parties and the interpretation of the poll. To maximize the external validity of the study, respondents were informed that the poll was conducted by a reputable German polling institute and that it would be published the next day.Footnote 19

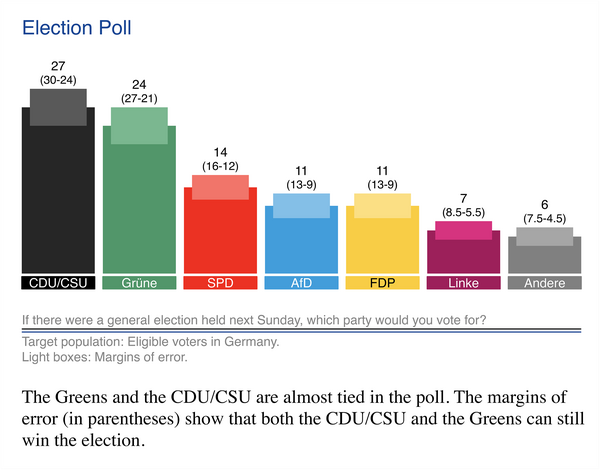
Figure 3. Example Vignette (1: M[ $+$], R[ $+$], I[ $+$]), translation. [Colour figure can be viewed at wileyonlinelibrary.com]
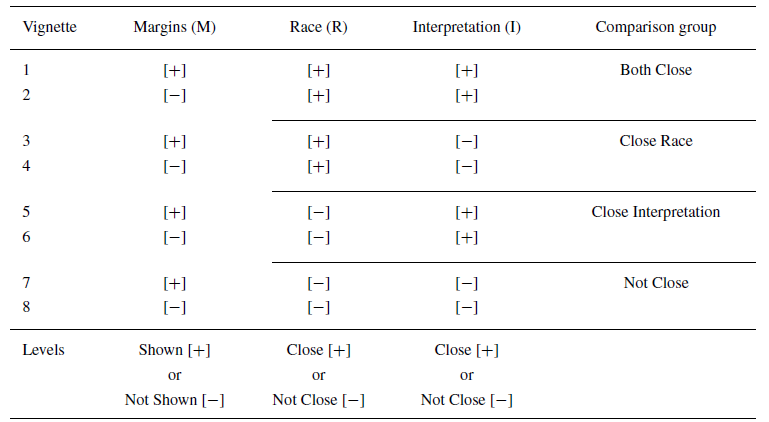
Figure 3 displays one of the eight vignettes. Table 1 features an overview of all manipulated treatment conditions. The vignette consisted of three components: (1) Depending on the margin (M) condition, margins of error were shown [ $+$] or not shown [−]. The margins were displayed graphically and mentioned in numbers above the bars. (2) The graph displayed the opinion‐poll results, which indicated either a small (3 pp, close [ $+$]) or large (8 pp, not close [−]) difference between the two leading parties depending on the race (R) condition. To avoid any further additional strategic voting incentives, the polling estimates of all other political parties were kept constant. (3) Two sentences were shown below the poll. The statement's first sentence varied depending on the interpretation (I) condition.Footnote 20 A ‘close‐interpretation’ [ $+$] stated that ‘The Greens and the CDU/CSU are almost tied in the poll’, whereas the ‘not‐close‐interpretation’ [−] stated that ‘the CDU/CSU is clearly ahead in the poll’. The second sentence of the statement provided additional interpretive guidance regarding the CDU/CSU lead. If the margins were displayed in the vignette, they were also mentioned and discussed in this second sentence. Section A3 in the online Appendix shows all vignettes used in the experiment.21
Table 1. Overview of experimental groups.

German voters are generally not accustomed to margins of error in polls, as they are seldom visually displayed in media reports. This is why we needed to ensure that displaying the margins did not prompt increased scepticism among the respondents regarding the validity of the polling results. Section A9 in the online Appendix presents the test results on whether margins of error decreased citizens’ perceived credibility of the polls. None of the results demonstrate a statistically significant effect.
Before being exposed to the treatment, respondents were asked about their socio‐demographic and political characteristics such as citizenship, age, gender, place of residence, education and voting decision in the last German general election in 2017.Footnote 22 Then, one of the eight experimental conditions was randomly shown to the respondents.Footnote 23 Respondents were advised to take a close look at the poll and were allowed to continue with the survey after at least 15 seconds.
Dependent variables
Then, we asked the respondents to indicate their propensity to vote (PTV) for each of the six German political parties that were likely to enter the national parliament in the upcoming election.Footnote 24 The response scales ranged from 0 (very unlikely) to 10 (very likely). As our main interest lies in citizens' voting intentions for the two strongest parties, the following analyses focus on respondents' voting intentions for the Greens and the CDU/CSU.Footnote 25
We employ two dependent variables: First, we use standard PTV scores for the CDU/CSU and the Greens. These scores enable us to estimate individuals' overall proclivity to vote for either political party. However, they come with the disadvantage that increases or decreases in respondents' PTV values for single political parties are not necessarily consequential for their voting behaviour, since they do not take into account the relational character of citizens' voting propensities.Footnote 26 Accordingly, we follow previous research that used PTV scores as starting points to develop binary measures of citizens' voting intentions (Kroh et al., Reference Kroh, van der Brug, van der Eijk, van der Eijk and van der Brug2007; Marsh, Reference Marsh, Garry, Hardiman and Payne2006; van der Eijk & Oppenhuis, Reference van der Eijk and Oppenhuis1991). For our second dependent variable, we define those respondents as likely voters for whom the difference between their first party preference (i.e., the party with the highest PTV score) and their second preference is at least one.Footnote 27
For instance, if a respondent has a PTV score of eight for the Greens and of seven or less for the second‐most preferred party, they are coded as having a vote intention for the Greens. This coding thus does not consider respondents with tied preferences for two or more political parties (but see Figures 6 and 7). In doing so, we can examine the extent to which citizens' voting intentions skew in favour of certain parties (the CDU/CSU or the Greens) in response to the different treatments. To ease comparability between our two dependent variables, we re‐scaled the PTV scores from zero to one. In the robustness checks, we also report results from a series of alternative operationalizations of the binary‐voting intention variables.Footnote 28

Figure 4. Marginal effects of displaying margins of error on vote probabilities for the CDU/CSU.
Note: Marginal effects based on three‐way interactions. Full regression results are shown in Tables A5 and A6 in the online Appendix. * p < 0.05. PTV: propensity to vote. Error bars show 90 per cent (thick lines) and 95 per cent (thin lines) confidence intervals. Labels on the y‐axis refer to the ‘comparison groups’ listed in Table 1.

Figure 5. Marginal effects of displaying margins of error on vote probabilities for the Greens.
Note: Marginal effects based on three‐way interactions. Full regression results are shown in Tables A7 and A8 in the online Appendix. * p < 0.05. PTV: propensity to vote. Error bars show 90 per cent (thick lines) and 95 per cent (thin lines) confidence intervals. Labels on the y‐axis refer to the ‘comparison groups’ listed in Table 1.

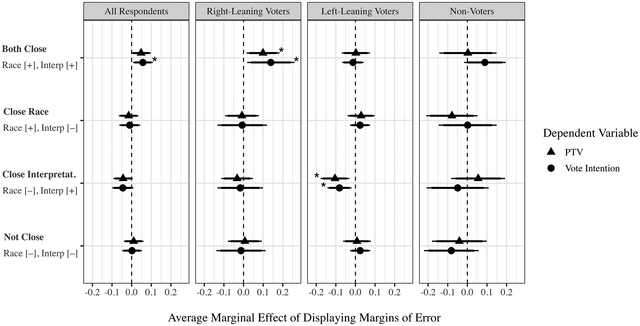
Figure 6. Marginal effects of displaying margins of error on vote intentions for the CDU/CSU.
Note: Marginal effects based on three‐way interactions. Full regression results are shown in Tables A11–Table A14 in the online Appendix. * p < 0.05. Error bars show 90 per cent (thick lines) and 95 per cent (thin lines) confidence intervals. Labels on the y‐axis refer to the ‘comparison groups’ listed in Table 1.

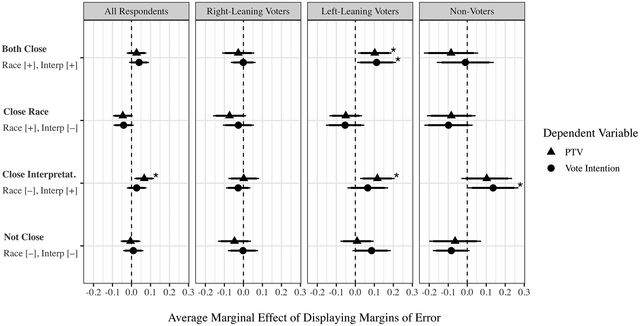
Figure 7. Marginal effects of displaying margins of error on vote intentions for the Greens.
Note: Marginal effects based on three‐way interactions. Full regression results are shown in Tables A15–A18 in the online Appendix. * p < 0.05. Error bars show 90 per cent (thick lines) and 95 per cent (thin lines) confidence intervals. Labels on the y‐axis refer to the ‘comparison groups’ listed in Table 1.
Estimation strategy
We compare conditions that differ in the margins but remain constant in the race and interpretation conditions. The comparison groups can be seen in the last column of Table 1. Depending on the race and interpretation conditions, we call the comparison groups Both Close (1 vs. 2: R[ $+$], I[ $+$]), Close Race (3 vs. 4: R[ $+$], I[−]), Close Interpretation (5 vs. 6: R[−], I[ $+$]), and Not Close (7 vs. 8: R[−], I[−]). For both dependent variables, we employ ordinary least squares regressions based on the following formula:
 $$\begin{equation} \begin{aligned} Y_i & = \beta _0 \\ & + \beta _1 M_i + \beta _2 R_i + \beta _3 I_i \\ & + \beta _4 M_i x R_i + \beta _5 M_i x I_i + \beta _6 R_i x I_i \\ & + \beta _7 M_i x R_i x I_i + \epsilon _i \text{,} \end{aligned} \end{equation}$$
where $i$ denotes the respondents and $Y$ one of the four outcome variables, the PTVs and vote intentions for the CDU/CSU and the Greens. For the binary vote intention variables, we employ linear probability models with heteroskedasticity‐robust standard errors.Footnote 29 $M$,
$M$, $R$ and $I$ are binary variables, describing the three treatment dimensions. To investigate the impact of showing margins of error, we introduce a three‐way interaction between these three variables and focus on the average marginal effect of displaying margins conditional on the race and the interpretation condition.
To be in line with Hypothesis 1, the results should indicate a positive effect for all four comparison groups (Both Close; Close Race; Close Interpretation; and Not Close). If, however, the effect of the margins is determined by how closely the electoral race is contested (Hypothesis 2), only the comparison groups Both Close and Close Race should show a positive effect. Positive effects for the comparison groups Both Close and Close Interpretation would indicate support for Hypothesis 3 because the effect of the margins is conditional on a corresponding interpretation. Finally, Hypothesis 4 is supported if only the comparison group Both Close shows an impact, as the effect of margins of error is conditional on both how contested the electoral race is and a corresponding interpretation.
To inspect variation across different voter groups, we rely on respondents' vote choices in the 2017 German general electionFootnote 30 and split the survey sample into three groups. Right‐leaning voters are those respondents who voted for the CDU/CSU or the FDP in the last general election in the proportional and/or the majoritarian component of the German electoral system (n = 993).Footnote 31 Left‐leaning respondents are those who have voted for the SPD, the Greens or The Left in the past (n = 1201). Lastly, the theory of vote pivotality suggests that non‐voters are mobilized if electoral races are closely contested. Consequently, a third group we examine consists of respondents who did not vote in the 2017 general election (n = 391).
Empirical results
Recall that our primary interest is whether the same opinion poll changes citizens' voting intentions depending on whether margins of error are displayed. The results for our core models are shown in Figure 4 for the CDU/CSU and in Figure 5 for the Greens. To ease the interpretation of the interaction terms, we show the effects of displaying margins of error moderated by the two other treatment conditions (i.e., whether the race is highly contested and whether an interpretation underlines the openness of the race). In the left panels, we display the effect for all respondents, along with separate effects for right‐leaning voters, left‐leaning voters and (likely) non‐voters.
Figure 4 indicates that margins of errors can positively influence inclinations to vote for the CDU/CSU (first row, ‘Both Close'). More concretely, these effects refer to vignettes where the lead of the CDU/CSU was three percentage points and the corresponding interpretation underlined the openness of the race (see also Figure 3). Adding margins of error in this constellation increased right‐leaning respondents’ vote intentions for the CDU/CSU. Concerning the PTV scores, the values increased by 0.1 unit on the response scale (range: 0–1). In the case of the binary vote intention variable, statistically significant treatment effects are shown for all respondents (effect size: $0.06$) and – in line with our theoretical expectations – for right‐leaning voters ( $0.14$). Showing margins of error thus drives right‐leaning respondents to vote for the major right‐wing party contesting the election.
We do not find that any treatment has a mobilizing effect on likely non‐voters. The results consistently fail to reach standard levels of statistical significance. In addition, the effect sizes are close to zero or indicate different directions depending on which outcome variable is examined.
Notably, the model results also show a negative treatment effect for left‐leaning voters in the Close Interpretation group (row 3). Here, respondents were exposed to polling results that showed the leading CDU/CSU ahead by eight percentage points while the corresponding interpretation indicated that the race was still contested. This suggests that margins of error may also have demobilized voters who would have voted for the CDU/CSU because they felt that the Greens could still catch up until election day despite the large gap with the leading party.
Regarding the Greens, the findings paint a similar picture. Figure 5 displays a positive treatment effect in the Both Close group (row 1) for left‐leaning respondents. When margins of error were considered, voting intentions for the Greens increased by roughly 0.1 units for the PTV scores and by 0.11 units for the binary voting intention variable. The effect sizes are thus similar to those discussed regarding right‐leaning voters and the CDU/CSU. These results provide consistent evidence that margins of error increase voting intentions for the two leading parties if the race and the interpretation are Both Close (H4).
In addition, Figure 5 also demonstrates positive treatment effects for the Close Interpretation group (row 3). Here, respondents were exposed to a poll showing an eight‐percentage point lead of the CDU/CSU together with the (counter‐intuitive) statement suggesting that both parties were almost tied as – according to the margins of error – the lead could be as small as two percentage points (see Section A3 in the online Appendix).Footnote 32 Such an effect would support the hypothesis that the impact of margins of error is predominantly dependent on an interpretation underscoring the closeness of the electoral race (H3). However, the findings remain inconclusive; they are not consistently statistically significant across the different model specifications. In the case of the PTV models, the estimates are significant at the 0.05 level for the model including all respondents and the one restricted to left‐leaning voters. These treatment effects do not translate into increased vote intentions according to the binary outcome variable. Instead, we find a positive and significant effect for former non‐voters. Again, this effect is not robust to alternative model specifications (see Figure 7). We thus have limited, non‐robust evidence that the effect of margins of error is predominantly conditional on the interpretative framework presented together with opinion polls.Footnote 33
Overall, these findings are in line with our theoretical expectations of voters' strategic choices in close races. Margins of error matter for citizens' voting intentions if the election outcome is uncertain. This is especially true if (a) the polling gap between the two strongest parties is small and (b) voters are provided with interpretative guidance that emphasizes the openness of the election outcome. In this scenario, displaying margins of error prompts right‐leaning voters to vote for the CDU/CSU and left‐leaning voters to vote for the Greens. These effects are also substantial in size. For instance, for both the CDU/CSU and the Greens, voting intentions increased by more than $\hskip.001pt 10$ percentage points in the case of the binary vote intention variable.
Robustness checks
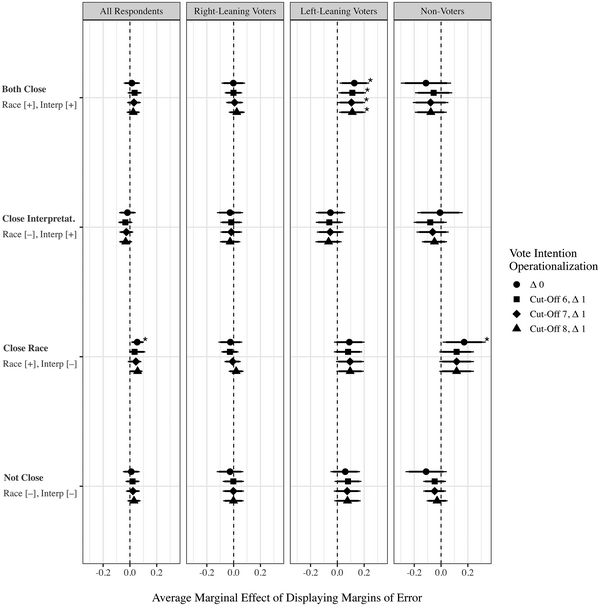
Figures 6 and 7 display results for four alternative methods for constructing binary variables of respondents' inclinations to vote for either of the two parties. The main specification classified respondents with a difference of at least $\hskip.001pt 1$ point between their first and second party preference as likely voters (excluding ties). In a first alternative specification, we also included respondents who had first and second highest PTVs that were identical (circles). The number of respondents with vote intentions for the CDU/CSU increases from $\hskip.001pt 535$ to $\hskip.001pt 927$ and from $\hskip.001pt 555$ to $\hskip.001pt 852$ for the Greens. Second, we introduced a cutoff point and only considered respondents as likely voters whose most preferred party scored six (squares), seven (diamonds), eight (triangles) or higher on the PTV scales (again with a difference of at least $\hskip.001pt 1$ point). The treatment effect of the Both Close comparison group remains statistically significant and positive for right‐leaning respondents and the CDU/CSU as well as left‐leaning respondents and the Greens.
As a further robustness check, we examined whether the identified treatment effects are driven by likely non‐voters. If only respondents with a low probability of voting responded to the treatment, we must be hesitant to conclude that margins of error matter for actual voting choices and election outcomes. Our data set includes a question on how likely respondents thought it was that they would vote in the upcoming election. We excluded all respondents who indicated that they were very likely or certain not to vote.Footnote 34 Section A7.2 in the online Appendix presents the corresponding results, which confirm the conclusions discussed earlier.
Sections A7.3 and A7.4 in the online Appendix report model results of logistic and weighted least squares regressions for the binary outcome variable. In Section A7.5 in the online Appendix, we show results of models in which we controlled for relevant pre‐treatment variables (i.e., socio‐demographics, political interest and interview duration). Furthermore, the online Appendix reports results if the classification of left‐ and right‐leaning respondents is only based on voting choices in the proportional component (Section A7.6 in the online Appendix).Footnote 35 We also inspected the robustness of the results when excluding respondents for whom the survey institute could not report the duration of the interview (see Section A7.7 in the online Appendix). Potentially, these voters experienced technical problems while answering the survey; the treatment might not have been effective in this case. These alternative models give results similar to those presented above.
Conclusion
Despite the widely held belief that displaying margins of error is essential for communicating opinion‐poll results to the public, the consequences of such a decision remain largely untheorized and unexplored. Scepticism exists as to whether voters can understand the concept of margins of error and make sense of this additional methodological information (Bhatti & Pedersen, Reference Bhatti and Pedersen2016; Lordan, Reference Lordan1993; Wichmann, Reference Wichmann2010). This study is the first to provide evidence on whether and when margins of error in opinion polls influence citizens' voting decisions.
We theorized that margins of error can increase the perceived openness of an electoral race from the perspective of voters. The experimental results provide evidence that these margins cause citizens to vote for one of the parties leading in the polls. This effect is dependent on two conditions: the actual closeness between the major parties and the existence of an interpretative framework that emphasizes the openness of the race. In our study, margins of error increased right‐leaning citizens' inclination to vote for the main centre‐right party and left‐leaning respondents' propensity to vote for the largest centre‐left party.
We also found weak support for the idea that the interpretative guidance accompanying polling estimates (and their margins of error) might be the more important conditioning factor for citizens' voting choices. However, this effect is not robust across different model specifications and is likely limited to voters of the party trailing in the polls. These inconsistent results could be partially due to a lack of statistical power in the regression models. Accordingly, future research can further examine the influence of media framing of polling estimates on citizens' voting choices.
This study contributes to broader debates on the ‘power of polls’ (Roy et al., Reference Roy, Singh and Fournier2021) in representative democracies. Our findings illustrate that polls, which have increased substantially in recent years, can become crucial for election outcomes (see, e.g., Duffy & Tavits, Reference Duffy and Tavits2008; Levine & Palfrey, Reference Levine and Palfrey2007; Westwood et al., Reference Westwood, Messing and Lelkes2020). In addition, our findings pave various paths for future research.
First, we focused on whether margins of error impact voting decisions in favour of the major parties contesting an election. It remains to be studied to what extent the display of polls' error margins can also affect the electoral fortunes of smaller parties. For instance, voters could opt for or against political parties on the borderline of parliamentary representation (Cox, Reference Cox, Herron, Pekkanen and Shugart2018; Fredén, Reference Fredén2014). Additionally, much recent scholarship has demonstrated that voters engage with more complex vote choices beyond strategic sequencing, such as policy balancing (Gschwend & Meffert, Reference Gschwend, Meffert, Arzheimer, Evans and Lewis‐Beck2017; Kedar, Reference Kedar2005). In this context, Bowler et al. (Reference Bowler, Mcelroy and Müller2022) show that citizens' capability to predict future coalition governments correlates with the corresponding ‘information environment’, that is, polling estimates and pre‐electoral coalition signals in the media. Such considerations, in turn, can influence citizens' strategic calculi when casting their vote (e.g., Bahnsen et al., Reference Bahnsen, Gschwend and Stoetzer2020; Gschwend et al., Reference Gschwend, Meffert and Stoetzer2017). In this regard, it remains to be further examined how voters' decision calculi are affected when margins of error are provided. Additionally, previous research has found that political parties' coalition inclusion probabilities, determined in part by public opinion polls, shape policy outputs (Kayser et al., Reference Kayser, Orlowski and Rehmert2023). Hence, it is worthwhile to further examine whether and how margins of error can influence not only citizens' vote choices but also parties' government actions.
Second, this study focuses on electoral competition in a single country employing a mixed electoral system. Based on the literature on contested races (e.g., Duffy & Tavits, Reference Duffy and Tavits2008; Levine & Palfrey, Reference Levine and Palfrey2007; Westwood et al., Reference Westwood, Messing and Lelkes2020), we cannot think of strong reasons to assume that our results could not be generalized to other countries employing purely proportional or majoritarian electoral rules. On the contrary, the long research tradition on close races in majoritarian electoral systems – such as the United States, the United Kingdom or Canada – suggests that voters should have even greater incentives to focus on which party will be the strongest in an upcoming election. Nevertheless, our results need to be replicated in other countries to allow robust conclusions to be drawn about the effect of margins of error in opinion polls. The case under study also underlines the need to inspect error margins' effects in electoral races with more than two main competitors. In the 2021 German general election, the SPD ultimately won the election despite the Greens and the CDU/CSU being the electorally strongest forces for most of the election campaign.
Third, we developed an experiment with the goal of maximizing the external validity of the results. As such, we designed vignettes that depict (as close as possible) the layout and results of public opinion polls discussed in the German media. Furthermore, this is one of the first studies to investigate the conditional influence of interpretations on opinion polls. Our findings challenge the idea that interpretation and framing effects are negligible and, at best, have minor implications for individuals' political behaviour. We found that journalists and their work can be decisive by guiding their audiences through an interpretation of poll results (see also van der Meer et al., Reference van der Meer, Hakhverdian and Aaldering2016). Merely mentioning that the projected winning margins of leading parties are within the margin of error can affect voters' responses to poll results. Accordingly, pollsters and public opinion experts should intensify their efforts to communicate the methodological details of opinion polls as transparently as possible (Beckers, Reference Beckers2021). In this regard, reporting margins of error can also be an efficient way of reducing horserace coverage and media attention to outlier polls.
Finally, our findings contribute to broader debates about how scientific research results are best communicated to the public (Podkul et al., Reference Podkul, Vittert, Tranter and Alduncin2020). For instance, Daoust and Bastien (Reference Daoust and Bastien2021) studied the impact of incorporating confidence intervals in predicting mortality rates in the context of the COVID‐19 pandemic and found no effect on citizens' policy preferences. Westwood et al. (Reference Westwood, Messing and Lelkes2020) examined the impact of meta‐analytic forecasts of opinion polls in the United States; they found voters to be confused and less likely to vote. Our study continues this ongoing debate by indicating that margins of error can have a meaningful impact on how citizens perceive political phenomena. We found no indication that providing technical details about scientific research results overwhelms or even confuses the public, especially when guiding them with an appropriate interpretation. These results underline the importance of clearly communicating polling estimates' uncertainty to voters. Although media reports often still lack a transparent graphic depiction and accurate interpretation of margins of error, academically led poll‐tracking projects increasingly provide information on confidence, credible or prediction intervals.Footnote 36 Against this backdrop, establishing new and expanding existing collaboration between academic pundits and news outlets constitutes a promising path for communicating polling estimates to the public; especially in the run‐up to elections. In this regard, it might also be worthwhile to further investigate how margins of error can be best presented visually to make them easily accessible to voters (see, e.g., Stoetzer et al., Reference Stoetzer, Neunhoeffer, Gschwend, Munzert and Sternberg2019, for the usage of 83 per cent credible intervals).
We expect the relevance of opinion polls in elections to increase in the future and that debates on how to best communicate polling results will prevail. This study offers a step toward a better understanding of how and when voters respond to a transparent display of the uncertainty surrounding polling estimates.
Acknowledgements
We thank Ruth Dassonneville, Robert Huber, Lena Maria Huber, Carolina Plescia, Markus Wagner, the participants of the panel ‘Public Opinion, Mobilization and Participation’ at the 2022 EPSA Annual Conference, the participants of the 2022 meeting of the Working Group ‘Elections and Political Attitudes’ of the German Political Science Association, and the three anonymous reviewers for providing valuable feedback on earlier versions of the manuscript. We thank Thomas Meyer for supporting this project from the very beginning. Nadescha Bachayov, Sarah Magdihs, Klara Pernsteiner, and Timo Rathke provided excellent research assistance. Christina Gahn thanks the Faculty of Social Sciences at the University of Vienna for financial support in preparing the final manuscript. This project was funded by the Deutsche Forschungsgemeinschaft (DFG, German Research Foundation); Grant Number: 50729055.
Open access funding enabled and organized by Projekt DEAL.
Online Appendix
Additional supporting information may be found in the Online Appendix section at the end of the article:
Appendix A1: Comparative Polling Data
Appendix A2: Content Analysis of German Media Articles
Appendix A3: Vignettes
Appendix A4: Balance Checks
Appendix A5: Full Regression Tables of Main Analyses
Appendix A6: Deviations from the Preregistration
Appendix A7: Robustness Checks
Appendix A8: Polling Dynamics during Fieldwork Period
Appendix A9: Credibility as Dependent Variable
Appendix A10: Excluding AfD Voters
Appendix A11: Further Subgroup Effects
Appendix A12: Closeness Perceptions
Appendix A13: References


 +
+ +
+ +
+


 Open access