
6.1 Introduction
The contemporary automotive industry is typified by vertically integrated production networks organized by large lead assembly firms, in which the majority of components production is outsourced to independent suppliers (Reference Sturgeon, Van Biesebroeck and GereffiSturgeon et al., 2008). Component suppliers are hierarchically organized into supplier tiers that differ by the complexity of manufactured components and also by other firm-level characteristics, such as firm size and the corporate power they wield in production networks (Reference Humphrey and MemedovicHumphrey and Memedovic, 2003; Reference Sturgeon, Lester, Yusuf, Altaf and NabeshimaSturgeon and Lester, 2004; Reference Pavlínek and JanákPavlínek and Janák, 2007).
This chapter investigates how these distinct tiers of automotive firms contribute to value creation and value capture in the automotive industry by seeking answers to four questions. First, whether higher-tier firms create and capture higher value than lower-tier firms; second, whether higher-tier firms possess stronger and more diverse competencies than lower-tier firms; third, whether higher-tier firms import a higher or lower share of inputs from abroad than lower-tier firms; and fourth, whether domestic firms import lower shares of inputs than foreign-owned (henceforth foreign) firms (Reference Frigant and LungFrigant and Lung, 2002; Reference Humphrey and MemedovicHumphrey and Memedovic, 2003; Reference Maxton and WormaldMaxton and Wormald, 2004; Reference Gereffi, Humphrey and SturgeonGereffi et al., 2005; Reference Pavlínek and JanákPavlínek and Janák, 2007; Reference MudambiMudambi, 2008; Reference Sturgeon, Van Biesebroeck and GereffiSturgeon et al., 2008; Reference PavlínekPavlínek, 2015a; Reference Pavlínek and ŽížalováPavlínek and Žížalová, 2016).
These relationships between the firm’s position in GPNs and its prospects for value creation and capture are explored in the context of the Czech automotive industry, which represents a typical example of the integrated periphery in the European automotive industry. As we could see in Chapters 3 and 4 of this book, these are peripheral automotive industry regions that have been integrated into core-based macro-regional automotive industry production networks through large inflows of FDI by foreign TNCs. Automotive TNCs seek to benefit there from low production costs, investment incentives and the advantages of regional economic blocs. The peripheral position of the Czech automotive industry in the European automotive industry is typified by its foreign control (see Table 5.7 in Chapter 5), with foreign firms accounting for 85.6 percent of employment, 95.5 percent of value added, 95.5 percent of production, 95.4 percent of turnover and 95.1 percent of gross investment in 2019 (Eurostat, 2022b; 2023c). It is also reflected by the limited presence of corporate headquarters and strategic higher-value-added functions, such as R&D (see Chapter 5 of this book) (Reference Pavlínek and ŽenkaPavlínek and Ženka, 2011; Reference PavlínekPavlínek, 2012).
The goal of this chapter is to develop an approach to measure value creation and capture in regional production networks based on firm-level indicators. Value creation is defined as firm-level activities that increase the value of final goods or services compared to the value of raw materials, intermediate goods, services and other expenses employed for their production. Value creation is measured at the firm level by value added in production and labor productivity. Value capture refers to the amount (or share) of created value that is retained by firms or subsidiaries that originally created it and that has not been transferred outside the host region of those firms or subsidiaries. As such, it is composed of two basic components: value captured by firms that created it and value that “leaks” from these firms to other subjects in the host region. Value capture is evaluated through wages, tax revenues, reinvestment and domestic sourcing. The measurements are done for different supplier tiers and for foreign and domestic suppliers in order to evaluate the contribution of different types of firms to value creation at the firm level and value capture at the firm and regional levels that will allow to assess the contribution of the automotive industry to regional economic development. The analysis confirms that higher-tier firms have greater economic effects than lower-tier firms because of the larger capital intensity of their production, higher corporate tax revenues and higher average wages per worker. However, lower-tier firms have larger direct employment and wage effects per unit of production.
This chapter begins with a brief discussion of value creation and capture in the contemporary economy. Second, I develop a firm-level approach to evaluate value creation and value capture in the context of the automotive industry. Third, I present five hypotheses about the distinct tiers of the automotive value chain that guide our empirical analysis of the Czech automotive industry. Fourth, I analyze value creation and capture in the Czech automotive industry. Finally, I summarize the findings in the conclusion.
6.2 Value Creation, Value Capture and Uneven Economic Development
The international spatial division of labor has been increasingly influenced by the investment activities of TNCs and their abilities to “slice up” the value chain and relocate its different functions to the potentially most profitable locations (Reference Gereffi, Smelser and SwedbergGereffi, 2005; Reference DickenDicken, 2015). Economic geographers, among others, have been attempting to uncover where value is created and captured within GPNs in order to understand how GPNs contribute to economic development of particular countries and regions (Reference Smith, Rainnie and DunfordSmith et al., 2002; Reference Coe, Hess, Yeung, Dicken and HendersonCoe et al., 2004) and how flows and transfers of value contribute to uneven development (Reference Hudson, Pike, Rodriguez-Pose and TomaneyHudson, 2011). It has been argued that in the contemporary economy the greatest value creation and capture come from the production of intangible goods rather than from the production of tangible goods and standardized services. Both upstream and downstream knowledge-intensive activities along the value chain, such as R&D on one side and brand management, marketing, advertising, distribution and after-sales service on the other side, create and capture significantly greater value than manufacturing operations (Reference MudambiMudambi, 2008). Lead firms typically control the production of intangible goods and thus secure higher profits through creating high entry barriers into these activities (Reference Shin, Kraemer and DedrickShin et al., 2013). Empirical evidence was found in the electronics industry that brand owners, which are almost invariably large core-based TNCs, capture the majority of value that is created along a particular value chain, while firms that manufacture final products capture a much lower share (Reference Shin, Kraemer and DedrickShin et al., 2012).
The automotive industry represents an example of increasingly complex transnational production networks and value chains (Reference Sturgeon, Van Biesebroeck and GereffiSturgeon et al., 2008). While it differs from the electronics industry in that lead (assembly) firms have not outsourced the final vehicle assembly to subcontractors or contract manufacturers, external suppliers have increased their share of the total value of finished vehicles to 75–80 percent (Reference FrigantFrigant, 2011a). This does not mean, however, that external suppliers also capture the same share of the created value in the value chain. Lead firms along with leading component suppliers have been increasingly shifting production to lower-cost “emerging” economies while maintaining crucial knowledge-intensive and high-value-added activities in their home countries (Reference Sturgeon, Van Biesebroeck and GereffiSturgeon et al., 2008; Reference Sturgeon and Van BiesebroeckSturgeon and Van Biesebroeck, 2011; Reference PavlínekPavlínek, 2012). Since automotive production networks are no longer predominantly organized at the national scale (Reference Hudson and SchampHudson and Schamp, 1995b; Reference DickenDicken, 2015), the international flows of value within the automotive industry have increased rapidly in the form of trade, FDI and profit-shifting strategies.
The spatial distribution of economic activities with different value creation and capture potential has important regional development implications. Economic geographers and economists have demonstrated that higher-value-added knowledge-intensive activities and corporate control functions tend to concentrate in more developed core regions while lower-value-added production activities tend to concentrate in less developed peripheral regions (Reference Hymer and BhagwatiHymer, 1972; Reference MasseyMassey, 1979; Reference DickenDicken, 2015). This spatial division of labor is closely related to the patterns of corporate ownership and control (Reference FirnFirn, 1975; Reference DickenDicken, 1976; Reference Schackmann-FallisSchackmann-Fallis, 1989). In the context of manufacturing, it means that peripheral externally controlled branch plants typically specialize in the high-volume manufacturing while having very limited nonproduction functions. Such truncated branch plants have limited regional development benefits for their host regions and, in the long run, might contribute to technological underdevelopment of host economies (Reference BrittonBritton, 1980; Reference HayterHayter, 1982). In the automotive industry, this continues to be the case despite its reorganization of production and supplier relations in the 1980s and 1990s (Reference SheardSheard, 1983; Reference Womack, Jones and RoosWomack et al., 1990), which allowed some peripheral branch plants to acquire nonproduction functions and upgrade into “performance/networked branch plants” (Reference PhelpsPhelps, 1993a; Reference Amin, Bradley, Howells, Tomaney and GentleAmin et al., 1994; Reference PikePike, 1998; Reference Dawley, Pike, Rodríguez-Pose and TomaneyDawley, 2011). Although branch plants and firms based in peripheral regions might develop various competencies over time (Reference PhelpsPhelps, 1993a), functional upgrading resulting in a significantly improved position of such firms in the automotive industry value chain has been extremely difficult to achieve (Reference Pavlínek and ŽenkaPavlínek and Ženka, 2011; Reference Pavlínek and ŽížalováPavlínek and Žížalová, 2016).Footnote 1 Therefore, especially domestic automotive suppliers based in peripheral regions and less developed countries have been increasingly relegated to the bottom of the supplier hierarchy, which translates in the production of simple, low-value-added, standardized and slow-changing components (Reference KaplinskyBarnes and Kaplinsky, 2000; Reference Humphrey, Lecler and SalernoHumphrey et al., 2000; Reference HumphreyHumphrey, 2003). Overall, the prevailing spatial division of labor in the automotive industry suggests that less developed peripheral regions, both at the national and international scale, are typified by lower value creation within GVCs and GPNs than more developed core regions. Furthermore, external control contributes to a potential value transfer from peripheral branch plants to corporate headquarters in the form of various profit-shifting strategies, including profit remittances and transfer pricing (Reference Dischinger, Knoll and RiedelDischinger et al., 2014a; Reference Dischinger, Knoll and Riedel2014b).
6.3 Value Creation and Value Capture in Global Production Networks
The precise measuring of value creation and capture in GPNs has proven to be extremely difficult because it requires access to the internal accounting data of individual firms, such as invoice-level internal data (Reference Seppälä, Kenney and Ali-YrkkoSeppälä et al., 2014). Firms are generally unwilling to provide this information and even if they do, this level of detail would likely limit the analysis to a single product produced by a single TNC. Because of the unavailability of precise data, analyses of value creation and capture in GPNs of particular products in electronic industries, such as Apple’s iPods, notebook computers and smartphones, had to rely on rough estimates (Reference Dedrick, Kraemer and LindenDedrick et al., 2010; Reference Dedrick, Kraemer and Linden2011). It would be difficult to apply these approaches in the context of complex production networks with thousands of suppliers, such as the automotive industry, unless we focus on only a few of the most important suppliers. Alternatively, econometric methods have been used to measure value capture at the national level using firm-level financial data in the electronic industry (Reference Shin, Kraemer and DedrickShin et al., 2013). This chapter develops an alternative way to measure value creation and capture in regional production networks based on firm-level indicators.
In the GPN perspective, created value refers to various forms of economic rent (Reference Coe, Hess, Yeung, Dicken and HendersonCoe et al., 2004), which is conceptualized as the super-profit of an entrepreneur who is able to exploit either resources of above-average productivity or ubiquitous resources more effectively than his or her competitors (Reference KaplinskyKaplinsky, 1998), while preventing them from exploiting these resources by creating high barriers of entry (Reference Kaplinsky and MorrisKaplinsky and Morris, 2008). Profits therefore represent a plausible way to measure value creation (Reference KaplinskyKaplinsky, 2000; Reference Henderson, Dicken, Hess, Coe and YeungHenderson et al., 2002; Reference Coe, Hess, Yeung, Dicken and HendersonCoe et al., 2004).Footnote 2 However, profits are highly volatile as they are affected by various investment projects, corporate tax reliefs, profit repatriations, transfer pricing and other profit-shifting strategies (Reference Dischinger, Knoll and RiedelDischinger et al., 2014b). Profits can be reinvested in production in order to upgrade a firm’s or subsidiary’s production processes, which might increase its overall productivity, wages and corporate tax revenues in the long run. The (geographical) distribution of profits along the hierarchical value chain (Reference Gereffi, Humphrey and SturgeonGereffi et al., 2005) does not necessarily correspond with the distribution of value added. Through transfer pricing, TNCs can allocate the largest share of their profits to subsidiaries with simple low-value-added assembly, while subsidiaries with high-value-added production may show a negligible or even negative profitability (Reference Seppälä, Kenney and Ali-YrkkoSeppälä et al., 2014). Therefore, from the perspective of regional development, created value needs to be understood more broadly and should not be limited to profits. In addition to profits, created value is also reflected in technological and organizational innovations, effective collaboration with local suppliers, knowledge spillovers, agglomeration economies and the local presence of strategic high-value-added functions.
Different automotive firms are linked through complex supplier relationships and flows of information within automotive production networks that encourage the spatial proximity of certain automotive suppliers to assembly operations (Reference Frigant and LungFrigant and Lung, 2002; Reference LarssonLarsson, 2002). The need for proximity and the resulting savings that accrue to individual suppliers lead to their clustering around assembly plants (Reference Pavlínek and JanákPavlínek and Janák, 2007; Reference Sturgeon, Van Biesebroeck and GereffiSturgeon et al., 2008). Therefore, the value creation and capture of individual firms might be affected by the fact of whether they are located within such clusters. For the purpose of this chapter, therefore not only value created in an individual automotive firm is considered, but also value creation and capture in the network of the firm’s regional suppliers, which are induced by domestic sourcing, knowledge spillovers and other mechanisms.
Since there is no simple and established way to measure value creation, the gross value added is employed as the best available accounting indicator for quantifying the abstract and directly nonmeasurable category of created value. Gross value added includes not only pre-tax profits that are highly volatile, difficult to trace and interpret, but it also measures wages and the consumption of fixed capital. As such, it is a more complex, territorially bounded and stable indicator than profits that can be more easily interpreted. Gross value added per employee (labor productivity) is a key indicator of economic upgrading (Reference Milberg and WinklerMilberg and Winkler, 2011) in terms of productivity and profitability.
What is the difference between value added and created value? The conceptualization of value inspired by the resource-based theory (Reference PeterafPeteraf, 1993) distinguishes between the perceived use value and exchange value. The former refers to specific qualities of the product (component, material, machine, service etc.) as subjectively perceived by customers and the price he or she is prepared to pay for it (Reference Bowman and AmbrosiniBowman and Ambrosini, 2000). The latter is the actual price paid by the buyer for this perceived use value. Therefore, value creation represents the accumulation, transformation and appropriation of valuable resources (machines, materials, components, know-how, technologies, licenses, management practices etc.) that increase the perceived use value of a firm’s products. When these products are sold, perceived use value is transformed into (exchange) value added (Reference Bowman and AmbrosiniBowman and Ambrosini, 2000).
From a host region perspective, captured value is a part of value created by the resident firm or subsidiary that is retained and appropriated for host region benefits (Reference Coe, Hess, Yeung, Dicken and HendersonCoe et al., 2004). Regional captured value is composed of two parts. First is value captured for the benefits of the resident firm or subsidiary, which is the share of profits that a firm invests in its upgrading in order to maintain or increase its competitiveness (Reference SzalavetzSzalavetz, 2015). It has multiple forms, such as reinvested profits, employee skills, collaborative relationships with local suppliers, technological innovation and all other sources of economic rents that are retained by the resident firm or subsidiary and are not transferred to other regions. Second is value that “leaks” to other subjects in the host region, such as households, suppliers and universities, through various channels, including employee compensation, corporate taxes, regional sourcing or localized knowledge spillovers. Value is captured at various geographic scales. Profits reinvested into the establishment of a new plant or the expansion and upgrading of an existing plant affect the factory site at the local scale; jobs and wages affect the labor market at the regional scale through labor commute; corporate taxes are collected at the national scale; and domestic sourcing affects value capture at various scales from local to national, depending on the sourcing patterns of individual firms. Therefore, if we subtract this captured value from the total created value, we get the amount of “lost” value, which is transferred outside the region through various mechanisms, such as profit repatriation, transfer pricing and the transfer of a subsidiary’s perceived used value and its commercialization by the parent company (Reference Barrientos, Gereffi and RossiBarrientos et al., 2011; Reference Pavlínek and ŽenkaPavlínek and Ženka, 2011; Reference Milberg and WinklerMilberg and Winkler, 2011).
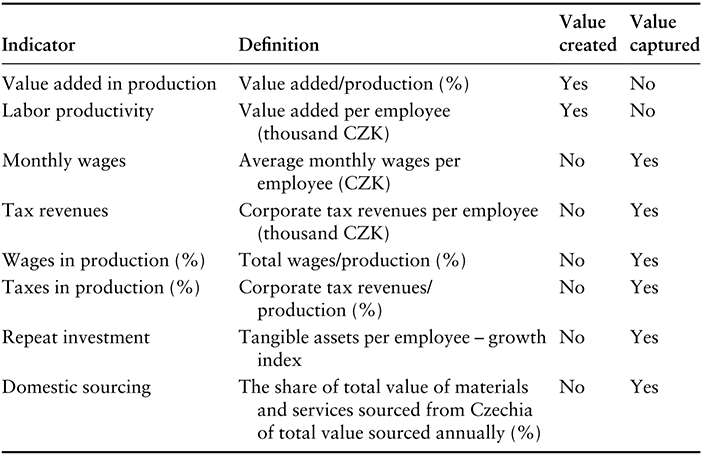
Wages, corporate tax revenues, reinvested profits and domestic sourcing are four directly measurable components of value capture that are interrelated in complex and often contradictory ways (Table 6.1). For example, rising wages might decrease a firm’s profitability and, therefore, undermine the corporate tax base and vice versa. An increase in the corporate tax rate may lead to decreasing wages in an open economy because of falling marginal labor productivity and the consequent outflow of capital to lower-tax countries (Reference FelixFelix, 2009). There is also a trade-off between corporate tax revenues and profit reinvestments into expansions and/or upgrading of individual plants that reduce the corporate tax base. At the same time, profit reinvestments, which increase capital and technology intensity of production, should lead to increases in marginal labor productivity and, therefore, wages. Profit reinvestments may also increase the embeddedness of plants in particular locations (Reference Wren and JonesWren and Jones, 2009) by fostering local linkages and developing nonproduction functions.
| Indicator | Definition | Value created | Value captured |
|---|---|---|---|
| Value added in production | Value added/production (%) | Yes | No |
| Labor productivity | Value added per employee (thousand CZK) | Yes | No |
| Monthly wages | Average monthly wages per employee (CZK) | No | Yes |
| Tax revenues | Corporate tax revenues per employee (thousand CZK) | No | Yes |
| Wages in production (%) | Total wages/production (%) | No | Yes |
| Taxes in production (%) | Corporate tax revenues/production (%) | No | Yes |
| Repeat investment | Tangible assets per employee – growth index | No | Yes |
| Domestic sourcing | The share of total value of materials and services sourced from Czechia of total value sourced annually (%) | No | Yes |
Notes: Tangible assets = financial value of land, buildings, machines and equipment.
6.3.1 Wages
A monopoly position that is derived mostly from technological or branding innovations generates an excess rent (Reference KaplinskyKaplinsky, 1998). In an integrated monopoly firm, the excess rent is likely to translate into higher wages for all workers, including unskilled workers who are employed in routine low-value-added activities (Reference Nathan and SarkarNathan and Sarkar, 2011). When routine low-value-added and easily replaceable activities are outsourced to external suppliers, there is no excess rent and wages tend to be lower for workers in supplier firms that take on outsourced activities (Reference Nathan and SarkarNathan and Sarkar, 2011). Therefore, if we were to control for size, industry and regional specifics, we would expect the corporate power and the presence or absence of strategic nonproduction functions to be key factors that influence wage levels at the firm level in the context of a particular economy. Lower-tier firms that are engaged in routine low-value-added activities with low entry barriers have generally the lowest wages and worst prospects for wage increases (Reference Ženka and PavlínekŽenka and Pavlínek, 2013).
6.3.2 Profits and Corporate Tax Revenues
Profits generated in the host economy can be reinvested or used to pay for corporate income taxes there or can be repatriated and invested abroad (UNCTAD, 2013). Reinvestment and corporate taxes contribute to value capture in the host economy while profit repatriation transfers the value abroad. The share of repatriated profits is affected by the nature of the activities conducted by foreign firms in host economies and by the position of foreign subsidiaries in the corporate hierarchy. The value is also transferred from host economies by TNCs through various profit-shifting strategies, including transfer pricing (Reference Dunning and LundanDunning and Lundan, 2008; Reference Huizinga and LaevenHuizinga and Laeven, 2008; Reference DickenDicken, 2015). Overall, approximately 60 percent of global FDI income on equity was transferred back to home countries of foreign investors in 2010 (UNCTAD, 2013). Regions that host corporate headquarters tend to capture a higher share of value than those hosting subsidiaries because corporate headquarters concentrate on the production of intangible goods. As such, they tend to be more profitable than their subsidiaries and tend to pay higher taxes (Reference MudambiMudambi, 2008; Reference Dischinger, Knoll and RiedelDischinger et al., 2014a; Reference Dischinger, Knoll and Riedel2014b). The headquarters and their geographic vicinity also benefit from high expenditures of gross profits on high-value-added functions, such as R&D and corporate support functions, including strategic planning, marketing, management and administration (Reference Dedrick, Kraemer and LindenDedrick et al., 2011; Reference PavlínekPavlínek, 2012). Overall, countries and regions benefit significantly more from hosting TNC headquarters than from hosting subsidiaries that have similar firm characteristics (Reference Dischinger, Knoll and RiedelDischinger et al., 2014a).
Reinvested profits can increase value capture in host regions in several ways. For example, the investment in a more advanced technology should translate into higher marginal labor productivity and higher wages (Reference SzalavetzSzalavetz, 2005). Repeat investments can also enhance ties of foreign-owned plants to particular regional economies and extend the survival time durations of foreign-owned plants in host regions (Reference Wren and JonesWren and Jones, 2009). In this chapter, reinvested profits are measured indirectly through the annual change in tangible assets, which includes repeated investment into buildings, machines and equipment, and also their depreciation. Tangible assets are used as a proxy measure of reinvested profits due to their spatial fixity and even though reinvested profits are only partially reflected in the annual change in tangible assets. The annual change in tangible assets represents a part of value captured in the host region, while the depreciation of tangible assets represents value that is sunk and, therefore, lost both for the region and for the firm (Reference Melachroinos and SpenceMelachroinos and Spence, 1999). In addition to tangible assets, reinvested profits may also flow into the employee training, licenses, software and other intangibles.
To the best of my knowledge, there is no coherent theoretical framework linking the position of firms within GPNs with the amount of value captured through corporate tax revenues. There is no systematic evidence that higher-tier firms are more prone to profit-shifting and tax avoidance than lower-tier firms. Therefore, I assume that the distribution of corporate tax revenues along the value chain follows the distribution of profits. Highly profitable assemblers and tier-one suppliers should pay higher taxes per employee than lower-tier firms. At the same time, I assume that foreign firms are more likely to engage in profit-shifting and tax avoidance strategies than domestic firms. The concentration of domestic firms among tier-two and tier-three suppliers should therefore translate into their higher relative corporate tax revenues as a share of total production than among higher-tier firms.
6.3.3 Domestic Sourcing
I consider the extent of domestic sourcing a measure of value capture for two basic reasons (Table 6.1). First, domestic procurement stimulates job creation among local suppliers and linkages between foreign and domestic firms that might help facilitate spillovers and knowledge transfer from foreign to domestic firms (Reference Blomström and KokkoBlomström and Kokko, 1998; UNCTAD, 2001; Reference Görg and StroblGörg and Strobl, 2005; Reference Scott-KennelScott-Kennel, 2007; Reference SantangeloSantangelo, 2009; Reference Pavlínek and ŽížalováPavlínek and Žížalová, 2016). Second, increased production by domestic suppliers improves their internal scale economies, while the spatial concentration of suppliers in the proximity of assembly plants can contribute to the development of external scale (localization) economies (Reference Frigant and LungFrigant and Lung, 2002; Reference LarssonLarsson, 2002). In the contemporary automotive industry, spatial proximity to assembly operations is especially important for module and tier-one suppliers that produce modules and components dedicated to a particular automaker and supply them sequentially just in time (Reference Frigant and LungFrigant and Lung, 2002; Reference Klier and RubensteinKlier and Rubenstein, 2008). The geographic proximity of tier-one suppliers to assembly operations decreases transportation and logistical costs, allows for the better synchronization of their production, improves the ability of tier-one suppliers to quickly react to changes in the production scheduling of assemblers, increases the reliability of just-in-time delivery and speeds up the delivery of technical assistance by tier-one suppliers to assembly firms (Reference Frigant and LungFrigant and Lung, 2002; Reference LarssonLarsson, 2002; Reference Pavlínek and JanákPavlínek and Janák, 2007). A large-volume vehicle assembly should therefore translate into a high share of preassembled modules and dedicated components being sourced by assembly firms from the host economy in which the assembly plant is located, as evidenced in Chapter 3 of this book.
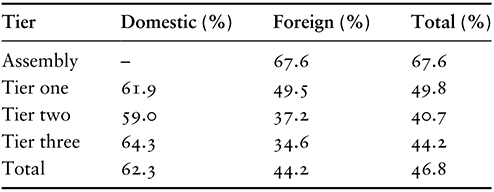
Tier-one suppliers supply preassembled highly customized modules that are often color- and model-specific in the just-in-time regime to a particular automaker. I expect tier-one suppliers to import more components from abroad than vehicle assemblers. This is because high-value-added and sophisticated components for tier-one suppliers may not be available from domestic firms and standardized, nondedicated and simple components supplied by tier-three to tier-one suppliers can be supplied from larger distances. The sourcing patterns of simple components are therefore more affected by scale economies and labor costs than geographic proximity. Tier-two suppliers should be positioned somewhere between tier-one and tier-three suppliers (see Reference Pavlínek and ŽížalováPavlínek and Žížalová, 2016). At the same time, the globalization of the supplier base (Reference Sturgeon, Lester, Yusuf, Altaf and NabeshimaSturgeon and Lester, 2004) has relegated the majority of domestic suppliers to the supply of simple, low-value-added components in less developed countries (Reference KaplinskyBarnes and Kaplinsky, 2000; Reference Lung, Humphrey, Lecler and SalernoFreyssenet and Lung, 2000; Reference Humphrey, Lecler and SalernoHumphrey et al., 2000). As a result, domestic suppliers may lack capabilities to supply certain specialized or sophisticated components or are uncompetitive because of their small scale of production, which necessitates the import of such components from abroad (Reference Crone and WattsCrone and Watts, 2003; Reference Pavlínek and ŽížalováPavlínek and Žížalová, 2016) (2009–2011 interviews).Footnote 3
However, the position of firms in GPNs has to be controlled for contingent characteristics that may affect the relationship between the tier and the extent of local sourcing, such as plant size and its age, the mode of entry of foreign firms, the firm’s nationality and its corporate sourcing strategies (Reference Barkley and McNamaraBarkley and McNamara, 1994; Reference Crone and WattsCrone and Watts, 2003; Reference Tavares and YoungTavares and Young, 2006). Larger plants tend to source domestically relatively less than smaller ones because it is often difficult to find local suppliers capable of supplying the large volumes required. In those cases when assembly firms and tier-one suppliers are significantly larger than tier-two and tier-three suppliers, the plant size may negatively affect their level of domestic sourcing. The linkages and sourcing relationships between foreign and domestic firms typically develop over time (Reference DickenDicken, 2015). Older plants and plants acquired by TNCs show a generally higher propensity to source domestically than more recently established greenfield factories (Reference Tavares and YoungTavares and Young, 2006). However, local content requirements and follow sourcing often result in high levels of local content as the outcome of the localization of foreign-owned suppliers around new greenfield assembly plants, which do not have to translate in extensive supplier linkages between foreign firms and domestic suppliers (Reference Pavlínek and ŽížalováPavlínek and Žížalová, 2016; Reference PavlínekPavlínek, 2018).
6.4 Hypotheses
Based on the discussion of the literature, I present five hypotheses about different tiers and firm ownership of the automotive value chain that will be tested on the Czech automotive industry. First, higher-tier (e.g., tier-one) firms create higher value than lower-tier (e.g., tier-three) firms and, therefore, they gradually increase their share of the total value added in the automotive industry. This is because higher-tier firms produce more complex and higher-value-added components than lower-tier firms (Reference Humphrey and MemedovicHumphrey and Memedovic, 2003; Reference Maxton and WormaldMaxton and Wormald, 2004; Reference Pavlínek and JanákPavlínek and Janák, 2007). Together with assemblers, they wield greater corporate power in automotive value chains, which they use to maintain their privileged position and to squeeze lower-tier firms (Reference RavenhillRavenhill, 2014; Reference Sturgeon, Van Biesebroeck and GereffiSturgeon et al., 2008; Reference PavlínekPavlínek, 2015a). Second, domestic suppliers import a lower share of inputs from abroad than foreign suppliers because foreign suppliers are more affected by the centralized sourcing strategies of TNCs (Reference Pavlínek and ŽížalováPavlínek and Žížalová, 2016; Reference PavlínekPavlínek, 2018). Third, higher-tier firms and assemblers import a lower share of inputs from abroad than lower-tier firms because they are forced to source greater shares of their inputs locally in order to satisfy the imperatives of modular and just-in-time production (Reference Frigant and LungFrigant and Lung, 2002; Reference Pavlínek and JanákPavlínek and Janák, 2007). Fourth, higher-tier firms possess stronger and more diverse competencies that are reflected in the presence of more nonproduction (strategic) higher-value-added functions than in lower-tier firms. Lower-tier firms produce simple components and are often captive suppliers that depend on higher-tier buyers for various nonproduction functions (Reference Gereffi, Humphrey and SturgeonGereffi et al., 2005; Reference Pavlínek and ŽížalováPavlínek and Žížalová, 2016). Fifth, higher-tier firms capture a greater share of created value than lower-tier firms because they conduct more nonproduction higher-value-added functions (Reference MudambiMudambi, 2008) and because they are able to offer higher wages than lower-tier firms in order to attract skilled labor. This is because jobs in nonproduction functions create greater value and tend to be better paid than production jobs. Furthermore, the presence of nonproduction functions increases the chances for the reinvestment of profits in a particular locality. Better-paid jobs and increased chances for reinvestment have potentially important implications for regional and national economies.
6.5 The Czech Automotive Industry
Before turning to the empirical analysis, I first need to provide a brief context of the Czech automotive industry. Since the early 1990s, the Czech automotive industry has been integrated in the European production networks through large inflows of FDI (Reference PavlínekPavlínek, 2017a). Czechia had the second-largest automotive FDI stock (€10 billion) in Eastern Europe in 2019. Large FDI inflows resulted in rapid increase in production from 197,000 vehicles in 1991 to 1.46 million in 2019 (AIA, 2022).
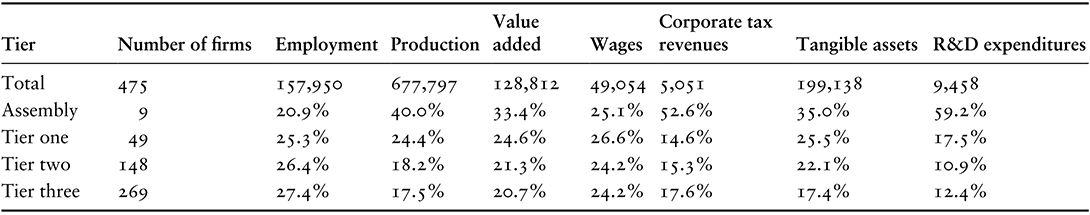
Here, I will only briefly characterize the structure of the Czech automotive industry, since I have analyzed its foreign capital-driven restructuring, growth and upgrading elsewhere (e.g., Reference PavlínekPavlínek, 2008; Reference Pavlínek2015a; Reference Pavlínek2017a). The classification of Czech-based automotive firms into assemblers and three basic supplier tiers illustrates its hierarchical structure, in which the number of firms in individual tiers increases with the decreasing tier, while the average firm size, measured by the number of workers, decreases (Tables 6.2 and 6.3). When measured by employment, assemblers are on average four times larger than tier-one suppliers, eleven times larger than tier-two suppliers and almost twenty times larger than tier-three suppliers. The data also reveal large differences between lead firms and their suppliers. On average, assemblers have a much higher capital and technological intensity of production than suppliers, which translates into higher labor productivity, high shares of overall production, value added, tangible assets and R&D expenditures of the Czech automotive industry (Table 6.2). However, there is a significant variability within individual tiers. Mean values for assemblers are distorted by Škoda Auto because it accounts for 27 percent of production, 25 percent of value added, 67 percent of R&D expenditures, 18 percent of wages and 40 percent of corporate tax revenues of the total Czech automotive industry. Overall, the difference between Škoda Auto and the rest of the Czech-based automotive industry is larger than differences between individual supplier tiers (Reference Ženka and PavlínekŽenka and Pavlínek, 2013). Škoda Auto is also unique in the context of the Czech automotive industry because it is what I call a tier-two lead firm, a firm that has many attributes of lead firms and possesses important nonproduction functions. However, strategic functions and autonomy of tier-two lead firms are limited because they are foreign-owned, which also affects their value capture by profit repatriation. The ultimate strategic functions are missing and conducted abroad by foreign owners, which is Volkswagen in the case of Škoda Auto (Reference Pavlínek and JanákPavlínek and Janák, 2007; Reference PavlínekPavlínek, 2012). Still, Škoda Auto possesses significantly more nonproduction functions and competencies than a typical foreign assembly firm, such as Hyundai at Nošovice and Toyota at Kolín (the former Toyota–Peugeot–Citroën joint venture) in the case of Czechia, because Škoda is a distinct brand within the Volkswagen group.
Table 6.2 Shares of individual supplier tiers on selected indicators of the total Czech automotive industry, 2008–2010
| Tier | Number of firms | Employment | Production | Value added | Wages | Corporate tax revenues | Tangible assets | R&D expenditures |
|---|---|---|---|---|---|---|---|---|
| Total | 475 | 157,950 | 677,797 | 128,812 | 49,054 | 5,051 | 199,138 | 9,458 |
| Assembly | 9 | 20.9% | 40.0% | 33.4% | 25.1% | 52.6% | 35.0% | 59.2% |
| Tier one | 49 | 25.3% | 24.4% | 24.6% | 26.6% | 14.6% | 25.5% | 17.5% |
| Tier two | 148 | 26.4% | 18.2% | 21.3% | 24.2% | 15.3% | 22.1% | 10.9% |
| Tier three | 269 | 27.4% | 17.5% | 20.7% | 24.2% | 17.6% | 17.4% | 12.4% |
Notes: Financial indicators in million CZK; shares are calculated as mean values for 2008, 2009 and 2010 with the exception of corporate tax revenues, which are mean values for 2008–2009, and R&D expenditures, which are mean values for 2005, 2006 and 2007.
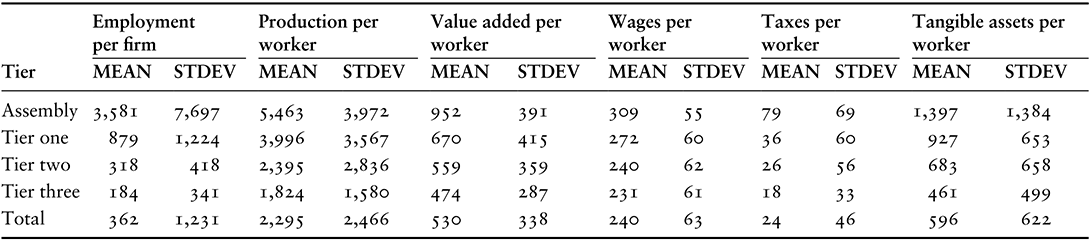
Table 6.3 Descriptive statistics for different tiers of Czech-based automotive firms (mean values for 2006, 2007 and 2008) (value creation and value capture)
| Tier | Employment per firm | Production per worker | Value added per worker | Wages per worker | Taxes per worker | Tangible assets per worker | ||||||
|---|---|---|---|---|---|---|---|---|---|---|---|---|
| MEAN | STDEV | MEAN | STDEV | MEAN | STDEV | MEAN | STDEV | MEAN | STDEV | MEAN | STDEV | |
| Assembly | 3,581 | 7,697 | 5,463 | 3,972 | 952 | 391 | 309 | 55 | 79 | 69 | 1,397 | 1,384 |
| Tier one | 879 | 1,224 | 3,996 | 3,567 | 670 | 415 | 272 | 60 | 36 | 60 | 927 | 653 |
| Tier two | 318 | 418 | 2,395 | 2,836 | 559 | 359 | 240 | 62 | 26 | 56 | 683 | 658 |
| Tier three | 184 | 341 | 1,824 | 1,580 | 474 | 287 | 231 | 61 | 18 | 33 | 461 | 499 |
| Total | 362 | 1,231 | 2,295 | 2,466 | 530 | 338 | 240 | 63 | 24 | 46 | 596 | 622 |
Notes: STDEV = standard deviation. Taxes refer to corporate tax revenues.
6.6 Value Creation and Value Capture in the Czech Automotive Industry
The analysis of value creation and value capture in the Czech automotive industry draws on a unique 2011 dataset of 475 Czech-based automotive firms with 20 or more employees that was constructed from the data provided by the Czech Statistical Office (CSO, 2011). In addition to narrowly defined automotive industry firms (NACE 29), the database includes employment and financial indicators for firms in related supplier sectors, such as iron and steel, rubber and plastic, electronics, and machinery industries, for 1998, 2002 and 2005–2011. Additional data, such as the share of automotive products in sales, sourcing patterns and high-value-added functions conducted at the firm level, were collected through a 2009 telephonic survey of 475 firms in our database, which was administered by the author and members of his research team and yielded a response rate of 34.6 percent (274 firms). Finally, the interpretation of data analysis benefited from 100 firm-level interviews with the directors and top managers of Czech-based automotive firms conducted by the author the author and members of his research team between 2009 and 2011.
Individual firms were classified into five categories according to the share of automotive products in their sales (0–24.9 percent, 25.0–49.9 percent, 50.0–74.9 percent, 75.0–99.9 percent and 100 percent). The data for every firm were then weighted by a corresponding weight (0.125, 0.375, 0.625, 0.875 and 1) in order to reduce distortions resulting from the inclusion of firms that are only partially engaged in the automotive industry. In the next step, all 475 firms were classified according to their position in the automotive value chain into lead firms (assemblers) and three supplier tiers according to the technological complexity of their components (Reference Veloso and KumarVeloso and Kumar, 2002; Reference Humphrey and MemedovicHumphrey and Memedovic, 2003; Reference Maxton and WormaldMaxton and Wormald, 2004; Reference Pavlínek and JanákPavlínek and Janák, 2007; Reference Pavlínek, Domański and GuzikPavlínek et al., 2009).Footnote 4 Tier-one suppliers supply the most complex components, such as sophisticated parts of engines (compressors, turbochargers), transmissions and brakes, and complex preassembled modules, such as dashboards, door systems or seats. Tier-three suppliers produce the least complex parts and components, such as car bodies and their parts, metal and plastic pressings, exhaust pipes, windscreen wipers and simple interior parts such as seat upholstery. Weighted data for raw materials suppliers are included among tier-three suppliers. Tier-two suppliers produce the rest, that is, medium complex parts, such as simple engine parts, lights or locks. I am aware that large suppliers, such as Bosch, supply various components that differ in terms of their sophistication. As such, these suppliers may play different roles in the value chain as tier-one, tier-two and tier-three suppliers, or as system integrators (Reference PriesPries, 1999; Reference FrigantFrigant, 2011b). In those cases, individual suppliers were classified based on the highest tier into which at least some of their components would fall since I was unable to determine what proportion of supplier activity falls under different tiers. These three levels of the complexity of components are related to their value added. Generally, I assume that the production of the most complex and sophisticated components adds more value than the production of simple parts and components.
6.6.1 Value Creation
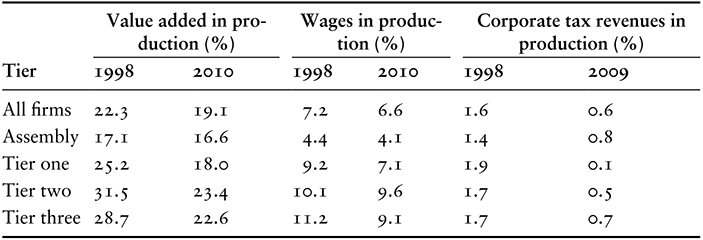
I start with testing the first hypothesis. Higher-tier firms create higher value than lower-tier firms and, therefore, they gradually increase their share of the total value added in the automotive industry. Based on the data in Tables 6.3 and 6.4, we can arrive at two important conclusions related to the position of firms in the supplier hierarchy and their value creation potential. First, higher-tier firms create a greater value per employee (show higher labor productivity) than lower-tier firms. Second, the share of value added (created value) of the total value of production is lower in higher-tier firms than in lower-tier firms (Table 6.4).
Table 6.4 Change in the share of value added (value creation), wages and corporate tax revenues (value capture) of the total value of production by supplier tier
| Tier | Value added in production (%) | Wages in production (%) | Corporate tax revenues in production (%) | |||
|---|---|---|---|---|---|---|
| 1998 | 2010 | 1998 | 2010 | 1998 | 2009 | |
| All firms | 22.3 | 19.1 | 7.2 | 6.6 | 1.6 | 0.6 |
| Assembly | 17.1 | 16.6 | 4.4 | 4.1 | 1.4 | 0.8 |
| Tier one | 25.2 | 18.0 | 9.2 | 7.1 | 1.9 | 0.1 |
| Tier two | 31.5 | 23.4 | 10.1 | 9.6 | 1.7 | 0.5 |
| Tier three | 28.7 | 22.6 | 11.2 | 9.1 | 1.7 | 0.7 |
Note: Other components of the total value of production, such as the value of purchased materials, components, energy and services, are not included in the table.
The stronger economic performance of assemblers and tier-one suppliers compared to the rest of the automotive industry supports the theoretical assumptions of GVC/GPN literature that link their “super-profits” in terms of economic rent to strategic functions and privileged position in value chains (e.g., Reference KaplinskyKaplinsky, 1998). Empirical studies have also illustrated how assemblers and the so-called megasuppliers wield their corporate power and exercise control over strategic functions within automotive production networks, which effectively discourages lower-tier suppliers from functional upgrading (e.g., Reference Rutherford and HolmesRutherford and Holmes, 2008; Reference Pavlínek and ŽenkaPavlínek and Ženka, 2011). They also squeeze lower-tier suppliers often to the brink of bankruptcy, especially during economic crises, in order to maximize their own profits (Reference Pavlínek and ŽenkaPavlínek and Ženka, 2010; Reference PavlínekPavlínek, 2015a). This was reflected in a very uneven decrease in the profitability in the Czech automotive industry during the economic crisis in 2008 as it fell on average by 19 percent for assemblers, 59 percent for tier-one suppliers, 73 percent for Tier-two suppliers and 71 percent for tier-three suppliers (Reference PavlínekPavlínek, 2015a).
6.6.2 Changes in Value Creation by Supplier Tiers
In the next step, I consider changes in the value creation indicators by individual tiers during the 1998–2010 period. My previous research on upgrading in the Czech automotive industry has identified the two prevailing trends (Reference Pavlínek and ŽenkaPavlínek and Ženka, 2011). The first one was the highly selective functional upgrading that was limited mostly to Škoda Auto and a few of the largest tier-one suppliers. It contributed to the increasing productivity and profitability gaps between assemblers and tier-one suppliers on one hand and lower-tier suppliers on the other hand. The second trend was the widespread process and product upgrading among domestic tier-two and tier-three suppliers following their integration into GPNs and the pressure to increase the efficiency and quality of their production. As a result, domestic tier-two and tier-three suppliers outpaced foreign-owned firms in the rates of growth of labor productivity.
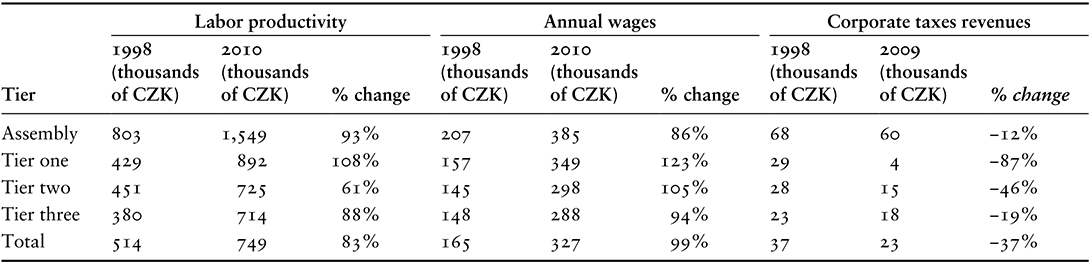
Labor productivity increased by 83 percent for the automotive industry as a whole between 1998 and 2010. It grew fastest among tier-one suppliers (by 108 percent) and assemblers (by 93 percent) (Table 6.5). The share of value added in production, which is an indicator of value creation, decreased by 14 percent for the automotive industry as whole between 1998 and 2010. The decrease was the most pronounced for tier-one and tier-two suppliers (Table 6.4). The decreasing share of value added in production does not indicate downgrading but the FDI-driven extensive growth of the Czech automotive industry between 1998 and 2010 (Reference Ženka and PavlínekŽenka and Pavlínek 2013). During this period, the number of automotive firms increased from 257 to 475, their total employment increased by 68 percent, production by 259 percent and value added by 207 percent. Tier-two suppliers grew the fastest of all automotive tiers, with their production increasing more than four times (by 414 percent) and employment more than doubling (by 138 percent). The rapid growth of tier-two suppliers between 1998 and 2010 resulted especially from the establishment of new greenfield branch plants by global suppliers in Czechia.
Table 6.5 The development of labor productivity (value creation), annual wages and corporate tax revenues per employee (value capture) by supplier tier, 1998–2009/2010
| Tier | Labor productivity | Annual wages | Corporate taxes revenues | ||||||
|---|---|---|---|---|---|---|---|---|---|
| 1998 (thousands of CZK) | 2010 (thousands of CZK) | % change | 1998 (thousands of CZK) | 2010 (thousands of CZK) | % change | 1998 (thousands of CZK) | 2009 (thousands of CZK) | % change | |
| Assembly | 803 | 1,549 | 93% | 207 | 385 | 86% | 68 | 60 | −12% |
| Tier one | 429 | 892 | 108% | 157 | 349 | 123% | 29 | 4 | −87% |
| Tier two | 451 | 725 | 61% | 145 | 298 | 105% | 28 | 15 | −46% |
| Tier three | 380 | 714 | 88% | 148 | 288 | 94% | 23 | 18 | −19% |
| Total | 514 | 749 | 83% | 165 | 327 | 99% | 37 | 23 | −37% |
Overall, the value creation in the Czech automotive industry significantly increased during the 1998–2010 period. Did this increased value creation lead to increased value capture in Czechia? I consider this question in the next section.
6.6.3 Value Capture
Domestic suppliers source a higher share of components, materials and services in Czechia than Czech-based foreign suppliers (Table 6.6), which confirms the second hypothesis. The share of domestically sourced components and materials does not significantly differ by tier among domestic firms. Among foreign firms, however, higher-tier firms source a higher share of components, materials and services in Czechia than lower-tier firms (see also Reference Pavlínek and ŽížalováPavlínek and Žížalová, 2016). This therefore confirms the third hypothesis that higher-tier firms and assemblers import a lower share of inputs from abroad than lower-tier firms only for foreign firms. The high share of domestically sourced components by foreign assembly firms and also tier-one suppliers is related to the imperatives of just-in-time production in the automotive industry (Reference SheardSheard, 1983). Tier-three suppliers, who supply standardized, simple and slow-changing components, have the lowest share of domestic sourcing. This is because these components are not typically supplied in the just-in-time regime and, as such, could be supplied over long distances from lower-cost countries, such as China and India. The second reason for the lowest share of components that are sourced from the domestic economy by tier-three suppliers is the unavailability of some parts and raw materials in Czechia, such as electronic components, admixtures for special plastics and natural rubber (Reference Pavlínek and ŽížalováPavlínek and Žížalová, 2016). The centralized procurement by TNCs strongly influences sourcing patterns of all foreign firms. Czech-based subsidiaries typically have no or very limited influence over sourcing decisions of the vast majority of components and materials they use in production (2009–2011 interviews). Overall, therefore, higher-tier foreign firms have the potential to generate greater regional economic effects than lower-tier foreign firms by sourcing more from the host economy.
Reinvested profits represent an important component of value capture in the Czech automotive industry. As of 2021, the total FDI stock in the narrowly defined Czech automotive industry (NACE 29) stood at €8 billion, of which €5.6 billion (70.8 percent) was in the form of reinvested profits. However, the 2021 figures were strongly affected by the effects of the COVID-19 pandemic. Before the pandemic, the total FDI stock was €10 billion in 2019, of which €7.3 billion (72.6 percent) was reinvested profits (Figure 6.1).
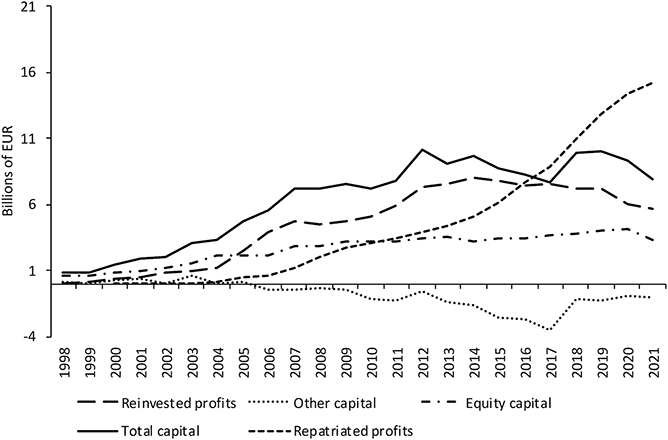
Figure 6.1 FDI stock in the automotive industry of Czechia, 1998–2021
The share of corporate taxes of the value of total production decreased from 1.6 percent to 0.6 percent between 1998 and 2009 for three basic reasons (Reference Ženka and PavlínekŽenka and Pavlínek, 2013). First, the Czech corporate tax rate decreased by 40 percent (from 35 percent to 21 percent) between 1998 and 2008. Second, Czechia introduced a generous system of investment incentives in 1998 (see Reference Pavlínek and ŽenkaPavlínek and Ženka, 2011), which provided a corporate tax relief for foreign investors. Third, the annual profit repatriation abroad in the form of dividends increased rapidly in the automotive industry of Czechia from €2.5 million in 2000 to €813 million in 2008 and €754 million in 2009 during the economic crisis. It continued to grow in the 2010s, amounting to €1.9 billion in 2019 and €1.6 billion in 2020, and declining to €809 million in 2021 (CNB, 2023).
Total repatriated profits in the form of dividends stood at €15.2 billion in 2021 (Figure 6.1), meaning that the total amount of repatriated profits exceeded the total reinvested profits by almost 2.7 times as of 2021 (CNB, 2023). In other words, of the total profits created in the Czech automotive in industry by foreign firms between 1998 and 2021 (€20.9 billion), 27 percent was captured in Czechia in the form of reinvestment, while 73 percent was transferred abroad in the form of dividends. The share of total profits generated by foreign firms in the automotive industry in Czechia during the 1998–2021 period that was transferred back to the home countries of foreign investors also significantly exceeded equity capital (by 4.6 times as of 2021). The 1998–2021 data thus suggest that the value capture in the Czech automotive industry decreased during this period despite large FDI inflows (Figure 6.1).
The share of wages of the value of total production did not change significantly between 1998 and 2010. The total value of wages increased at a similar rate to the overall volume of production during this period. The total employment grew more slowly (by 68 percent) than average nominal wages per employee (by 99 percent). Between 1998 and 2010, tier-one suppliers experienced the fastest increase in wages per employee (by 123 percent), while assemblers experienced the slowest (by 86 percent) (Table 6.5). Consequently, the wage gap between assemblers and suppliers slightly narrowed during this period. In contrast, the gap between assemblers and suppliers significantly increased in corporate taxes per employee (Table 6.5), which illustrates the ability of assemblers to concentrate increasing shares of profits at the expense of their suppliers. At the same time, assemblers, who accounted for 18.2 percent of the total automotive employment and 47.3 percent of total profits, accounted for 49.8 percent of corporate tax revenues between 2006 and 2008. Different tiers thus contribute to value capture and, consequently, regional development potential in different ways. While foreign assemblers and tier-one suppliers account for a disproportionately high share of total corporate tax revenues in the automotive industry, tier-two and tier-three suppliers are much more important in terms of the number of jobs they generate and related wage effects.
The data from the Czech automotive industry suggest that the stronger economic performance of assemblers and tier-one suppliers does not result solely from their corporate power, privileged position in the value chain, highly sophisticated production and control of high-value-added strategic functions. Many Czech-based foreign-owned assemblers and tier-one suppliers are typified by the low- to medium-value-added production in assembly branch plants with very limited or no strategic functions because these functions are concentrated in corporate headquarters in countries of their principal owners.
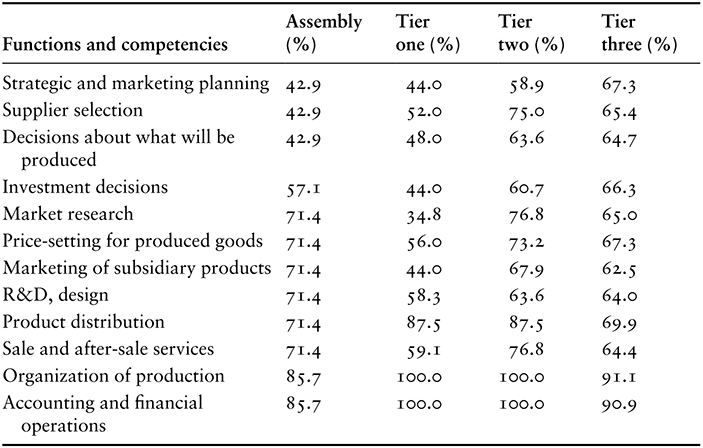
Overall, assemblers and tier-one suppliers in the Czech automotive industry do not generally perform more strategic nonproduction functions than lower-tier firms (Table 6.7). Instead, their strong position in the automotive value chain derives from the high capital and technology intensity of production, which is based on the transfer of highly advanced technology, machinery and production processes from their foreign parent companies. The capital intensity of production is considered to be a strong predictor of labor productivity and process upgrading (Reference SzalavetzSzalavetz, 2005). Nevertheless, in the case of assemblers and to a lesser extent also tier-one suppliers, a low share of value-added wages and taxes of the overall value of production (Table 6.4) results from the combination of high capital intensity and intensive outsourcing of the production of components. Assemblers and large tier-one suppliers spend very high shares of their overall expenditures on the material, energy, components and services, while their share of wage expenditures is usually less than 10 percent (Table 6.4). It means that lower supplier tiers have larger direct employment and wage effects per unit of production, and also per unit of invested capital, than higher tiers. In 2010, the ratio of total annual wages per unit of tangible assets was 0.17 for assemblers, 0.20 for tier-one suppliers, 0.29 for tier-two suppliers and 0.34 for tier-three suppliers. At the same time, however, lower tiers have lower wages and lower corporate tax revenues per employee than higher tiers, which means that their ability to capture and appropriate value per employee is lower than for assemblers and higher-tier firms.
Table 6.7 The percentage of automotive firms conducting selected high-value-added functions in Czechia by supplier tier, 2009
| Functions and competencies | Assembly (%) | Tier one (%) | Tier two (%) | Tier three (%) |
|---|---|---|---|---|
| Strategic and marketing planning | 42.9 | 44.0 | 58.9 | 67.3 |
| Supplier selection | 42.9 | 52.0 | 75.0 | 65.4 |
| Decisions about what will be produced | 42.9 | 48.0 | 63.6 | 64.7 |
| Investment decisions | 57.1 | 44.0 | 60.7 | 66.3 |
| Market research | 71.4 | 34.8 | 76.8 | 65.0 |
| Price-setting for produced goods | 71.4 | 56.0 | 73.2 | 67.3 |
| Marketing of subsidiary products | 71.4 | 44.0 | 67.9 | 62.5 |
| R&D, design | 71.4 | 58.3 | 63.6 | 64.0 |
| Product distribution | 71.4 | 87.5 | 87.5 | 69.9 |
| Sale and after-sale services | 71.4 | 59.1 | 76.8 | 64.4 |
| Organization of production | 85.7 | 100.0 | 100.0 | 91.1 |
| Accounting and financial operations | 85.7 | 100.0 | 100.0 | 90.9 |
Note: The number of firms answering individual questions ranged from 150 (for accounting and financial operations) to 192 (for strategic and marketing planning, decisions about what products will be produced, supplier selection, price setting for produced goods and marketing of subsidiary products).
6.6.4 Strategic Nonproduction Functions and Competencies
Finally, I evaluate the presence of nonproduction functions and competencies in Czech-based automotive firms in order to test the fourth and fifth hypotheses. I assume that strategic nonproduction functions activities contribute to value creation and value capture more than production activities (Reference MudambiMudambi, 2008). The 2009 survey collected the data about strategic nonproduction functions conducted by individual firms. Depending on a particular function, between 150 and 192 firms replied as to whether they performed each of twelve different functions. These functions represent high-value-added activities that are typically associated with highly paid professional jobs. As such, the presence or absence of these functions at individual firms has potentially important implications for their value creation and value capture. However, I need to stress that the data refer only to the presence or absence of these functions and do not provide any information about their extent within individual firms. I am also aware that firms would tend to exaggerate rather than understate the presence and importance of these activities. Therefore, the survey data should be interpreted with caution as the representation of general trends rather than exact measurements.
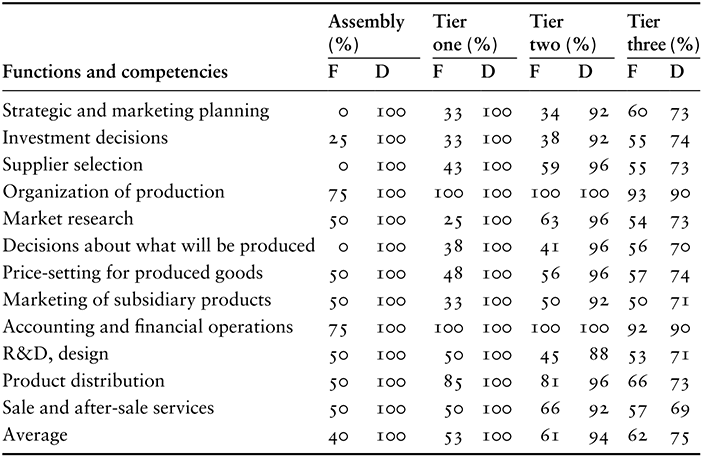
The fourth hypothesis argues that higher-tier firms possess stronger and more diverse competencies, which are reflected in the presence of more nonproduction (strategic) higher-value-added functions than in lower-tier firms. However, the survey data revealed that on average, tier-one suppliers conduct the lowest number of nonproduction functions in Czechia (61 percent of “yes” answers of those who answered when asked about individual functions), followed by assemblers with 66 percent. Therefore, the fourth hypothesis must be rejected. The main reason for a slightly higher number of functions conducted by tier-two suppliers (75 percent) and tier-three suppliers (70 percent) is a higher share of domestic firms among these lower-tier suppliers (Table 6.7). The differences between domestic and foreign firms within individual tiers are more pronounced and, on average, 82 percent of domestic firms conduct strategic nonproduction functions in Czechia compared to 59 percent of foreign firms (Table 6.8).
Table 6.8 The percentage of automotive firms conducting selected high-value-added functions in Czechia by ownership and supplier tier, 2009
| Functions and competencies | Assembly (%) | Tier one (%) | Tier two (%) | Tier three (%) | ||||
|---|---|---|---|---|---|---|---|---|
| F | D | F | D | F | D | F | D | |
| Strategic and marketing planning | 0 | 100 | 33 | 100 | 34 | 92 | 60 | 73 |
| Investment decisions | 25 | 100 | 33 | 100 | 38 | 92 | 55 | 74 |
| Supplier selection | 0 | 100 | 43 | 100 | 59 | 96 | 55 | 73 |
| Organization of production | 75 | 100 | 100 | 100 | 100 | 100 | 93 | 90 |
| Market research | 50 | 100 | 25 | 100 | 63 | 96 | 54 | 73 |
| Decisions about what will be produced | 0 | 100 | 38 | 100 | 41 | 96 | 56 | 70 |
| Price-setting for produced goods | 50 | 100 | 48 | 100 | 56 | 96 | 57 | 74 |
| Marketing of subsidiary products | 50 | 100 | 33 | 100 | 50 | 92 | 50 | 71 |
| Accounting and financial operations | 75 | 100 | 100 | 100 | 100 | 100 | 92 | 90 |
| R&D, design | 50 | 100 | 50 | 100 | 45 | 88 | 53 | 71 |
| Product distribution | 50 | 100 | 85 | 100 | 81 | 96 | 66 | 73 |
| Sale and after-sale services | 50 | 100 | 50 | 100 | 66 | 92 | 57 | 69 |
| Average | 40 | 100 | 53 | 100 | 61 | 94 | 62 | 75 |
Notes: F denotes foreign firms; D denotes domestic firms. The number of firms answering individual questions ranged from 150 (for accounting and financial operations) to 192 (for strategic and marketing planning, decisions about what products will be produced, supplier selection, price setting for produced goods and marketing of subsidiary products).
There are important differences among individual supplier tiers and between foreign and domestic firms. Among foreign firms, higher-tier firms on average conduct fewer nonproduction functions than lower-tier firms, suggesting that higher-tier foreign suppliers are more tightly integrated into transnational corporate production networks and controlled from abroad. The opposite situation is true for domestic firms because higher-tier domestic firms conduct more functions than lower-tier firms (Table 6.8). Higher-tier domestic firms cannot stay competitive and survive without R&D and other nonproduction functions (2009–2011 interviews). Lower-tier domestic firms, especially tier-three suppliers, are often captive suppliers that depend for many nonproduction functions on buyers of their components (Reference Gereffi, Humphrey and SturgeonGereffi et al., 2005; Reference Pavlínek and ŽížalováPavlínek and Žížalová, 2016), which explains why domestic tier-three suppliers reported the lowest share of nonproduction functions of all tiers. Small sample size affects the results for foreign assemblers. There is a difference between foreign assemblers that were taken over by foreign TNCs and kept certain strategic functions in what has been previously called embedded path-dependent transformations (Reference PavlínekPavlínek, 2002d), such as Škoda Auto and Iveco (former Karosa), and new greenfield assembly plants, such as Toyota and Hyundai, that lack these functions and have no plans to develop them (2009–2011 interviews). Although higher-tier firms capture a greater share of created value than lower-tier firms, it is not because they conduct more nonproduction functions. The data only confirm that assembly and tier-one firms pay significantly higher wages per employee than tier-two and tier-three firms (Table 6.5). Therefore, the fifth hypothesis, that higher-tier firms capture a greater share of created value than lower-tier firms because higher-tier firms conduct more nonproduction functions and offer higher wages than lower-tier firms, must be rejected.
6.7 Conclusion
This chapter set out to evaluate the value creation and capture in the Czech automotive industry by different tiers of automotive firms. It empirically tested whether two theoretical assumptions apply in the automotive industry in the context of integrated peripheries. First, whether higher-tier firms create and capture higher value than lower-tier firms because they produce more complex components and possess a strong bargaining power that allows them to squeeze their suppliers (Reference Sturgeon, Van Biesebroeck and GereffiSturgeon et al., 2008). Second, whether intangible knowledge-based assets and strategic nonproduction functions represent a key source of value added for higher-tier firms (Reference MudambiMudambi, 2008).
The analysis suggests that the economic effects of the automotive industry largely depend on its capital intensity of production, especially in terms of wages and value added per employee, which tend to increase with the increasing capital intensity of production and vice versa. Since the highest capital intensity of production is found among assemblers and tier-one suppliers, these firms should have stronger economic effects than lower-tier suppliers. Additionally, assemblers and tier-one suppliers account for much higher corporate tax revenues than lower-tier suppliers and they have higher average wages per worker. This also points toward stronger economic effects of assemblers and tier-one suppliers than tier-two and tier-three suppliers. However, the vast majority of assemblers and tier-one suppliers are foreign-owned in the Czech automotive industry, which has two important implications. First, Czech-based subsidiaries of foreign lead firms and tier-one suppliers primarily concentrate on export-oriented assembly and production and their strategic nonproduction functions are weakly developed. Second, an increase in value creation by foreign firms does not necessarily have to translate into an increase in value capture because of profit repatriation, tax holidays and other profit-shifting strategies employed by foreign firms. At the same time, lower-tier suppliers have larger direct employment and wage effects per unit of production and investment capital than higher-tier suppliers. This is important for regional development since tier-two and tier-three suppliers are much more numerous, more spatially dispersed and received on average significantly lower investment incentives per newly created job than assemblers and tier-one firms.
The data analysis from the Czech automotive industry confirms the first hypothesis that higher-tier firms generate greater value per employee than lower-tier firms. As a result, their share of the total value added in the automotive industry has been increasing. The survey data also confirm the second hypothesis that domestic suppliers import a lower share of inputs than foreign suppliers. The third hypothesis that higher-tier firms import lower shares of inputs than lower-tier firms is confirmed for foreign but not domestic firms. Therefore, it must be rejected. Nevertheless, in the case of foreign firms, a higher share of domestic sourcing by assemblers and tier-one suppliers is another supporting evidence of higher-tier foreign firms creating and capturing greater value than lower-tier suppliers as confirmed by the first hypothesis.
The fourth hypothesis arguing that higher-tier firms possess stronger and more diverse competencies that are reflected in the presence of more nonproduction (strategic) higher-value-added functions than in lower-tier firms must be rejected, since higher-tier foreign firms conduct fewer nonproduction functions than lower-tier foreign firms in the Czech automotive industry. Parent companies typically conduct these functions for higher-tier foreign firms abroad. The fifth hypothesis must also be rejected. Higher-tier firms capture a greater share of created value than lower-tier firms because they offer higher wages than lower-tier firms but not because they conduct more nonproduction higher-value-added functions.
The rejection of the fourth and fifth hypotheses allows me to conclude that the high value creation and capture by assemblers and tier-one suppliers in the Czech automotive industry is not a function of the presence of valuable intangible assets and strategic nonproduction functions. Rather, it is a function of firm size and capital intensity of production. A significantly larger firm size contributes to high profitability by allowing higher-tier firms to capitalize on their internal scale economies and strong purchasing power, which translates into their very strong bargaining power. The capital intensity of production can at least partly explain the high labor productivity of higher-tier firms. The combination of a strong bargaining power with the high capital intensity of production and high labor productivity is probably the key explaining factor for relatively high wages, profitability and corporate tax revenues of higher-tier firms, especially assemblers. Further empirical research is needed to determine if this finding will hold in other integrated peripheries. If it does, we can expect a similar distribution of value creation and capture in countries with a similar or lower concentration of strategic nonproduction functions in the automotive industry, such as Spain, Portugal, Poland, Hungary, Slovakia, Mexico and Thailand.
The greater economic potential of higher-tier firms than lower-tier firms in the automotive industry has important policy implications for less developed countries. In the absence of a strong domestic automotive industry, it makes sense to attract foreign assembly firms because tier-one foreign suppliers will likely follow, which will also encourage foreign tier-two and tier-three suppliers to invest. Most Eastern European countries have followed this approach and engaged in aggressive bidding for foreign assembly plants in the 1990s and 2000s (Reference DrahokoupilDrahokoupil, 2009; Reference PavlínekPavlínek, 2016). However, less developed countries with a weak domestic manufacturing sector need to factor in potential long-term less tangible costs of these FDI-oriented policies, such as increased economic dependence on foreign TNCs, outflow of profits and the danger of being locked in an unfavorable position in the international division of labor (Reference Nölke and VliegenthartNölke and Vliegenthart, 2009).
It is reasonable to expect that the small and open Eastern European economies will continue to be heavily influenced by inflows of FDI and activities of foreign TNCs in the future. At the same time, the overwhelming economic dependence on foreign capital and economic control by foreign capital will make it extremely difficult for Eastern Europe to close the economic gap, including the gap in standards of living, with Western Europe as Eastern European countries are facing the danger of falling into the “middle income trap” (e.g., Reference RavenhillRavenhill, 2014). A successful long-term development strategy of the automotive industry should therefore combine the presence of foreign firms with a simultaneous promotion of the strong domestic sector. A key policy issue is finding a balance between the degree of external control and dependence, and indigenous economic development based upon policies that would allow for a gradual upgrading of the position of Eastern European countries in the international division of labor.


 Open access