Introduction
Wheat stem sawfly, Cephus cinctus Norton (Hymenoptera: Cephidae), is indigenous to North America (Lesieur et al. Reference Lesieur, Martin, Weaver, Hoelmer, Smith and Morrill2016) and has a broad host range of native grasses (Cockrell et al. Reference Cockrell, Griffin-Nolan, Rand, Altilmisani, Ode and Peairs2017). It quickly adapted to spring-seeded wheat crops (including Triticum aestivum Linnaeus and Triticum durum Desfontaines (Poaceae)) that came with the expansion of agriculture on the Great Plains of North America (Criddle Reference Criddle1922; Weiss and Morrill Reference Weiss and Morrill1992). Damage to wheat was first reported in Souris, Manitoba, Canada, and Indian Head, Saskatchewan, Canada in 1895 (Fletcher Reference Fletcher1896). By 1923, Criddle (Reference Criddle1923) reported that C. cinctus was found in over half of the wheat growing area of Manitoba, a wide range in Saskatchewan and present “over quite an extensive territory in Alberta” (Criddle Reference Criddle1923). This species is widely distributed in areas west of the Mississippi River in the United States of America and Ontario in Canada (Ivie Reference Ivie2001), as far south as the 36th parallel (Ainslie Reference Ainslie1920, Reference Ainslie1929) and as far north as the Peace Lowland Ecoregion (Ecological Framework of Canada 2017) of northern Alberta (Moorhouse Reference Moorhouse1914). Within this geographical region of Canada and the United States of America, the areas subjected to greatest attack are southern Alberta and Saskatchewan, southwestern Manitoba, eastern and northern Montana, North Dakota, northern South Dakota, and western Minnesota. Cumulative grain-yield losses and annual economic losses associated with outbreaks of this pest can exceed 30% and $350 million (CAD), respectively (Beres et al. Reference Beres, Dosdall, Weaver, Cárcamo and Spaner2011b).
Criddle (Reference Criddle1923) described the life history of C. cinctus in western Canada. After completing obligatory diapause, larvae pupate in spring and adults emerge in June to July from overwintering sites in wheat stubble and migrate to infest adjacent wheat fields. Adults live for approximately one week, with females each laying up to 50 eggs into elongating grass stems, at a rate of one egg per stem per visit. Multiple eggs from different females are common at high densities, but only one larva develops to maturity (Holmes Reference Holmes1982). Eggs are deposited using a saw-like ovipositor, usually in the second last developing internode (Holmes Reference Holmes1979). The larva feed on parenchyma and vascular tissues, causing reduced kernel weight and seed set before moving down to the base of the stem and chewing a “V-shaped” notch which weakens the structural integrity of the stem, causing lodging (Holmes Reference Holmes1977). In preparation for overwintering, the larva plugs the stem with frass and forms a cocoon at the base of the stub (Criddle Reference Criddle1922, Reference Criddle1923).
Climate can regulate C. cinctus populations directly and indirectly. First available in the 1940s, solid stem wheat varieties have been shown to cause increased C. cinctus larval mortality, reduced weight, lower fecundity, and an increase in larval mortality (Farstad Reference Farstad1940; Cárcamo et al. Reference Cárcamo, Beres, Clarke, Byers, Mundel and May2005; Buteler et al. Reference Buteler, Peterson, Hofland and Weaver2015). However, expression of stem solidness in resistant bread wheat varieties is determined largely by weather (e.g., June precipitation, Beres et al. Reference Beres, Hill, Cárcamo, Knodel, Weaver and Cuthbert2017), which fluctuates year to year. Two native wasps, Bracon cephi (Gahan) and Bracon lissogaster Muesebeck (Hymenoptera: Braconidae), help regulate C. cinctus populations (Cárcamo and Beres Reference Cárcamo and Beres2013; Rand et al. Reference Rand, Richmond and Dougherty2017). Their impact is greatly increased during cool wet summers that delay wheat harvest and allow a second generation of the parasitoids to complete development (Nelson and Farstad Reference Nelson and Farstad1953; Holmes et al. Reference Holmes, Nelson, Peterson and Farstad1963). Weather affects C. cinctus biology directly through overwintering mortality and fecundity; extremes of temperature and moisture increases mortality of C. cinctus while in plant stubs during fall, winter, and spring (Holmes Reference Holmes1982). Dry years are more favourable for C. cinctus development than wet seasons (Criddle Reference Criddle1922). Cold, wet conditions may retard pupation and emergence (or cause mortality through increased parasitism). Freezing or dry soil (> 38 °C) may be fatal to larvae and pupae in exposed stubble (Seamans Reference Seamans1945; Holmes et al. Reference Holmes, Nelson, Peterson and Farstad1963).
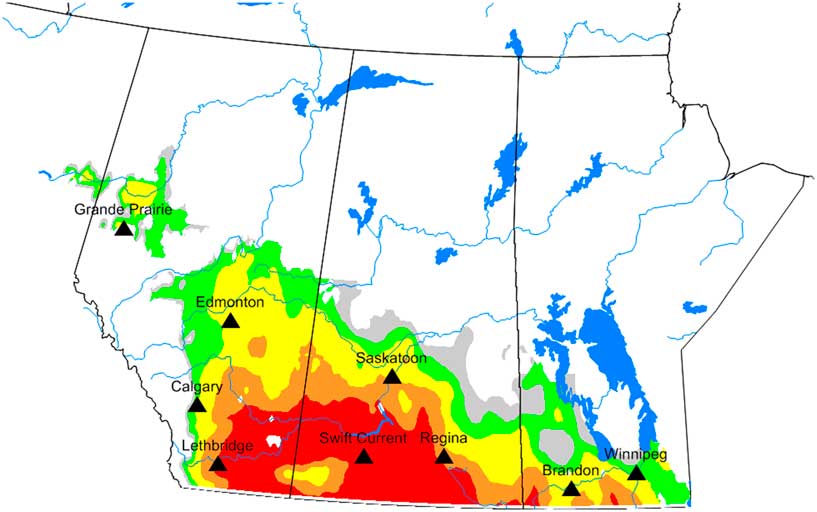
Surveys of C. cinctus distribution and damage (% stems cut) had been conducted in western Canada since 1926 (King Reference King1929) and continued well into the 1940s. Surveys resumed in Alberta in 2003 when C. cinctus once again reached outbreak status (Beres et al. Reference Beres, Cárcamo and Byers2007). Surveys for 1926–1936 (Saskatchewan) and 2003–2017 (Alberta) recorded the per cent of cut stems while the 1938–1949 (Alberta, Manitoba, and Saskatchewan) surveys reported results as crop risk categories (Fig. 1).
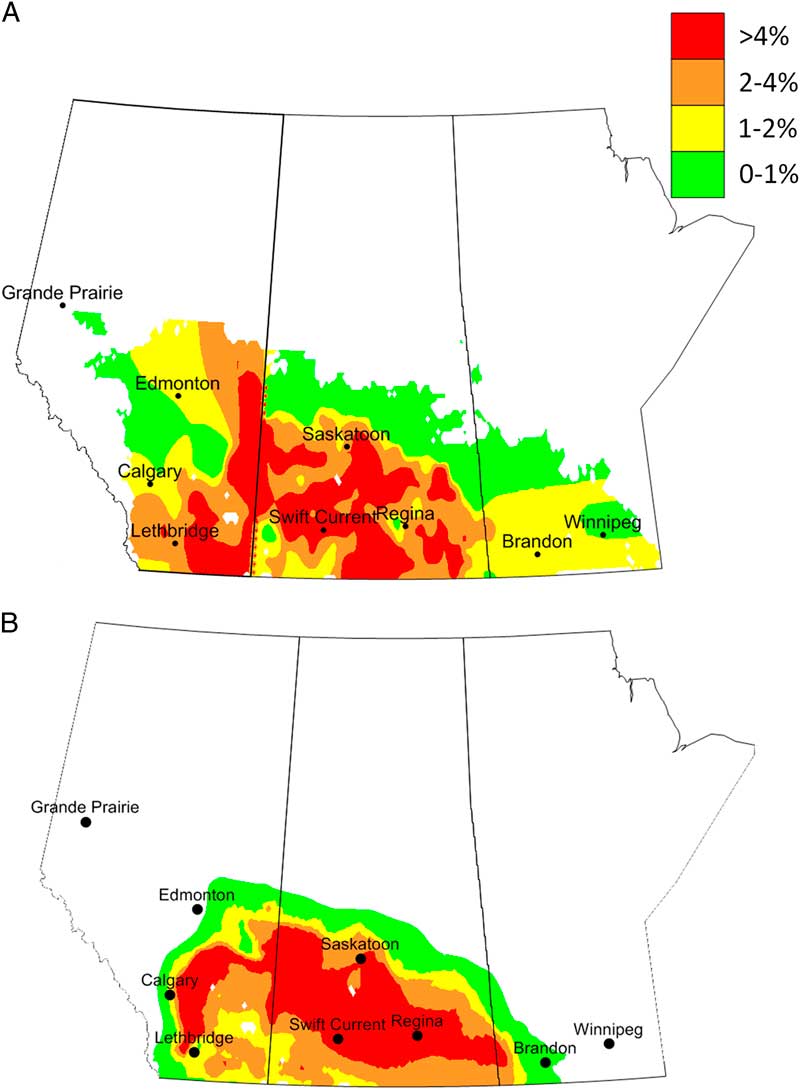
Fig. 1 Composite maps based on surveys conducted across western Canada. Average per cent cut stems (A) caused by Cephis cinctus in Alberta (2003–2017) and Saskatchewan (1926–1936). Average per cent cut stem results are presented as: green=0–1%; yellow =1–2%; orange=2–4%, and red > 4%. Average risk categories (B) based on surveys conducted between (1938 and 1942). Average risk categories are presented as: green=light, yellow=moderate, orange=potentially severe, and red=severe.
Because climate is the dominant force determining the distribution and abundance of most insect species, plant pathogens and their host plants, Sutherst (Reference Sutherst1998) questioned the capability of process and statistical models to predict the geographical distribution of a species. In response, Sutherst and Maywald (Reference Sutherst and Maywald2005) developed an alternative approach involving inverse (or inferential) models, which infer the response of a species to climate, based on its geographic range, phenology, and relative abundance. These bioclimatic inferential, or niche, models have been successfully used to predict potential distribution and abundance of a diverse group of insect species (Hughes and Maywald Reference Hughes and Maywald1990; Worner Reference Worner1994; Dosdall et al. Reference Dosdall, Weiss, Olfert and Cárcamo2002; McKenney et al. Reference McKenney, Hopkin, Campbell, Mackey and Foottit2003; Olfert et al. Reference Olfert, Weiss, Woods, Philip and Dosdall2004). One such bioclimatic inferential modelling tool is Climex (Kriticos et al. Reference Kriticos, Maywald, Yonow, Zurcher, Herrmann and Sutherst2015). Climex derives an ecoclimatic index, describing the climatic suitability of specific locations for species survival and reproduction. In turn, this provides an estimate of relative population abundance. Model parameters include temperature, diapause, light, moisture, heat stress, cold stress, wet stress, and dry stress. Growth and stress indices are calculated and combined into an overall annual index of climatic suitability that ranges from ecoclimatic index=0 for locations where the species are not able to persist, to ecoclimatic index=100 for locations that are optimal for the species under study. The indices are then categorised within that range (e.g., unfavourable, suitable, favourable, very favourable) to reflect the climatic suitability of the subject under study.
The objective of this study was to quantify the impact of abiotic factors on distribution and abundance of C. cinctus across the Prairies Ecozone and the Boreal Plains Ecozone of western Canada, and to develop an understanding of how C. cinctus populations may respond in potential scenarios of climate change.
Methods
A bioclimate model for C. cinctus was developed using Climex 4 (Kriticos et al. Reference Kriticos, Maywald, Yonow, Zurcher, Herrmann and Sutherst2015). The bioclimate modelling process, which integrates the weekly responses of a population to climate using a series of annual climate-related indices, has been previously described (Olfert and Weiss Reference Olfert and Weiss2006a; Olfert et al. Reference Olfert, Weiss and Elliott2016b; Olfert et al. Reference Olfert, Weiss, Elliott and Soroka2017; Yonow et al. Reference Yonow, Kriticos, Ota, Van Den Berg and Hutchison2017).
Initial model parameters were estimated from published data. The model was developed in iterations, whereby parameters were individually adjusted in order to develop model output that closely aligned with the reported geographic distribution and relative abundance of C. cinctus for Alberta and Saskatchewan. These data sets included large-scale surveys of C. cinctus conducted across the Canadian Prairies Ecozone since 1926 (King Reference King1929), and the Alberta surveys which resumed in 2003 (Prairie Pest Monitoring Network 2018). For surveys prior to 2003, images were taken of each map and digitised. For the purpose of model development and subsequent validation, composite maps were created for the three survey periods. Model validation was based on composite maps for provincial surveys (Manitoba and Saskatchewan 1938–1942), and Alberta (1938–1949), as well as published distribution and abundance data for United States of America (select periods between 1940 and 1989) (Weiss and Morrill Reference Weiss and Morrill1992). Models were also validated by comparing published phenological and degree-day data with model output for diapause and weekly growth indices.
The “compare locations” module in Climex allows output of annual indices values, including one ecoclimatic index for each geographic grid cell (0.1o). Ecoclimatic index values were then used to develop a surface map of the potential distribution and relative abundance of these species in western Canada. In order to assess risk to cereal crops, surface maps were constrained by regions where soils were deemed suitable for crop production in Canada (Kirkwood et al. Reference Kirkwood, Bootsma, de Jong, Dumanski, Hiley and Huffman1993). Surface maps were displayed using ecoclimatic-index values in five categories: grey=unfavourable (1–5); green=marginal (5–10); yellow=suitable (10–15); orange=favourable (15–20), and red=very favourable (> 20). Six focal locations were selected: Winnipeg, Manitoba (49.9°N, 97.1°W); Saskatoon, Saskatchewan (52.1°N, 106.6°W); Swift Current, Saskatchewan (50.3°N, 107.8°W); Edmonton, Alberta (53.6°N, 113.6°W); Lethbridge, Alberta (49.7°N, 112.8°W); and Grande Prairie, Alberta (55.1°N, 118.5°W). A geographic rectangle, 1° latitude by 1° longitude was used to delineate a geographic region around each location, and model output was averaged across this area (n=180 grid cells). These datasets permitted both spatial and temporal comparison of variables.
To assess the potential impact of a changing climate, climate data obtained from the CliMond 10 spatial resolution climate data set (Kriticos et al. Reference Kriticos, Webber, Leriche, Ota, Macadam and Bathols2012) were used as input into the C. cinctus bioclimate model. The CliMond data set was developed for species bioclimatic modelling, including both correlative and process-based mechanistic models. General circulation model runs were conducted for the periods of 2030 and 2070. The 10′ gridded dataset included a hybrid historical data set (based on CRU CL2.0 and WorldClim; centred on 1975), and a set of future climate scenarios from two general circulation models (CSIRO Mark 3.0 and MIROC-H) for the 2030 and 2070 time periods. Climate projections were based on the Special Report on Emission Scenarios A1B emission scenario (Nakicenovic and Swart Reference Nakicenovic and Swart2000).
Sensitivity analysis can be used to test hypotheses related to the effect of varying climate variables (i.e., warmer/cooler or wetter/dryer than normal conditions) on the species distribution and abundance (Taylor and Kumar Reference Taylor and Kumar2012). Two types of sensitivity analysis were conducted in this study. Climex “parameter sensitivity” analysis automatically adjusts model parameters by defined amounts around specified parameters and permits modellers to quantify the impact of specific parameters on the overall model (Kriticos et al. Reference Kriticos, Maywald, Yonow, Zurcher, Herrmann and Sutherst2015). Parameter sensitivity analysis was conducted using the CliMond 10 data set and constrained to the area that was used for the model fitting process. Additionally, ecological sensitivity analysis was used to analyse species sensitivity, based on ecoclimatic-index values, to changes in temperature and precipitation. Climate data sets were adjusted by increasing or decreasing precipitation by 40%, and increasing or decreasing temperature by 1 °C and 2 °C for each grid cell.
Results and discussion
Biolimatic inferential models infer a species response to climate, based on its geographic range, phenology, relative abundance, and empirical data. Climex simulation software allows researchers to develop an overview of climatic factors that affect species distribution and abundance and permit identification of non-climatic factors that limit species distribution (Kriticos et al. Reference Kriticos, Maywald, Yonow, Zurcher, Herrmann and Sutherst2015).
Model development
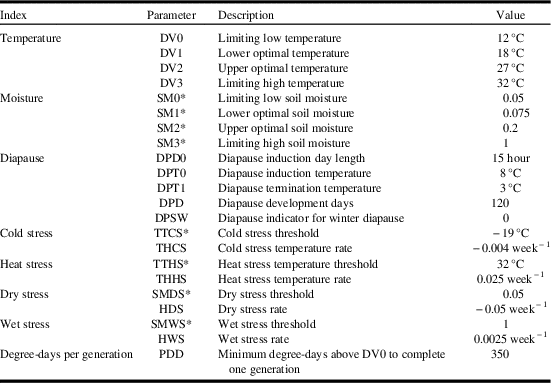
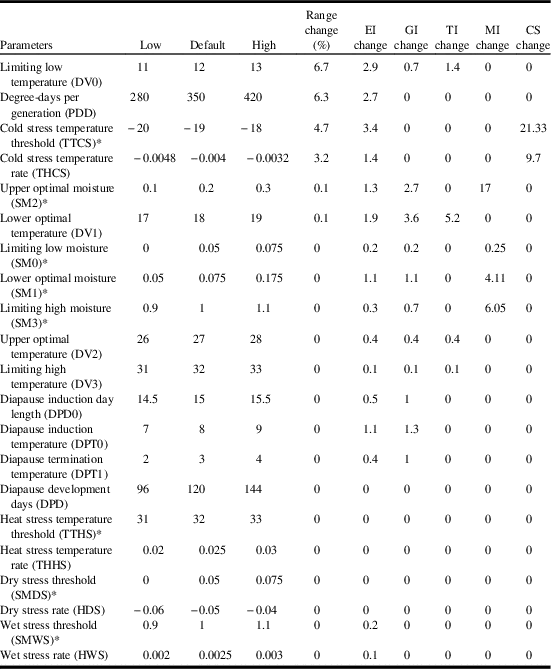
Values for Climex model parameters are presented in Table 1. The table also provides an itemised list of the model parameter abbreviations used in this section.
Table 1 Values for parameter settings for the Climex model projecting Cephus cintus distribution and relative abundance in western Canada.

* Nondimensional units.
Temperature index
The temperature index describes species response to temperature, and varies between 0 (no population growth) and 1 (maximised population growth). Development rates were based onmaximum and minimum temperature data. Four parameters were used to define temperature suitability: lower temperature threshold (DV0), lower optimal temperature (DV1), upper optimal temperature (DV2), and upper temperature threshold (DV3). Based on reports that adults begin to emerge in the middle of June and that adult flight occurred at 17 °C (Seamans Reference Seamans1945), lower temperature threshold (DV0), lower optimal temperature (DV1) were set to 12 °C and 18 °C, respectively. Seamans (Reference Seamans1945) also reported that adult activities occurred between 18–32 °C and that soil surface temperatures of 38 °C may be fatal. Oviposition was reported to occur between 20–31 °C (Holmes Reference Holmes1982). DV0 and DV3 were parameterised to delimit C. cinctus range across southern Alberta. DV1 and DV2 were parameterised to produce ecoclimatic-index values that agreed with survey results for Saskatchewan and Alberta for the period of 1926–1936 and 2003–2017 (Fig. 1A). Based on published reports and model iterations, lower temperature threshold (DV0), lower optimal temperature (DV1), upper optimal temperature (DV2), and upper temperature threshold (DV3) were set to 12 °C, 18 °C, 27 °C, and 32 °C, respectively.
Moisture index
The moisture index calculates a weekly value for soil moisture. The index is calculated using four parameters: lower soil moisture threshold (SM0), lower optimal soil moisture (SM1), upper optimal soil moisture (SM2), and upper soil moisture threshold (SM3). Dry years were reported to be more favourable for C. cinctus development than wet seasons (Criddle Reference Criddle1922). Wet conditions retarded pupation and delayed emergence, resulted in mortality and reduced adult activity (Seamans Reference Seamans1945), or increased parasitism (Holmes et al. 1963). Seamans (Reference Seamans1945) also reported that wet conditions in July reduced populations in the following year while excessive drought may be as detrimental as excessive moisture. Above normal rainfall in 1954 contributed to a decline in C. cinctus populations in Alberta (Holmes Reference Holmes1982). As a result, SM0 was parameterised to match population distribution data across western Canada (Fig. 1A, Table 1). Overall, soil moisture values were parameterised for dry conditions and resulted in a distribution that included the more arid regions of the Prairies Ecozone. For example, SM1 and SM2 were parameterised to produce the highest ecoclimatic-index values across southwestern Saskatchewan and southern Alberta where survey results have shown C. cinctus to be most abundant.
Diapause
The diapause index was parameterised with obligate diapause, meaning the species must be exposed to specific conditions in order to initiate and complete diapause and thus survive. Climex sets the weekly population growth index to zero during weeks when the species is in diapause. At 10 °C, obligatory diapause lasted between 40 and 110 days (Salt Reference Salt1946), 90 days (Holmes Reference Holmes1982), and 90–100 days (Villacorta et al. Reference Villacorta, Bell and Callenbach1971). All of these studies were conducted at temperatures between 5 °C and 10 °C and were warmer than temperatures that C. cinctus would be exposed to under North American field conditions. Overwintering temperatures in Alberta (measured below the plug of the cut stub) remained above −10 °C (Salt Reference Salt1946). In Manitoba, pupation was reported to occur in May (Criddle Reference Criddle1922). Parameterisation of the diapause index was based on observed distribution and phenology. Initial values for diapause induction day length (DPDO) were set to day lengths of 12–13 hours and diapause induction temperatures (DPTO) of 10–13 °C. Based on presence of larvae and termination of larval activity in the fall, final values were set to 15 hours (DPDO) and 8 °C (DPTO). Though the species is widely distributed, it does not occur south of 36°N (Villacorta et al. Reference Villacorta, Bell and Callenbach1971). A diapause-index value of zero would indicate that model conditions have not been met in order to induce and/or terminate diapause. When diapause index=0, the resulting ecoclimatic-index value is also set to zero. A DPDO value of 15 hours (day length must be equal to or greater than 15 hours) generally limits distributions to north of 36°N. The number of days required to complete diapause was incrementally changed for values ranging from 90 to 120 days. Across this range of values, model performance (in terms of growth index values) was not affected. Larval activity and pupation in spring does not resume until diapause has been terminated. Diapause induction temperature was set to 3 °C in order to permit development to occur in May in Manitoba.
Stress indices
Due to the insulating impact of snow, mid-winter temperatures at the soil surface are generally warmer than associated air temperatures. At Lethbridge, Alberta, measured air temperatures were less than −30 °C while temperatures within stems (below the plug) were −12 °C. The supercooling point for C. cinctus was determined to be −22 °C and up to 80% of the sawflies survived for 10 days at −10 °C and 10% survived for 40 days (Cárcamo et al. Reference Cárcamo, Beres, Herle, McLean and McGinn2011). Climex stress indices are used to model climatic limitations that occur outside the growing season and limit survival. Climex uses air temperature as an input. Rather than directly parameterise the model for soil temperature, air temperatures, based on known distributions, are used to parameterise cold stress. Parameterisation results indicated that manipulation of the cold stress threshold had a greater impact on ecoclimatic-index values for C. cinctus than did cold stress temperature rate. Manipulation of cold stress temperature rates resulted in distribution changes. Based on published reports and survey results, cold stress threshold was set to −19 °C and cold stress temperature rate was set to −0.004. Each of the stress indices are associated with a rate that determines how quickly a particular stress accumulates when conditions are beyond a stress threshold value.
Degree-days per generation
Species distribution is limited by thermal requirements that accumulate during the growing season. Based on a threshold temperature of 12 °C, and distribution in western Canada, the minimum number of degree-days was set at 350 in order to fit the observed distribution of C. cinctus in western Canada.
Model validation
Distribution
Cephus cinctus has been collected from every state west of the Mississippi River in the northern and central plains of North America (where annual precipitation is 250–500 mm), as well as from Manitoba, Saskatchewan, Alberta, Ontario, and British Columbia (including Vancouver Island) (Weiss and Morrill Reference Weiss and Morrill1992; Ivie Reference Ivie2001). Specimens have been collected from isolated areas in Arkansas, Connecticut, Georgia, Illinois, Indiana, Michigan, New York, Ohio, Oklahoma, Pennsylvania, Texas, Virginia, and Wisconsin (United States Department of Agriculture 1971; Ivie Reference Ivie2001; Centre for Agriculture and Bioscience International 2015; Global Biodiversity Information Facility 2015).
A comparison of distribution records with model output (ecoclimatic index ≥ 5) for North America indicated that the observed and modelled distributions were very similar (Fig. 2). Though there were a few discrepancies between modelled and reported distributions, these discrepancies occurred where C. cinctus would not likely be considered a pest insect. The modelled distribution incorrectly predicted that C. cinctus would occur in Québec, New Brunswick, Nova Scotia, Prince Edward Island, Maine, New Hampshire, Vermont, Massachusetts, Maryland, Tennessee, North Carolina, South Carolina, Mississippi, and Louisiana. Considering the occurrence in New York, Connecticut, and Pennsylvania, it is possible that C. cinctus is more widespread in the northeast than has been reported. Occurrence in Georgia may mean that distribution could include other states in the southeast.
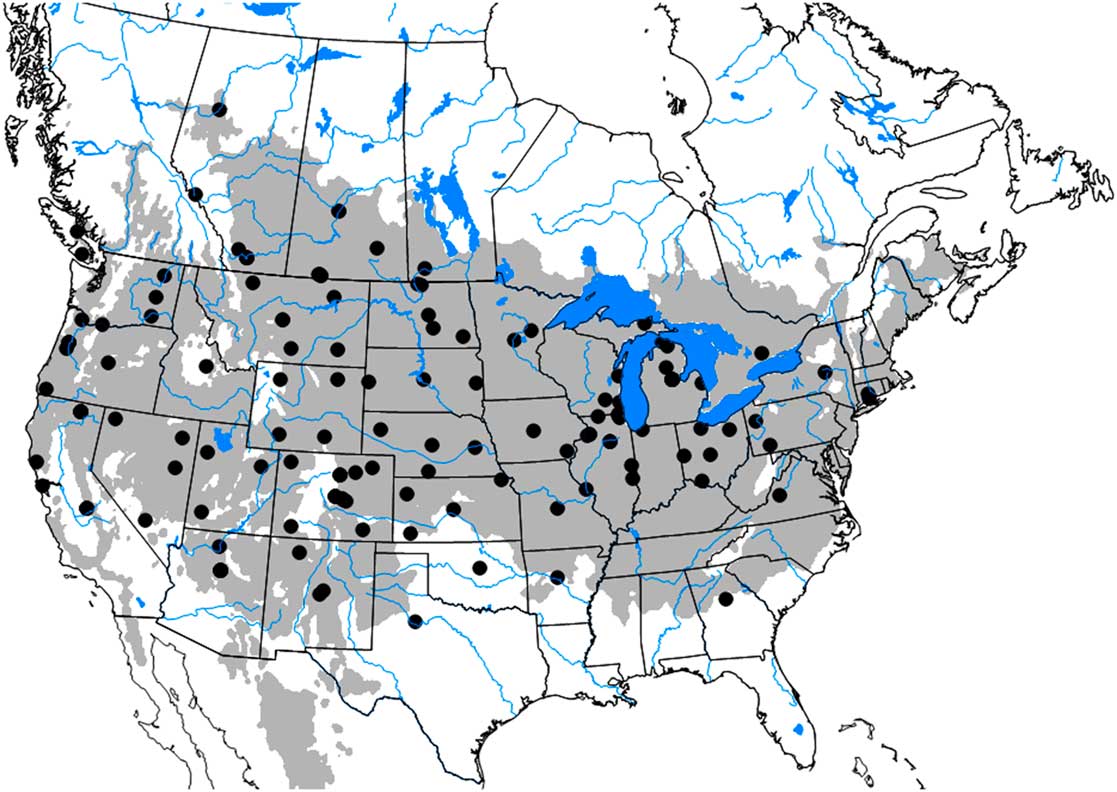
Fig. 2 Potential distribution of Cephis cinctus in North America. Black points represent recorded presence of C. cinctus and the grey region represents areas where the modelled range of C. cinctus indicates that the species could establish (ecoclimatic-index values are ≥ 5).
As mentioned, the ecoclimatic index integrates potential population growth with stresses to produce estimates of relative abundance. Within this geographical region, the areas subjected to greatest observed attack are southern Alberta and Saskatchewan, southwestern Manitoba, eastern and northern Montana, North Dakota, northern South Dakota, and western Minnesota (Holmes Reference Holmes1982; Weiss et al. Reference Weiss, Morrill and Reitz1987; Beres et al. Reference Beres, Cárcamo, Weaver, Dosdall, Evenden and Hill2011a). Model validation was conducted by comparing output with independent survey data that were collected for the period of 1938–1942 for Alberta, Saskatchewan, and Manitoba. Model output indicated that the highest ecoclimatic-index values, based on input parameters, would occur across southwestern Manitoba, southern Saskatchewan, and southern Alberta (Fig. 3). These areas corresponded to historical surveys that encompassed regions that had greater than 4% cut stems and were categorised as moderate, potentially severe or severe categories (Fig. 1A–B). Based on survey results for Saskatchewan (1926–1936) and Alberta (2003–2017), ecoclimatic-index values categorised as favourable (ecoclimatic index=15–20) corresponded to regions that had an overall mean of 2–4% cut stems, while very favourable (ecoclimatic index > 20) corresponded to regions that had an overall mean of > 4% cut stems.

Fig. 3 Potential distribution and relative abundance of Cephis cinctus in western Canada under current climate. Ecoclimatic-index values were presented in five categories: grey=unfavourable (1–5); green=marginal (5–10); yellow=suitable (10–15); orange=favourable (15–20), and red=very favourable (> 20).
Development and phenology
Modelled phenology was compared with reported observations to confirm agreement with seasonal activity patterns of C. cinctus. In Manitoba, Saskatchewan, and Alberta, the model indicated that growth (i.e., pupation, oviposition, larval feeding) began in late April and early Mayand ceased in early September. These results agreed with observations reported for early season activity across western Canada (Criddle Reference Criddle1922; Seamans Reference Seamans1945). Cessation of activity in September is associated with plant senescence and initiation of diapause (Salt Reference Salt1946; Weiss and Morrill Reference Weiss and Morrill1992). This corresponded with model output that indicated diapause would begin in early September.
Parameter and ecological sensitivity analysis
Parameter sensitivity
In order to analyse the potential impact of each variable on model accuracy, we used the parameter sensitivity analysis in Climex to identify the parameters that had noteworthy influence on the predicted distribution of C. cinctus (Table 2). Based on range change (per cent of locations where ecoclimatic-index values were altered by ≥ 1), parameter sensitivity analysis indicated that model sensitivity was greatest (6.7%) for the low limiting temperature (DV0) and degree-days per generation (6.3%) followed by cold stress threshold (4.7%) and cold stress temperature rate (3.2%). In terms of impacts on ecoclimatic index, the cold stress temperature threshold had the greatest influence (3.4), followed by the limiting low temperature (DV0) (2.9) and degree-days per generation (2.7) (Table 2).
Table 2 Results of sensitivity analysis for Cephus cintus model.
Notes: Results are listed in descending sensitivity across the modelled range. Temperatures are listed in °C. Rates are listed per weekly.
* Nondimensional units.
EI, ecoclimatic index; GI, population growth index; TI, temperature index; MI, moisture index; CS, cold stress.
The annual growth index, defined as the potential for population growth, is a function of temperature and soil moisture, and which is combined with stress indices (cold, wet, hot, dry) to determine their effect on species survival. In this model, changes to the annual growth index were most sensitive to lower optimal temperature (DV1) (3.6) and upper optimal moisture (SM2) (2.7) (Table 2). The temperature index was most sensitive to the lower optimal temperature (DV1). Moisture index changed most for upper optimal moisture (SM2) and limiting high moisture (SM3). Overall, the model was most sensitive (21.3) to cold stress (cold stress temperature threshold). Since C. cinctus is a species that occurs in a temperate climate, it is not surprising that sensitivity analysis indicated that the model was most sensitive to parameters associated with low temperatures (DV0, degree-days, cold stress threshold, cold stress temperature rate). The low limiting temperature (DV0) was based on early/late season activity as well as reported distributions and had relatively small impacts on range, ecoclimatic index, and annual growth index. The range of values over which degree-days was tested (280–420 degree-days) was relatively wide and the level of sensitivity was relatively minor. The degree-days value resulted in a distribution that agreed with the observed range of C. cinctus in western Canada.
Cold stress temperature threshold had the third highest range change (4.7%) and the highest impact on ecoclimatic-index change (3.4%). Cárcamo et al. (Reference Cárcamo, Beres, Herle, McLean and McGinn2011) reported cold stress to be a minor factor in terms of C. cinctus population dynamics, with overwintering mortality averaging 8%. However, Rand et al. (Reference Rand, Richmond and Dougherty2017) reviewed several studies with mean overwinter mortality rates ranging from 20 to 48%. The two parameters associated with cold stress (cold stress threshold and cold stress temperature rate) were extensively tested during the model development process. During the iterative process the model was tested over a range of cold stress thresholds (−17 to −21 °C) and −19 °C provided the best fit. Model parameterisation of the cold stress temperature rate was also parameterised by a range that was also greater than the default parameter-sensitivity-analysis values (−0.008 to −0.001) and −0.004 provided the best fit.
Ecological sensitivity
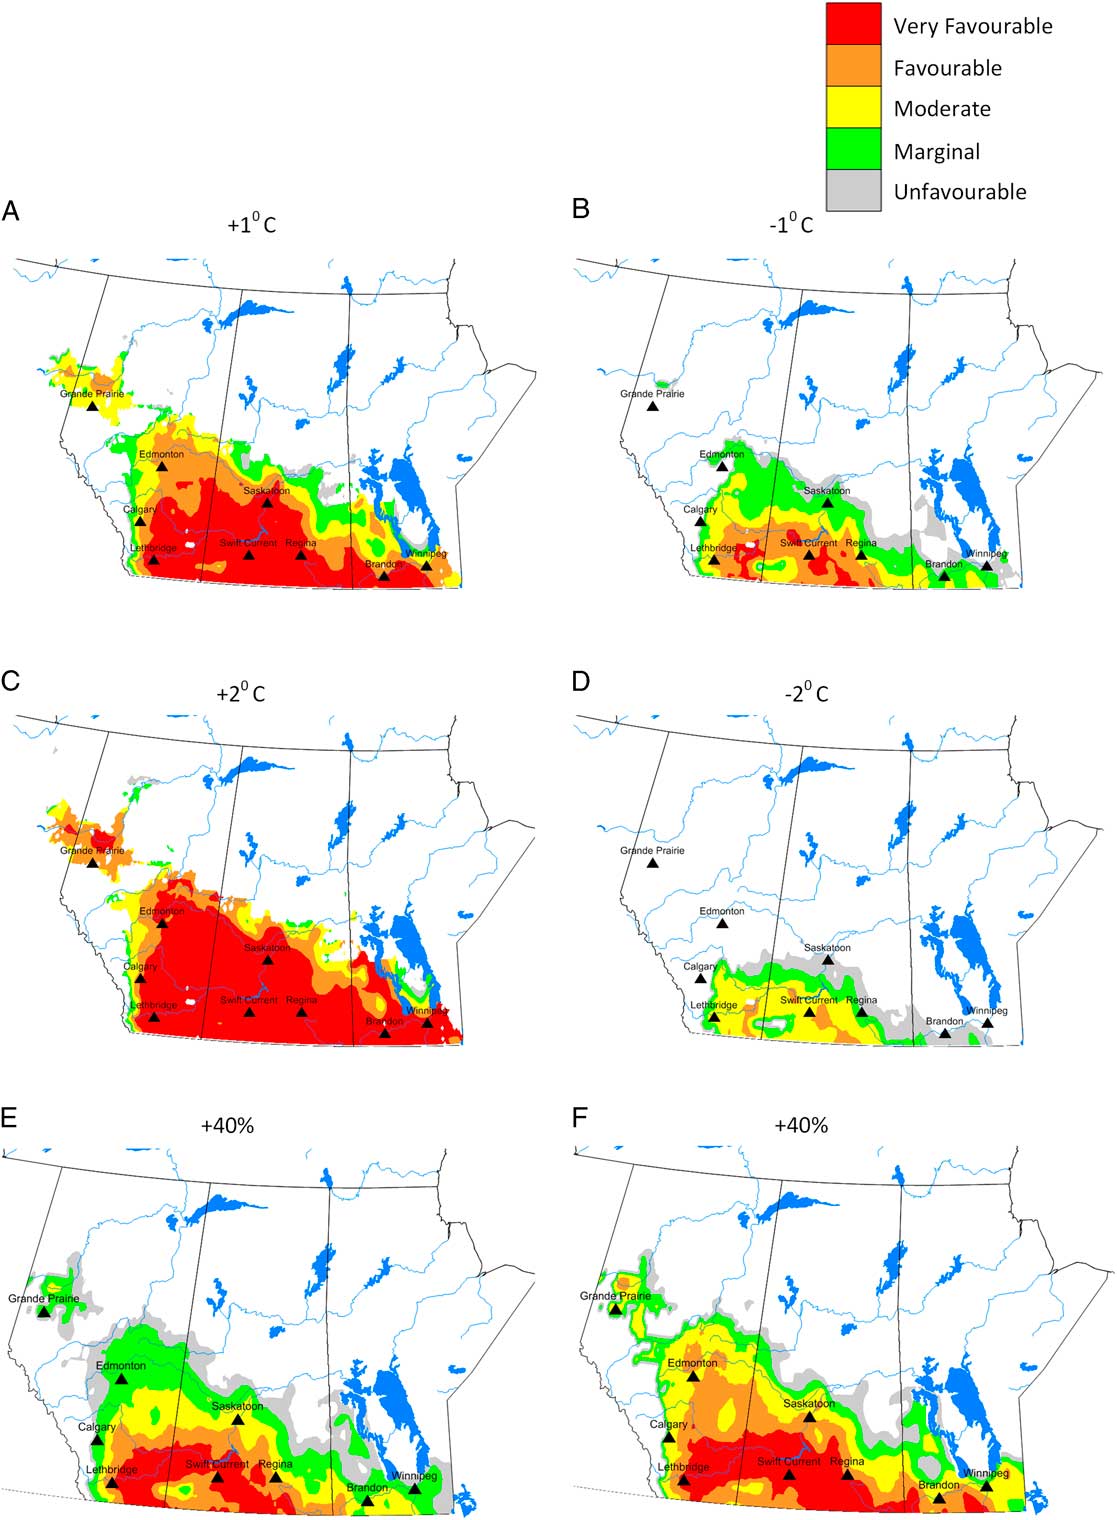
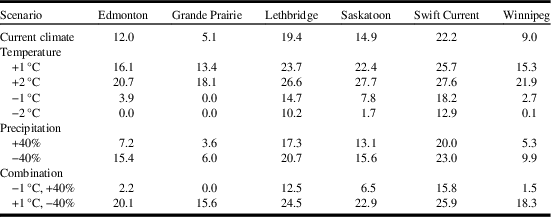
As mentioned, ecological sensitivity analysis was conducted to determine how the distribution and relative abundance of C. cinctus respond to incremental adjustments in temperature and precipitation, based on current climate values. This type of analysis has been reported for Sitona lineatus (Linnaeus) (Coleoptera: Curculionidae) where it was shown that the species was more sensitive to changes in precipitation than temperature (Olfert et al. Reference Olfert, Weiss, Cárcamo and Meers2012). Furthermore, it has been shown that species response to changes in temperature and precipitation were greater in locations near the outer limits of their geographical range than for locations that were near the central core range (Olfert and Weiss Reference Olfert and Weiss2006a). Analysis was based on how populations with ecoclimatic index ≥ 15 (rated as favourable or very favourable) would respond in each scenario. Climate data were incrementally changed for mean temperature (+1 °C, −1 °C, +2 °C, −2 °C), precipitation (+40% and −40%) and two temperature/precipitation combinations to represent warm/dry conditions (+1 °C, −40%) and cool/wet conditions (−1°C, +40%).
Compared to current climate, a 1 °C increase in temperature resulted in a doubling of the area that was at risk for C. cinctus infestation. For example, the area with ecoclimatic index ≥ 15 increased from 28.9% of the current area to 54.9% (Table 3). Compared to current climate (Fig. 3), growing seasons that were 1 °C warmer than normal were predicted to result in increases in range and ecoclimatic-index values (Fig. 4A). Other than southern Saskatchewan and southern Alberta, ecoclimatic-index values in most regions increased by one risk category. For example, Saskatoon, Saskatchewan was predicted to change from suitable to the very favourable category (Table 4). Based on current climate, Grande Prairie, Alberta was rated as marginal (ecoclimatic index=5.1), but a scenario with a 2 °C increase in temperature would result in this area increasing to the favourable risk category (Table 4). The very favourable range for C. cinctus would increase to include southwestern Manitoba, Saskatoon, and central Alberta. In the Peace Lowland Ecoregion, ecoclimatic-index values would increase such that the region would shift from marginal/suitable to suitable/favourable. A 2 °C increase in temperature would result in favourable to very favourable conditions across most of the prairies and boreal plains ecozones with 79.4% of the area categorised as very favourable (Table 3; Fig. 4C) compared to 28.9% currently. Temperature decreases of 1 °C and 2 °C were predicted to reduce both range and ecoclimatic-index values such that C. cinctus populations would be reduced to a very small region (−1°C in Fig. 4B) or non-existent (−2 °C in Fig. 4D).

Fig. 4 Predicted ecoclimatic-index values for Cephis cinctus in western Canada for temperatures that are 1 °C warmer (A) and cooler (B) than current climate; and 2 °C warmer (C) and cooler (D) than current climate. The final two maps reflect precipitation levels that are 40% greater (E) and 40% less (F) than current climate. Ecoclimatic-index values are presented in five categories: grey=unfavourable (1–5); green=marginal (5–10); yellow=suitable (10–15); orange=favourable (15–20), and red=very favourable (> 20).
Table 3 Canadian agricultural area in western Canada (British Columbia, Alberta, Saskatchewan, Manitoba) with ecoclimatic-index (EI) values ≥15 (favourable to very favourable risk categories) for Cephus cinctus, based on current climate and nine incremental scenarios (% of total area).
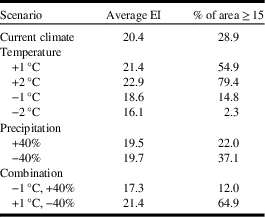
Table 4 Effect of changes in temperature and precipitation from current values on ecoclimatic-index values for Cephus cintus at six locations in western Canada.
Notes: A geographic rectangle (1° latitude by 1° longitude) was used to delineate a geographic region around each location, and ecoclimatic-index values were averaged across this area.
These predictive model results agree with early studies that indicated that drier years are more favourable for C. cinctus development than wet seasons (Criddle Reference Criddle1922). Cold, wet conditions mayretard pupation and emergence (or cause mortality). A 2 °C decrease in temperature would reduce suitable areas to 2.3% of western Canadian cereal cropland. The magnitude of change in distribution and relative abundance was also related to precipitation, though to a lesser extent than for temperature (Table 3; Fig. 4E–F). Changes in precipitation were predicted to affect relative abundance more than distribution. Dryer growing seasons were predicted to result in greater ecoclimatic-index values across central Alberta and the Peace Lowland Ecoregion (Fig. 4F). Olfert and Weiss (2006a) reported similar increases in ecoclimatic-index values for Melanoplus sanguinipes (Fabricius) (Orthoptera: Acrididae) in a bioclimatic study of grasshopper distribution and density in western Canada.
General circulation model analysis
A number of studies using general circulation models have predicted that changes in relative abundance, phenology, and distribution of crop pests in western Canada may occur as a result of climate change (Olfert and Weiss Reference Olfert and Weiss2006b; Mika et al. Reference Mika, Weiss, Olfert, Hallett and Newman2008; Mika and Newman Reference Mika and Newman2010; Olfert et al. Reference Olfert, Haye, Weiss, Kriticos and Kuhlmann2016a, Reference Olfert, Weiss and Elliott2016b, Reference Olfert, Weiss, Elliott and Soroka2017). The impact of climate change on seasonal phenology, distribution, and relative abundance can vary by species even within the same genus. Olfert et al. (Reference Olfert, Weiss, Elliott and Soroka2017) reported that the predicted responses of Phyllotreta cruciferae (Fabricius) and Phyllotreta striolata (Goeze) (Coleoptera: Chrysomelidae) to future climates differed, based on location, general circulation model, and time period. Studies have demonstrated that, when compared to current distribution, species shifts occur in a northward or northwest direction and are often associated with range contraction across southern limits (Olfert et al. Reference Olfert, Weiss and Kriticos2011). Northward expansion was related to increased temperature-index values during the growing season, longer growing seasons and related increase of degree-days required to complete its lifecycle, and reduced cold stress during the winter. Changes in relative abundance were also reported. In western Canada, ecoclimatic-index changes for Sitodiplosis mosellana (Géhin) (Diptera: Cecidomyiidae) were greatest near the outer limits of the range and exhibited minimal change near the centre of its core range (Olfert et al. Reference Olfert, Weiss and Elliott2016b). Studies have indicated that predicted species response to climate change was dependent on selection of general circulation model and resolution of climate data (Mika et al. Reference Mika, Weiss, Olfert, Hallett and Newman2008; Kriticos and Leriche Reference Kriticos and Leriche2010; Mika and Newman Reference Mika and Newman2010).
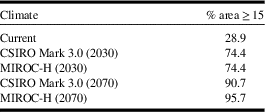
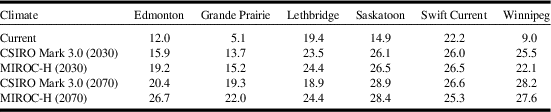
Model projections for changes in C. cinctus distribution and relative abundance were similar for both general circulation models, CSIRO Mark 3.0, and MIROC-H, within a time period (Fig. 5). Relative to current climate, the degree of change was greater between current climate (Fig. 3) and 2030 (Fig. 5A, C); than between 2030 and 2070 (Fig. 5B, D). The area with ecoclimatic index > 15 was predicted to increase from 28.9% for current climate to approximately 74.4% for 2030 and between 90.7% (CSIRO Mark 3.0) and 95.7% (MIROC-H) for 2070 (Table 5). Similar observations were reported for climate change studies of S. mosellana (Olfert et al. Reference Olfert, Weiss and Elliott2016b), and P. cruciferae and P. striolata in western Canada (Olfert et al. Reference Olfert, Weiss, Elliott and Soroka2017). Across the Prairies Ecozone and Boreal Plains Ecozone, changes in ecoclimatic index were greater than changes in geographic distribution. Distributions extended north of Winnipeg, Manitoba, and north of Grande Prairie, Alberta to Fort Vermillion, Alberta. Both general circulation models produced projections for 2030 that indicated most of the Prairies Ecozone and Boreal Plains Ecozone would be categorised as very favourable and, relative to current climate, would suggest the potential for development of economic populations could expand into areas that do not currently experience economic losses associated with C. cinctus. For 2030, ecoclimatic-index values for Edmonton, Alberta, were predicted to increase from ecoclimatic index=12–15.9 (CSIRO Mark 3.0) and to 19.2 (MIROC-H). In southern Alberta and Saskatchewan, ecoclimatic-index values were predicted to remain similar or decrease for 2070. Compared to the 2030 projection for CSIRO Mark 3.0, the 2070 projection indicated that ecoclimatic-index values would decrease for Lethbridge, Alberta (Table 6). This reduction was predicted to be marginally greater for the CSIRO Mark 3.0 general circulation model. The MIROC-H 2070 projection suggested that most of the Peace Lowland Ecoregion would be categorised as very favourable. Similar results for the Peace Lowland Ecoregion were reported for M. sanguinipes, Peristenus digoneutis Loan, P. cruciferae, and P. striolata (Olfert et al. Reference Olfert, Weiss and Kriticos2011, Reference Olfert, Weiss, Cárcamo and Meers2012, Reference Olfert, Haye, Weiss, Kriticos and Kuhlmann2016a, Reference Olfert, Weiss, Elliott and Soroka2017).
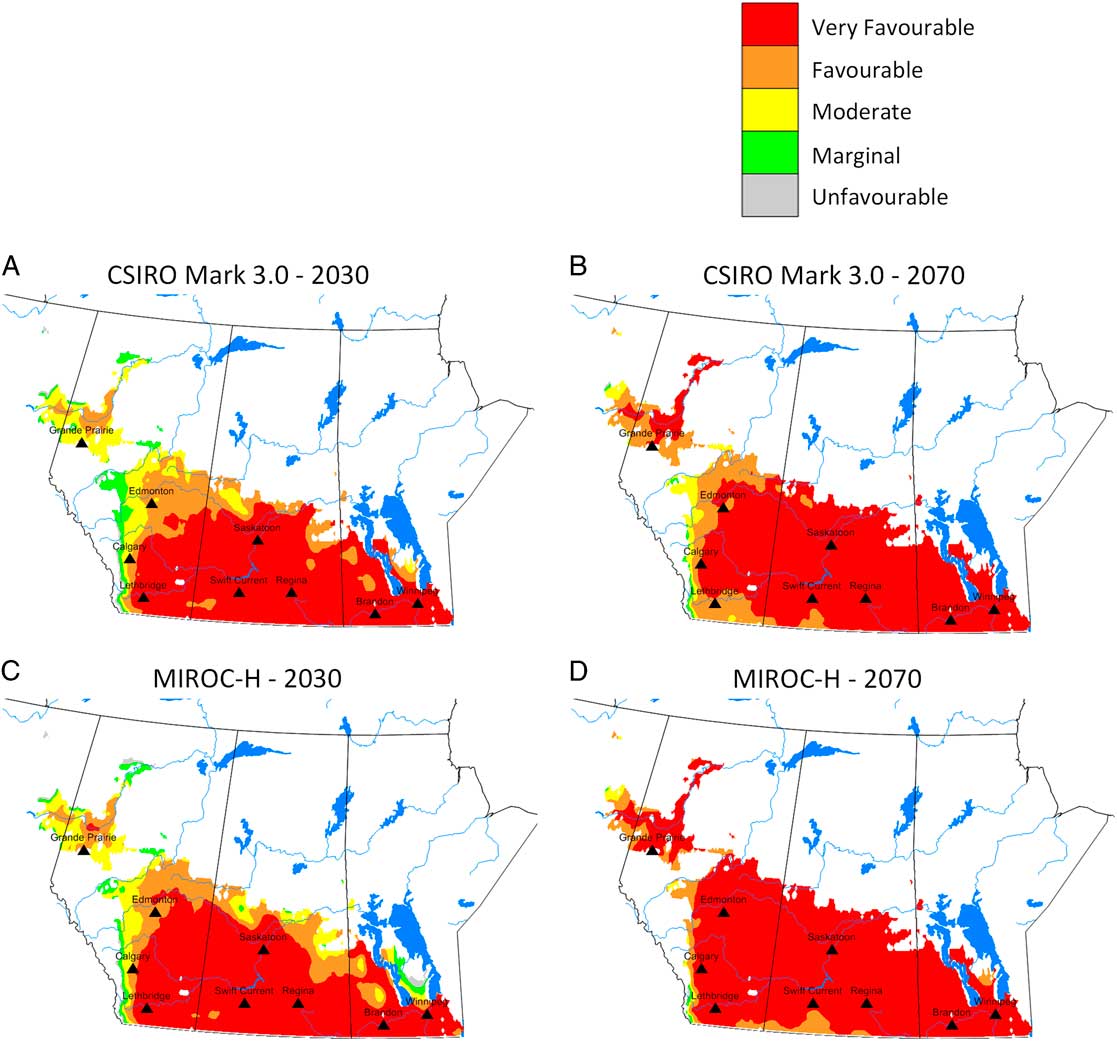
Fig. 5 Predicted relative abundance and potential distribution for Cephis cinctus in western Canada based on CSIRO Mark 3.0 general circulation model projections for 2030 (A) and 2070 (B) and MIROC-H general circulation model projections for 2030 (C) and 2070 (D). Ecoclimatic-index values were presented in five categories: grey=unfavourable (1–5), green=marginal (5–10), yellow=suitable (10–15), orange=favourable (15–20), and red=very favourable (> 20).
Table 5 Ecoclimatic-index values and percent area (ecoclimatic index ≥ 15) for Cephus cintus based on current climate and two general circulation models (CSIRO Mark 3.0 and MIROC-H) for 2030 and 2070.

Notes: Values were based on Canadian cereal-growing agricultural areas in western Canada (British Columbia, Alberta, Saskatchewan, Manitoba) with ecoclimatic index ≥ 15.
Table 6 Ecoclimatic-index values for Cephus cintus at six locations in western Canada.

Notes: A geographic rectangle (1° latitude by 1° longitude) was used to delineate a geographic region around each location, and ecoclimatic-index values were averaged across this area.
Concluding comments
The foremost factor determining the distribution and abundance of most insects, plant pathogens, and their host plants is climate (Sutherst Reference Sutherst2000). The issue of a changing climate, due to human activities, has raised concern within the agricultural community. Depending on levels of greenhouse gas emissions, climate change scenarios have predicted that temperatures over the next 100 years will increase by 1–3 °C, and could be as high as 7.5 °C for more extreme gas emission scenarios (Cohen and Miller Reference Cohen and Miller2001). Rosenzweig et al. (Reference Rosenzweig, Iglesias, Yang, Epstein and Chivian2000) reported that the 1990s had been the warmest decade on record. From an agricultural perspective, the potential effects of a warmer climate on ecosystem services are significant, and include altering germination and phenology of both crop plants and weeds, seasonal expression of crop diseases, and emergence of insects from overwintering sites in northern ecosystems (Gitay et al. Reference Gitay, Brown, Easterling and Jallow2001). Further to insect pests, a warmer climate can result in increased developmental rates, shortened generation times, increased reproductive capacity and a shift in geographic distribution and population density (Porter et al. Reference Porter, Parry and Carter1991). Through increased awareness, the agricultural industry can be more proactive in monitoring, detecting, and managing crop pests.
This study developed a bioclimatic simulation model of C. cinctus to assess climatic factors influencing shifts in population geographic distribution and density. The results fostered a better understanding of how C. cinctus should respond to selected climate variables. Various future climate change model inputs were applied in this study to assess the response of C. cinctus to likely future climate conditions. Our model output predicted that the changes in C. cinctus distribution and relative abundance were greatest between time periods (current, 2030, 2070) and similar for both general circulation models. The degree of change was predicted to be greater between current climate and 2030 than between 2030 and 2070.
The predictions from the general circulation models suggest that Canadian wheat production will be challenged by more frequent, more widespread, and more intense C. cinctus attacks in the future. Producers from all cereal-growing areas in western Canada will benefit from being informed of available management tools to mitigate crop loss from C. cinctus. Enhanced area wide monitoring and field scouting should be considered to alert the industry to increased risks in the future. Managing C. cinctus damage requires an integrated strategy of cultural and biological controls (Beres et al. Reference Beres, Dosdall, Weaver, Cárcamo and Spaner2011b; Rand et al. Reference Rand, Richmond and Dougherty2017). Crop rotation, away from cereals, will become more important in newly affected areas, and perhaps even management of alternative grass hosts may be required (Keren et al. Reference Keren, Menalled, Weaver and Robison-Cox2015). Climate change could potentially force uncultivated C3 grasses to be moved more northward, perhaps presenting more host species for this pest (Cockrell et al. Reference Cockrell, Griffin-Nolan, Rand, Altilmisani, Ode and Peairs2017).
Importantly, continued investment in developing, understanding, and modernising solid-stemmed varieties of wheat are justified. Currently, Canadian solid-stemmed varieties exist in bread wheat and have recently been released in durum. However, not all wheat classes have solid-stemmed options and the relationship between sawfly and solid stems is subject to change. Expression of stem-solidness in bread wheats depends on weather conditions such as light exposure (Beres et al. Reference Beres, Hill, Cárcamo, Knodel, Weaver and Cuthbert2017). As a result, the industry may benefit by assessing how solid stem wheat cultivars perform in more northern varietal trials. Other types of stem solidness such as early pith expression (Varella et al. Reference Varella, Talbert, Hofland, Buteler, Sherman and Blake2016) and their interactions with the pest and its biocontrols should be explored. As a native insect, C. cinctus has a high level of genetic variability (Lesieur et al. Reference Lesieur, Martin, Weaver, Hoelmer, Smith and Morrill2016) and can adapt to new pressures. Forexample, in recent decades populations of C.cinctus in the United States of America have developed earlier phenology to be able to attack winter wheat (Lesieur et al. Reference Lesieur, Martin, Weaver, Hoelmer, Smith and Morrill2016). There currently are no Canadian solid-stemmed winter wheats.
The abiotic factors predicted in this study to impact the distribution and density of C. cinctus will also impact the role of biological control agents in population dynamics of C. cinctus, as well as the evolution of the host plants. Rand et al. (Reference Rand, Richmond and Dougherty2017) calculated that parasitism rates of 68% are needed to stop C. cinctus population growth. Holmes et al. (Reference Holmes, Nelson, Peterson and Farstad1963) reported that parasitism rates increase in years when harvest is delayed, and that it takes a couple years of delayed harvest to significantly impact C. cinctus populations. Currently, B. cephi is the dominant parasitoid of C.cintus in western Canada. A changing climate may enhance environmental opportunities for B.lissogaster, a second parasitoid more common in North Dakota, United States of America (Meers Reference Meers2005). For parasitism to remain an important factor in C. cinctus control, parasitoid populations would also be required to shift with their hosts. For example, Olfert et al. (Reference Olfert, Elliott and Hartley2009) reported that the parasitoid, Macroglenes penetrans (Kirby) (Hymenoptera: Pteromalidae) successfully managed major geographic shifts of their host, S. mosellana. More information is needed related to the interactions between parasitoids, insect pathogens, C. cinctus, and the evolution of its host plants in relation to a changing climate. The interactions, coupled with solid-stem cereal varieties, will largely determine the pest status of C. cinctus in Canada going forward.
Acknowledgements
The authors would like to acknowledge the financial support of the Western Grains Research Foundation. T. Kaye’s input into digitising the archive maps and S. Barkley’s input to field surveys are also much appreciated.