


1. Introduction
Social networks are a fundamental aspect of human life and influence many economic situations, such as peer effects, information transmission, and job search (Jackson et al., Reference Jackson, Rogers and Zenou2017; Bailey et al., Reference Bailey, Cao, Kuchler, Stroebel and Wong2018). Several studies in the network formation literature show that we are more likely to befriend individuals who are similar to us in various characteristics (homophily) and those we are exposed to by chance (McPherson et al., Reference McPherson, Smith-Lovin and Cook2001; Marmaros & Sacerdote, Reference Marmaros and Sacerdote2006; Currarini et al., Reference Currarini, Jackson and Pin2009). Despite significant advances in understanding how relationships form (see Jackson et al., Reference Jackson, Nei, Snowberg and Yariv2023), much remains to be established regarding how individual and pairwise characteristics interact in the creation of social connections. In this paper, we examine the role of reciprocal trust—the degree to which trust from each individual in a pair is reciprocated by the other—in shaping network formation.
The willingness of individuals to trust others is frequently argued to play a pivotal role in facilitating cooperation and fostering the formation of social capital (Putnam, Reference Putnam1995). The idea is that when this trust is met with trustworthiness (i.e., it is reciprocated), it allows a pair to generate surplus that would otherwise remain unrealized. High-trust individuals hold more positive beliefs about interactions with strangers and are more willing to invest in potential reciprocation. High reciprocal trust between a pair of individuals occurs when both members exhibit high levels of trust and this trust is validated by each other’s trustworthiness. According to the trust and social capital narrative, such dyads should be uniquely positioned to achieve greater benefits from their interactions, even amidst uncertainties about the returns to cooperation and in the absence of external enforcement mechanisms. Due to their enhanced capacity to capitalize on strategic interactions, pairs with higher reciprocal trust should be more likely to establish relationships, all else being equal. In this paper, we provide a rigorous empirical test of this hypothesis.
We investigate whether pairs’ reciprocal trust—the extent to which the trust of each individual in the pair is reciprocated by the other—is a determinant of social network formation among an incoming cohort of first-year undergraduate students at a university in Bogotá, Colombia. Our findings suggest that pairs’ reciprocal trust—at least as measured by the sum of the amounts that the individuals in each pair would have received in the role of sender when interacting with each other in a trust experiment—plays a negligible role in the formation of social ties among our subjects. We fail to reject the null hypothesis that reciprocal trust does not affect link formation probabilities, and we retain sizeable power when doing so (conditional on the hypothesis that the true effect of reciprocal trust is comparable in size to other significant determinants of social network formation). Although individuals’ prosocial beliefs and behaviors may contribute to forming new relationships, our results suggest that any such relationship is complex. In particular, the commonly used trust experiment, even with additional survey data, fails to capture any relevant prosocial tendencies in network formation.
On the other hand, our results demonstrate that time of exposure (measured by the number of course credits shared between students), previous acquaintance, and several demographic characteristics significantly influence network formation. We find that a one standard deviation increase in the shared number of course credits due to class assignmentFootnote 1 is associated with a 7–10 percentage point increase in the likelihood of friendship formation. Prior acquaintanceship also increases the probability of forming new relationships. Finally, our study uncovers a distinct pattern of homophily based on socioeconomic status and hometown within the students’ networks, highlighting the significant role demographic traits play in shaping network structures. Overall, our results point to a picture where relationships are more the outcome of chance and demographics than the result of pairs’ reciprocal trust. These results provide insights on improving integration between people starting higher education in the presence of segregation and socioeconomic differences.
This paper uses data from an entire incoming cohort of first-year economics undergraduate students at a university in Bogotá. The data was collected in two stages. In the first stage, we asked each of the students comprising the entire cohort to participate in activities to measure their trust and trustworthiness toward strangers before they had significant chances to get to know each other and socialize. This feature of the data collection strategy allows us to avoid the possibility of reverse causality from relationships to pairs’ reciprocal trust.Footnote 2 Specifically, we conducted our measurements of trust and trustworthiness on the university welcome day, which is the first day in which students formally attend the university campus.Footnote 3 These activities comprised (1) a trust experiment, taken from Berg et al. (Reference Berg, Dickhaut and McCabe1995), and (2) two survey questions adapted from Glaeser et al. (Reference Glaeser, Laibson, Scheinkman and Soutter2000).Footnote 4 We focus on trust and trustworthiness because they allow us to construct a pairwise-specific measure of “reciprocal trust” which measures the extent to which the trust of each individual in a pair is reciprocated by the other individual (see Subsection 3.1).
In the second stage of the data collection process—conducted at the end of the first academic semester (i.e., four months after the measurement of trust and trustworthiness)—we administered a survey to elicit five types of social networks representing different relationships (greeting, having lunch together, studying together, confiding in, and friendship). This sample of students provides a dataset encompassing 1,485 potential undirected connections, a measure of reciprocal trust for each pair, and various individual and dyadic factors that are likely to play a critical role in network formation.
We also utilize administrative data from turnstiles at all entry and exit points on the university campus, which record students’ entry and exit times. This data allows us to construct measures of the students’ social networks at various points in time. Following the methodology outlined by Velasco (Reference Velasco2023), we classify a pair of students as linked if they swipe their university IDs at the same campus entrance, in the same direction (either entering or exiting), within a time window of three seconds or less, and if this pair of IDs is observed entering or exiting the campus together at least twice within an academic semester. This methodology allows us to track the development of students’ networks in the periods following our survey on network elicitation and to explore the degree to which reciprocal trust influences the subsequent characteristics of these networks. We additionally use this data to investigate whether reciprocal trust might explain the students’ social networks prior to our network elicitation survey. To construct the short-term networks, we adopt a more flexible definition of turnstile-based interactions than Velasco (Reference Velasco2023)’s, considering pairs of students who are recorded moving together within a three-second window at least once a month. This approach allows us to track and analyze monthly interactions from the date of the experiment until December 2017.
We estimate linear probability models (LPMs) to identify how pairs’ reciprocal trust, demographic characteristics, and exogenous variation in time of exposure predict link formation probability in the networks elicited.Footnote 5 The estimates of reciprocal trust on link formation probabilities are negative and statistically insignificant. Moreover, we can safely assert that reciprocal trust does not have an impact on link formation probability as quantitatively meaningful as other characteristics, such as time of exposure, knowing each other from before, hometown, and differences in socioeconomic status.Footnote 6 Using turnstile data to analyze the impact of reciprocal trust on relationship formation over time, our findings confirm that reciprocal trust is neither a statistically nor an economically significant factor in determining students’ social networks, both in the short term and the long term.
1.1 Related literature
This paper contributes to the expanding body of research on the empirical determinants and dynamics of network formation (Jackson et al. (Reference Jackson, Nei, Snowberg and Yariv2023)). A common theme within this field is homophily along demographic lines, whereby individuals tend to form connections with others who share similar characteristics (see Jackson, Reference Jackson2010; Bramoullé et al., Reference Bramoullé, Galeotti and Rogers2016, and Jackson et al., Reference Jackson, Rogers and Zenou2017). We contribute to this endeavor by studying the link between pairs’ reciprocal trust and relationship formation. We focus on trust and trustworthiness due to their perceived importance in enhancing pairs’ abilities to cooperate in social dilemmas (Putnam, Reference Putnam1995). Broadly, our analysis confirms the importance of homophily in shaping networks, highlighting segregation based on socioeconomic status and hometown across various student social networks. Conversely, we find that reciprocal trust between pairs—measured by total potential earnings in a trust experiment—plays a negligible role in the formation of relationships among students.
We also speak to the social capital literature, which frequently relates trust and social networks. Trust has often been bundled into the very definition of social capital.Footnote 7 Other times, measures of trust have been used as proxies for social capital. While trust and networks might both play a role in determining social capital, we contribute to this literature by shedding light on the interconnection between pairs’ reciprocal trust and network formation. Having more relationships, or being embedded in social networks with certain structural properties, may encourage people to trust more (Buskens, Reference Buskens1998 and Jackson et al., Reference Jackson, Rodriguez-Barraquer and Tan2012). Kosse et al. (Reference Kosse, Deckers, Pinger, Schildberg-Hörisch and Falk2020) provides causal evidence on the positive effect of enriching a person’s social environment on his or her trust. We contribute to this literature by examining the link between pairs’ reciprocal trust and relationship formation in real-life networks among students over an extended timeframe, including months and years after the trust game has been played.Footnote 8
Our study contributes to the literature on the external validity of experimentally elicited measures of social preferences, particularly trust (see Galizzi & Navarro-Martinez, Reference Galizzi and Navarro-Martinez2019 for a review). Consistent with prior research, we find that both experimentally elicited trust and trustworthiness are associated with self-reported prosocial behavior (Banerjee et al., Reference Banerjee, Galizzi and Hortala-Vallve2021; Finan & Schechter, Reference Finan and Schechter2012; Glaeser et al., Reference Glaeser, Laibson, Scheinkman and Soutter2000). However, the relationship between trust game behavior and observed prosocial behavior remains inconclusive. For example, while Galizzi & Navarro-Martinez (Reference Galizzi and Navarro-Martinez2019) find little meaningful connection between trust game behavior and prosocial actions following the experiment, Baran et al. (Reference Baran, Sapienza and Zingales2010) show that more trustworthy individuals tend to make larger charitable donations. Similarly, Karlan (Reference Karlan2005) find that trustworthy individuals are more likely to repay loans, whereas more trusting individuals are less likely to do so. We find that behavior in the trust experiment is a weak predictor of real-life friendship formation, even in the long run. This result remains robust even when lab-elicited measures of trust are supplemented with self-reported trusting behavior. While our design does not rule out a link between prosocial behavior in the lab and real-life prosociality, our findings suggest that either trust is not a key determinant of relationship formation or that commonly used measures of trust fail to accurately capture real-world trusting behavior.
Lastly, our paper contributes to a growing body of literature examining the causes of segregation in education, including that occurring within institutions. First, our finding that preexisting networks strongly predict social interactions complements prior research that finds high school networks largely explain students’ participation in social spaces like college clubs (Michelman et al., Reference Michelman, Price and Zimmerman2022). Second, we contribute to the evidence on how exposure to peers shapes social interactions within college. Our finding that exposure to peers significantly increases the chances of social interactions in the short- and long-terms in college, even after controlling for other student and dyadic characteristics, complements those from Marmaros & Sacerdote (Reference Marmaros and Sacerdote2006), Baker et al. (Reference Baker, Mayer and Puller2011), Mayer & Puller (Reference Mayer and Puller2008), and represents new evidence on the persistence of relationships formed early in college.Footnote 9
2. Design and protocols
We collected data from incoming first-year undergraduate students choosing economics as their major at a university in Bogotá. Our design consisted of two stages. We conducted the first stage on August 4, 2017, and its main goal was to measure the students’ trust and trustworthiness. Crucially, we carried out this stage on the university welcome day, which is the very first day in which incoming students formally attend the university campus. The rationale behind this choice was to measure the students’ trust and trustworthiness before they had significant opportunities to socialize, to avoid the possibility of reverse causality from relationships to trust and trustworthiness. We conducted the second stage online between December 7, 2017, and January 5, 2018, at the end of the first academic semester, and its main aim was to elicit social networks among the students. In what follows, we describe the design of the two stages in detail.
Our sample choice aimed at three goals. First, we chose a group of people for whom we could accurately measure trust and trustworthiness before they had significant opportunities to socialize. Second, we wanted our subjects to have many chances to get to know each other over an extended period of time after the measurement of trust and trustworthiness. Finally, we selected people for whom we could collect detailed information on many characteristics, at both the individual and the relationship level. Our strategy allows us to obtain measures of the subjects’ trust and trustworthiness in a controlled setting and gather precise information on numerous other variables of interest.
First stage. We directed the first stage to the $81$
students comprising the entire incoming undergraduate economics cohort of the first semester of
$81$
students comprising the entire incoming undergraduate economics cohort of the first semester of $2017$
, and its main goal was to measure their trust and trustworthiness. We conducted this stage in a single session on the university welcome day. The session lasted 90 minutes. Out of the
$2017$
, and its main goal was to measure their trust and trustworthiness. We conducted this stage in a single session on the university welcome day. The session lasted 90 minutes. Out of the $81$
intended subjects,
$81$
intended subjects, $72$
were present on the welcome day. All of these 72 students agreed to participate in the experiment. We gave each student four paper handouts labeled A, B, C, and D. The Online Appendix contains an English translation of the handouts. Handout A is a general description of the activity and an informed consent form that we required the students to complete for participating in the session. Handout B is a detailed description of the trust experiment. Handout C is a form for recording the students’ strategies in the experiment. Finally, handout D is a questionnaire with eight questions on generalized trust, particularized trust toward friends and neighbors, and particularized trustworthiness toward friends and neighbors,Footnote
10
and six (1–3 and 6–8) questions on individual characteristics.Footnote
11
$72$
were present on the welcome day. All of these 72 students agreed to participate in the experiment. We gave each student four paper handouts labeled A, B, C, and D. The Online Appendix contains an English translation of the handouts. Handout A is a general description of the activity and an informed consent form that we required the students to complete for participating in the session. Handout B is a detailed description of the trust experiment. Handout C is a form for recording the students’ strategies in the experiment. Finally, handout D is a questionnaire with eight questions on generalized trust, particularized trust toward friends and neighbors, and particularized trustworthiness toward friends and neighbors,Footnote
10
and six (1–3 and 6–8) questions on individual characteristics.Footnote
11
In the trust experiment, we endowed every participant with $20,000$
Colombian Pesos (
$20,000$
Colombian Pesos ( $\$ COP$
) (about
$\$ COP$
) (about $USD \$ 7$
). In every anonymously created sender-receiver pair, each sender had to decide how much money
$USD \$ 7$
). In every anonymously created sender-receiver pair, each sender had to decide how much money $s$
to transfer to the receiver in a range from
$s$
to transfer to the receiver in a range from $0$
to
$0$
to $COP \$$ $20,000$
in
$20,000$
in $ COP \$$ $2,000$
increments. For each possible
$2,000$
increments. For each possible $s$
chosen by the sender, the receiver would receive
$s$
chosen by the sender, the receiver would receive $3s$
; that is, three times the money sent to him or her by the sender. The receiver had to decide how much money to send back to the receiver,
$3s$
; that is, three times the money sent to him or her by the sender. The receiver had to decide how much money to send back to the receiver, $f \left ( 3s \right )$
, for each possible
$f \left ( 3s \right )$
, for each possible $s$
he or she could have received, following the convention of the strategy method in the trust game. For each
$s$
he or she could have received, following the convention of the strategy method in the trust game. For each $s$
, the sender could send back any amount in a range from
$s$
, the sender could send back any amount in a range from $0$
to
$0$
to $3s$
in
$3s$
in $ COP \$$ $ 2,000$
increments. The monetary payoffs at the end of the game for a sender-receiver pair in which the sender uses strategy
$ 2,000$
increments. The monetary payoffs at the end of the game for a sender-receiver pair in which the sender uses strategy $s$
and the receiver uses strategy
$s$
and the receiver uses strategy $f \left ( 3s \right )$
are
$f \left ( 3s \right )$
are $COP \$$ $20,000$ $-s+f \left ( 3s \right )$
to the sender and
$-s+f \left ( 3s \right )$
to the sender and $COP \$$ $20,000$ $+3s-f \left (3s \right )$
to the receiver.
$+3s-f \left (3s \right )$
to the receiver.
We described the two roles in the trust experiment to all participants. We informed them that each had to report how they would behave both as a sender and as a receiver, as we would then assign these roles randomly,Footnote
12
and randomly match senders and receivers to implement their reported strategies and realize monetary payoffs.Footnote
13
Handout B included instructions for the strategies available to the sender and the receiver, the functions used to calculate the monetary payoffs, and a detailed example. We read out loud the instructions and the example and conducted a question-and-answer session right afterward. We then instructed the students to fill out handout C, which contained the strategy sets for the sender and the receiver. Specifying the strategy for the role of sender entailed stating one among 11 (0–10) transfer options in $\Delta$
units. Specifying the strategy for the role of receiver entailed stating
$\Delta$
units. Specifying the strategy for the role of receiver entailed stating $11$
contingent transfers, one for each of the
$11$
contingent transfers, one for each of the $11$
possible amounts received from the sender. For each possible amount that he or she might receive, the receiver could choose to send back to the sender an amount ranging from
$11$
possible amounts received from the sender. For each possible amount that he or she might receive, the receiver could choose to send back to the sender an amount ranging from $0$
to the entire amount in
$0$
to the entire amount in $\Delta$
units.
$\Delta$
units.
After the experiment, the students filled out a survey contained in handout D. First, the survey contained eight questions aimed to measure generalized trust, particularized trust toward friends and neighbors, and particularized trustworthiness toward friends and neighbors. We report the questions below.
-
4. To what extent do you agree with the following statements (on a 1–5 scale, where 1 denotes total disagreement and 5 total agreement):
-
a. One cannot trust strangers.
-
b. When dealing with strangers it is important to be careful and not to readily trust them.
-
5.a. How many among your 10 closest friends have you lent money to?
-
5.b. How many among your 10 closest friends have lent money to you?
-
5.c. To how many among your 10 closest friends have you lent your belongings (e.g., books, CDs, clothing, bicycle)?
-
5.d. How many among your 10 closest friends have lent their belongings (e.g., books, CDs, clothing, bicycle) to you?
-
5.e. How many among your 10 closest neighbors would you trust with your house keys?
-
5.f. How many among your 10 closest neighbors would trust you with their house keys?
Questions 4.a and 4.b measure generalized trust, questions 5.a and 5.c measure particularized trust toward friends, question 5.e measures particularized trust toward neighbors, questions 5.b and 5.d measure particularized trustworthiness toward friends, and question 5.f measures particularized trustworthiness toward neighbors. We adapted all the questions aimed to measure generalized and particularized trust from Glaeser et al. (Reference Glaeser, Laibson, Scheinkman and Soutter2000). However, note that what we refer to as questions measuring particularized trust (questions 5.a, 5.c, and 5.e), Glaeser et al. (Reference Glaeser, Laibson, Scheinkman and Soutter2000) identifies as questions measuring past trusting behavior. We think of these questions as aimed to measure particularized trust because they explicitly refer to particular groups of people (i.e., friends and neighbors) to which trust is directed, instead of unknown individuals (i.e., strangers). Our aim in collecting this information was to have additional (non-lab) measures of trust and trustworthiness that we could use in combination with our main (lab) measures of trust and trustworthiness to reduce possible measurement error concerns. The survey also included five questions on demographic characteristics (sex, age, number of siblings, number of friends outside the university, number of people in the cohort that the person knew from before starting university) and one question on self-assessed happiness.
Second stage. We conducted the second stage of the data collection process four months after the first stage (i.e., at the end of the first academic semester), and its goal was to elicit some of the networks of relationships among the students comprising the entire incoming cohort of 2017. Additionally, we asked the participants questions on individual characteristics. We sent emails to the students asking them to complete an incentivized survey.Footnote 14 We elicited social networks as follows. First, we presented each student with the list of names of the other students invited to complete the survey (in random order), and we asked him or her to indicate the students who he or she greeted (henceforth, hello partners). Specifically, for each student on the list, we asked him or her to tick a box if they would say hi to that student upon encountering him or her. Secondly, we presented each student with his or her list of hello partners and, for each of them, we asked the student to check one or more of six boxes acknowledging the following relationships: (1) “I met this person before starting university,” (2) “I frequently have lunch with this person,” (3) “I frequently study or work together with this person,” (4) “I share my personal feelings with this person,” (5) “I believe this person is a friend of mine,” and (6) “None of the previous options apply to my relationship with this person.”Footnote 15 Thanks to box (1) we can control for whether relationships formed before our intended socialization period (the first academic semester), and so we end up with five possible relationships (greeting, having lunch together, studying together, confiding in, and friendship).
Besides questions to elicit networks, the survey included questions on many individual characteristics that we suspect to play a role in relationship formation. The rationale behind this design is that isolating the impact of reciprocal trust on network formation requires controlling for variables that might affect the creation of social links and correlate with trust and trustworthiness. In particular, we collected information on the number of siblings, the number of friends enrolled in the same university met before starting university, the number of friends enrolled in the same university met after starting university, the number of friends not enrolled in the same university, weekly hours spent socializing with friends enrolled in the same university, weekly hours spent socializing with friends not enrolled in the same university, weekly hours spent doing physical activities, hobbies, age, eye color, hair color, height, weight, whether wearing glasses, whether wearing tattoos, whether wearing piercings, whether smoking, whether attending parties, whether their hometown is Bogotá, and four personality questions. In the latter questions, we asked the students to rate on a scale from 1 to 5 how much they perceived themselves as realistic, introverted, inhibited, and shy. Finally, we asked the students to rate on a scale from 1 to 5 how much they agreed with the following statements: “I am very sociable,” “I am satisfied with my social life,” “making friends at university is easier than I thought,” and “I am satisfied with the number of friends I have.” In addition to the data collected with our survey questions, our empirical analysis uses administrative data from the university on several student characteristics, such as the scores obtained at the high school exit examination, their GPAs at the end of the first academic semester, and their socioeconomic status. Moreover, we use the administrative data to obtain information on the time that each pair of students are exposed to each other because assigned to the same classrooms during the first semester.
Out of the 81 students comprising the entire cohort, 72 participated in the activities to measure their trust and 70 out of the 72 provided complete answers to the trust questionnaires.Footnote 16 Out of these 72 students, 58 participated in the activities to measure their networks. We could obtain complete administrative information for 55 students out of the latter 58. The administrative data contains student characteristics at the moment of college entry such as age, gender, test scores from the high school exit exam students take prior to college enrollment, the household stratum that proxies the student socioeconomic status as well as the student’s class schedule which we use to construct measures of exposure to other students. This student sample results in a final dataset comprising a potential 1,485 undirected relationships among the students.
Tracking social networks over time: Interactions elicited through the turnstile data. Beyond survey-derived networks, we also harness university administrative records, specifically leveraging data from student ID swipes at campus turnstiles. Adopting the methodology of Velasco (Reference Velasco2023), we match anonymized student IDs from our sample with turnstile data to identify pairwise interactions through synchronized campus movements. Specifically, we classify a pair of students as linked if their IDs are swiped within a three-second interval at the same turnstile and in the same direction (entering or exiting), provided this pattern occurs at least twice during the academic semester. This approach minimizes measurement error and closely approximates the interactions typically captured through surveys (see details of the validation process using our survey data in Appendix A). We use this approach to capture long-term networks, that is, students’ interactions between 2017-2 and 2019-2. To capture interactions occurring between August and November of 2017 (short-term networks), we relax this definition and classify a pair of students as linked if their IDs are swiped within a three-second interval, at the same turnstile and going in the same direction in the given month.
We have turnstile-based interaction data for all 70 students who provided complete responses in the trust experiment. For 64 of these students, we also have information on some of their “basic controls” (socioeconomic status, hometown, and high school exit exams). We discuss the results of our baseline specification with the extended sample of 70 students (2,415 dyads) and 64 students (2,016 dyads) in Appendix C.
The interactions elicited through turnstile data serve two key purposes in augmenting our survey-based network findings. Firstly, they act as a robustness check, validating the patterns observed in the survey-elicited interactions. Secondly, they provide insights into the dynamic nature of social interactions and the evolving role of reciprocal trust in shaping social networks over time. In particular, we can use the turnstile-based networks to keep track the real-time evolution of social relationships between students, starting from one-month post-admission up to five semesters thereafter.
3. Empirical analysis
In this section, we present our empirical analysis of the link between reciprocal trust and the probability of relationship formation. We begin by stating a precise definition of reciprocal trust (Subsection 3.1). In Subsection 3.2, we describe the subjects’ characteristics, behavior in the trust experiment, and networks. In Subsection 3.3, we present our baseline specification. In Subsection 3.4, we examine the effects of reciprocal trust on relationship formation over time. Overall, our results suggest that reciprocal trust does not play a relevant role in relationship formation among our subjects, while time of exposure, prior acquaintance, and homophily along some demographic traits, (such as socioeconomic status and hometown) are important determinants of social ties. In Subsection 3.5 we verify that our results are robust to changes in the way we measure reciprocal trust and to measurement error. We address measurement error by constructing obviously related instrumental variables (ORIV) as estimates of our coefficient of interest using two alternative measures of trust that rely on different data as proposed by Gillen et al. (Reference Gillen, Snowberg and Yariv2019). We also verify that our results are robust to the social relationships we analyze, and to the sample of dyads that we consider. Finally, we study the predictive power of reciprocal trust on link formation by regressing individual network statistics on individuals’ propensity to trust or to be trustworthy.
3.1 Reciprocal trust
Throughout the analysis, we study the relation between the likelihood that a link between a pair of agents $i$
and
$i$
and $j$
forms and
$j$
forms and $RecipTrust_{ij}$
—a measure of reciprocal trust between
$RecipTrust_{ij}$
—a measure of reciprocal trust between $i$
and
$i$
and $j$
. We define
$j$
. We define $RecipTrust_{ij}$
as the sum of the amounts that
$RecipTrust_{ij}$
as the sum of the amounts that $i$
and
$i$
and $j$
would have received in the role of the sender when interacting with each other in the trust experiment. To be precise, suppose that
$j$
would have received in the role of the sender when interacting with each other in the trust experiment. To be precise, suppose that $i$
and
$i$
and $j$
interact in the trust experiment with
$j$
interact in the trust experiment with $i$
as sender and
$i$
as sender and $j$
as receiver, and let
$j$
as receiver, and let $EfTrust_{ij}$
be the total amount that
$EfTrust_{ij}$
be the total amount that $i$
would obtain in the experiment (i.e., the amount that heFootnote
17
would receive back from
$i$
would obtain in the experiment (i.e., the amount that heFootnote
17
would receive back from $j$
, computed using
$j$
, computed using $i$
’s sender strategy and
$i$
’s sender strategy and $j$
’s receiver strategy).
$j$
’s receiver strategy). $EfTrust_{ij}$
is large to the extent that
$EfTrust_{ij}$
is large to the extent that $i$
sends a large amount to
$i$
sends a large amount to $j$
and
$j$
and $j$
, in response, returns a large amount to
$j$
, in response, returns a large amount to $i$
. This is the case because the amount that
$i$
. This is the case because the amount that $j$
can send back to
$j$
can send back to $i$
is limited by the amount that he receives from
$i$
is limited by the amount that he receives from $i$
in the first place.
$i$
in the first place. $EfTrust_{ij}$
is thus a measure of
$EfTrust_{ij}$
is thus a measure of $i$
’s trust in an anonymous partner that he would see effectively reciprocated if that partner happened to be
$i$
’s trust in an anonymous partner that he would see effectively reciprocated if that partner happened to be $j$
.
$j$
. $EfTrust_{ji}$
is defined analogously. Finally, we let:
$EfTrust_{ji}$
is defined analogously. Finally, we let:
 \begin{equation*} RecipTrust_{ij} = EfTrust_{ij} + EfTrust_{ji}. \end{equation*}
We are able to compute $RecipTrust_{ij}$
for every pair of agents because we implemented the strategic version of the trust experiment: we asked each subject to specify the amount they would send as a sender and the amount they would return as a receiver in response to each possible received amount.
$RecipTrust_{ij}$
for every pair of agents because we implemented the strategic version of the trust experiment: we asked each subject to specify the amount they would send as a sender and the amount they would return as a receiver in response to each possible received amount. $RecipTrust_{ij}$
captures how “productive” the partnership between
$RecipTrust_{ij}$
captures how “productive” the partnership between $i$
and
$i$
and $j$
in the trust experiment would have been for the senders, assuming both individuals played the role of sender with the other as the receiver.Footnote
18
$j$
in the trust experiment would have been for the senders, assuming both individuals played the role of sender with the other as the receiver.Footnote
18
There are several other ways to define measures based on the data elicited in the trust experiment that capture the concept we aim to embody with $RecipTrust_{ij}$
. In Section 3.5, we present the results of our analysis using various alternative definitions. Three of these five alternative measures create different indices based on the rich behavioral data from the experiment, while the other two rely on survey-elicited measures of trust. These alternative constructions aim to assess whether our results stem from our particular way of collapsing trust game behavior into a one-dimensional index, or from the more general individual attributes that they encode.
$RecipTrust_{ij}$
. In Section 3.5, we present the results of our analysis using various alternative definitions. Three of these five alternative measures create different indices based on the rich behavioral data from the experiment, while the other two rely on survey-elicited measures of trust. These alternative constructions aim to assess whether our results stem from our particular way of collapsing trust game behavior into a one-dimensional index, or from the more general individual attributes that they encode.
For instance, it could well be that some pairs of individuals exhibit highly reciprocal return strategies but choose not to send—perhaps due to cautious priors—which they could easily overcome in face-to-face interactions. Such dyads might be well-positioned for relationship formation in repeated, non-anonymous settings. Our robustness checks, including those that isolate trustworthiness or use belief-based survey measures, aim to probe whether such subtleties meaningfully affect our conclusions. Our findings are consistent across all of them.
This robustness analysis is especially important given the absence of a detailed theory connecting trust as measured in experimental settings with the nuanced, dynamic processes behind real-world friendship formation.
We test whether pairs of individuals exhibiting higher reciprocal trust are more likely to form new connections. Starting a relationship, especially with someone unfamiliar, often comes at an initial personal cost—whether in terms of time, effort, emotional investment, or other intangibles. For such relationships to flourish and endure, the initial investment by one party should be mirrored by the other, creating a balance of give-and-take. This dynamic is similarly observed in trust experiments: a sender benefits from transferring money only if the receiver reciprocates. Consequently, pairs marked by elevated reciprocal trust comprise individuals who are not only open to vulnerability (akin to initiating friendships) but also predisposed to repay kindness rather than exploit it. Over time, these attributes may catalyze the development of genuine friendships.
Naturally, trust is intertwined with other traits like extroversion and sociability, which also play important roles in bond formation. There is no clear way of determining the extent to which these characteristics are integral to trust, as we measure it, or merely parallel to it.
Furthermore, because friendship formation is shaped by non-anonymous, repeated interactions, individuals’ capacities for particularized trust and trustworthiness are likely far more relevant than trust toward strangers as captured by the trust experiment or by standard survey questions.
In light of these limitations, our objective is primarily predictive: our research design allows us to assess whether pairs with higher reciprocal trust are more likely to form relationships, controlling for many variables that the existing literature identifies as strong predictors of link formation. This question remains important given the central role that trust and trustworthiness toward strangers play in prominent theories of social capital (e.g., Putnam, Reference Putnam1995) and in the functioning of a variety of market and nonmarket institutions.
3.2 Students’ characteristics, behavior, and networks
Students’ characteristics. Table 1 presents summary statistics for the individual variables collected during both the first and second stages of the data collection process. The statistics reported refer to the sample of 55 students (1) who participated in the first stage, (2) who filled out the online survey we administered in the second stage, and (3) for whom we could obtain administrative data. Table 2 provides summary statistics for the administrative variables for the same sample of students. We proxy socioeconomic status with an administrative classification referred to as “estratificación socioeconómica” (socioeconomic stratification), which classifies residential real estates into six categories, ranging from 1 (corresponding to the poorest socioeconomic status) to 6 (corresponding to the richest one). The high school exit examination, officially referred to as the SABER 11 examination, is a standardized test administered to every graduating high school cohort in Colombia. This examination is similar to the SAT and ACT examinations in the United States, and its score ranges from 0 to 500.
Table 1. Summary statistics for the individual characteristics

Summary statistics under the “first stage” header refer to student characteristics obtained from survey questions asked on the “university welcome day,” immediately after the trust experiment took place. Summary statistics under the “second stage” header refer to characteristics obtained through survey questions administered at the end of the academic semester, immediately after eliciting the subjects’ social networks. The first stage summary statistics are based on a sample of 64 students who participated in the lab experiment during the first stage and for whom we have complete administrative data. The second-stage summary statistics refer to the sample of 55 students who participated in the first and second stages, and for whom we have administrative data.
Table 2. Summary statistics for the individual characteristics

This table reports summary statistics for the sample of 55 students who participated in the lab experiment, who filled out the online survey we administered in the second stage, and for whom we could obtain administrative data. ${ }^{\rm a}$
We proxy socioeconomic status with an administrative classification referred to as “estratificación socioeconómica” (socioeconomic stratification), which classifies residential real estates into six categories, ranging from 1 (corresponding to the poorest socioeconomic status) to 6 (corresponding to the richest one).
${ }^{\rm a}$
We proxy socioeconomic status with an administrative classification referred to as “estratificación socioeconómica” (socioeconomic stratification), which classifies residential real estates into six categories, ranging from 1 (corresponding to the poorest socioeconomic status) to 6 (corresponding to the richest one).
In our sample, most of the students come from wealthy families in Bogotá. Only for $34.5\%$
of the students’ socioeconomic status is 4 or less, and the average socioeconomic status is 5 out of 6. The average score obtained at the high school exit examination is about 400, which usually falls in the top percentiles of the country-level score distribution.
$34.5\%$
of the students’ socioeconomic status is 4 or less, and the average socioeconomic status is 5 out of 6. The average score obtained at the high school exit examination is about 400, which usually falls in the top percentiles of the country-level score distribution.
Table 3 presents a balance test indicating that the observable characteristics of the 55 students who participated in the lab experiment, completed the online survey administered in the second stage, and for whom we obtained administrative data are, on average, similar to those of the students for whom we have administrative data but did not complete the second stage.
Table 3. Balance tests: analysis sample vs. sample of students who did not complete the second stage

This table presents balance tests comparing the average observable characteristics between two groups of students: (1) the 55 students who participated in the lab experiment, completed the online survey administered in the second stage, and for whom we obtained administrative data, and (2) the students who participated in the first stage and for whom we have administrative data but did not complete the second stage of the data collection process. ${ }^{\rm a}$
Each unit represents two thousand pesos.
${ }^{\rm a}$
Each unit represents two thousand pesos.
Students’ behavior in the trust experiment. Figure 1 shows several summary statistics for the students’ behavior in the trust experiment. On average, the senders sent about half of his or her endowment of $COP \$ 20,000$
(Std. Dev. is
$COP \$ 20,000$
(Std. Dev. is $COP \$ 5,251.58$
). Overall, our subjects’ behavior in the laboratory squares well with the literature.
$COP \$ 5,251.58$
). Overall, our subjects’ behavior in the laboratory squares well with the literature.

Figure 1. Top: frequency of $RecipTrust_{ij}$
among the 1,485 dyads in our sample. Bottom left: frequencies of money sent (as senders) by the students in our sample. Bottom right: profiles of money sent back (as receivers) as a function of money received. The width of the line is proportional to the number of students that responded with that strategy profile. In all graphs, money is measured in units of two thousand pesos.
$RecipTrust_{ij}$
among the 1,485 dyads in our sample. Bottom left: frequencies of money sent (as senders) by the students in our sample. Bottom right: profiles of money sent back (as receivers) as a function of money received. The width of the line is proportional to the number of students that responded with that strategy profile. In all graphs, money is measured in units of two thousand pesos.
During the first stage of the data collection process (right after the trust experiment took place), we also asked survey questions aimed at measuring generalized (4.a and 4.b), and particularized trust toward friends (5.a and 5.c) and neighbors (5.e).Footnote 19 In Appendix B, we compare our lab-based trust measure with alternative measures obtained from the survey answers.

Figure 2. Survey- and turnstile-based networks.
This figure shows the networks involving the 1,485 dyads used in the baseline specification (Section 3.3). The left column shows survey-elicited networks (greeting, having lunch together, studying together, confiding in, and friendship). The center column displays short-term turnstile-based networks (August, September, October, and November 2017). The right column features long-term turnstile-based networks (2017-2, 2018-1, 2018-2, 2019-1, and 2019-2, where -1 denotes the first semester and -2 denotes the second semester).
Students’ networks. Figure 2 displays the survey-elicited networks, the short-term turnstile-based networks, and the long-term turnstile-based networks for the sample of 55 students who participated in both stages of the data collection process and for whom we could obtain administrative data.Footnote
20
To be able to easily compare the results between the survey-elicited networks and the turnstile-based networks we treat the former as undirected, that is, we assume that the link between $i$
and
$i$
and $j$
exists only if both
$j$
exists only if both $i$
and
$i$
and $j$
acknowledged the relationship between them.Footnote
21
To compare the Tables 4, 5, and 6 display some summary statistics for the social networks. The average degree in the (survey-based) friendship network is 9.53, the average local clustering is 0.45, the global clustering is 0.39, and the average path length is 2.12.Footnote
22
The characteristics of the networks we retrieve square well with the literature (Jackson, Reference Jackson2010). In particular, they all exhibit high degrees of clustering and low average path lengths. The greeting network is denser than the other networks, the having lunch together and confiding in networks are sparser, and the studying together and friendship networks sit in between the two extremes. In all networks, there is one giant component, and the greeting network is connected. The average path lengths are similar across survey- and turnstile-based networks. The mean degrees and the clustering coefficients of the long-term turnstile-based networks are all within the range of the clustering coefficients observed in the survey networks. The short-term turnstile-based networks tend to have larger mean degrees and smaller clustering coefficients than the long-term turnstile-based networks. This pattern can be attributed to the construction of the short-term networks, which rely on a weaker definition of a link—individuals swiping in or out in close proximity only once within a given month. As a result, turnstile-based networks may mix elements of the underlying “true” relationships with a network arising from a more random Erdős-Rényi-like link formation process, which could contribute to both the higher mean degree and lower clustering. At the same time, this pattern is consistent with the idea that short-term networks capture relationships in formation, some of which do not persist long enough to become embedded in cohesive social structures that exhibit high clustering.
$j$
acknowledged the relationship between them.Footnote
21
To compare the Tables 4, 5, and 6 display some summary statistics for the social networks. The average degree in the (survey-based) friendship network is 9.53, the average local clustering is 0.45, the global clustering is 0.39, and the average path length is 2.12.Footnote
22
The characteristics of the networks we retrieve square well with the literature (Jackson, Reference Jackson2010). In particular, they all exhibit high degrees of clustering and low average path lengths. The greeting network is denser than the other networks, the having lunch together and confiding in networks are sparser, and the studying together and friendship networks sit in between the two extremes. In all networks, there is one giant component, and the greeting network is connected. The average path lengths are similar across survey- and turnstile-based networks. The mean degrees and the clustering coefficients of the long-term turnstile-based networks are all within the range of the clustering coefficients observed in the survey networks. The short-term turnstile-based networks tend to have larger mean degrees and smaller clustering coefficients than the long-term turnstile-based networks. This pattern can be attributed to the construction of the short-term networks, which rely on a weaker definition of a link—individuals swiping in or out in close proximity only once within a given month. As a result, turnstile-based networks may mix elements of the underlying “true” relationships with a network arising from a more random Erdős-Rényi-like link formation process, which could contribute to both the higher mean degree and lower clustering. At the same time, this pattern is consistent with the idea that short-term networks capture relationships in formation, some of which do not persist long enough to become embedded in cohesive social structures that exhibit high clustering.
Table 4. Summary statistics for the survey-based networks

This table reports summary statistics for the survey-based networks. The number of observations is 1,485 dyads for each network.
Table 5. Summary statistics for the short-term turnstile-based networks

This table reports summary statistics for each of the short-term turnstile-based networks (August, September, October, and November 2017). The number of observations is 1,485 dyads for each network.
Table 6. Summary statistics for the long-term turnstile-based networks

This table reports summary statistics for the long-term turnstile-based networks (2017-2, 2018-1, 2018-2, 2019-1, and 2019-2, where suffix -1 denotes the first semester and -2 denotes the second semester).
3.3 Baseline specification
We test whether pairs of individuals exhibiting higher reciprocal trust are more likely to form new connections. We use LPMs to estimate the effect of $RecipTrust_{ij}$
on the presence or absence of relationships in our networks. In the following, we use capital letters for random variables, small letters for possible realizations, and bold letters for vectors. We assume that for, each unordered pair of subjects
$RecipTrust_{ij}$
on the presence or absence of relationships in our networks. In the following, we use capital letters for random variables, small letters for possible realizations, and bold letters for vectors. We assume that for, each unordered pair of subjects $\left \{ i,j \right \}$
, the probability that an undirected link between
$\left \{ i,j \right \}$
, the probability that an undirected link between $i$
and
$i$
and $j$
forms is
$j$
forms is
 \begin{equation} Y_{ij} = \beta _0 + \boldsymbol{\beta }_1 (\boldsymbol{X}_i + \boldsymbol{X}_j) + \boldsymbol{\beta }_3 \boldsymbol{Z}_{ij} + \varepsilon _{ij}, \end{equation}
where $Y_{ij} = 1$
indicates that
$Y_{ij} = 1$
indicates that $i$
and
$i$
and $j$
have a relationship in the network in question,
$j$
have a relationship in the network in question, $\boldsymbol{X}_i$
and
$\boldsymbol{X}_i$
and $\boldsymbol{X}_j$
are vectors of individual-level characteristics, and
$\boldsymbol{X}_j$
are vectors of individual-level characteristics, and $\boldsymbol{Z}_{ij}$
is a vector of pairwise-level characteristics.Footnote
23
$\boldsymbol{Z}_{ij}$
is a vector of pairwise-level characteristics.Footnote
23
If we were to assume that $\varepsilon _{ij}$
is independent of
$\varepsilon _{ij}$
is independent of $\varepsilon _{k\ell }$
, for each
$\varepsilon _{k\ell }$
, for each $ij \ne k\ell$
, then we could estimate Equation (1) with a standard OLS regression. However, when observations
$ij \ne k\ell$
, then we could estimate Equation (1) with a standard OLS regression. However, when observations $\left ( Y_{ij} \right )_{i,j = 1,\ldots ,N, i \ne j}$
correspond to the presence of links between
$\left ( Y_{ij} \right )_{i,j = 1,\ldots ,N, i \ne j}$
correspond to the presence of links between $N$
individuals, it is generally unsafe to assume that unobservables are independent across pairs of individuals. Specifically, the unobservables of pairs that share a common individual are likely to be correlated. As a result, standard OLS regressions produce consistent point estimates but underestimate
$N$
individuals, it is generally unsafe to assume that unobservables are independent across pairs of individuals. Specifically, the unobservables of pairs that share a common individual are likely to be correlated. As a result, standard OLS regressions produce consistent point estimates but underestimate $p$
-values.Footnote
24
Acknowledging the possibility of autocorrelation in the networks’ adjacency matrices, even after adjusting for observed traits, we lean toward a conservative approach that uses the dyadic-robust variance estimator (as detailed in Fafchamps & Gubert, Reference Fafchamps and Gubert2007 and Tabord-Meehan, Reference Tabord-Meehan2019) to refine standard errors.
$p$
-values.Footnote
24
Acknowledging the possibility of autocorrelation in the networks’ adjacency matrices, even after adjusting for observed traits, we lean toward a conservative approach that uses the dyadic-robust variance estimator (as detailed in Fafchamps & Gubert, Reference Fafchamps and Gubert2007 and Tabord-Meehan, Reference Tabord-Meehan2019) to refine standard errors.
We also add a battery of controls for several individual and pairwise characteristics. As for individual characteristics, we use information on sex, hometown, age, eye color, hair color, height, weight, whether wearing glasses, whether wearing tattoos, whether wearing piercings, number of siblings, score obtained at the high school exit examination.Footnote
25
As for pairwise characteristics, we have information on whether the students reported knowing each other from before our intended socialization period, and the amount of time they spent together in the same classrooms during the first semester, as measured by the number of university credits that the students share.Footnote
26
Moreover, for each individual characteristic $X$
and unordered pair of individuals
$X$
and unordered pair of individuals $\left \{ i,j \right \}$
, we can also control for the presence of homophily in that characteristic, as defined by
$\left \{ i,j \right \}$
, we can also control for the presence of homophily in that characteristic, as defined by $\Delta X_{ij} \;:\!=\; |X_i - X_j|$
.
$\Delta X_{ij} \;:\!=\; |X_i - X_j|$
.
To ease the comparison of the effect of different covariates, we standardize each nonbinary variable by subtracting its average from the variable and dividing the result by the standard deviation of the variable.Footnote 27 Thus, we can interpret the marginal effects in the regressions below as resulting from one standard deviation increases in the original variables.
3.3.1 Results
We estimate several LPMs using both the (survey-based) friendship network and the first-semester turnstile-based network. Specifically, for each of these two networks, we run three different models. First, we use only ${RecipTrust}_{ij}$
as an explanatory variable. Next, we introduce pairwise-level characteristics and homophily along individual characteristics as controls. Finally, we include both pairwise and individual-level characteristics as controls. We restrict our sample to the 1,485 dyads involving the subjects for whom we have complete first stage, second stage, and administrative data. We report the results in Table 7.
${RecipTrust}_{ij}$
as an explanatory variable. Next, we introduce pairwise-level characteristics and homophily along individual characteristics as controls. Finally, we include both pairwise and individual-level characteristics as controls. We restrict our sample to the 1,485 dyads involving the subjects for whom we have complete first stage, second stage, and administrative data. We report the results in Table 7.
Table 7. Baseline regressions: survey-elicited friendship network and turnstile-inferred first semester network on reciprocal trust and various controls

This table reports three specifications of the linear probability model for the (survey-based) friendship network and the first-semester turnstile-based network. The first two columns display the results of a linear probability model using only ${RecipTrust}_{ij}$
as an explanatory variable. The next two columns introduce pairwise-level controls in the regression. The last two columns show the results of the specification that includes all individual-level controls, including the individual-level controls
${RecipTrust}_{ij}$
as an explanatory variable. The next two columns introduce pairwise-level controls in the regression. The last two columns show the results of the specification that includes all individual-level controls, including the individual-level controls $X_i$
and
$X_i$
and $X_j$
used to construct the dyadic differences
$X_j$
used to construct the dyadic differences $\Delta X_{ij}$
included in the two middle columns to control for homophily in variable
$\Delta X_{ij}$
included in the two middle columns to control for homophily in variable $X$
. For readability, we omit the coefficients associated with some controls (Section 1 of the Online Appendix reports the table including the coefficients associated with all the controls in the regression). Dyadic-robust standard errors are shown in parentheses.
$X$
. For readability, we omit the coefficients associated with some controls (Section 1 of the Online Appendix reports the table including the coefficients associated with all the controls in the regression). Dyadic-robust standard errors are shown in parentheses.
The first two columns of Table 7 present the results of two LPMs that regress the (survey-based) friendship network and the first-semester turnstile-based network on the reciprocal trust between individuals $i$
and
$i$
and $j$
. In the last four columns, we introduce pairwise-level controls in the regression. First, we include a dummy variable indicating whether the students knew each other beforehand and their time of exposure in class. To account for the possibility that reciprocal trust may affect only pairs with significant exposure to each other, we include the interaction between individuals’ time of exposure and reciprocal trust. Additionally, we incorporate multiple variables reflecting differences in individual characteristics, which may be important due to homophilic motives. For readability, we omit the coefficients associated with some controls.Footnote
28
Finally, the last two columns of the table show the results of the specification that includes all (pairwise- and individual-level) controls, including the individual controls
$j$
. In the last four columns, we introduce pairwise-level controls in the regression. First, we include a dummy variable indicating whether the students knew each other beforehand and their time of exposure in class. To account for the possibility that reciprocal trust may affect only pairs with significant exposure to each other, we include the interaction between individuals’ time of exposure and reciprocal trust. Additionally, we incorporate multiple variables reflecting differences in individual characteristics, which may be important due to homophilic motives. For readability, we omit the coefficients associated with some controls.Footnote
28
Finally, the last two columns of the table show the results of the specification that includes all (pairwise- and individual-level) controls, including the individual controls $X_i$
and
$X_i$
and $X_j$
that we used to construct the dyadic difference
$X_j$
that we used to construct the dyadic difference $\Delta X_{ij}$
, which we included in the two middle columns to control for homophily in variable
$\Delta X_{ij}$
, which we included in the two middle columns to control for homophily in variable $X$
(for each
$X$
(for each $X$
). Following the typical approach used in network regressions with undirected connections, we represent each individual’s level control as the sum of the values of the variable for both endpoints within the dyad under examination.
$X$
). Following the typical approach used in network regressions with undirected connections, we represent each individual’s level control as the sum of the values of the variable for both endpoints within the dyad under examination.
The first two columns show that the estimated coefficients of ${RecipTrust}_{ij}$
are nearly zero and statistically insignificant. In terms of magnitudes, a one standard deviation increase in reciprocal trust between
${RecipTrust}_{ij}$
are nearly zero and statistically insignificant. In terms of magnitudes, a one standard deviation increase in reciprocal trust between $i$
and
$i$
and $j$
is associated with a 0.008 increase in the probability of a link between them in the survey-elicited network and a 0.006 increase in the turnstile-inferred network. Reciprocal trust remains insignificant even after introducing both pairwise-level controls (in the second two columns) and combined pairwise-level and individual-level controls (in the third two columns). The change in the sign of the point estimate of
$j$
is associated with a 0.008 increase in the probability of a link between them in the survey-elicited network and a 0.006 increase in the turnstile-inferred network. Reciprocal trust remains insignificant even after introducing both pairwise-level controls (in the second two columns) and combined pairwise-level and individual-level controls (in the third two columns). The change in the sign of the point estimate of ${RecipTrust}_{ij}$
across specifications is unsurprising, given its proximity to zero. Regarding the controls, we find that prior acquaintance is a significant and substantial predictor of relationship formation. Specifically, if either subject indicates knowing the other from before, the likelihood of a link at the end of the first academic semester increases by between 0.33 and 0.36 in the survey-elicited network and between 0.52 and 0.54 in the turnstile-based network. This result demonstrates the persistence of friendships and the ease of befriending an already acquainted person. Additionally, when individuals spend more time together due to being assigned to the same classrooms, they are significantly more likely to form a link. A one standard deviation increase in time spent together due to being in the same class-sections increases the probability of a link by 0.07 in the survey-elicited network and by 0.09 in the turnstile-inferred network. Given the average densities of these networks are 0.18 and 0.13, respectively, these effects are substantial, resulting in a 40% and 70% increase in the probability of a link. These results align well with the evidence presented in Marmaros & Sacerdote, Reference Marmaros and Sacerdote2006, which finds that first-year students tend to interact and form long-term friendships with peers who are easily accessible. Additionally, the significant positive effect of exposure time on link formation probability supports Girard et al. (Reference Girard, Hett and Schunk2015)’s finding that students in the same study groups tend to form friendships among themselves.
${RecipTrust}_{ij}$
across specifications is unsurprising, given its proximity to zero. Regarding the controls, we find that prior acquaintance is a significant and substantial predictor of relationship formation. Specifically, if either subject indicates knowing the other from before, the likelihood of a link at the end of the first academic semester increases by between 0.33 and 0.36 in the survey-elicited network and between 0.52 and 0.54 in the turnstile-based network. This result demonstrates the persistence of friendships and the ease of befriending an already acquainted person. Additionally, when individuals spend more time together due to being assigned to the same classrooms, they are significantly more likely to form a link. A one standard deviation increase in time spent together due to being in the same class-sections increases the probability of a link by 0.07 in the survey-elicited network and by 0.09 in the turnstile-inferred network. Given the average densities of these networks are 0.18 and 0.13, respectively, these effects are substantial, resulting in a 40% and 70% increase in the probability of a link. These results align well with the evidence presented in Marmaros & Sacerdote, Reference Marmaros and Sacerdote2006, which finds that first-year students tend to interact and form long-term friendships with peers who are easily accessible. Additionally, the significant positive effect of exposure time on link formation probability supports Girard et al. (Reference Girard, Hett and Schunk2015)’s finding that students in the same study groups tend to form friendships among themselves.
Homophily in socioeconomic status is also significant. In the survey-elicited network, a one standard deviation increase in the difference between $i$
and
$i$
and $j$
’s socioeconomic statuses decreases the probability of a link by 0.030–0.035. Given the average network density, this translates to a 20% decrease in the probability of a link. Although the estimates are noisier for the turnstile-inferred networks, resulting in only marginal significance, the magnitudes are similar (
$j$
’s socioeconomic statuses decreases the probability of a link by 0.030–0.035. Given the average network density, this translates to a 20% decrease in the probability of a link. Although the estimates are noisier for the turnstile-inferred networks, resulting in only marginal significance, the magnitudes are similar ( $-0.022$
and
$-0.022$
and $-0.021$
). Similarly, homophily in hometown is a significant determinant of relationship formation. On average, if
$-0.021$
). Similarly, homophily in hometown is a significant determinant of relationship formation. On average, if $i$
and
$i$
and $j$
both come from Bogotá or both come from outside Bogotá, they have a 0.03 to 0.09 higher chance of forming a link in the survey-elicited network. These findings are consistent with a large body of empirical evidence (McPherson et al., Reference McPherson, Smith-Lovin and Cook2001). Finally, we find that students
$j$
both come from Bogotá or both come from outside Bogotá, they have a 0.03 to 0.09 higher chance of forming a link in the survey-elicited network. These findings are consistent with a large body of empirical evidence (McPherson et al., Reference McPherson, Smith-Lovin and Cook2001). Finally, we find that students $i$
and
$i$
and $j$
are less likely to be linked if they come from Bogotá. This is intuitive, as students from Bogotá likely already have an established network of friends in town, reducing their need to form new friendships.
$j$
are less likely to be linked if they come from Bogotá. This is intuitive, as students from Bogotá likely already have an established network of friends in town, reducing their need to form new friendships.
Does the insignificance of reciprocal trust arise from a weak association with link formation or from high standard errors? To address this question, we analyze the power of our $t$
-test. Suppose the true partial correlation between
$t$
-test. Suppose the true partial correlation between $i$
and
$i$
and $j$
’s reciprocal trust and the presence of a link between them,
$j$
’s reciprocal trust and the presence of a link between them, $\beta ^1_{\tau }$
, is 0.08, a magnitude comparable to that of the correlation between time of exposure and link formation. Given our sample size of 1,485 and the dyadic-robust standard errors of the estimated
$\beta ^1_{\tau }$
, is 0.08, a magnitude comparable to that of the correlation between time of exposure and link formation. Given our sample size of 1,485 and the dyadic-robust standard errors of the estimated $\beta ^1_{\tau }$
from the OLS regressions (0.012 in the friendship network and 0.010 in the turnstile network), the probability of failing to reject the null hypothesis that
$\beta ^1_{\tau }$
from the OLS regressions (0.012 in the friendship network and 0.010 in the turnstile network), the probability of failing to reject the null hypothesis that $\beta ^1_{\tau } = 0$
is approximately zero in either case. More generally, given our sample size and standard errors, the minimum detectable partial correlation of reciprocal trust with the existence of a link, with 80% power, is about 0.034 in the friendship network and 0.028 in the turnstile network. These thresholds are slightly below the estimated effect of socioeconomic dissimilarity. Therefore, we can confidently assert that if the true effect of reciprocal trust on link formation probability is positive, it is very likely to be smaller than the impact of variables such as prior acquaintance, time of exposure, socioeconomic dissimilarity, and hometown dissimilarity.
$\beta ^1_{\tau } = 0$
is approximately zero in either case. More generally, given our sample size and standard errors, the minimum detectable partial correlation of reciprocal trust with the existence of a link, with 80% power, is about 0.034 in the friendship network and 0.028 in the turnstile network. These thresholds are slightly below the estimated effect of socioeconomic dissimilarity. Therefore, we can confidently assert that if the true effect of reciprocal trust on link formation probability is positive, it is very likely to be smaller than the impact of variables such as prior acquaintance, time of exposure, socioeconomic dissimilarity, and hometown dissimilarity.
3.4 Predicting relationship formation in the short term and the long term
Our analysis uses a one-semester period to define social ties, which aligns with Christakis (Reference Christakis2015)’s findings for U.S. colleges, which highlight a critical initial window of less than a month for forming acquaintances before relationships solidify. However, the dynamics at nonresidential institutions, such as the one we study, may differ significantly.
Given the potentially less intense socialization experiences at these universities, our ties may require prolonged acquaintance periods. As a result, reciprocal trust could become a relevant predictor of relationships later in their university journey, not necessarily by the end of the first semester. Alternatively, persistent classroom interactions and shared friendships could lead to gradual camaraderie among students. In this scenario, reciprocal trust would primarily influence relationships in the very early stages, potentially even shorter than our one-semester analysis period.

Figure 3. Coefficient estimates from the baseline regressions of the short-term turnstile-based networks on reciprocal trust and various controls.
This figure shows the estimated coefficients and 80% confidence intervals from the baseline regressions of the short-run turnstile networks on reciprocal trust and all the pairwise-level and individual-level controls. For readability and consistency, we report only the coefficient estimates and confidence intervals for the same controls shown in Table 7 (see Section 2 for further details).
For these reasons, we leverage the turnstile data to capture both short-term and long-term relationship formation: specifically, at one, two, and three months into the first semester, and then two through five semesters post-admission. Figure 3 shows the point estimates and 80% confidence intervals from the baseline regressions of the short-term turnstile data on reciprocal trust and all the pairwise- and individual-level controls. Figure 4 shows the point estimates and 80% confidence intervals from the baseline regressions of the long-term turnstile data on reciprocal trust and all the pairwise- and individual-level controls. For readability and consistency, we report only the coefficient estimates and confidence intervals for the same controls shown in Table 7. The coefficients are very similar to those presented in the third column of Table 7. In the short-run, our evidence indicates a negligible influence of reciprocal trust, with coefficients ranging narrowly between $-0.003$
and 0.005 during the September to November span. The August data reveals a slightly more pronounced coefficient at
$-0.003$
and 0.005 during the September to November span. The August data reveals a slightly more pronounced coefficient at $-0.011$
, yet it pales in comparison to the coefficients linked with robust predictors of link formation—factors like knowing each other from before, time of exposure duration, gender, hometown, and differences in hometown.
$-0.011$
, yet it pales in comparison to the coefficients linked with robust predictors of link formation—factors like knowing each other from before, time of exposure duration, gender, hometown, and differences in hometown.

Figure 4. Coefficient estimates from the baseline regressions of the long-term turnstile-based networks on reciprocal trust and various controls.
This figure shows the estimated coefficients and 80% confidence intervals from the baseline regressions of the long-run turnstile networks on reciprocal trust and various controls. For readability and consistency, we report only the coefficient estimates and confidence intervals for the same controls shown in Table 7.
3.5 Alternative measures of reciprocal trust, measurement error, and other robustness checks
The measure of reciprocal trust within dyads that we use in the baseline specification, ${RecipTrust}_{ij}$
, may be subject to measurement error or confounded by other factors. It might also be the case that the type of trust measured by the trust experiment (how much money a subject would endow another with, in the absence of commitment or punishment technologies) is not the type of trust that matters for approaching and interacting with strangers. We address this issue by constructing five alternative measures of reciprocal trust within dyads. Three of them rely on the same basic data as our measure of reciprocal trust stemming form the strategies of subjects as senders and receivers in the trust experiment. We use these alternative indices to assess whether our findings depend on the specific functional form that we use to define reciprocal trust. The final two measures rely on the two survey questions which inquire about subjects’ propensity to trust strangers. We begin by defining these measures and discussing how they are related among them and to our measure of reciprocal trust. We then present the results that we obtain by running our main specification using each of these alternative five measures and discussing how the results support our findings. Finally, we follow Gillen et al. (Reference Gillen, Snowberg and Yariv2019) and construct ORIV (obviously related instrumental variables) estimates of our coefficient of interest using the two final alternative measures of trust that rely on different data and that are therefore likely to meet main requirements of ORIV.
${RecipTrust}_{ij}$
, may be subject to measurement error or confounded by other factors. It might also be the case that the type of trust measured by the trust experiment (how much money a subject would endow another with, in the absence of commitment or punishment technologies) is not the type of trust that matters for approaching and interacting with strangers. We address this issue by constructing five alternative measures of reciprocal trust within dyads. Three of them rely on the same basic data as our measure of reciprocal trust stemming form the strategies of subjects as senders and receivers in the trust experiment. We use these alternative indices to assess whether our findings depend on the specific functional form that we use to define reciprocal trust. The final two measures rely on the two survey questions which inquire about subjects’ propensity to trust strangers. We begin by defining these measures and discussing how they are related among them and to our measure of reciprocal trust. We then present the results that we obtain by running our main specification using each of these alternative five measures and discussing how the results support our findings. Finally, we follow Gillen et al. (Reference Gillen, Snowberg and Yariv2019) and construct ORIV (obviously related instrumental variables) estimates of our coefficient of interest using the two final alternative measures of trust that rely on different data and that are therefore likely to meet main requirements of ORIV.
While trust in the trust experiment can only be measured by the amount of money sent, trustworthiness can be assessed in several ways. In Section 2, we measure the trustworthiness of an individual $i$
as the amount that he would send back to
$i$
as the amount that he would send back to $j$
in response to the amount which they would receive from individual
$j$
in response to the amount which they would receive from individual $j$
if
$j$
if $i$
was a receiver and
$i$
was a receiver and $j$
was a sender. Our first alternative measure of reciprocal trust, which we refer to as
$j$
was a sender. Our first alternative measure of reciprocal trust, which we refer to as $Exp1$
, is calculated as follows:
$Exp1$
, is calculated as follows:
 \begin{equation*} Exp1 = Exp1_{ij} + Exp1_{ji}, \end{equation*}
where $Exp1_{ij}$
is the amount of money sent by individual
$Exp1_{ij}$
is the amount of money sent by individual $i$
in the pair as a sender during the trust experiment plus the average amount of money sent back by individual
$i$
in the pair as a sender during the trust experiment plus the average amount of money sent back by individual $j$
as a receiver. The second alternative measure of reciprocal trust, which we refer to as
$j$
as a receiver. The second alternative measure of reciprocal trust, which we refer to as $Exp2$
, is calculated as follows:
$Exp2$
, is calculated as follows:
 \begin{equation*} Exp2 = Exp2_{ij} + Exp2_{ji}, \end{equation*}
is calculated by summing the amount of money sent by individual $i$
in the pair as a sender during the trust experiment plus the average amount of money sent back by individual
$i$
in the pair as a sender during the trust experiment plus the average amount of money sent back by individual $j$
as a receiver conditional on receiving at least COP $10,000. This measure considers only the average amounts sent back by each individual in the pair as a receiver in the trust experiment, but only when they received more than half of the sender’s endowment. Our final measure of reciprocal trust, which we refer to as
$j$
as a receiver conditional on receiving at least COP $10,000. This measure considers only the average amounts sent back by each individual in the pair as a receiver in the trust experiment, but only when they received more than half of the sender’s endowment. Our final measure of reciprocal trust, which we refer to as $Exp3$
, is calculated as follows:
$Exp3$
, is calculated as follows:
 \begin{equation*} Exp3 = Exp3_{ij} + Exp3_{ji}, \end{equation*}
where $Exp3_{ij}$
represents the amount of money sent by individual
$Exp3_{ij}$
represents the amount of money sent by individual $i$
to individual
$i$
to individual $j$
as a sender in the trust experiment. This measure disregards trustworthiness entirely and considers only the amounts sent by each individual in the pair as senders in the trust experiment.
$j$
as a sender in the trust experiment. This measure disregards trustworthiness entirely and considers only the amounts sent by each individual in the pair as senders in the trust experiment.
We also construct alternative measures of reciprocal trust based on subjects’ responses to survey questions about generalized trust, instead of their behavior in the trust experiment. The survey questions on generalized trust ask, on a 1–5 scale, to what extent the subjects agree with the following statements: (4.a.) One cannot trust strangers and (4.b.) When dealing with strangers, one should be careful and not readily trust them. These measures are less context-specific than the measure we build from the trust experiment, and could thus be argued to capture a more comprehensive dimension of trust. We let
 \begin{equation*} Surv1 = Surv1_{i} + Surv1_{j}, \end{equation*}
where $Surv1_{i}$
is the negative value of student
$Surv1_{i}$
is the negative value of student $i$
’s answers to question 4.a. Finally, we let
$i$
’s answers to question 4.a. Finally, we let
 \begin{equation*} Surv2 = Surv2_{ij} + Surv2_{ji}, \end{equation*}
where $Surv2_{i}$
is the negative value of student
$Surv2_{i}$
is the negative value of student $i$
’s answer to question 4.b.
$i$
’s answer to question 4.b.
Figure 5 shows the correlations between our baseline measure of reciprocal trust based on the students’ behavior in the trust experiment (defined in Subsection 3.1) and the five alternative measures of reciprocal trust defined above. Table 8 shows the results of running our baseline specification using the survey-based friendship network on each one of the five alternative measures of reciprocal trust, where we control for all pairwise and individual-level characteristics (analogous to Column (iii) in Table 7). Table 9 shows the results of running analogous regressions but using the first-semester turnstile-based networks. In 9 of the 10 specifications, the estimated coefficient of reciprocated trust is close to $0$
and not significant. The estimated coefficients on the measures of trust and the estimated coefficients on all the basic controls are very similar in all cases. In the specification that relies on
$0$
and not significant. The estimated coefficients on the measures of trust and the estimated coefficients on all the basic controls are very similar in all cases. In the specification that relies on $Surv2$
measure the estimated coefficient on trust is negative and significant and similar in magnitude to the estimated coefficient on Socioeconomic status
$Surv2$
measure the estimated coefficient on trust is negative and significant and similar in magnitude to the estimated coefficient on Socioeconomic status $\Delta$
.
$\Delta$
.

Figure 5. Correlations among our measure of reciprocal trust, the three alternative measures based on the lab data and the two alternative measures based on survey data.
Note: This figure shows the correlations between our baseline measure of reciprocal trust in dyads and the five alternative measures of reciprocal trust defined above.
Table 8. Robustness regressions: survey-elicited friendship network on alternative measures of reciprocal trust and various controls

This table presents the results of linear probability models regressing the (survey-based) friendship network on the reciprocal trust measures constructed using three alternative measures based on the lab data and two measures based on survey data, as described in Section C. All specifications include all pairwise- and individual-level controls. For readability, the coefficients associated with some controls are omitted. Dyadic-robust standard errors are shown in parentheses.
Table 9. Robustness regressions: first-semester turnstile-based network on alternative measures of trust and various controls

This table presents the results of linear probability models regressing the first-semester turnstile-based network on the reciprocal trust measures constructed using three alternative measures based on the lab data and two measures based on survey data, as described in Section C. All specifications include all pairwise- and individual-level controls. For readability, the coefficients associated with some controls are omitted. Dyadic-robust standard errors are shown in parentheses.
In what follows we rely on Gillen et al. (Reference Gillen, Snowberg and Yariv2019) to construct ORIV estimates of our main coefficient of interest. For that purpose we approach Reciprocal Trust, $Surv1$
and
$Surv1$
and $Surv2$
as alternative imperfect measures of the underlying reciprocal trust in a dyad.
$Surv2$
as alternative imperfect measures of the underlying reciprocal trust in a dyad. $Surv1$
and
$Surv1$
and $Surv2$
differ from our measure of reciprocal trust in that they aim to capture how trusting toward anonymous strangers the respondent is, but in contrast to our measure of reciprocal trust do not contain any information on her trustworthiness. The main assumption behind the validity of ORIV is that each of the alternative measures of reciprocal trust are valid instruments for the others in their relation to network formation. Specifically, each variable must be correlated with the other ones, and can only be related with link formation through the core underlying true measure of trust that they all share. Given that
$Surv2$
differ from our measure of reciprocal trust in that they aim to capture how trusting toward anonymous strangers the respondent is, but in contrast to our measure of reciprocal trust do not contain any information on her trustworthiness. The main assumption behind the validity of ORIV is that each of the alternative measures of reciprocal trust are valid instruments for the others in their relation to network formation. Specifically, each variable must be correlated with the other ones, and can only be related with link formation through the core underlying true measure of trust that they all share. Given that $Exp1, Exp2$
, and
$Exp1, Exp2$
, and $Exp3$
, which we use above to explore the sensitivity of our results to the functional form, are constructed using the same data as Reciprocal Trust they and are not suitable instruments for ORIV.
$Exp3$
, which we use above to explore the sensitivity of our results to the functional form, are constructed using the same data as Reciprocal Trust they and are not suitable instruments for ORIV.
Table 10 is analogous to Table 7 but estimating the model using ORIV and treating $RecipTrust$
,
$RecipTrust$
, $Surv1$
, and
$Surv1$
, and $Surv2$
as alternative noisy measures of the same underlying feature. This estimation technique supports the paper’s main conclusion: there is no evidence that links are more likely to form among pairs with higher reciprocal trust. While some specifications show statistically significant reciprocal trust coefficients, they are consistently negative. Furthermore, these results can be understood by the fact that one of the instruments is
$Surv2$
as alternative noisy measures of the same underlying feature. This estimation technique supports the paper’s main conclusion: there is no evidence that links are more likely to form among pairs with higher reciprocal trust. While some specifications show statistically significant reciprocal trust coefficients, they are consistently negative. Furthermore, these results can be understood by the fact that one of the instruments is $Surv2$
, which as shown in Table 8 is a negative a statistically significant predictor of links. Our results robustly show that trust, measured through both an experiment and survey questions, does not predict relationship formation among our subjects. Moreover, in the cases in which trust has a significant effect on relationship formation, this effect is negative. This evidence stands in opposition to our initial hypothesis that more trusting individuals should have a higher chance of forming relationships. We believe that there are ways in which our results can be rationalized besides concluding that trust does not matter for network formation among our subjects.
$Surv2$
, which as shown in Table 8 is a negative a statistically significant predictor of links. Our results robustly show that trust, measured through both an experiment and survey questions, does not predict relationship formation among our subjects. Moreover, in the cases in which trust has a significant effect on relationship formation, this effect is negative. This evidence stands in opposition to our initial hypothesis that more trusting individuals should have a higher chance of forming relationships. We believe that there are ways in which our results can be rationalized besides concluding that trust does not matter for network formation among our subjects.
Table 10. Baseline regressions: ORIV with clustered standard errors

This table reports three specifications of the ORIV regressions for the (survey-based) friendship network and the first-semester turnstile-based network. The first two columns display the results using only ${RecipTrust}_{ij}$
as an explanatory variable. The next two columns introduce pairwise-level controls in the regression. The last two columns show the results of the specification that includes all individual-level controls, including the individual-level controls
${RecipTrust}_{ij}$
as an explanatory variable. The next two columns introduce pairwise-level controls in the regression. The last two columns show the results of the specification that includes all individual-level controls, including the individual-level controls $X_i$
and
$X_i$
and $X_j$
used to construct the dyadic differences
$X_j$
used to construct the dyadic differences $\Delta X_{ij}$
included in the two middle columns to control for homophily in variable
$\Delta X_{ij}$
included in the two middle columns to control for homophily in variable $X$
. For readability, we omit the coefficients associated with some controls. Standard errors clustered at the individual-level are shown in parentheses.
$X$
. For readability, we omit the coefficients associated with some controls. Standard errors clustered at the individual-level are shown in parentheses.
One possibility is that more trust is negatively related to some personality trait, for example, extroversion, that is in turn helpful in establishing new relations. Freitag & Bauer (Reference Freitag and Bauer2016) study how trust is related to Big Five personality traits. They find no evidence of relation between trust and extroversion. Moreover, trust is positively related to openness and agreeableness (traits potentially helpful in establishing relations).Footnote 29
Late adolescents may value traits like dominance, charisma, or nerve when forming relationships with their peers. These traits could, in turn, negatively correlate with trust. This hypothesis stands in line with the literature on social status among adolescents. Parkhurst & Hopmeyer (Reference Parkhurst and Hopmeyer1998) distinguishes between sociometric popularity, representing the in-degree of an individual in a network, and perceived popularity, representing an individual’s reputation for being popular. Later studies (Hawke & Rieger (Reference Hawke and Rieger2013) and Franken et al. (Reference Franken, Harakeh, Veenstra, Vollebergh and Dijkstra2017)) also distinguish between the perception of being popular (popularity) and the perception of being well-liked (likability). The in-degree of adolescents is generally positively correlated with both likability and popularity. However, while likability is mostly related to prosocial behavior and traits, popularity is primarily associated with social dominance (Parkhurst & Hopmeyer, Reference Parkhurst and Hopmeyer1998) and correlates with physical aggression, relational aggression, and anti-social behavior (Cillessen & Mayeux, Reference Cillessen and Mayeux2004, LaFontana & Cillessen, Reference LaFontana and Cillessen2002, and Hawke & Rieger, Reference Hawke and Rieger2013). Popular adolescents are also described as manipulative, Machiavellian (Cillessen & Mayeux, Reference Cillessen and Mayeux2004) and hard to push around (Parkhurst & Hopmeyer, Reference Parkhurst and Hopmeyer1998). We hypothesize that while trust may be positively related to likability, it might have a stronger negative relationship with popularity, as adolescents may perceive trusting individuals as weak or naive. This hypothesis could explain why we find that trust does not generally predict (and sometimes negatively predicts) relationship formation among our subjects. One way to indirectly probe this hypothesis is by examining the possible heterogeneity in the correlation between reciprocal trust and link formation by gender under the assumption that traits like dominance are more valued by males than by females. Under this assumption we expect reciprocal trust to be more positively and strongly associated with link formation in dyads involving more females. Table C6 in Appendix C.6 shows the results from estimating a model analogous to or main one, but including a term capturing the interaction between the variable encoding the number of females in the dyad (0,1 or 2) and reciprocal trust. The estimated coefficients on the interaction term are positive and similar in magnitude to the reciprocal trust coefficients in all specifications, but are never statistically significant. While our research design was not developed in order to assess this kind of heterogeneity nor to evaluate if indeed there are differences in the valuation of traits like dominance in males and females in our sample, we include the results as an exploratory exercise as it is a promising approach for future research.
Other networks
We apply our baseline strategy to networks elicited using different survey questions: “greeting each other,” “having lunch together,” “studying together,” and “confining in each other.” Additionally, we complement our analysis by treating survey-elicited friendship network as a directed network in which it is possible that subject $i$
considers subject
$i$
considers subject $j$
to be their friend but the friendship is not reciprocated. In all these specifications trust remains a poor predictor of network formation, and previous encounters, time of exposure, differences in socioeconomic status, and differences in the town of origin are key predictors of relationship formation. The details of these analysis can be found in Appendices C.2 and C.3.
$j$
to be their friend but the friendship is not reciprocated. In all these specifications trust remains a poor predictor of network formation, and previous encounters, time of exposure, differences in socioeconomic status, and differences in the town of origin are key predictors of relationship formation. The details of these analysis can be found in Appendices C.2 and C.3.
Largest possible sample
We conduct the turnstile-elicited network analysis additionally including 15 subjects who did not participate in the second-stage survey. The results remain virtually unchanged. The details of these analysis can be found in Appendix C.4.
Individual network statistics and trust
In principle, the predictive power of individual or dyadic characteristics over network structure should express itself through the presence or absence of individual links, but the predictive power of individual characteristics can also be studied directly through regressions of individual network statistics on individual characteristics. The analysis in Appendix C.6 shows that individuals’ propensity to trust or to be trustworthy with respect to strangers does not predict individuals’ number of links, eigenvector centralities or betweenness centralities.
4. Conclusions
We collected data on trust and trustworthiness toward strangers from a cohort of incoming freshman economics students at a university in Bogotá, Colombia. This data was gathered on the students’ first formal day on campus, before they had substantial opportunities to socialize. At the end of their first academic semester, we collected survey data on five social networks among them. We used administrative data on students’ co-movements across turnstiles at campus entry and exit points to track their networks both in different points in time. For each pair of students in our sample, we computed a measure of reciprocal trust as the sum of the amounts that the individuals in the pair would have received in the role of sender when interacting with each other in a trust experiment. For each of the networks we elicited or inferred from the turnstile data, we estimated the effect of reciprocal trust on the probability of relationship formation.
We find strong evidence against the hypothesis that reciprocal trust, at least as measured by trust experiment, predicts link formation. Our results suggest that if reciprocal trust is indeed a determinant of relationship formation, it is either poorly measured by the trust experiment or its influence is much weaker compared to several other characteristics that are well understood to play a significant role. In particular, factors such as time of exposure, prior acquaintance, and similar socioeconomic status are far more important for relationship formation than the students’ ability to cooperate in social dilemmas, as measured by total potential earnings in a trust experiment. This holds true regardless of whether we measure relationships in the short term or long term, regardless of the type of relationship we examine, and regardless of the exact measure of trust.
Overall, our results cautiously suggest that the emphasis on trust and trustworthiness as key facilitators of social relationships in the social capital literature may be overstated. Relationships seem to result more from people’s tendency to associate with those similar to them or from random chance than from their inclination to trust and reciprocate the trust of strangers.
Use of AI
We made use of ChatGPT 5 and Claude Sonnet 4.5 to write the R code that was used to run the ORIV regressions and to write a single clean script reconstructing all the analysis included in the last version of the paper. We also used ChatGPT 5 to make style improvements and detect typos.
Acknowledgements
We thank two anonymous referees for various suggestions which helped us to substantially improve our paper. We thank Francesco Bogliacino, Gary Charness, Julien Daubanes, Giacomo De Giorgi, José Alberto Guerra, Dunia López-Pintado, Matthew Jackson, Eric Quintane, Alessandro Tarozzi, Michela Tincani, and Leeat Yariv for their comments. We thank Anastasia Agafnikova, Juan Camilo Cháves, and Lucas Gómez for excellent research assistance. We thank seminar participants at Universitat Autónoma de Barcelona, Universidad del Rosario, Universidad Nacional de Colombia, LANET Conference 2018, and University of Geneva.
Funding statement
Okulicz acknowledges the financial support of the fellowship BES-2016-077805 and the research project from the Ministerio de Economía, Industria y Competitividad–Feder (ECO2015-63679-P). Pietrobon acknowledges the financial support of Fundació Markets, Organizations and Votes in Economics (BES-2016-077805) and the SNF (100018-182243). Rodríguez acknowledges the financial support of Universidad de los Andes through FAPA. Velasco acknowledges partial financial support from the National Academy of Education / Spencer Foundation Dissertation Fellowship.
Competing interests
None. All the datasets used in this project will be made available online in a fully anonymized version.
A. Validating social networks based on the turnstile data
Table A1 compares the survey-based and turnstile-based networks during the fall semester of 2017. It presents summary statistics for several turnstile-based interactions, defined by one to five entry or exit movements of students on or off campus within a three-second window among the students in our sample. The “twice” column refers to the definition of comovement used to construct the turnstile-based networks in Section 3.3. We compare the turnstile-based networks with several survey-based networks: greeting, studying together, having lunch together, and friendship. The table provides two critical statistics for each pair of turnstile- and survey-based networks: the proportion of survey-based links not corroborated by the turnstile-based networks (survey pairs unmatched with turnstile links), and the proportion of turnstile links that were not found as a survey pair (Turnstile links unmatched with survey links).
The data presented in Table A1 reveal two important aspects of the turnstile-based links. Firstly, increasing the comovement frequency threshold reduces the unmatched shares of turnstile links to survey links, but simultaneously increases the share of survey links unmatched to turnstile-based links. Focusing on the Greeting case, when the comovement frequency is once per semester, 41% of the survey links are unmatched to a turnstile link, and 33% of the turnstile links are unmatched to a survey link. But as the comovement threshold increases, the share of unmatched survey links increases to 81%, while the share of unmatched turnstile links decreases to 0%. This tradeoff is intuitive: If the turnstile-based links definition is stricter these pairs are more likely to be matched to a survey pair, but fewer survey-based pairs will be found in the turnstile-based ones.
Secondly, a significant number of survey-identified links are not detected by the turnstiles, but this varies depending on the survey question. For example, while only 16 percent of the “having lunch together” connections are missed by the turnstiles, this figure rises to 45 percent for “friends” connections and 64 percent for “greeting” interactions. This pattern suggests that turnstile-based links are more adept at capturing closer interactions, such as those who have lunch together, rather than more casual interactions like greetings or mere acquaintances.
These findings imply that turnstile-based interactions provide a unique perspective on student relationships, capturing a dimension of interaction not fully represented in survey-based measures, yet still offering significant insight into the nature of student connections.
Table A1. Comparison between survey- and turnstile-based interactions during the fall semester of 2017

This table compares the survey-based and turnstile-based networks during the fall semester of 2017. It presents summary statistics for several turnstile-based interactions, defined by one to five entry or exit movements of students on or off campus within a three-second window among the students in our sample. The “twice” column refers to the definition of comovement used to construct the turnstile-based networks in our analysis. For each pair of turnstile- and survey-based networks, we show the proportion of survey-based links not corroborated by the turnstile-based networks (survey links unmatched to turnstile links), and the share of turnstile-based linked pairs unmatched to the survey-based links Turnstile links unmatched to survey links).
B. Trust in the lab and surveys
Figure B1 shows the correlations between the amounts of money sent by senders in the lab and the answers to survey questions 4.a, 4.b, 5.a, 5.c, and 5.e, as well as the correlations between the answers to the questions. Trust in the lab significantly correlates with generalized trust but not with particularized trust. Glaeser et al. (Reference Glaeser, Laibson, Scheinkman and Soutter2000) finds that the answers to two questions on generalized trust (similar to questions 4.a and 4.b), and the answers to the questions on particularized trust (what they refer to as “past trusting behavior”) are all correlated with the amount of money sent in a trust experiment. Our results confirm Glaeser et al. (Reference Glaeser, Laibson, Scheinkman and Soutter2000)’s finding that generalized trust significantly predicts trusting behavior in the laboratory.Footnote 30 However, contrary to Glaeser et al. (Reference Glaeser, Laibson, Scheinkman and Soutter2000), we find that particularized trust does not significantly correlate with the amount of money sent in the experiment. We believe that this discrepancy stems from a difference in Glaeser et al. (Reference Glaeser, Laibson, Scheinkman and Soutter2000)’s experimental design, as their subjects knew each other’s identities while playing the trust game. Moreover, in their study, individuals who arrived together at the experiment were allowed to play with each other. As a result, subjects who are friends are more likely to play together, and so particularized trust toward friends may play a crucial role in their behavior. The fact that our experiment is anonymized likely explains why past trusting behavior toward particular groups of people (i.e., friends and neighbors) does not play a significant role in predicting our subjects’ behavior in the experiment.

Figure B1. Correlations between the amounts of money sent by senders in the experiment and the answers to survey questions 4.a, 4.b, 5.a, 5.c, and 5.e.
This figure shows the correlations between the amounts of money sent by senders in the lab and the answers to survey questions 4.a, 4.b, 5.a, 5.c, and 5.e, as well as the correlations between the answers to the questions.
C. Other robustness checks
In this appendix, we discuss several robustness checks and demonstrate that our results remain consistent when using alternative measures of reciprocal trust, different survey-based networks as the dependent variable, and various samples of dyads based on the turnstile-based networks.
C.1 Standard errors
Table C1. Baseline regressions: OLS with standard errors

This table reports three specifications of the OLS regressions for the (survey-based) friendship network and the first-semester turnstile-based network. The first two columns display the results using only ${RecipTrust}_{ij}$
as an explanatory variable. The next two columns introduce pairwise-level controls in the regression. The last two columns show the results of the specification that includes all individual-level controls, including the individual-level controls
${RecipTrust}_{ij}$
as an explanatory variable. The next two columns introduce pairwise-level controls in the regression. The last two columns show the results of the specification that includes all individual-level controls, including the individual-level controls $X_i$
and
$X_i$
and $X_j$
used to construct the dyadic differences
$X_j$
used to construct the dyadic differences $\Delta X_{ij}$
included in the two middle columns to control for homophily in variable
$\Delta X_{ij}$
included in the two middle columns to control for homophily in variable $X$
. For readability, we omit the coefficients associated with some controls. Standard errors are shown in parentheses.
$X$
. For readability, we omit the coefficients associated with some controls. Standard errors are shown in parentheses.
We have strived to rely on the most appropriate methods to compute the standard errors of our estimates. These methods, Fafchamps & Gubert (Reference Fafchamps and Gubert2007) and Tabord-Meehan (Reference Tabord-Meehan2019)) take into account the fact that it is probable that due to different network formation mechanisms, unobservables are correlated across dyads. With these methods, it is often the case that the estimated standard errors are larger, making it more difficult to reject null hypotheses, and thus making a more robust case for rejection. Given that the main finding of our paper is our failure to reject the hypothesis that the coefficient on reciprocal trust is $0$
across various specifications, the more conservative approach entails considering the smaller standard errors and correspondingly larger confidence intervals for reporting our results and for our discussion about power. Table C1 is equivalent to our main results Table 7 but instead of reporting dyadic standard errors, it reports the standard OLS standard errors.
$0$
across various specifications, the more conservative approach entails considering the smaller standard errors and correspondingly larger confidence intervals for reporting our results and for our discussion about power. Table C1 is equivalent to our main results Table 7 but instead of reporting dyadic standard errors, it reports the standard OLS standard errors.

Figure C1. Correlation of link presence among all the networks that we consider.
Note: This figure shows the correlations in link presence between all of our survey-based networks.
C.2 Other survey-based networks
Here, we apply our baseline strategy using different outcome variables: the “having lunch together,” “studying together,” and “confiding in each other” networks. Figure C1 shows the correlation of link presence among all the networks that we consider.
Table C2 shows the results of LPMs regressing the four networks other than friendship on reciprocal trust. All specifications include all the pairwise- and individual-level controls. The effect of reciprocal trust on the formation of the other relationships is small and never significant at the $10\%$
level. The results for the other controls are consistent with those reported for the friendship network: time of exposure, homophily in socioeconomic status, and hometown are important determinants of relationship formation.
$10\%$
level. The results for the other controls are consistent with those reported for the friendship network: time of exposure, homophily in socioeconomic status, and hometown are important determinants of relationship formation.
Table C2. Robustness regressions: turnstile-based networks on alternative measures of trust

This table shows the results of linear probability models regressing the four networks other than friendship on reciprocal trust. All specifications include all the pairwise- and individual-level controls. The results involving the friends network are shown in the first column for comparison. For readability, we omit the coefficients associated with some controls. Dyadic-robust standard errors are shown in parentheses.
Table C3. Robustness regressions: directed survey-based networks on trust and trustworthiness

C.3 Directed networks
Given that our various turnstile-elicited networks are by construction undirected, we rely on undirected definitions of all relationships (survey-based or turnstile-elicited) in order to be able to consistently handle the largest possible set of short term and long term outcome networks.
On the other hand, survey-elicited networks are all based on the nominations made by each agent which are by construction directed. Table C3 presents the estimation results of specifications that are analogous to our main ones but which study the extent to which individuals’ propensity to trust or to be trustworthy toward another subject predict that they nominate or that they are nominated by that subject in each of the five relations types that our survey elicits. The regression includes the same set of controls as our main regressions with full controls and involves twice as may observations as our main regressions given that there are twice as many ordered pairs of agents, 2970, as there are undirected pairs, 1485. The value of the dependent variable in the observation corresponding to pair $ij$
in any one of the models is
$ij$
in any one of the models is $1$
if
$1$
if $i$
acknowledges a relationship of the kind in question in the survey. The individual regressors terminated in
$i$
acknowledges a relationship of the kind in question in the survey. The individual regressors terminated in $i$
thus correspond to those of the first agent in the ordered pair and those terminated in
$i$
thus correspond to those of the first agent in the ordered pair and those terminated in $j$
correspond to those of the second agent in the ordered pair. Specifically
$j$
correspond to those of the second agent in the ordered pair. Specifically $Trust i$
is the scaled amount of money sent by
$Trust i$
is the scaled amount of money sent by $i$
as a sender and
$i$
as a sender and $Trust j$
is the scaled amount of money sent by
$Trust j$
is the scaled amount of money sent by $j$
as a sender.
$j$
as a sender. $Trustworthy i$
is the scaled average amount of money sent back by individual
$Trustworthy i$
is the scaled average amount of money sent back by individual $j$
as a receiver and
$j$
as a receiver and $Trustworthy j$
is the scaled average amount of money sent back by individual
$Trustworthy j$
is the scaled average amount of money sent back by individual $j$
as a receiver. Dyadic-robust standard errors are reported in parentheses. Note that the sign, magnitudes and significance of the controls that play a role in predicting relation formation in the undirected analysis are very similar in each of the five directed regressions. The estimates of the coefficients on Trust and Trustworthiness are unreliably negative and positive, small and statistically not significant in 17 out of 20 cases. In the only 3 cases in which they are statistically significant, two of them at the
$j$
as a receiver. Dyadic-robust standard errors are reported in parentheses. Note that the sign, magnitudes and significance of the controls that play a role in predicting relation formation in the undirected analysis are very similar in each of the five directed regressions. The estimates of the coefficients on Trust and Trustworthiness are unreliably negative and positive, small and statistically not significant in 17 out of 20 cases. In the only 3 cases in which they are statistically significant, two of them at the $10\%$
level and one of them at the
$10\%$
level and one of them at the $5\%$
level,, the associated coefficients are negative.
$5\%$
level,, the associated coefficients are negative. $Trust \Delta$
is marginally significant in two of the regressions suggesting that it may be more likely for
$Trust \Delta$
is marginally significant in two of the regressions suggesting that it may be more likely for $i$
to nominate
$i$
to nominate $j$
as related to him in the
$j$
as related to him in the $Study$
or
$Study$
or $Confide$
networks when they differ in their propensities to trust.
$Confide$
networks when they differ in their propensities to trust.
Table C4. Robustness regressions: turnstile-based networks on reciprocal trust and various controls using different samples

This table presents the results of the analysis using larger student samples, based on turnstile-based networks, and omitting controls obtained from the survey or missing administrative data. Column (i) shows the results using all 2,415 dyads among the 70 students who provided complete answers to the trust experiment question. Columns (ii)–(iv) show the results using 2,016 dyads involving the 64 students who participated in the experiment and for whom we have complete administrative data. This sample omits some key controls from the survey. Dyadic-robust standard errors are shown in parentheses.
C.4 Other samples
As noted in Section 2, our baseline analysis is based on 1,485 dyads involving the 55 students for whom we have complete data from both stages of the data collection process: the experiment stage and the survey stage, as well as administrative data. The most significant attrition from the starting set of 72 students that participated in the experiment is among students who did not respond to the second-stage survey. Table C4 shows the results of the analysis using larger samples of students, relying on the turnstile-based networks and omitting controls obtained from the second-stage survey or from missing administrative data. Column (i) shows the result of our analysis using all the dyads (2415) among the 70 students who provided complete answers to the trust experiment question.Footnote 31 Columns (ii)-(iv) show the results of the analysis with 2016 dyads involving the sample of 64 students who participated in the experiment and for whom we have complete administrative data. Working with this sample forces us to omit some key controls that come from the survey.Footnote 32 The size of the coefficients associated to reciprocal trust and their significance do not change upon considering these larger samples.
C.5 Individual network statistics
The results of the paper point at some dyadic characteristics (knowing each other from before, time of exposure, having a similar socioeconomic background, and both being from Bogotá) which are robust and strong predictors of link formation. On the other hand there are no individual characteristics among those that we measured that consistently predict link formation. In principle, the predictive power of individual or dyadic characteristics over network structure should express itself through the presence or absence of individual links, but the predictive power of individual characteristics can also be studied directly through regressions of individual network statistics on individual characteristics. Table C5 shows that consistently with our main results, no individual characteristics are predictive of the degree centrality (the number of links), the eigenvector centrality or the betweenness centrality in the friends network.
C.6 Heterogeneous effects by gender
Table C6 shows the results of estimating models analogous to those in Table 7 but includes a term for the interaction between gender and reciprocal trust.
The rationale for estimating this model is to explore the hypothesis discussed in Section 3.5, according to which one of the reasons we may have failed to reject our null hypothesis that reciprocal trust predicts relationship formation is that in late adolescence, character traits like dominance may have a strong and counteracting effect. If the importance of such traits differs by gender, we would expect to find a different association between link formation and reciprocal trust according to gender. As shown in Table C6, we find no such heterogeneous effect and thereby lack supporting evidence for that plausible mechanism.
Table C5. Individual centralities in the friends network on individual characteristics

This table compares basic and full regression models for different centrality measures in the Friends network. Basic models include only Trust $i$
and Trust
$i$
and Trust $j$
as predictors. Full models include additional demographic and academic controls. Standard errors are shown in parentheses.
$j$
as predictors. Full models include additional demographic and academic controls. Standard errors are shown in parentheses. $^{*}p\lt 0.1$
;
$^{*}p\lt 0.1$
; $^{**}p\lt 0.05$
;
$^{**}p\lt 0.05$
; $^{***}p\lt 0.01$
.
$^{***}p\lt 0.01$
.
Table C6. Gender effects on friendship network: No controls, dyadic controls, and full controls


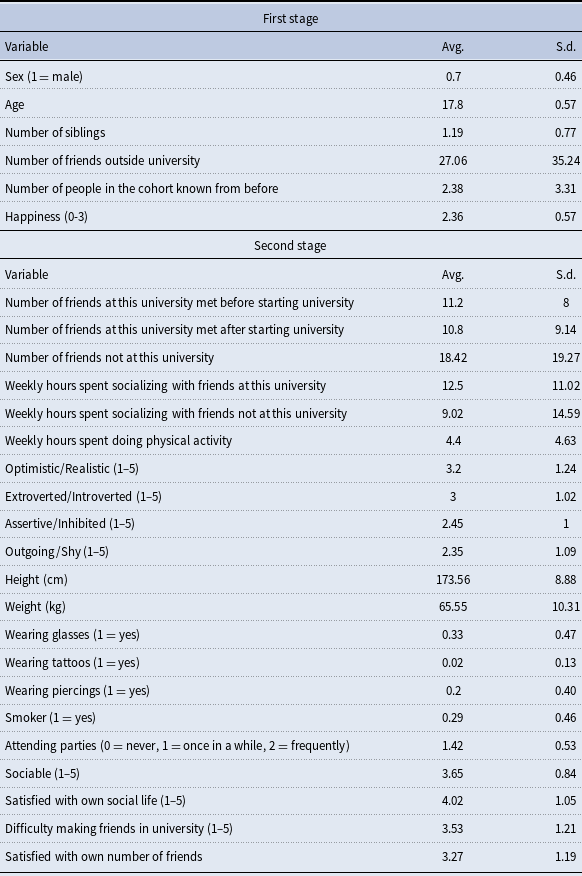
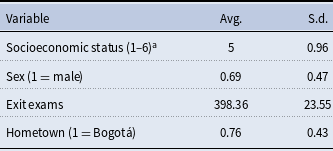
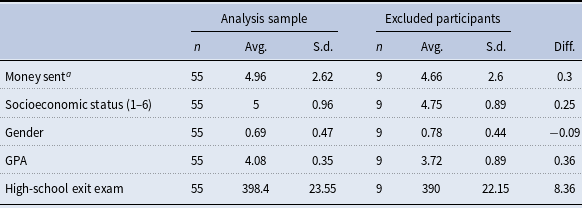


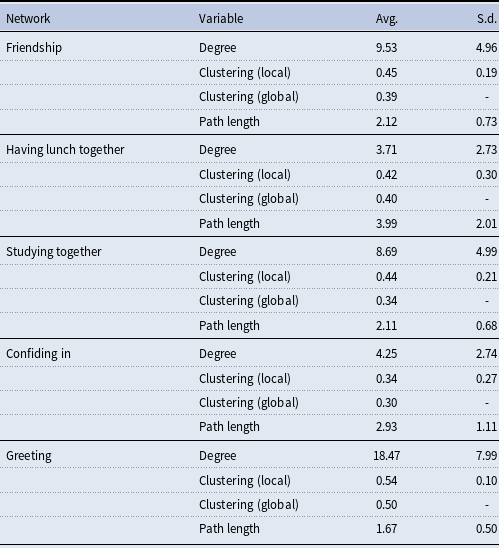
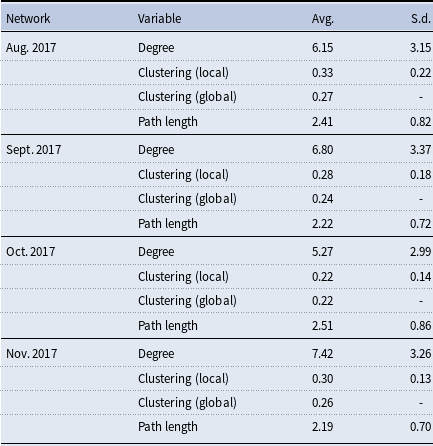
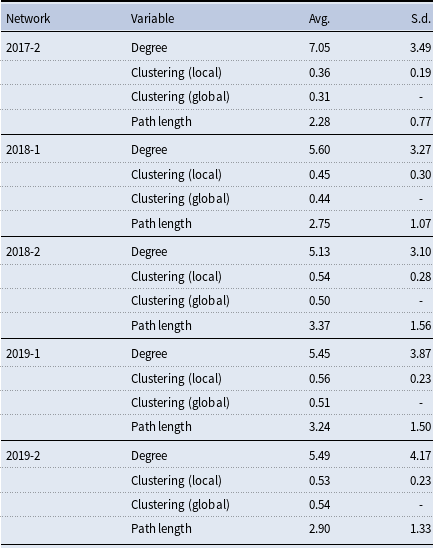
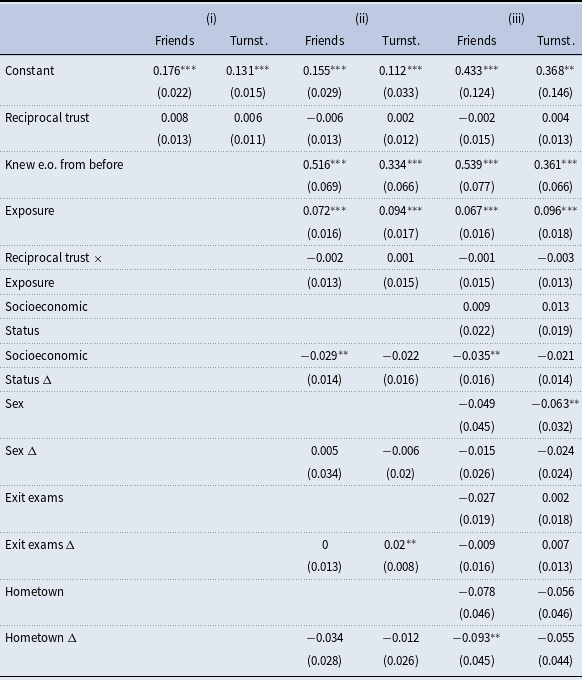


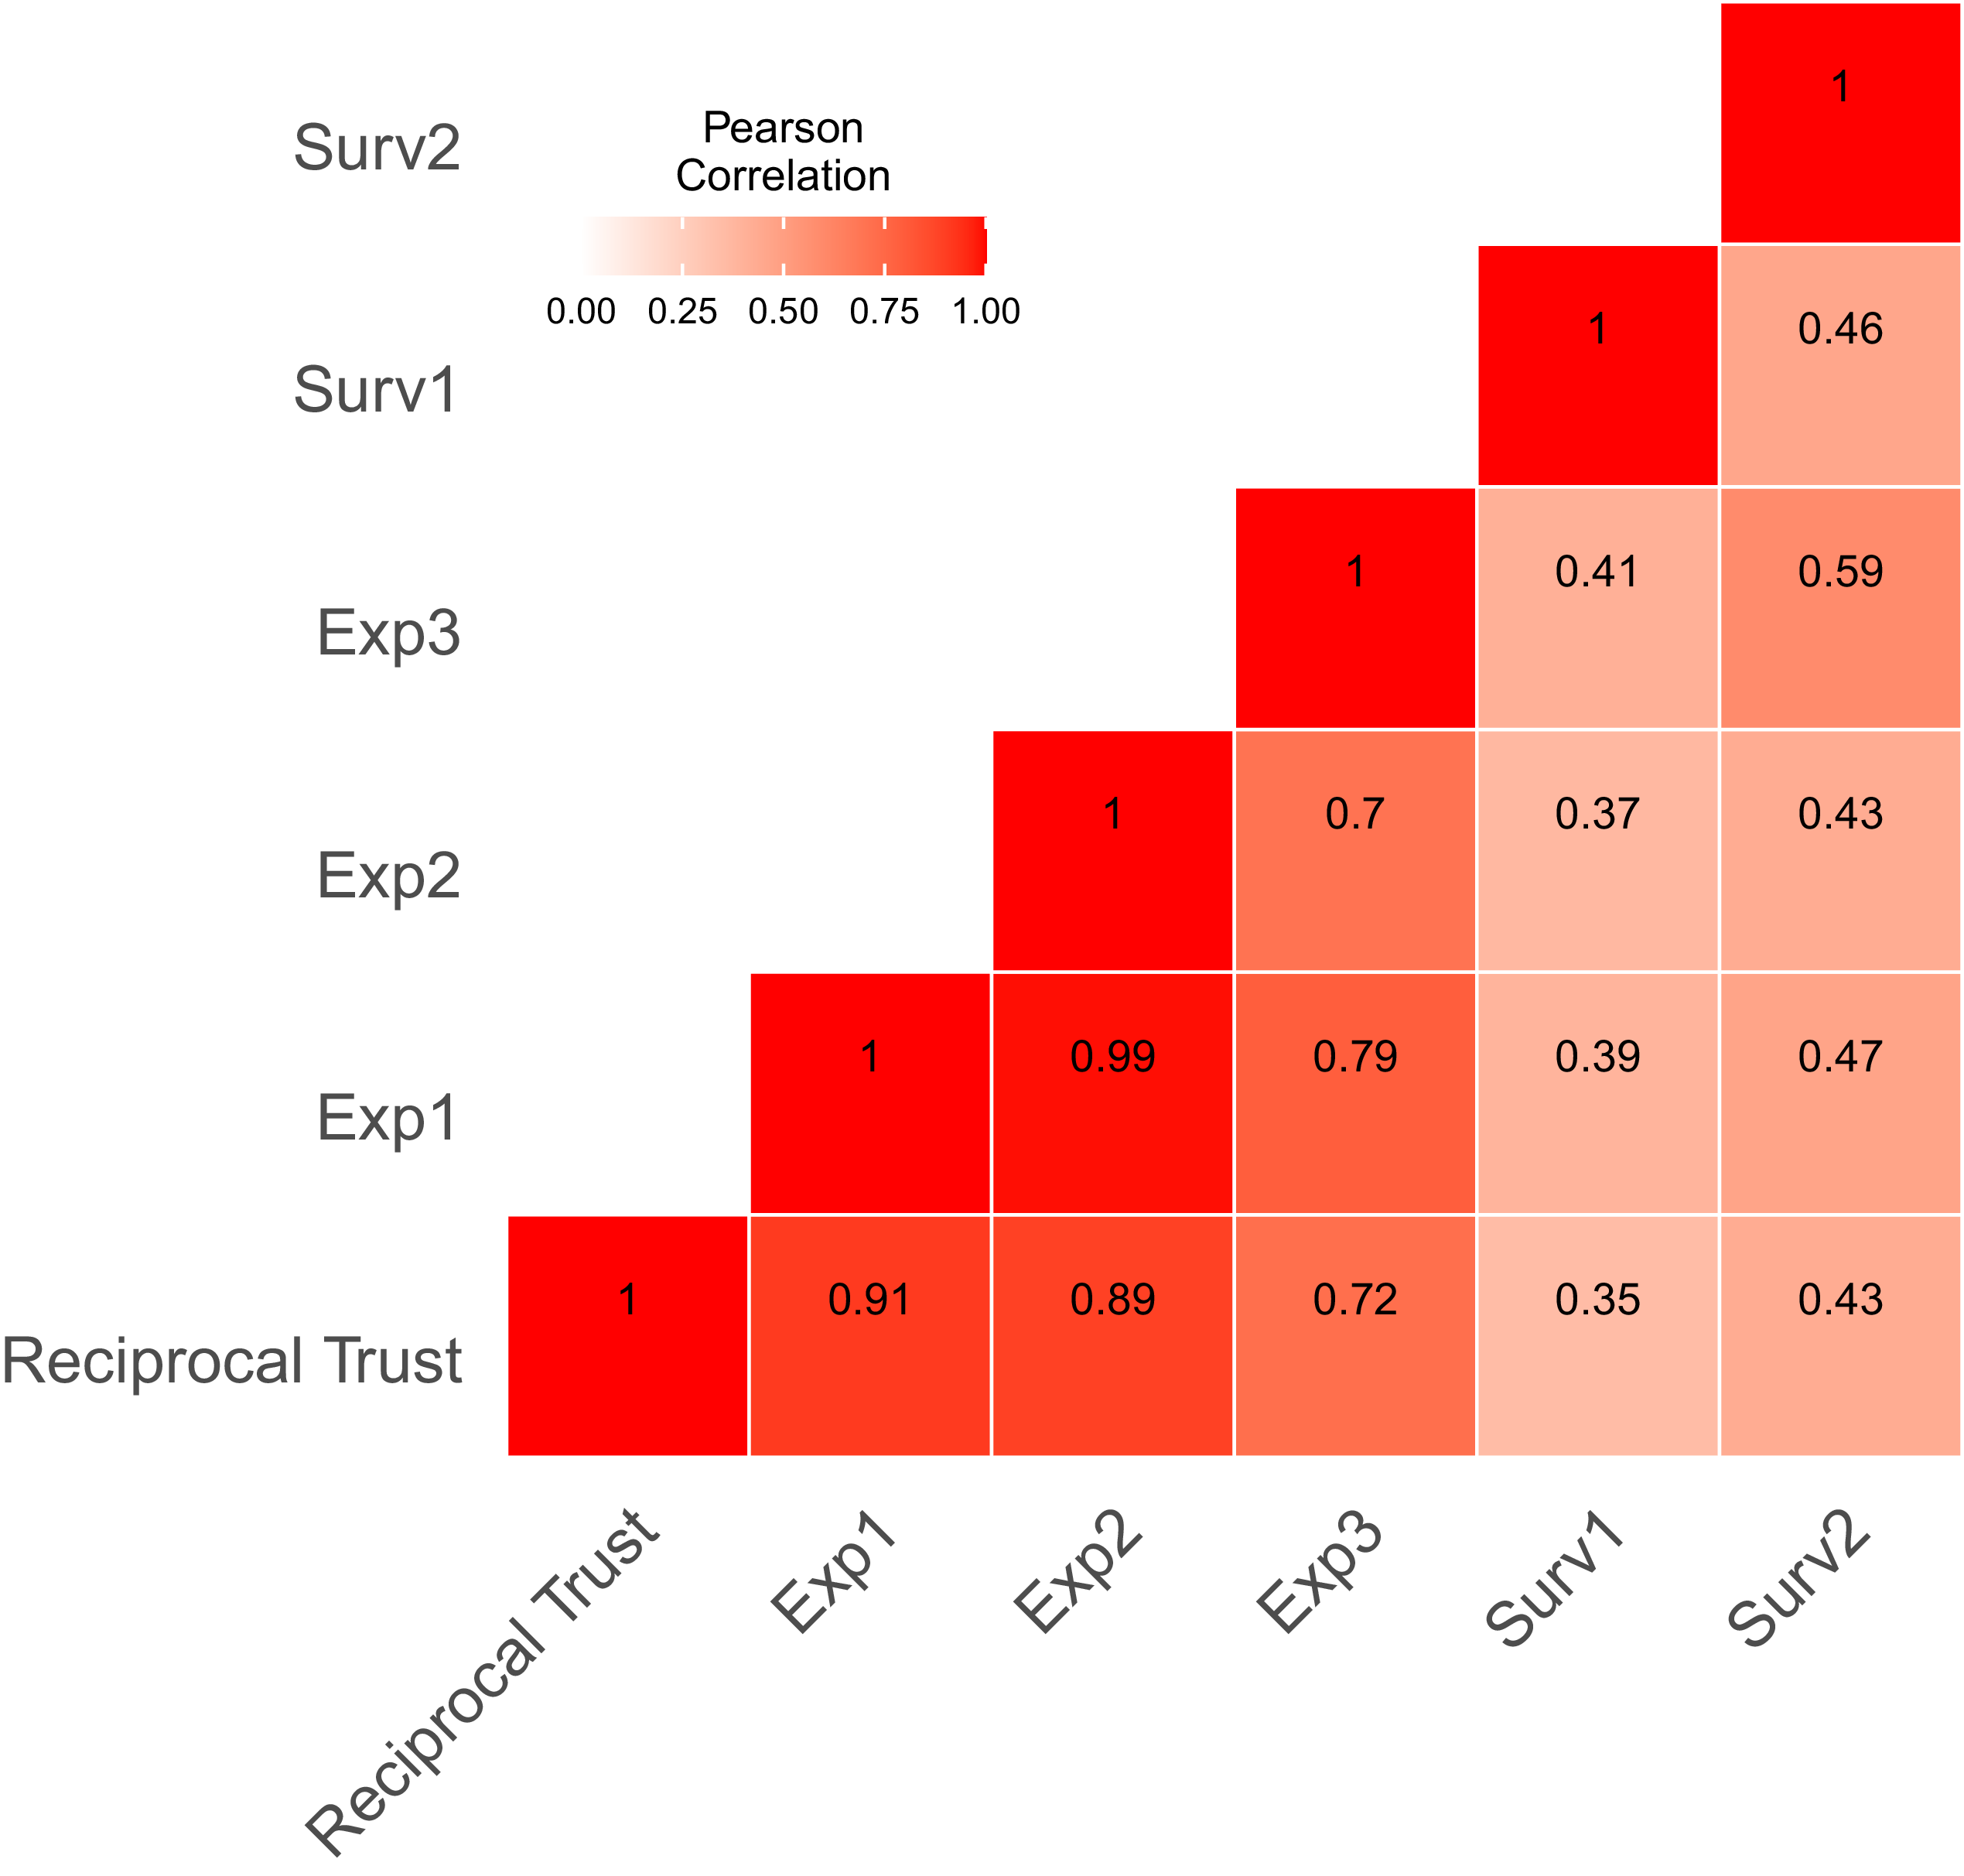
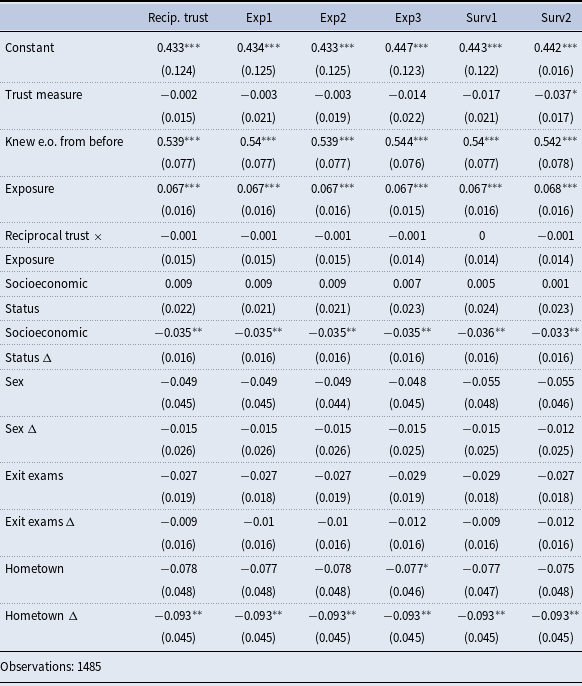
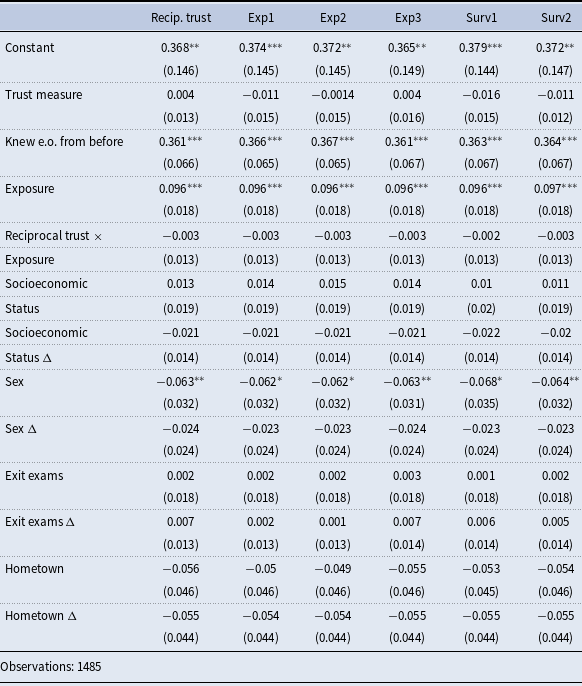
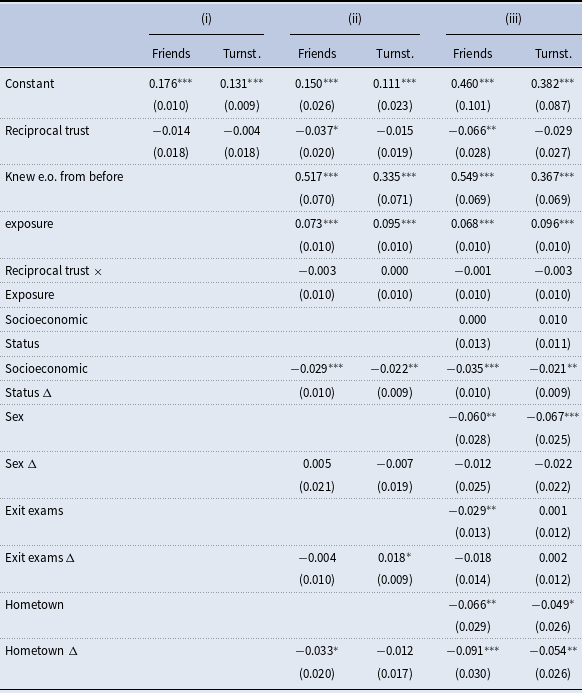
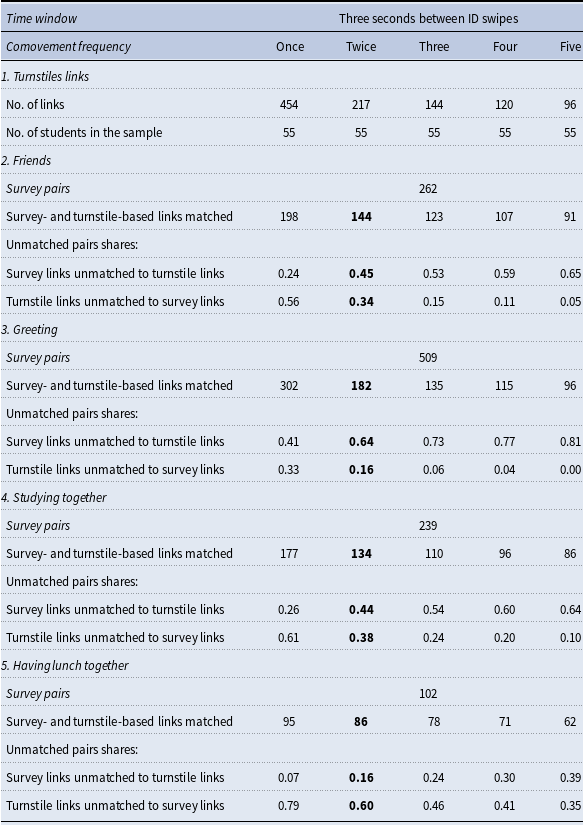

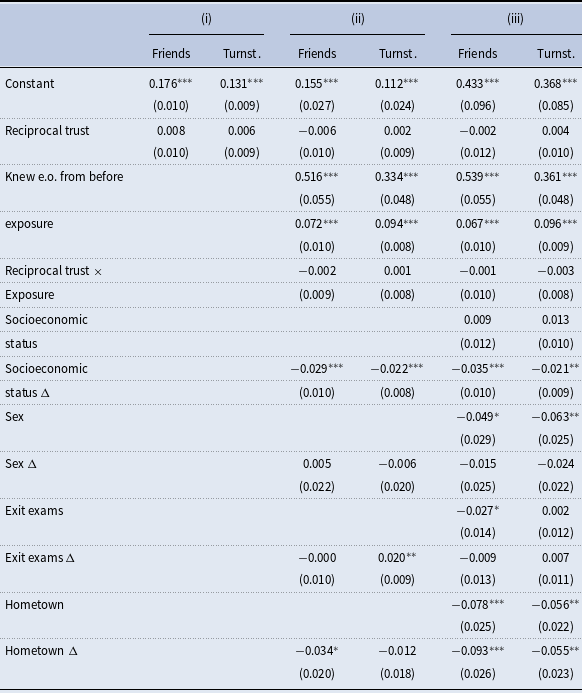
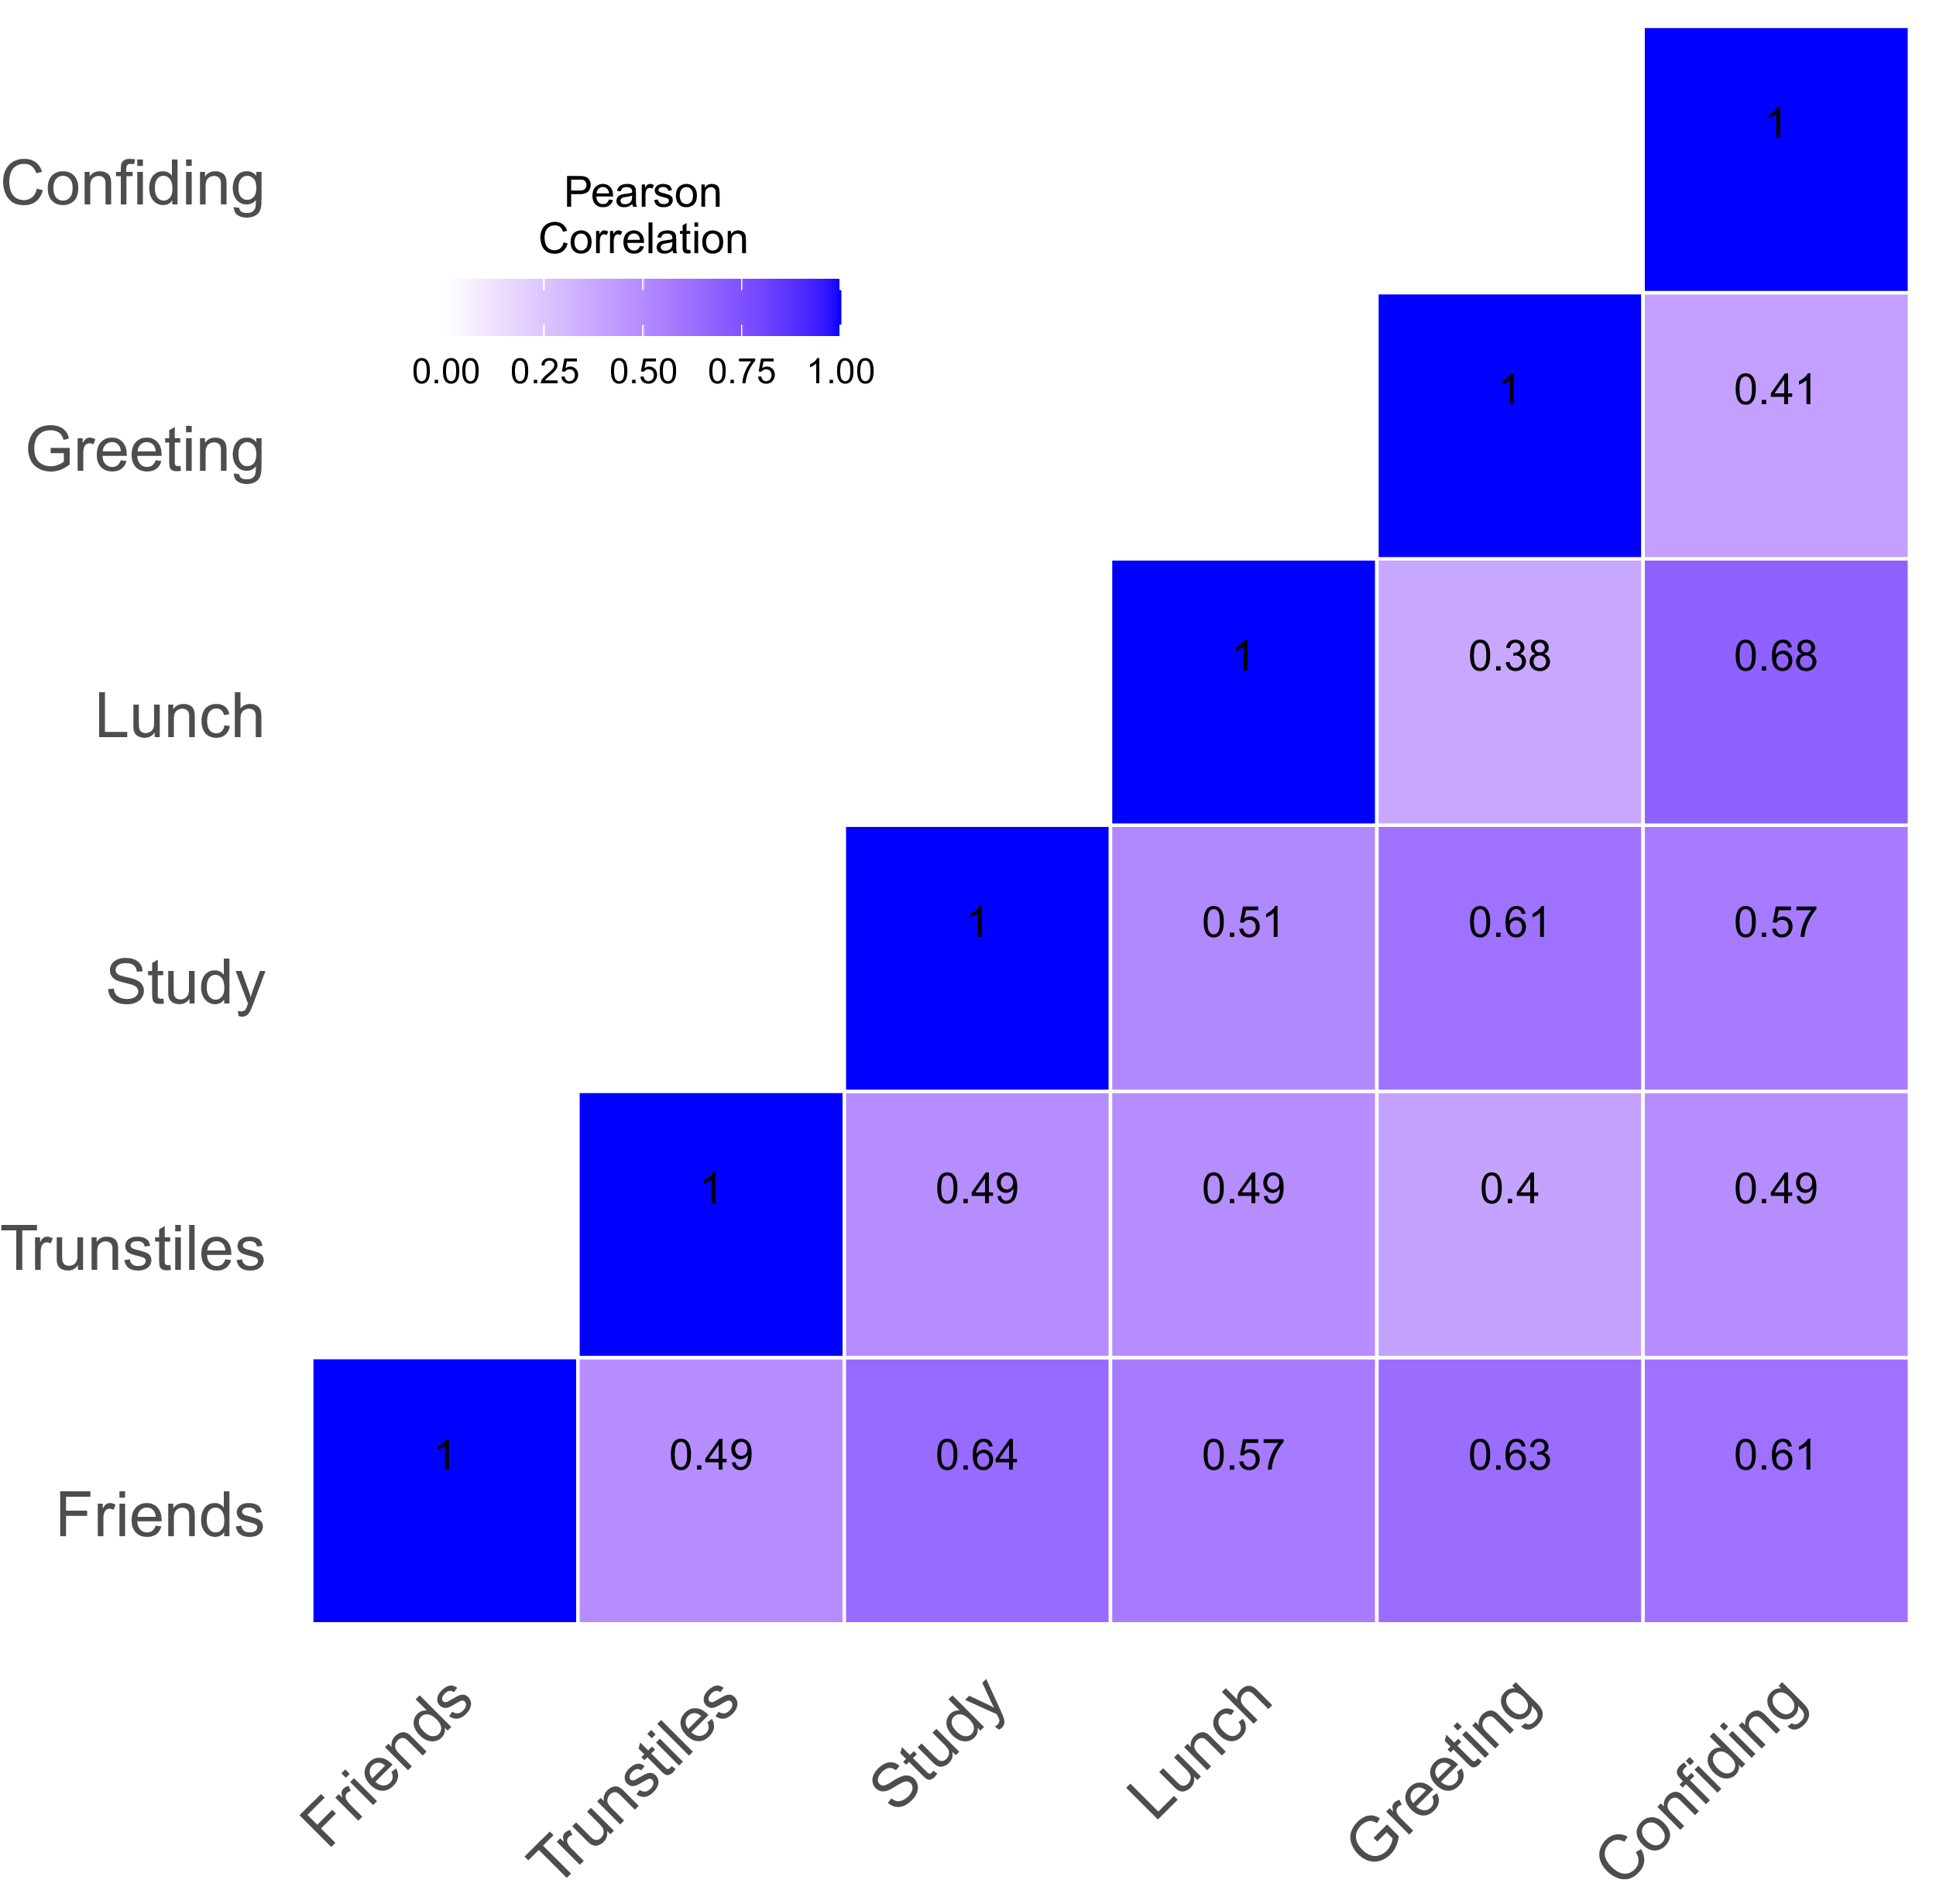
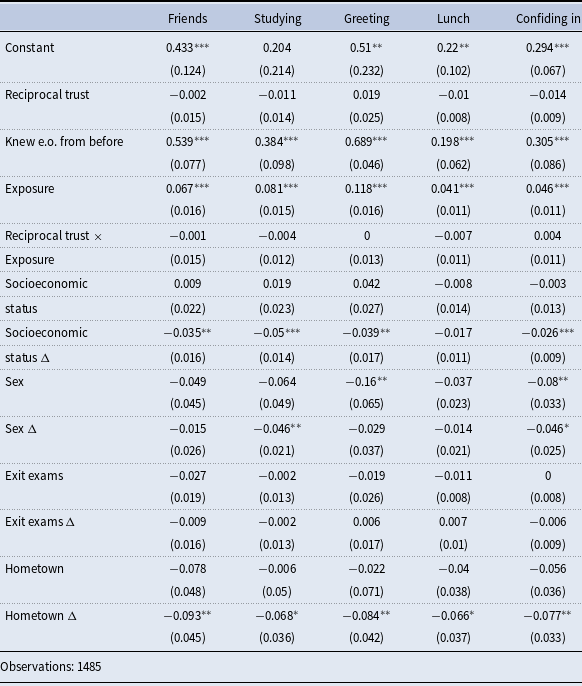
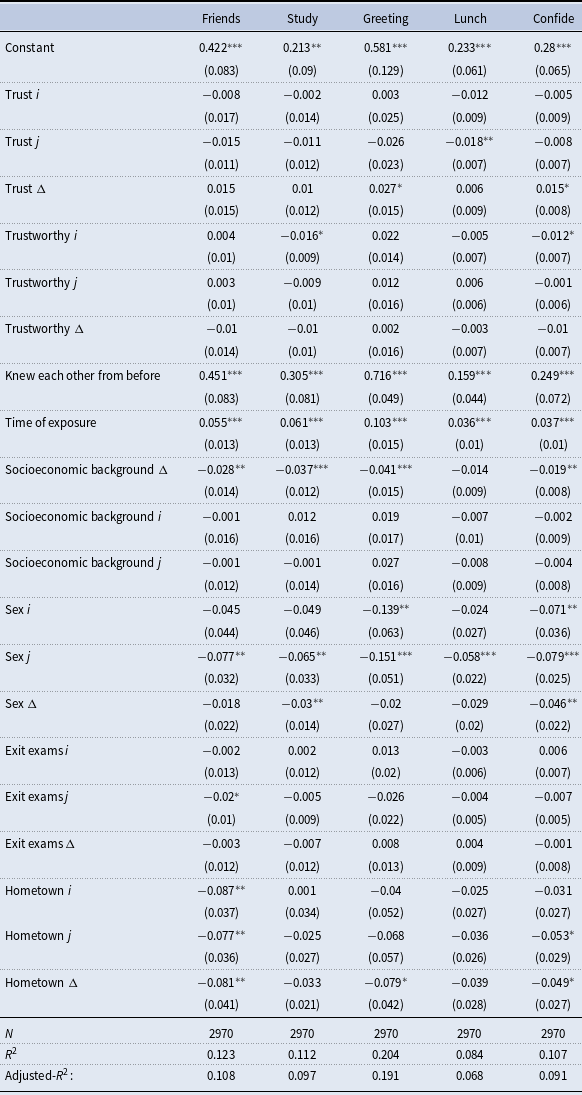
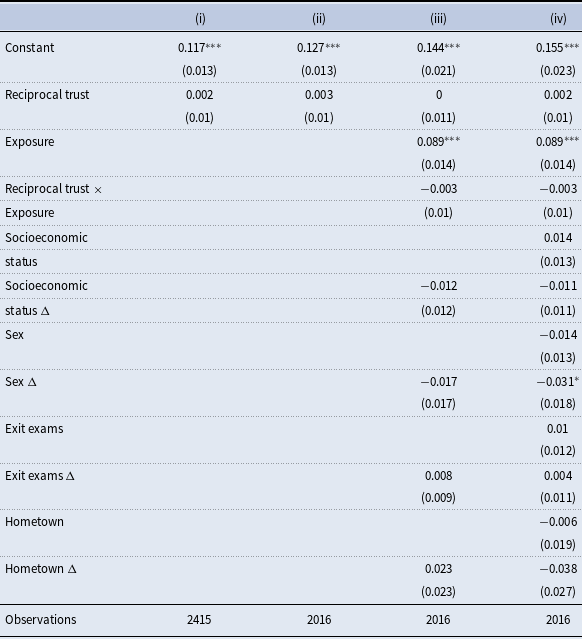
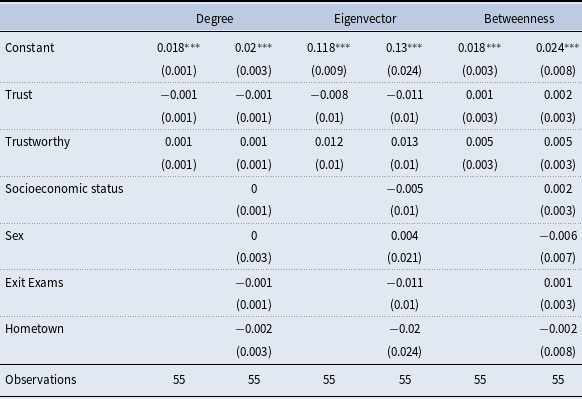
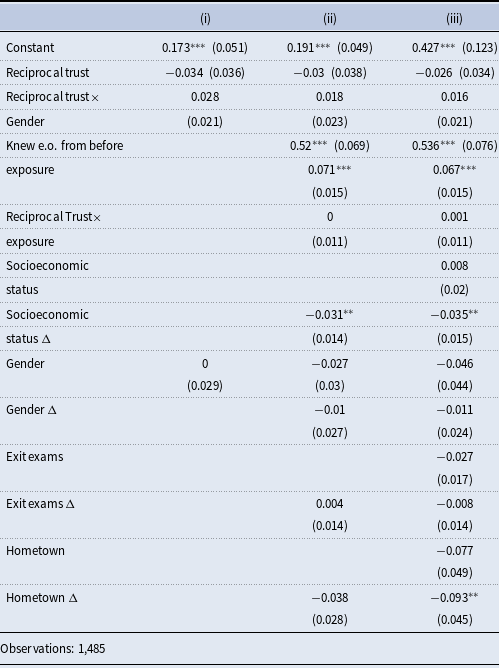

 Open access