


Introduction
Satisfaction with democracy (SWD) may play a key role in the future of liberal democracy. Although citizens’ dissatisfaction with how democracy works does not necessarily erode support for the democratic principle itself (Dahlberg et al., Reference Dahlberg, Linde and Holmberg2015), popular satisfaction can strengthen system stability and prevent radical changes (Bernauer & Vatter, Reference Bernauer and Vatter2012). The growing dissatisfaction with democracy on a global scale over the past decades can therefore be interpreted as a worrying trend (Foa et al., Reference Foa, Klassen, Slade, Rand and Williams2020; Valgarðsson & Devine, Reference Valgarðsson and Devine2022). And even though there is no uniform decline in the level of SWD across Europe, the widespread dissatisfaction found in some parts of the continent is also deemed preoccupying (Kriesi, Reference Kriesi2020). Therefore, despite the already vast literature dedicated to SWD, further analysis is warranted to understand the drivers of satisfaction and the dramatic cross‐country differences (Daoust & Nadeau, Reference Daoust and Nadeau2021; Valgarðsson & Devine, Reference Valgarðsson and Devine2022).
Ample evidence links SWD to individual factors, most prominently – but not exclusively – voting for government parties, the individuals’ economic situation, political interest, education as well as general satisfaction. The literature on SWD has also highlighted the determining role played by contextual features such as political institutions and system performance (Singh & Mayne, Reference Singh and Mayne2023). In this article, we contribute to the line of inquiry which, building on the seminal work of Anderson and Guillory (Reference Anderson and Guillory1997), argues that patterns of democracy influence people's assessment of and satisfaction with political systems (Lijphart, Reference Lijphart1999). The controversy notably revolves around the compared merits of majoritarian and consensus democracies, with Lijphart arguing that citizens in consensus systems are significantly more satisfied with the democratic system in their countries than citizens in majoritarian democracies (Lijphart, Reference Lijphart1999, p. 286). The notable advantage but also, in our view, one major limitation of Lijphart's approach (see also Bernauer & Vatter, Reference Bernauer and Vatter2012) is that it encapsulates a broad range of institutional and political features into a limited number of democratic models. In fact, by reducing many institutional characteristics into one single or a limited number of dimensions, this approach risks overlooking specific elements and mechanisms likely to drive citizens’ SWD. In other words, broad encompassing categorizations of democracies leave out the possibility that their constitutive components can have independent and diverging effects on citizens’ evaluations of the political system (Berggren et al., Reference Berggren, Fugate, Preuhs and Still2004). Therefore, and despite major advances in this research field, determining to what extent specific features of democratic systems are perceived by citizens and influence their level of SWD remains both a theoretical and an empirical challenge. Against this backdrop, the objective of our research is to disentangle which characteristics of democratic institutions and their performance matter the most for citizens’ SWD.
Another, methodological challenge that our research aims to address relates to the so‐called ‘too many variables and too few countries’ problems inherent to cross‐national comparative research designs (Goggin, Reference Goggin1986; Jackman, Reference Jackman1985; Lijphart, Reference Lijphart1971). As pointed out by Aarts and Thomassen (Reference Aarts and Thomassen2008) in their important study of the institutional determinants of SWD, ‘at the macro level, it is generally not feasible to disentangle the impact of different system characteristics because of interdependencies’ and it might therefore be preferable to ‘restrict the model specification to the most crucial variables’ (p. 11), thus leaving out potential important predictors of SWD. Another strategy for avoiding the shortcomings of standard observational analyses, and one we adopt here, is to rely on an experimental design. This enables us to simultaneously control for a wide array of country‐level attributes without making ecological inferences as is common in studies that use country‐level data. Besides, by relying on an experimental design, we can randomly generate scenarios that we otherwise would not be able to directly observe due to the limited number of combinations in the real world. Yet, we also consider the possibility that citizens’ criteria for assessing the quality of democratic systems vary across contexts, an observation often discussed in the literature (Dalton et al., Reference Dalton, Sin and Jou2007; Daoust & Nadeau, Reference Daoust and Nadeau2021; Mattes & Bratton, Reference Mattes and Bratton2007; Miller et al., Reference Miller, Hesli and Reisinger1997; Waldron‐Moore, Reference Waldron‐Moore1999; Wells & Krieckhaus, Reference Wells and Krieckhaus2006). We, therefore, conducted the survey experiment in three countries that differ significantly across important political attributes: France, Hungary and Italy.
In our empirical quest to connect SWD to country‐level factors, we rely on three constitutive dimensions of democracy that we further break down into eight attributes: (1) access to power (electoral system proportionality, ballot structure and party system fragmentation), (2) the policy‐making process (government fragmentation, government majority in parliament and the legislators’ local orientation) and (3) performance (economic performance and corruption). Compared to previous studies which focus on the effects of a limited number of macro‐features (usually one at a time), our analysis encompasses a broader range of democratic institutions, including features such as constituency service that have been left out of most studies despite them being key to the linkage function of democracies. In contrast to the vast literature emphasizing the importance of the national context, we find a surprisingly uniform picture across the three countries in our sample. Respondents across all countries recognize that proportionality and party system fragmentation magnify their voice by creating a more representative political climate. With regard to the output legitimacy of the political system, we find that respondents identify good economic performance and public probity as important features of a well‐performing democracy. The decision‐making process appears to play a greater and slightly different role than what is usually predicted in the literature. First, the observed effect of government fractionalization fits well with the idea that consensus systems featuring coalition governments generate more SWD. Second, we also find that citizens are less perceptive of the government's parliamentary majority: the impact of government type is not always statistically significant and may thus be context‐dependent. Third, the positive effect of the legislator's constituency orientation on SWD is a particularly noteworthy result that is found less frequently in the literature.
Competing attributes of SWD
Prior research demonstrates that beyond micro‐level predictors, different types of macro‐level, contextual factors influence citizens’ SWD. With regard to political institutions, scholars have looked at, among others, the type of electoral rules (Aarts & Thomassen, Reference Aarts and Thomassen2008; Papp, Reference Papp2022), including compulsory voting and district size (Berggren et al., Reference Berggren, Fugate, Preuhs and Still2004) or the type of regime (Christmann, Reference Christmann2018). Regarding performance measures, government effectiveness (Dahlberg & Holmberg, Reference Dahlberg and Holmberg2014), the rule of law and corruption (Wagner et al., Reference Wagner, Schneider and Halla2009), the quality of social protection (Lühiste, Reference Lühiste2014), how governments solve collective action problems (Halla et al., Reference Halla, Schneider and Wagner2013), income inequality (Kang, Reference Kang2015), economic performance and procedural fairness (Magalhães, Reference Magalhães2016) are put forth as determinants of SWD. Typically, these features of democratic systems are treated in isolation: it is thus impossible to compare their effects or to determine whether such effects hold in combination with other factors. Our aim is to overcome these limitations by incorporating into a single model, a broader range of institutional and contextual features representing the key dimensions of any political system.
To get a more complete picture of the factors affecting citizen SWD, in this article we draw inspiration from and freely combine several conceptual frameworks from the comparative politics literature that have sought to break down the democratic process into its key components. We notably adapt Mazzuca's (Reference Mazzuca2010) ‘access to’ and ‘exercise of’ power dichotomy as well as Munck's (Reference Munck2016) threefold framework distinguishing ‘access to government offices’ and ‘government‐decision‐making’ from the ‘implementation of government decisions.’ Such broad categorizations echo the classic models of regime support stemming from David Easton's systemic analysis of political processes: the input‐oriented model, which is focused on participation in the democratic process (Norris, Reference Norris1999), and the output‐oriented model, which emphasizes the importance of government performance (Dahlberg & Holmberg, Reference Dahlberg and Holmberg2014). These models are enriched with a third component, namely the procedures of government, that are deemed equally important for the legitimacy of democratic systems (Schmidt, Reference Schmidt2013). Accordingly, we build our empirical analysis on three distinct components of democracies developed from three questions: (1) Who makes the decisions?, (2) How are decisions made?, and (3) What are the consequences of these decisions?
Who makes the decisions?: Access to power
‘Access to power’ (Mazzuca, Reference Mazzuca2010) through competitive elections has always been viewed as a cornerstone of democratic quality. The minimal, electoral definition of democracy (Munck, Reference Munck2016) focuses on the electoral process including electoral rules and the competition between individuals and political parties, which are arguably a core dimension of the inputs into a political system. In our study, we zoom in on three aspects of ‘access to power’: electoral system proportionality, the ballot structure and party system fragmentation.
Electoral system proportionality
The electoral system is one of the most fundamental elements of democratic regimes: the more representative an electoral system, the more (indirect) say people have in government decision‐making. Besides the empirical reality of majority electoral systems generating higher entry thresholds and thus restricting access to power (Lijphart, Reference Lijphart1999), disproportional electoral rules spoil the representativeness of the electoral process (Powell, Reference Powell2000). As they increase input legitimacy (Scharpf, Reference Scharpf1999; Schmidt, Reference Schmidt and Schmidt2020), one can expect proportional systems to generate more satisfaction. Hence, unsurprisingly, empirical studies indicate that proportionality has a positive effect on SWD. Analysing data from four countries, Plescia et al. (Reference Plescia, Blais and Högström2020) show that citizens have a strong preference for proportional electoral rules. Using data from 10 multi‐ethnic post‐communist countries, Ruiz‐Rufino (Reference Ruiz‐Rufino2013) demonstrates that more proportional election results are associated with higher levels of SWD. Aarts and Thomassen (Reference Aarts and Thomassen2008), Christmann and Torcal (Reference Christmann and Torcal2018) and Donovan and Karp (Reference Donovan and Karp2017) come to a similar conclusion in their analyses of larger‐scale cross‐national surveys. Additionally, there is evidence that the lack of proportionality depresses SWD (Berggren et al., Reference Berggren, Fugate, Preuhs and Still2004; Blais et al., Reference Blais, Morin‐Chassé and Singh2017). Based on the cited literature, we confidently expect that
-
Hypothesis 1. A proportional electoral system generates more SWD than a disproportional electoral system.
Ballot structure
Second, we consider the effect of electoral system personalization on democratic satisfaction. We do this by differentiating between electoral rules applying different ballots, such as candidate, party and mixed ballots. Surveying the literature on the relationship between ballot structure and SWD, we find mixed results. On the one hand, studying electoral system changes, Renwick and Pilet (Reference Renwick and Pilet2016) find no evidence of increasing democratic satisfaction after adopting more personalized electoral rules. Papp (Reference Papp2022) shows that once the effect of the legislators’ constituency orientation is filtered out, the ballot structure has no direct effect on SWD. Additionally, the analysis of Bosch and Orriols (Reference Bosch and Orriols2014) reveals that while there is a positive relationship between ballot openness and SWD, it is only prevalent for a small share of the electorate (i.e., the most sophisticated voters). On the other hand, majority systems with single‐member districts boost satisfaction by increasing legislators’ accountability (Norris, Reference Norris1999). Preferential vote also offers voters greater freedom to choose between candidates and hence strengthens the sense of political efficacy (Farrell & McAllister, Reference Farrell and McAllister2006). Likewise, one can argue that personalized ballots increase satisfaction by creating a strong linkage between voters and legislators. In personalized systems, the incentives of personal vote seeking increase and legislators become more invested in cultivating their responsiveness to citizens’ demands. Conversely, under party‐centred electoral rules, legislators focus on the internal selectorates, neglecting the constituent–legislator link (Farrell & McAllister, Reference Farrell and McAllister2006). This may affect how citizens perceive the performance of the political system. Based on previous findings, we anticipate that
-
Hypothesis 2. Personalized ballots have either a positive effect on SWD or no effect.
Party system fragmentation
Also on the ‘input’ side, the political offer is likely to affect citizens’ perceptions of the political system. Indeed, a greater number of parties collectively give voters more choices (Andeweg & Farrell, Reference Andeweg, Farrell, Thomassen, van Ham, Aarts and Andeweg2017) and ensure a more diverse representation of opinions (Hoffman, Reference Hoffman2005) and it is more likely that voters find a party that they like (Taagepera et al., Reference Taagepera, Selb and Grofman2014). Political parties are the main avenue through which political elites supply policy alternatives. A limited number of parties (typically two‐party systems) makes it very improbable that all voters will find a political offer that meets their preferences. Reversely, increasing the number of parties potentially widens the set of policy positions from which voters can choose. Hence, a more fragmented party system with a larger number of political parties can cover a broader ideological range. In other words, with a more fragmented party system, citizens can expect a higher probability (a) of finding an electoral offer that meets their preferences and (b) of having representatives whose preferences are congruent with their own.Footnote 1 This, again, potentially strengthens the input legitimacy of the democratic system. However, empirical evidence is mixed. Anderson (Reference Anderson1998) demonstrates a positive relationship between the number of parties and SWD, Dassonneville and McAllister's (Reference Dassonneville and McAllister2020) analysis reveals only a small positive effect, while Berggren et al. (Reference Berggren, Fugate, Preuhs and Still2004) show that SWD first decreases and then increases with rising party system fragmentation. Overall, because of the strong argument around increasing input legitimacy, we expect that
-
Hypothesis 3. Party system fragmentation has a positive impact on SWD.
How are decisions made?: Policy‐making processes
Beyond the electoral process, the quality of democracy hinges – at least to some extent – on how decisions are made (Munck, Reference Munck2016). While there is no agreement on characteristics with which to describe the ‘policy‐making processes’ (Schmidt, Reference Schmidt2013, p. 7) or the ‘exercise of power’ (Mazzuca, Reference Mazzuca2010; Munck, Reference Munck2016), we take into account the functioning of the two most important institutions in a parliamentary system, namely, the government and the parliament.
The political capacity of the government: Government fractionalization and coalition government
In parliamentary democracies, the exercise of public executive power is vested in governments, whose capacity to deliver effectively and respond to citizens’ needs ‘depends largely on the political conditions that prevail during their reign’ (Müller, Reference Müller and Caramani2014, p. 139). Müller (Reference Müller and Caramani2014) identifies two major political features that shape the organization and operation of governments. The first is whether the government enjoys majority support – at least 50 per cent of the seats plus one – in parliament. The second is whether the government is constituted of a single party or a coalition of parties. Research on SWD has so far neglected the majority/minority government dichotomy to focus on the implications of government fractionalization (i.e., the distinction between single‐party and coalition governments).
The evidence regarding the effect of government fractionalization on how citizens assess the state of democracy in their country is mixed. On the one hand, Kestilä‐Kekkonen and Söderlund's (Reference Kestilä‐Kekkonen and Söderlund2017) study of 31 European countries finds that the larger the number of parties in government the more satisfied citizens are with democracy. This finding stands solidly with studies arguing that people in consensus democracies score higher on SWD (Lijphart, Reference Lijphart1999; Listhaug et al., Reference Listhaug, Aardal, Ellis and Klingemann2009). On the other hand, using data from the Comparative Study of Electoral Systems (CSES), Christmann and Torcal (Reference Christmann and Torcal2018) observe that greater government fractionalization leads to lower levels of SWD. They argue – in accordance with Powell (Reference Powell2000) and Lundell (Reference Lundell2011) – that electoral accountability only works if citizens are aware of which parties are responsible for what policies. This responsibility is clearest in the case of single‐party governments. However, the validity of these findings and interpretations may be limited by the fact that, as already pointed out, the existing empirical research conflates two aspects of government functioning that citizens may value equally: the inclusiveness of governments and their ability to deliver. We seek to tap into these two distinct dimensions by formulating complementary hypotheses for the majority/minority status of the governments and their degree of fractionalization.
As regard government fractionalization, in line with the preceding discussion regarding ‘access to power’, we expect a positive relationship between government inclusiveness and SWD. At the same time, there is extensive evidence that citizens’ judgement about democracy may be affected by whether or not they voted for a party that is in government (Anderson & Guillory, Reference Anderson and Guillory1997). Accordingly, we hypothesize that
-
Hypothesis 4a. Coalition governments increase citizens’ SWD.
-
Hypothesis 4b. Coalition governments increase the SWD of the losers of the elections more than that of the winners.
While citizens may prefer an ‘inclusive’ coalition government to a one‐party government, they are certainly eager to have a government with sufficient room‐for‐manoeuvre and a capacity to deliver in terms of public policies. Reversely, they may seek to avoid the powerlessness and the ‘immobilisme’ often associated with minority governments (Müller, Reference Müller and Caramani2014, p. 140). From this perspective, majority governments have several advantages. First, government decisions may be viewed as more legitimate if they are made by a government that is backed by a majority of peoples’ representatives. Second, a majority government is less restricted in its decision‐making, which impacts accountability. In the case of a minority government, for the sake of governability, decisions are made with the involvement of opposition parties. This blurs responsibilities and voters do not know which party to punish (or reward) for a specific decision or outcome. Electoral choices become more difficult. Less accountability may lead to more dissatisfaction with how democracy works.
At the same time, winners and losers may have different perspectives on the matter. Winners should be more satisfied if their party is part of a majority government, which allows the government to govern without much restriction by the opposition. Contrarily, we argue that, the losers of the elections may prefer a minority government that, on the one hand, provides less power to the government to unilaterally change the direction of policies and the institutional architecture, and on the other hand, allows a greater say for the opposition in decision‐making (Strøm, Reference Strøm1990). The discussion above motivates the following hypotheses:
-
Hypothesis 5a. Majority governments increase the citizens’ SWD.
-
Hypothesis 5b. Majority governments increase the satisfaction of the winners of the election more than that of the losers.
Legislators’ local orientation
Finally, and nevertheless importantly, citizens’ expectations of the legislators’ representational roles are key to the process of representation (Castiglione & Warren, Reference Castiglione, Warren, Disch, Urbinati and van de Sande2019). However, while there is no shortage of publications linking SWD to mass‐elite ideological congruence (Brunell & Buchler, Reference Brunell and Buchler2009; Dahlberg et al., Reference Dahlberg, Linde and Holmberg2015; Ruiz‐Rufino, Reference Ruiz‐Rufino2013; Vivyan & Wagner, Reference Vivyan and Wagner2016), previous studies have not – to the best of our knowledge – tested whether the constituency orientation of parliamentarians affects citizens’ SWD. The message of attitude proximity is that legislators are aware of and responsive to the problems of citizens (Berggren et al., Reference Berggren, Fugate, Preuhs and Still2004) and that they approach their work in a manner that is less elitist (Bøggild, Reference Bøggild2020). Regarding citizens’ expectations, a surprisingly uniform picture emerges across various political systems: of all the possible foci and styles of representation incorporated in citizen surveys, respondents prefer that legislators focus on representing the constituency (Bengtsson & Wass, Reference Bengtsson and Wass2011; Campbell & Lovenduski, Reference Campbell and Lovenduski2015; von Schoultz & Wass, Reference von Schoultz and Wass2016) and work as delegates of the voters rather than of the party (Bøggild, Reference Bøggild2020; Carman, Reference Carman2006). Citizens interpret politicians’ helpfulness as a sign of good representation, which has in turn the potential to increase citizens’ democratic satisfaction (Thomas et al., Reference Thomas, Loewen and MacKenzie2013). Accordingly, we expect that
-
Hypothesis 6. The legislators’ local focus positively affects the citizens’ SWD.
What are the consequences of these decisions?: Performance
While the above two questions focus on the procedural aspects of democracy, the performance dimension captures its substantive elements. One may connect this to output legitimacy: better performance in various fields makes a democracy more legitimate in the people's eyes (Strebel et al., Reference Strebel, Kübler and Marcinkowski2019). We extend our analysis to two substantive measures, namely economic performance and the level of corruption.
Economic performance
While there is a lot of ambiguity around whether democracy and economic development are causally connected (Doucouliagos & Ulubaşoğlu, Reference Doucouliagos and Ulubaşoğlu2008; Gerring et al., Reference Gerring, Bond, Barndt and Moreno2005), data from Wave 5 (2005–2007) of the World Values Survey (Inglehart et al., Reference Inglehart, Haerpfer, Moreno, Welzel, Kizilova, Diez‐Medrano and Puranen2018) indicate that an overwhelming majority of respondents from all over the world think that a ‘prospering economy’ is an essential characteristic of democracy. Unsurprisingly, there is no shortage of studies focusing on the relationship between the state of the economy and citizens’ SWD. Harnessing the richness of available data, authors test the connection on exceptionally large samples of established democracies (Christmann, Reference Christmann2018; Daoust & Nadeau, Reference Daoust and Nadeau2021; Kestilä‐Kekkonen & Söderlund, Reference Kestilä‐Kekkonen and Söderlund2017; Magalhães, Reference Magalhães2016; Nadeau et al., Reference Nadeau, Daoust and Arel‐Bundock2020; Quaranta & Martini, Reference Quaranta and Martini2016). The effect seems to hold in a variety of geographical locations such as Southern Europe (Quaranta & Martini, Reference Quaranta and Martini2017), Sub‐Saharan Africa (Guldbrandtsen & Skaaning, Reference Guldbrandtsen and Skaaning2010) as well as Central Europe (Vlachová, Reference Vlachová2019). Claassen and Magalhães (Reference Claassen and Magalhães2022) confirm the hypothesis for a mix of democratic and ‘not that democratic’ countries. This leads to
-
Hypothesis 7. Citizens are more satisfied with democracy when the economic context is more favourable.
Corruption
When thinking about system performance, one cannot ignore the effect of corruption on SWD. Corruption is widely understood as impeding the impartiality of the ‘exercise of power’ and procedural fairness, a basic element of the rule of law. It is also sometimes viewed as an output‐related phenomenon affecting the quality of government. Regardless of how we look at it, corruption influences if and how much citizens trust political institutions and how they evaluate the performance of the political system. Empirical evidence is surprisingly mixed, though, with a few studies reporting no significant effects (Quaranta & Martini, Reference Quaranta and Martini2017; Wells & Krieckhaus, Reference Wells and Krieckhaus2006). Stockemer and Sundström (Reference Stockemer and Sundström2013) show that while micro‐level corruption (i.e., corruption of the police and judges) negatively affects SWD, macro‐level corruption has no effect. This notwithstanding, utilizing time series cross‐section data from democratic countries, among others, Reference Wagner, Schneider and HallaWagner et al. (2009), Christmann and Torcal (Reference Christmann and Torcal2018), Claassen and Magalhães (Reference Claassen and Magalhães2022) and Donovan and Karp (Reference Donovan and Karp2017) find evidence that aggregated individual perceptions of corruption (typically the corruption perceptions index – CPI) and SWD are negatively related. Further analysis supports that perceived corruption measured on the individual level also negatively affects democratic satisfaction (Linde & Erlingsson, Reference Linde and Erlingsson2013; Pellegata & Memoli, Reference Pellegata and Memoli2018). It follows that:
-
Hypothesis 8. Corruption negatively affects citizens’ SWD.
Government ideology: The winner–loser gap
While the primary focus of this study does not centre on the government's ideological leaning, we must control for it to accurately measure the gap between winners and losers in democratic satisfaction (Bernauer & Vatter, Reference Bernauer and Vatter2012; Blais et al., Reference Blais, Morin‐Chassé and Singh2017; Curini et al., Reference Curini, Jou and Memoli2012; Singh, Reference Singh2014). Although the effect size varies depending on the political system, the link between citizens' political preferences and democratic satisfaction appears to be consistent across a broad spectrum of countries, including both established and weaker democracies (Han & Chang, Reference Han and Chang2016; Nadeau et al., Reference Nadeau, Daoust and Dassonneville2023), Latin America (Farrer & Zingher, Reference Farrer and Zingher2019; Monsiváis‐Carrillo, Reference Monsiváis‐Carrillo2022), Europe, Africa and Asia (Farrer & Zingher, Reference Farrer and Zingher2019). Halliez and Thornton (Reference Halliez and Thornton2023) observe the winner–loser gap in SWD in the United States by applying more rigorous estimation techniques. Importantly, Loveless (Reference Loveless2021) finds that the differences between winners and losers do extend to a longer period of time after the elections. In the following analysis, we relate the government's ideology to the respondents’ position on the left–right scale to assess the size of the winner–loser gap (see also Kim, Reference Kim2009).
The conjoint experiment
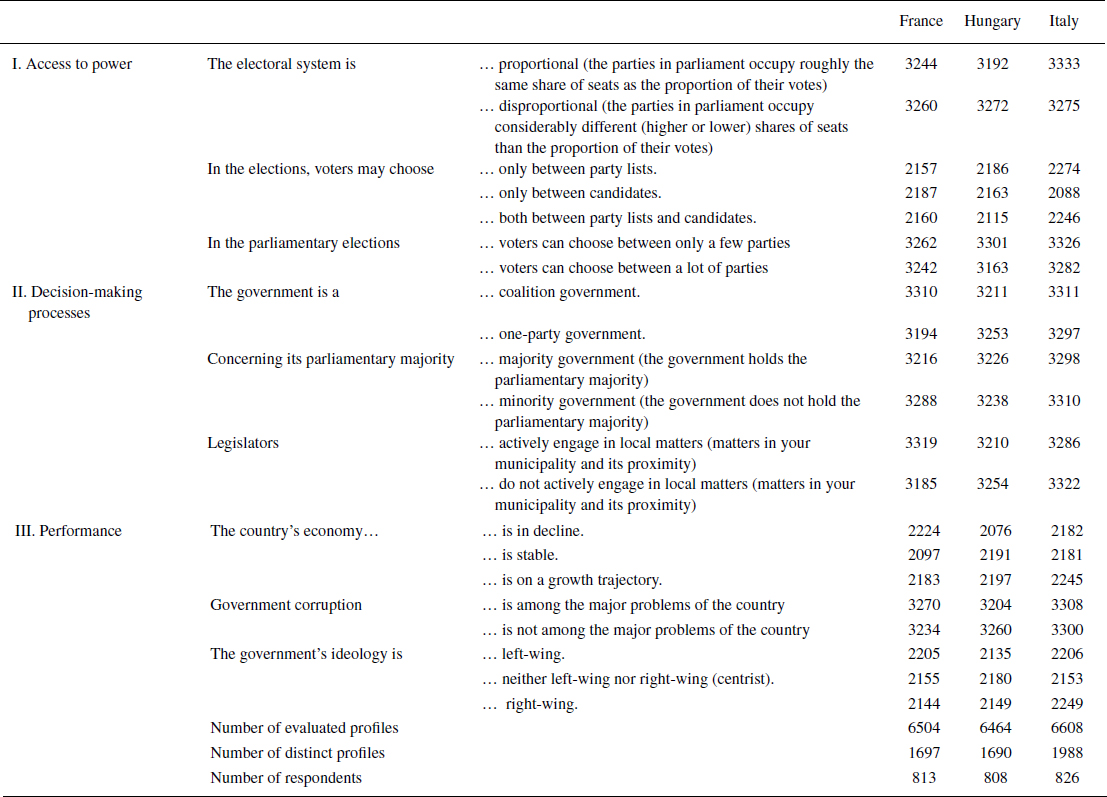
To empirically assess how our key variables contribute to citizens’ SWD, we conducted a conjoint experiment. Conjoint experiments, as a form of survey experiments, are useful in identifying and estimating multiple causal effects nonparametrically. The effects of the various attributes can be directly compared, which allows the researcher to test several hypotheses at the same time (Hainmueller et al., Reference Hainmueller, Hopkins and Yamamoto2014). After answering questions about socio‐demographics and attitudes towards politics and democracy, respondents are presented with two country profiles: Country A and Country B. The two countries are described with nine attributes, as shown in Table 1.
Table 1. The list of attributes in the conjoint experiment and their frequency in each sample

After showing the country profiles to the respondents, they are asked the following question: (1) ‘On the whole, in which country would you say you would be more satisfied with the way democracy works?’ (A or B). Since, to our knowledge, no other studies have yet attempted to investigate SWD in an experimental design, we could not rely on previous research to formulate our dependent variable. Therefore, we reached back to the traditional SWD survey itemFootnote 2 and adapted it to our hypothetical scenario. At the same time, we acknowledge that, as in all hypothetical scenarios, responses may be subject to hypothetical bias. Notwithstanding, Hainmueller et al. (Reference Hainmueller, Hopkins and Yamamoto2014) highlight that conjoint experiments creating hypothetical scenarios perform well against real‐world preferences, and preliminary results of Horiuchi et al. (Reference Horiuchi, Markovich and Yamamoto2022) show that fully randomized conjoint designs reduce social desirability bias. Throughout the article, we refer to responding to this question as the ‘task’. Respondents perform the task four times with randomly varying country profiles.
We apply two types of randomizations in the survey design. First, we generate country profiles in a randomized manner: for each task, attribute values are randomly assigned to the country profiles. Second, for each respondent, the attributes appear in random order. However, the order of attributes remains the same for each respondent throughout their four tasks. In other words, each respondent sees the attributes in a different order, while the order of the attributes per respondent does not change. This latter restriction on randomization seems necessary because early tests of the questionnaire revealed that randomizing intra‐respondent attribute order creates a cognitive burden that may compromise data quality. This simplification is also admitted by Hainmueller et al. (Reference Hainmueller, Hopkins and Yamamoto2014, p. 4).
Moreover, we do not exclude any combination of attributes from the country profiles presented to the respondents. One could argue that this decision hurts the external validity since it does not take into account the connection between, for instance, the electoral system and government and party system fragmentation in ‘real life’. However, we argue that we are only able to assess the relative importance of each attribute – as one of the main goals of this study – by artificially separating them from each other. This makes our empirical approach more powerful as opposed to cross‐sectional survey data where these features are not separable.
Last but not least, one could argue that the choice task in this conjoint experiment is too demanding, and it is questionable whether individuals are fully able to grasp the information we provide. Such concerns may be warranted, but we think that they do not invalidate our experimental setup. Much the same as citizens in real life, respondents are in fact expected to resort to heuristics. In the context of the conjoint experiment, we expect that respondents will ‘flag’ a low number of profile attributes, those they deem most important and solve the task by paying special attention to the respective attributes. This saves time and cognitive resources. We think that in the end, it does not undermine the internal validity of our experiment, because we are precisely interested in what attributes are the most important for the evaluation of the quality of democracy. In other words, we are interested in which attributes respondents ‘flag’ most commonly.
Countries in the study
We selected three European countries for our study with meaningful variation across the key indicators: France, Hungary, and Italy. While we ask respondents in the conjoint experiment to evaluate hypotheticals, we maintain the possibility that the respondent's environment and experiences ‘leak’ into the experiment. Performing the experiment in multiple countries that are different along several key criteria increases the study's relevance and contributes to its external validity. Our selected countries have different electoral rules, with varying levels of proportionality. France and Italy were governed by coalition governments after 2010, while Hungary had a single‐party government. Transparency International's CPI scores also show substantial variation with France being the ‘cleanest’ and Italy being the most corrupt, with Hungary not far behind. In terms of economic performance, Hungary enjoyed the highest economic growth between 2010 and 2020, while Italy faced a slight economic decline. Based on self‐reported data from 2009–2012, we find that the intensity of the legislators’ local orientation also differs across countries: French MPs reported that they spend about an average of 125 hours in their constituencies a month, followed by Hungarian legislators with about 70, and Italian MPs with 33 hours.
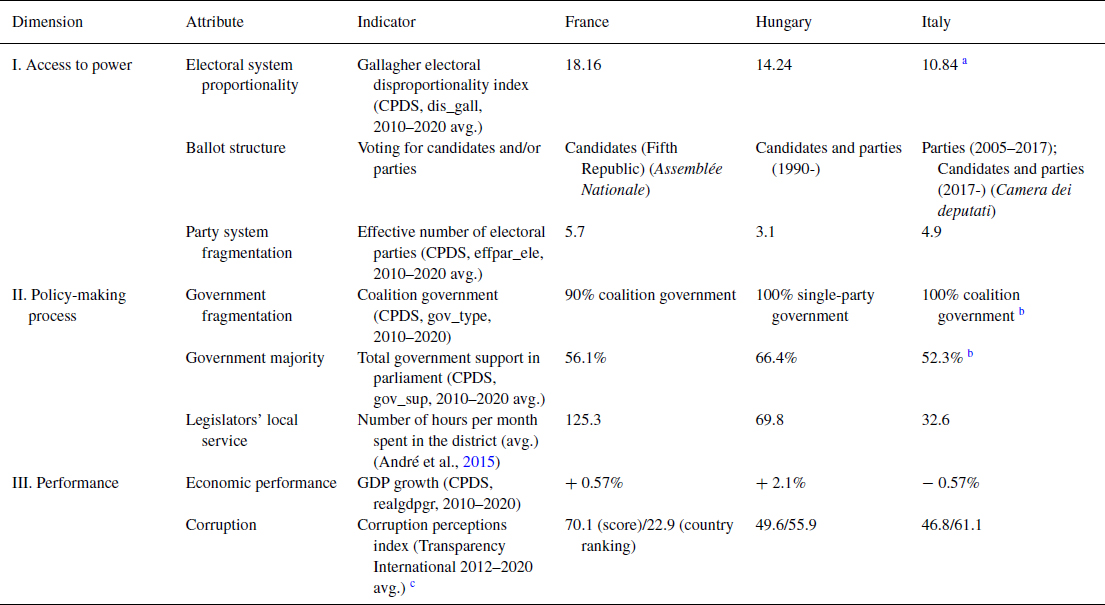
While dissimilar in many ways, these countries share similarities too. They all have a rather fragmented party system, with an effective number of parties of 3.1 in Hungary due to the dominance of Fidesz, 4.9 in Italy and 5.7 in France; and none of them was governed by a minority government in the decade prior to our field work. Future research could zoom in on the effects of party system fragmentation and minority governments on SWD by including additional countries such as the United Kingdom or Norway. Still, given that this study is the first attempt to investigate the effects of macro‐level features on citizens’ SWD in an experimental setting, we trust that the current sample's variation allows us to draw firm conclusions and make meaningful contributions to the study of SWD. Table 2 summarizes the countries’ characteristics according to the eight main attributes.
Table 2. Countries in the study

Data sources: Comparative Political Data Set (CPDS; Armingeon et al., Reference Armingeon, Engler and Leemann2022); Corruption Perceptions Index (2012–2020): https://www.transparency.org/en/cpi/2020 and https://landportal.org/book/indicator/ti‐cpi‐cpirn
a Italy's electoral system has changed substantially during the respective period with large oscillations in its proportionality (minimum = 5.17, maximum = 10.85).
b Italy had a technocratic government in 2012, which we excluded from the data.
c Note that Transparency International changed its methodology in 2012, thus prior years are not comparable to the post‐2012 period.
Finally, the three countries differ in terms of their average SWD scores. The most recent round of the European Social Survey (European Social Survey European Research Infrastructure (ESS ERIC), 2022), on a scale of 0 to 10, reports SWD at 5.17 (SD = 2.425) in France, 5.04 (2.751) in Hungary and 5.12 (2.19) in Italy. Hungary's lower SWD is in alignment with V‐Dem's (Coppedge et al., Reference Coppedge, Gerring, Knutsen, Lindberg, Teorell, Alizada and Hindle2022) ‘liberal democracy index’ ’ (v2x_libdem: ‘To what extent is the ideal of liberal democracy achieved?’) on which, out of the three countries, Hungary scores the lowest (0.362Footnote 3) in 2021. The objective quality of liberal democracy in France (0.795) and Italy (0.773) is much higher and is in fact similar in both countries.
The data
We designed the experiment and the questionnaire in English and translated them into the local languages. Before fielding the survey, the Hungarian version was tested on a small sample to estimate questionnaire length (in minutes) and to calibrate the ideal number of tasks.Footnote 4 One of the authors scripted (PHP) the survey which looked identical in all countries. We contracted regional companies hosting online panels to carry out the survey.Footnote 5 Our research complies with the EU General Data Protection Regulation (GDPR). The full launch took place in February 2022 in Hungary, in March in Italy and in June in France. The full survey is available in the Online Appendix (A).
The number of fully completed questionnaires is 808 (Hungary), 826 (Italy) and 813 (France). The total number of evaluated profiles in the three samples is 6464, 6608 and 6504, respectively. A total of 1690 unique combinations of attributes (i.e., unique profiles) appear in the Hungarian, 1688 in the Italian and 1697 in the French data. All samples are representative across gender and age groups.Footnote 6 We do not weight the data during the analysis (Miratrix et al., Reference Miratrix, Sekhon, Theodoridis and Campos2018), but test for heterogeneous treatment effects. Due to the nature of online panels, our results can only carefully be generalized to the whole population of the three countries. However, Mullinix et al. (Reference Mullinix, Leeper, Druckman and Freese2015) show that such data produce similar results to population‐based samples and are adequate to investigate causal relationships between variables in an experimental setting (Coppock et al., Reference Coppock, Leeper and Mullinix2018).
The average age of the sample falls between 42 and 49 years. The share of male respondents is between 47 and 51 per cent in the three samples. The Italian sample is the most educated with about 90 per cent of the respondents with at least secondary education. This percentage is 80.3 for Hungary and 67.7 for France. On a scale of 0–10, the respondents’ self‐placement of their household income ranged from 3.6 (Hungary) to 4.4 (Italy). Overall, sample members are politically active. On a 0–10 scale, respondents are rather interested in politics, with an average score of 5.3 (Hungary) to 6 (Italy) and 56 (Italy) to 65 (France) per cent claim they would definitely go vote ‘supposing that there are elections held this Sunday’. As to the respondents’ party preferences, 25 per cent of the French sample and 43 per cent of the Hungarian sample would vote for the government, while this figure is substantially higher in Italy (79 per centFootnote 7). We see no substantial difference in the support for democracy across the three samples: the sample means of the level of agreement (0–10) with the statement ‘Democracy may have problems but it's better than any other form of government’ vary between 6.5 (Hungary) and 7 (Italy) points. However, SWD is rather low in Hungary (3.7) and is around the centre of the scale in Italy (4.8) and France (4.8).
To control for the winner–loser effect and test the interaction hypotheses, we create an ideological proximity variable. Ideological proximity is 1 if the respondents’ position on the left–right scale matches the government's ideological leaning in the experiment, and 0 otherwise.Footnote 8 32.4, 33.5 and 33.5 per cent of the country profiles match the respondents’ ideological leaning in France, Hungary and Italy, respectively. The distribution of randomized profile attributes and the descriptive statistics from all three samples are available in Table 1 and in the Online Appendix (B and C).
Results
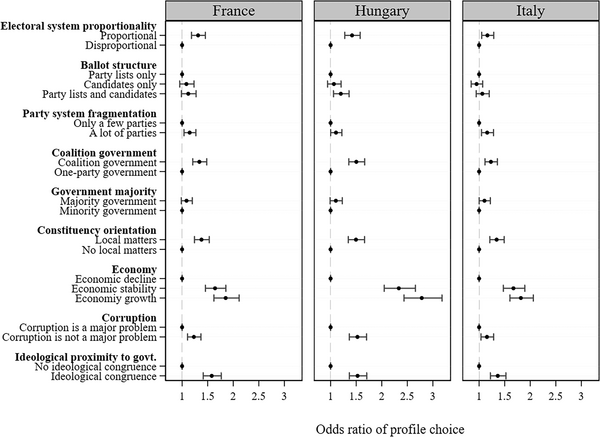
We test our hypotheses with binary logit regressions. In all cases, standard errors are robust and clustered across individual respondents. The dependent variable is 1 if the respondents chose the respective country‐profile as a country in which they would be more satisfied with democracy and 0 otherwise. Figure 1 interprets the attribute effects as odds ratios (OR). OR larger than 1 indicates that the likelihood of the respective profile being picked in the choice task is larger given that the attribute value in question appears in the profile. Attribute values with their marks on the vertical dashed line (at OR = 1) are the reference groups in the models. In the text below, we present and discuss the average probability that the respondents chose a profile which displays a certain attribute level. The reader can access the full models in the Online Appendix (C–E), including alternative estimation strategies.

Figure 1. Odds ratios in the conjoint experiment.
Access to power
Starting with electoral system proportionality, the results support Hypothesis 1 in all three countries. If a profile displays a proportional electoral system, the estimated probability of the respondents picking the profile is higher by 0.08 in Hungary, 0.04 in Italy and 0.06 in France than for a disproportional electoral system (p = 0.000 in all samples).
With regard to ballot structure, our findings are mixed. On the one hand, respondents in Italy and France disconnect democratic satisfaction from the structure of the ballot. We observe a small advantage of the mixed system in both countries but with no statistical underpinning. On the other hand, in Hungary, the respondents chose a profile displaying a mixed electoral system with a significantly greater probability than in the cases of both list‐only and candidate‐only ballots. Hungarians seem content with the current Hungarian electoral system, which allows voters to cast two votes (one for a candidate in a single‐member district, and another for a country‐level party list) and consider this mixed feature to be a democratic achievement which contributes to satisfaction.
Furthermore, in line with Hypothesis 3, our results indicate a slight preference in all three countries for a more fragmented party system as opposed to one with only a few parties (FRA: OR = 1.148 [SE = 0.059]; HUN: 1.106 [0.056] and ITA: 1.158 [0.059]). We do not observe any meaningful differences between countries in terms of the predicted probabilities of choosing a profile: predicted probabilities scatter between 0.482 (ITA) and 0.488 (HUN) for a less fragmented party system and 0.512 (HUN) and 0.518 (ITA) for more fragmentation.
Decision‐making processes
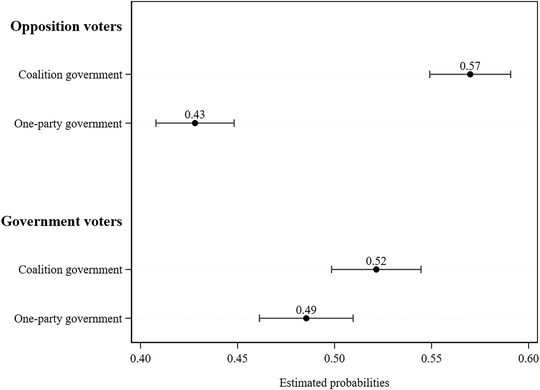
As for government fractionalization, we find that coalition governments drive democratic satisfaction. Coalition governments increase the probability of choosing a profile by 0.09 (FRA), 0.045 (HUN) and 0.066 (ITA). We do not find support for H4b: ideological proximity with the government in the experiment does not affect how respondents evaluate the role of coalition governments in democratic performance. At the same time, if we repeat the interaction exercise with real‐life election winners and losers, we find that in the case of Hungary, the effect of coalition government is stronger for opposition voters (see Figure 2). While we find a modest 0.04 difference in the probability of choosing a profile with a coalition or a one‐party government for government voters, for opposition voters this difference is 0.14. The peculiarities of Hungary's political scene probably explain this heterogeneous treatment effect. Whereas Italy and France experience coalition governments very often, in Hungary, the divide between the winners and losers of elections overlaps with coalition and one‐party governments. Leftist parties always governed in coalition with a brief interlude between 2008 and 2010, when the liberal party SZDSZ left the coalition, but continued to support the Socialist government from the ranks of the opposition. Contrarily, while Fidesz formally has governed in a coalition with KDNP from 2010 on, the party virtually maintains a one‐party government. Therefore, when it comes to evaluating democracy, opposition voters are more susceptible to government fractionalization than those who voted for the government and possibly see a (much wanted) restraint of one‐party power in multi‐party cabinets.

Figure 2. Predicted probabilities in the conjoint analysis across coalition government and real‐life party affiliation in Hungary.
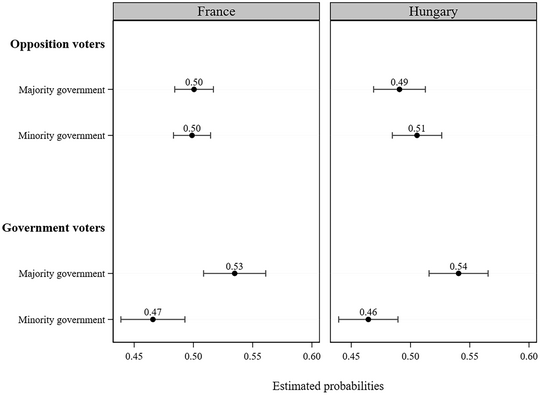
Looking at the effect of government majority, we observe a slight preference towards majority governments in all three countries. While in France and Hungary, the difference between majority and minority governments is not backed up by statistical tests (FRA: OR = 1.086 [SE = 0.054], p = 0.1; HUN: 1.102 [0.06], 0.076), in Italy, this effect is similar in size and is marginally significant (1.105 [0.055], 0.045). Inspecting the interaction between the government majority attribute and the respondent's ideological closeness to the government, we do not find evidence that respondents closer to the government weigh the role of the government majority differently than those more removed. However, when we look at differences between real‐life government and opposition voters, a more interesting picture emerges in France and Hungary (in the case of Italy, the interaction coefficient does not reach the standard level of significance). Results displayed in Figure 3 suggest that majority governments significantly increase the satisfaction of the winners, while opposition voters do not seem to mind either type of government. Those who have won the election likely think that democracy performs better if there are no obstacles to the government carrying out its program. A minority government would surely make compromises and seek support from opposition parties, which would restrict their agency and moderate the ‘perks of winning’.

Figure 3. Marginal means of SWD across government majority and the real‐life political affiliation of the respondent (winner/loser).
Finally, we see a significant and positive effect of constituency orientation in all samples, which amounts to a 0.093 increase in the probability of choosing the respective profile in Hungary, 0.072 in Italy and 0.077 in France. The legislators’ local work pushes predicted probabilities from 0.46 to about 0.55 in all three countries.
Performance
Starting with economic performance, in all three countries, the state of the economy is more strongly linked to SWD than other attributes. Compared to economic decline, both economic stability (HUN: OR = 2.33 [SE = 0.155]; ITA: 1.67 [0.11]; FRA: 1.64 [0.11]) and economic growth (2.78 [0.189]; 1.82 [0.12]; 1.85 [0.13]) makes it significantly (p = 0.000) more likely that respondents choose a profile. Curiously, we detect significant differences between economic stability (Probability: 0.55 [SE = 0.009]) and growth (0.59 [0.009]) only in Hungary. Respondents in the Italian and the French samples are just as likely to pick a profile that displays economic stability as growth.
Considering corruption, we find that, as set out by Hypothesis 8, respondents connect democratic satisfaction to the lack of corruption. All three countries are not the same, though. Figure 1 unveils that the effect of corruption is the largest in Hungary. Estimated probabilities also indicate that, when corruption is a problem, the probability of choosing a profile is the smallest (probability = 0.45 [SE = 0.007]) in Hungary (France 0.48 [0.007], Italy 0.48 [0.007]). Similarly, across all countries, the lack of corruption pushes the probability of choosing the profile up the farthest in Hungary (0.54 [0.007]) as opposed to 0.52 [0.007] in Italy and France.
Ideological proximity with the government
To parse out the effect of the winner–loser gap, we included in the experiment the government's ideological leaning as an attribute. While we cannot control for winning and losing elections per se in a hypothetical scenario, ideological closeness to the government is the second‐best measure to proxy the winner–loser divide (Kim, Reference Kim2009). In all the countries in our sample, a profile's probability of being chosen is about 0.1 larger when the government's ideological leaning coincides with the respondent's position on the left–right scale. The effect of ideological proximity is thus similar in size to that of electoral system proportionality, coalition government, constituency orientation and corruption.
Limitations and avenues for future research
While our method allows one to claim causality between profile attributes and profile choice, we must report several limitations. As is typical for experiments, there are several factors which may impair the external validity of our results. First, the respondents are presented with a choice‐task that is very alien from everyday decisions (i.e., choosing between countries based on how satisfied they would be with democracy should they live there). In addition, to the best of our knowledge, this is the first study that attempts to measure SWD in an experimental setting. This meant that we needed to adapt the wording of the traditional SWD survey item so that it was applicable to a hypothetical scenario. One could argue that our measurement is not comparable to the classic measure of SWD. However, in most cases for which there is solid literature, the effects we report follow the same pattern as those found in observational studies. This suggests that respondents have activated similar mechanisms compared with those which are relevant when replying to the classic question used in survey research.
Another limit to the generalizability of our findings may derive from the degree of treatment effect heterogeneity: the impact of the predictors included in our experiments varies slightly across different sub‐populations defined in terms of age and education. However, as shown in the online Appendix, the most significant findings are not affected substantially. The positive role of electoral proportionality, the state of the economy, the absence of corruption and legislators’ local service (as attributes shedding light on sub‐group differences in multiple countries) are mostly stable across different sub‐populations. Moreover, the heterogeneous treatment effects are often country‐specific, a phenomenon that can be interpreted in two different ways: either these differences are due to random errors, and are thus specific to our samples, or they depend on the political context. Future studies, both experimental and observational, need to focus on different national contexts to shed more light on this puzzle.
Third, our respondents are politically active and more educated than the country average with high levels of political interest and electoral participation. We could speculate that they are also more knowledgeable than the average population, enabling them to solve the choice‐tasks more effectively. While this strengthens the internal validity of the study, it may be seen as an additional limit to its generalizability. We indeed acknowledge that our results may only be robust for politically active and educated citizens and we suggest that future observational studies look more in‐depth at the role of education in moderating the effect of different factors of SWD.
Finally, our models display low explanatory power. This could result from both the complicated experimental design and the small overall effect of the controlled attributes. Even with these limitations in mind, our study nevertheless contributes to a better understanding of how various systemic attributes matter in citizens’ evaluation of democracy.
Discussion and conclusions
In this study, we focused on how components of political systems affect citizens’ SWD. Compared to earlier studies, our approach is unique in that, by utilizing a survey experiment, we were able to disentangle the effects of otherwise highly collinear variables corresponding to three defining features of any political system, namely (1) access to power (who makes the decisions?), (2) the policy‐making process (how are decisions made?) and (3) performance (what are the consequences of these decisions?). We fielded identical conjoint experiments in countries with significant variations across the key independent variables: France, Hungary and Italy.
Overall, our study supports the view that – in correspondence with earlier studies (for instance Lijphart, Reference Lijphart1999) – citizens are more satisfied with democracy in consensus than in majoritarian democracies. It also contributes to identify the respective weight of each specific political system component. When it comes to ‘access to power’, the proportionality of the electoral system and the fragmentation of the party system appear to be traits that increase democratic contentment. Very much in line with our expectations and with earlier research results, respondents across all three countries in the sample recognize that proportionality (Plescia et al., Reference Plescia, Blais and Högström2020) and party system fragmentation (Anderson, Reference Anderson1998; Andeweg & Farrell, Reference Andeweg, Farrell, Thomassen, van Ham, Aarts and Andeweg2017) magnify their voice by creating a more representative political environment. In other words, greater access to power increases the input legitimacy of democracy, thus boosting democratic satisfaction. With regard to the output legitimacy of the political system, we find that respondents identify good economic performance (see, for instance, Kestilä‐Kekkonen & Söderlund, Reference Kestilä‐Kekkonen and Söderlund2017; Nadeau et al., Reference Nadeau, Daoust and Arel‐Bundock2020) and public probity (Christmann & Torcal, Reference Christmann and Torcal2018; Claassen & Magalhães, Reference Claassen and Magalhães2022; Donovan & Karp, Reference Donovan and Karp2017) as important features of a well‐performing democracy. In fact, the effect of the state of the economy was by far the largest among the profile attributes which indicates a highly materialistic view of democracy in all three countries. The prevalence of output over input legitimacy implies that a key component of democratic satisfaction is good governance while engineering political institutions can only marginally improve SWD.
Beyond the ‘input’ and ‘output’ sources of SWD, the decision‐making process appears to play a greater and slightly different role than what is usually anticipated in the literature. First, the observed effect of government fractionalization tallies well with the idea that consensus systems with coalition governments provide more SWD (see also Kestilä‐Kekkonen & Söderlund, Reference Kestilä‐Kekkonen and Söderlund2017). Second, we also find that citizens are less perceptive of the government's parliamentary majority: the impact of government type is not always statistically significant and may thus be context‐dependent. Third, the positive effect of the legislator's constituency orientation on SWD is another noteworthy finding that is less present in the literature. Given the differences in the electoral systems of the respective countries, and the fact that electoral rules set considerably different incentives for constituency service (Carey & Shugart, Reference Carey and Shugart1995), the comparatively large effect of the legislators’ local orientation is intriguing. It points to how universal the demand for a strong citizen–legislator linkage and local interest representation is. We recommend that this component of policy‐making be looked at more closely in future research.
We further report treatment heterogeneity across groups of political preference regarding attributes specifically related to the political capacity of the government. We find that in the case of Hungary, both government fractionalization and government majority interact with the political preferences of respondents. We show a large positive impact of government coalitions on SWD amongst opposition voters (‘losers’ of the election) and report no effect in the case of government voters (‘winners’). This is an indication that Hungarian voters who support opposition parties see multi‐party cabinets as a much‐wanted restraint over one‐party power. This hope even affects their judgments in hypothetical scenarios such as our online experiment. Reversely, the majority government affects SWD only in the group of winners in both France and Hungary. Arguably, those who have won the election seek to avoid the powerlessness of a minority government (Müller, Reference Müller and Caramani2014) and do not want to see any obstacles to government decision‐making which would be largely impeded in the absence of a parliamentary majority.
Overall, our study reveals some tensions in how citizens think about democracy and its components. While we show that consensus features make citizens more satisfied, the slight preference for majority government is at odds with this pattern. Similarly, respondents do not seem to realize the role of ballot structure in incentivizing the legislators’ local orientation – which was among the strongest predictors of SWD. Future research could tap into the origin of these discrepancies to better understand how citizens disconnect these interrelated features of democracy.
Finally, and importantly, we must address the elephant in the room: the countries in the sample diverge in the quality of their democracy. While Freedom HouseFootnote 9 categorizes France and Italy as free, Hungary falls in the group of ‘partly free’ countries. Indeed, several studies discuss the so‐called illiberal democracy or hybrid regime that set Hungary's democratic consolidation on an uncertain path (Bogaards, Reference Bogaards2018; Buzogány & Varga, Reference Buzogány and Varga2018; Körösényi et al., Reference Körösényi, Illés and Gyulai2020; Pap, Reference Pap2017). Overall, our results suggest that citizens in defective democracies evaluate their political systems similarly to their counterparts in consolidated democracies. Looking at our countries this way, our results also carry an alarming message. In de‐consolidating democracies, as long as the economy performs well and the legislators actively serve the particularistic interests of their constituencies, citizen discontent can be kept in check, and both good economic performance and constituency service may ‘buy’ satisfaction with the regime (see also Distelhorst & Hou, Reference Distelhorst and Hou2017).
Acknowledgements
We would like to thank the four anonymous reviewers for their guidance. We believe that their insight helped us tremendously in developing the manuscript. Early drafts of this article were presented at the 7th Conference of the ECPR Standing Group on Parliaments (2022) in Paris, at the Societá Italiana di Scienza Politica (SISP) Conference (2022) in Rome and at the Department of Political Behavior at the HUN‐REN Centre for Social Sciences, Budapest. We are grateful to the participants for their comments. Zsófia Papp acknowledges the support of the Hungarian Academy of Sciences as a recipient of the János Bolyai Research Scholarship.
Funding Information
This work was supported by the National Research, Development and Innovation Office (NKFIH) [grant number FK131569], and by the Centre for Social Sciences Collaborative Research Projects Fund. Zsófia Papp is a recipient of the János Bolyai Research Scholarship.
Conflict of Interest statement
The authors declare no conflicts of interest.
Data availability statement
Replication material for this study is available at https://doi.org/10.6084/m9.figshare.22316692.v2
Ethics approval statement
At the start of the project, the Centre for Social Sciences did not require ethical approval for standard anonymized surveys. A posterior ethical approval process was initiated by the first author upon the submission of the manuscript.
Permission to reproduce material from other sources
Besides data from our study, we used openly available datasets such as:
Comparative Political Data Set (Armingeon et al., Reference Armingeon, Engler and Leemann2022),
Corruption Perceptions Index (at https://www.transparency.org/en/cpi/2020 and https://landportal.org/book/indicator/ti‐cpi‐cpirn)
European Social Survey (European Social Survey European Research Infrastructure, 2022)
V‐Dem (Coppedge et al., Reference Coppedge, Gerring, Knutsen, Lindberg, Teorell, Alizada and Hindle2022)
World Values Survey, Round 5 (Inglehart et al., Reference Inglehart, Haerpfer, Moreno, Welzel, Kizilova, Diez‐Medrano and Puranen2018).
In all instances, we followed the various projects’ citation rules.
Online Appendix
Additional supporting information may be found in the Online Appendix section at the end of the article:
Online Appendix


 Open access