


Introduction
Psychiatric disorders show varying degrees of overlap in their symptoms. This resemblance in terms of nosology occasionally translates to symptom-specific therapeutic approaches that further bedim the boundaries among the different clinical syndromes as defined by the Diagnostic and Statistical Manual of Mental Disorders, fifth edition (DSM-5) (Li, Li, & Chen, Reference Li, Li and Chen2022). To complement the complex phenomenological relations among psychiatric disorders, twin-based investigations and genome-wide association studies (GWAS) uncovered evidence of shared heritability across the psychopathology spectrum (Smoller et al., Reference Smoller, Andreassen, Edenberg, Faraone, Glatt and Kendler2019) and further investigations are generating considerable evidence that pleiotropy exerts significant effects within the constellation of psychiatric diagnoses (Lee, Feng, & Smoller, Reference Lee, Feng and Smoller2021).
Recently, large-scale GWASs of psychiatric disorders elucidated some aspects of the genetic correlation among those disorders, such as pleiotropic loci and pathways (Lee, Feng, & Smoller, Reference Lee, Feng and Smoller2021). Following an exploratory factor analysis of eight psychiatric disorders, three distinct groups of genetically correlated disorders have emerged. Schizophrenia (SCZ), bipolar disorder (BP), and major depressive disorder (MDD) fall into a common factor of mood and psychotic disorders, with MDD also sharing genetic structure with three early-onset neurodevelopmental disorders: Tourette syndrome, attention deficit and hyperactivity disorder, and autism spectrum disorder (Phil et al., Reference Phil, Lee, Won, Feng, Rosenthal, Zhu and Smoller2019). It has been previously hypothesized that SCZ and BP form parts of a continuum rather than two distinct diagnoses (Moller, Reference Moller2003). This notion is reinforced by the definition of schizoaffective disorder as an intermediate point on the mood and psychotic disorders spectrum, (Wy & Saadabadi, Reference Wy and Saadabadi2022) as well as variability in clinical presentation among those three disorders along the course of some patients’ lives (Bambole et al., Reference Bambole, Johnston, Shah, Sonavane, Desouza and Shrivastava2013). Thus, the evidence of shared genetic architecture among SCZ, BP, and MDD complements the substantial degree of shared symptoms and diagnostic ambiguity among those disorders to further highlight the importance of the investigation of the underlying pleiotropy that drives those associations.
Cross-disorder analyses can increase statistical power to reveal pleiotropic loci that have not previously been identified by disorder-specific GWASs. More importantly, downstream consequences of pleiotropic loci can be specified to elucidate the complex genetic mechanisms that contribute to the aforementioned phenotypes. While pleiotropy among SCZ, BP, and MDD has been previously investigated by testing pair-wide relationships (Li et al., Reference Li, Li and Chen2022), analyzing possible three-way effects can enhance our understanding of the shared biological mechanisms that underlie all three disorders. Previous research on SCZ, BP, and MDD pleiotropy using both early underpowered GWAS (Huang et al., Reference Huang, Perlis, Lee, Rush, Fava, Sachs, Lieberman, Hamilton, Sullivan, Sklar, Purcell and Smoller2010) and more recent datasets (Wang, Yi, & Shi, Reference Wang, Yi and Shi2022) was mostly aimed at increasing the statistical power of gene discovery rather than dissecting the biological mechanisms underlying genetic effects shared among SCZ, BP, and MDD.
In this study, we investigated pleiotropic mechanisms underlying SCZ, BP, and MDD using the genome-wide association statistics available from the Psychiatric Genomics Consortium (PGC) (Lam et al., Reference Lam, Chen, Li, Martin, Bryois, Ma, Gaspar, Ikeda, Benyamin, Brown, Liu, Zhou, Guan, Kamatani, Kim, Kubo, Kusumawardhani, Liu, Ma, Periyasamy, Takahashi, Xu, Yu, Zhu, Chen, Faraone, Glatt, He, Hyman, Hwu, McCarroll, Neale, Sklar, Wildenauer, Yu, Zhang, Mowry, Lee, Holmans, Xu, Sullivan, Ripke, O’Donovan, Daly, Qin, Sham, Iwata, Hong, Schwab, Yue, Tsuang, Liu, Ma, Kahn, Shi and Huang2019; Mullins et al., Reference Mullins, Forstner, O’Connell, Coombes, Coleman, Qiao, Als, Bigdeli, Borte, Bryois, Charney, Drange, Gandal, Hagenaars, Ikeda, Kamitaki, Kim, Krebs, Panagiotaropoulou, Schilder, Sloofman, Steinberg, Trubetskoy, Winsvold, Won, Abramova, Adorjan, Agerbo, Al Eissa, Albani, Alliey-Rodriguez, Anjorin, Antilla, Antoniou, Awasthi, Baek, Baekvad-Hansen, Bass, Bauer, Beins, Bergen, Birner, Bocker Pedersen, Boen, Boks, Bosch, Brum, Brumpton, Brunkhorst-Kanaan, Budde, Bybjerg-Grauholm, Byerley, Cairns, Casas, Cervantes, Clarke, Cruceanu, Cuellar-Barboza, Cunningham, Curtis, Czerski, Dale, Dalkner, David, Degenhardt, Djurovic, Dobbyn, Douzenis, Elvsashagen, Escott-Price, Ferrier, Fiorentino, Foroud, Forty, Frank, Frei, Freimer, Frisen, Gade, Garnham, Gelernter, Giortz Pedersen, Gizer, Gordon, Gordon-Smith, Greenwood, Grove, Guzman-Parra, Ha, Haraldsson, Hautzinger, Heilbronner, Hellgren, Herms, Hoffmann, Holmans, Huckins, Jamain, Johnson and Kalman2021; Major Depressive Disorder Working Group of the Psychiatric Genomics Consortium, 2025). Our goal was to identify the relevant biological functions and pathways, and the tissues where pleiotropic loci are differentially expressed. In addition, pathway analyses and functional annotation were performed on subgroups of the risk loci to offer a more comprehensive understanding of the shared and divergent genetic architecture underlying SCZ, BP, and MDD.
Materials and methods
Genome-wide association statistics
We used genome-wide association statistics generated from PGC GWAS meta-analyses. Due to the limited sample size of large-scale GWAS conducted in diverse populations, the present study was conducted using GWAS data from individuals of European ancestry. Unfortunately, large-scale GWAS for other population groups are not available at this time. Genome-wide association statistics were generated from 41,917 BP-affected individuals and 371,549 unaffected controls (Mullins et al., Reference Mullins, Forstner, O’Connell, Coombes, Coleman, Qiao, Als, Bigdeli, Borte, Bryois, Charney, Drange, Gandal, Hagenaars, Ikeda, Kamitaki, Kim, Krebs, Panagiotaropoulou, Schilder, Sloofman, Steinberg, Trubetskoy, Winsvold, Won, Abramova, Adorjan, Agerbo, Al Eissa, Albani, Alliey-Rodriguez, Anjorin, Antilla, Antoniou, Awasthi, Baek, Baekvad-Hansen, Bass, Bauer, Beins, Bergen, Birner, Bocker Pedersen, Boen, Boks, Bosch, Brum, Brumpton, Brunkhorst-Kanaan, Budde, Bybjerg-Grauholm, Byerley, Cairns, Casas, Cervantes, Clarke, Cruceanu, Cuellar-Barboza, Cunningham, Curtis, Czerski, Dale, Dalkner, David, Degenhardt, Djurovic, Dobbyn, Douzenis, Elvsashagen, Escott-Price, Ferrier, Fiorentino, Foroud, Forty, Frank, Frei, Freimer, Frisen, Gade, Garnham, Gelernter, Giortz Pedersen, Gizer, Gordon, Gordon-Smith, Greenwood, Grove, Guzman-Parra, Ha, Haraldsson, Hautzinger, Heilbronner, Hellgren, Herms, Hoffmann, Holmans, Huckins, Jamain, Johnson and Kalman2021), 33,640 SCZ-affected individuals and 43,456 controls (Lam et al., Reference Lam, Chen, Li, Martin, Bryois, Ma, Gaspar, Ikeda, Benyamin, Brown, Liu, Zhou, Guan, Kamatani, Kim, Kubo, Kusumawardhani, Liu, Ma, Periyasamy, Takahashi, Xu, Yu, Zhu, Chen, Faraone, Glatt, He, Hyman, Hwu, McCarroll, Neale, Sklar, Wildenauer, Yu, Zhang, Mowry, Lee, Holmans, Xu, Sullivan, Ripke, O’Donovan, Daly, Qin, Sham, Iwata, Hong, Schwab, Yue, Tsuang, Liu, Ma, Kahn, Shi and Huang2019; Max Lam et al., Reference Max Lam, Zhiqiang, Bryois, Ma, Gaspar, Ikeda, Benyamin, Brown, Liu, Zhou, Guan, Kamatani, Kim, Kubo and Kusumawardhani2019), and 412,305 MDD-affected individuals and 1,588,397 controls (Major Depressive Disorder Working Group of the Psychiatric Genomics Consortium, 2025).
Heritability and genetic correlation
Heritability and pairwise genetic correlations were estimated using linkage disequilibrium (LD) score regression (LDSC) (Bulik-Sullivan et al., Reference Bulik-Sullivan, Loh, Finucane, Ripke, Yang, Patterson, Daly, Price and Neale2015). This analysis was conducted considering HapMap variants and using pre-computed LD scores based on 1000 Genomes Project populations of European descent (available at https://github.com/bulik/ldsc). Conversion of heritability to the liability scale was conducted to account for the difference between sample prevalence (SCZ = 0.44, BP = 0.10, MDD = 0.21) and population prevalence (SCZ = 0.01, BP = 0.02, MDD = 0.15). Finally, heritability was partitioned with LDSC to three different central nervous system cell types – namely, astrocytes, oligodendrocytes, and neurons – using the CAHOY transcriptome database as a reference panel for the cell type groups (Cahoy et al., Reference Cahoy, Emery, Kaushal, Foo, Zamanian, Christopherson, Xing, Lubischer, Krieg, Krupenko, Thompson and Barres2008). To compare cell type enrichment among the three disorders, z-tests were performed by entering the partitioned heritability coefficients and their standard errors (SE) in the formula:
 $$ z=\frac{Estimat{e}_A- Estimat{e}_B}{\sqrt{SE_{{Estimat e}_A}^2-{SE}_{{Estimat e}_B}^2}}. $$
P-values were subsequently calculated and adjusted for multiple comparisons using the false discovery rate (FDR) approach.
Estimation of pleiotropic effect
To identify pleiotropic loci, we applied the Pleiotropic Locus Exploration and Interpretation using the Optimal test (PLEIO) framework (Lee, Shi, Pasaniuc, Eskin, & Han, Reference Lee, Shi, Pasaniuc, Eskin and Han2021). PLEIO assumes that for a locus to exert a pleiotropic effect on a group of disorders, the variance of its effect size should be proportional to the genetic covariance matrix of the disorders in question. Thus, the null hypothesis is that the variant’s standardized effect size is not connected to the genetic covariance matrix with a multivariable normal distribution. Taking into account disorder-specific heritability and pairwise genetic correlation, PLEIO maximizes statistical power and accounts for the complex interplay among the genetic architectures of the disorders in question. Similar to LDSC, PLEIO analysis was performed using HapMap variants as recommended by the developers (Lee, Shi, et al., Reference Lee, Shi, Pasaniuc, Eskin and Han2021).
Functional annotation and pathway analysis
Genomic annotation was conducted using the Ensembl Variant Effect Predictor (VEP) (McLaren et al., Reference McLaren, Gil, Hunt, Riat, Ritchie, Thormann, Flicek and Cunningham2016). Among the overlapping Ensembl transcripts per variant, only the one with the most severe consequence as defined by the Sequence Ontology (SO) was included in further analyses (Eilbeck et al., Reference Eilbeck, Lewis, Mungall, Yandell, Stein, Durbin and Ashburner2005). The order of severity as defined by VEP is reported in Supplementary Table S1.
For the pathway analysis, we used the PANTHER Classification System (Mi & Thomas, Reference Mi and Thomas2009). Statistically overrepresented pathways were specified using a binomial test between a reference list of genes per pathway and the test list of genes as determined by Ensembl VEP (McLaren et al., Reference McLaren, Gil, Hunt, Riat, Ritchie, Thormann, Flicek and Cunningham2016). Tissue-specific enrichment analysis was conducted with Functional Mapping and Annotation (FUMA) software (Watanabe, Taskesen, van Bochoven, & Posthuma, Reference Watanabe, Taskesen, van Bochoven and Posthuma2017). FUMA conducts a hypergeometric test to identify up- and down-regulated tissue types. Bonferroni correction is then applied to account for multiple comparisons. We used the Genotype-Tissue Expression (GTEx v8) dataset as a reference set of differentially expressed genes in 54 human tissue types. To assess gene expression in different brain developmental stages, we used BrainSpan (Sunkin et al., Reference Sunkin, Ng, Lau, Dolbeare, Gilbert, Thompson, Hawrylycz and Dang2013). This is an atlas of the developing human brain that encompasses transcriptional profiles spanning from the fourth post-conception week to 60 years of age.
Possible pharmacologic targets of the pleiotropic loci were examined with the gene2drug tool (Napolitano et al., Reference Napolitano, Carrella, Mandriani, Pisonero-Vaquero, Sirci, Medina, Brunetti-Pierri and di Bernardo2017). Gene2drug ranks all the pathways in a database according to how much the expression of pathway-related genes changed after experimental exposure to various drugs. An Enrichment Score is then computed for each drug to identify those able to significantly upregulate (or downregulate) the pathways in the set. To determine overrepresented pathways among the pleiotropic loci in databases supported by gene2drug, we used VEGAS2Pathway (Versatile Gene-Based Association Study) (Mishra A, Reference Mishra A2017) which contains gene sets from Gene Ontology (GO) and curated gene sets from MSigDB. Bonferroni correction was applied to account for the number of drugs tested (N = 1,309, p < 3.82 × 10⁻⁵).
Loci subgroup analyses
Functional annotation and pathway analyses were conducted in subgroups of pleiotropic loci to further characterize the nature of pleiotropy among SCZ, BP, and MDD.
First, we defined novel pleiotropic loci as those with a genome-wide significant pleiotropic effect (PLEIO-p < 5 × 10⁻⁸) that did not reach genome-wide significance in the original BP, MDD, SCZ GWAS (Lam et al., Reference Lam, Chen, Li, Martin, Bryois, Ma, Gaspar, Ikeda, Benyamin, Brown, Liu, Zhou, Guan, Kamatani, Kim, Kubo, Kusumawardhani, Liu, Ma, Periyasamy, Takahashi, Xu, Yu, Zhu, Chen, Faraone, Glatt, He, Hyman, Hwu, McCarroll, Neale, Sklar, Wildenauer, Yu, Zhang, Mowry, Lee, Holmans, Xu, Sullivan, Ripke, O’Donovan, Daly, Qin, Sham, Iwata, Hong, Schwab, Yue, Tsuang, Liu, Ma, Kahn, Shi and Huang2019; Major Depressive Disorder Working Group of the Psychiatric Genomics Consortium, 2025; Mullins et al., Reference Mullins, Forstner, O’Connell, Coombes, Coleman, Qiao, Als, Bigdeli, Borte, Bryois, Charney, Drange, Gandal, Hagenaars, Ikeda, Kamitaki, Kim, Krebs, Panagiotaropoulou, Schilder, Sloofman, Steinberg, Trubetskoy, Winsvold, Won, Abramova, Adorjan, Agerbo, Al Eissa, Albani, Alliey-Rodriguez, Anjorin, Antilla, Antoniou, Awasthi, Baek, Baekvad-Hansen, Bass, Bauer, Beins, Bergen, Birner, Bocker Pedersen, Boen, Boks, Bosch, Brum, Brumpton, Brunkhorst-Kanaan, Budde, Bybjerg-Grauholm, Byerley, Cairns, Casas, Cervantes, Clarke, Cruceanu, Cuellar-Barboza, Cunningham, Curtis, Czerski, Dale, Dalkner, David, Degenhardt, Djurovic, Dobbyn, Douzenis, Elvsashagen, Escott-Price, Ferrier, Fiorentino, Foroud, Forty, Frank, Frei, Freimer, Frisen, Gade, Garnham, Gelernter, Giortz Pedersen, Gizer, Gordon, Gordon-Smith, Greenwood, Grove, Guzman-Parra, Ha, Haraldsson, Hautzinger, Heilbronner, Hellgren, Herms, Hoffmann, Holmans, Huckins, Jamain, Johnson and Kalman2021) or are not in LD (r 2 > 0.1) with any of the genome-wide significant variants identified by these previous studies. We clumped the remaining single-nucleotide polymorphisms (SNPs) to select the LD-independent loci (r 2 < 0.1, 250 kb, PLEIO-p < 5 × 10⁻⁸). Functional annotation and pathway analyses were conducted separately for the novel pleiotropic loci, and the results were compared to those of the variants showing genome-wide significant associations with one of the disorders investigated. The novel vs previously-identified comparison was performed to assess whether the novel loci were involved in molecular pathways that may require higher statistical power to be detected by disorder-specific GWAS. Second, we tested for enrichment differences between the pleiotropic loci that exert an effect in the same direction on all three disorders and those with opposing directions of effects on the individual disorders. Finally, we identified differences in gene expression among the pleiotropic loci according to which of the disorders significantly influenced their pleiotropic effect. We divided the SNPs into groups based on their statistical significance after Bonferroni correction, accounting for the pleiotropic variants tested. This yielded eight groups of variants: three groups that were Bonferroni significant only in the respective individual SCZ, BP, and MDD GWASs, three that were significant for pairs of the individual GWASs (SCZ-BP, BP-MDD, MDD-SCZ), one group that was Bonferroni significant across the three disorders, and one group that was not statistically significant for any of the disorders after Bonferroni correction. With this classification, we aimed to characterize variants that reached genome-wide significance in the pleiotropy analysis (PLEIO-p < 5 × 10⁻⁸) but showed Bonferroni significance only for a subset of the disorders investigated. Accordingly, to understand the underlying molecular differences, pathway enrichment, and tissue-specific differential gene expression results were compared among those subgroups for statistically significant differences. For all pathway-subgroup analyses, p-values were adjusted using FDR to account for all the subgroups tested (n subgroups = 11). For tissue specificity subgroup analyses, p values were adjusted with Bonferroni correction as recommended (Watanabe et al., Reference Watanabe, Taskesen, van Bochoven and Posthuma2017). VEGAS2Pathway was used to identify pathway enrichments for each group of loci based on their disease-specific effect (Liu et al., Reference Liu, McRae, Nyholt, Medland, Wray, Brown, Investigators, Hayward, Montgomery, Visscher, Martin and Macgregor2010). Those pathways were subsequently entered in gene2drug for drug discovery in the subgroups of pleiotropic loci based on disease-specific effects (Napolitano et al., Reference Napolitano, Carrella, Mandriani, Pisonero-Vaquero, Sirci, Medina, Brunetti-Pierri and di Bernardo2017). Bonferroni correction was applied to account for the number of tests performed.
To identify differences in the tissue-specific transcriptomic profiles, we conducted pairwise comparisons of the effect sizes observed in the enrichment analysis of the disorder-related subgroups. We calculated z-scores related to the effect size differences according to the formula reported above. The number of overlapping genes (between the test gene set and the reference gene set of upregulated genes per tissue) given by FUMA was used as the effect estimate of the hypergeometric test conducted to calculate tissue specificity. P-values were subsequently calculated and adjusted for multiple comparisons using the FDR approach.
Results
Heritability and genetic correlation
LDSC regression heritability and genetic correlation results were congruent with previous estimates. SCZ demonstrated the highest SNP-based heritability on the liability scale (SNP-h 2 = 0.26, SE = 0.009, z = 28.9), followed by BP (SNP-h 2 = 0.19, SE = 0.007, z = 27.1) and MDD (SNP-h 2 = 0.09, SE = 0.003, z = 30). The genetic correlation was highest between SCZ and BP (rg = 0.69, p < 10−300), followed by BP and MDD (rg = 0.47, p = 7.46 × 10−151), and MDD and SCZ (rg = 0.35, p = 1.094 × 10−68). Partitioning heritability among the three brain cell types available from the CAHOY transcriptomic database (Cahoy et al., Reference Cahoy, Emery, Kaushal, Foo, Zamanian, Christopherson, Xing, Lubischer, Krieg, Krupenko, Thompson and Barres2008) revealed that the heritability of the three disorders investigated was enriched for loci expressed in neurons (FDR q < 0.05), but not astrocytes or oligodendrocytes (Supplementary Table S2). After pairwise comparisons of the coefficients of brain cell-specific enrichments, we observed that a statistically significantly higher proportion of SCZ and BP heritability was enriched for neurons, compared with MDD (FDR q < 0.05; neurons: difference-pSCZ-MDD = 4.7 × 10⁻⁴ and difference-pBP-MDD = 1.3 × 10⁻⁵). BP and SCZ heritability were not differentially enriched for neurons (p > 0.05).
Characterization of pleiotropic loci
Our PLEIO analysis of BP, MDD, and SCZ generated genome-wide statistics informative of the pleiotropy shared among these psychiatric disorders. The enrichment analysis based on the PLEIO genome-wide statistics yielded five overrepresented pathways (FDR q < 0.05): 1) Cadherin signaling (Pathway Accession: P00012; 5.7-fold enrichment, p = 2.18 × 10⁻⁸), 2) Alzheimer disease-amyloid secretase (Pathway Accession: P00003; 3.3-fold enrichment, p = 4 × 10⁻⁴), 3) Oxytocin receptor-mediated signaling (Pathway Accession: P04391; 3.2-fold enrichment, p = 1.47 × 10⁻³), 4) Metabotropic glutamate receptor group III (Pathway Accession: P00039; 3.39-fold enrichment, p = 5.82 × 10⁻⁴) and 5) Wnt signaling (Pathway Accession: P00057; 3.01-fold enrichment, p = 1.61 × 10⁻¹¹) (Figure 1a; Supplementary Table S3).
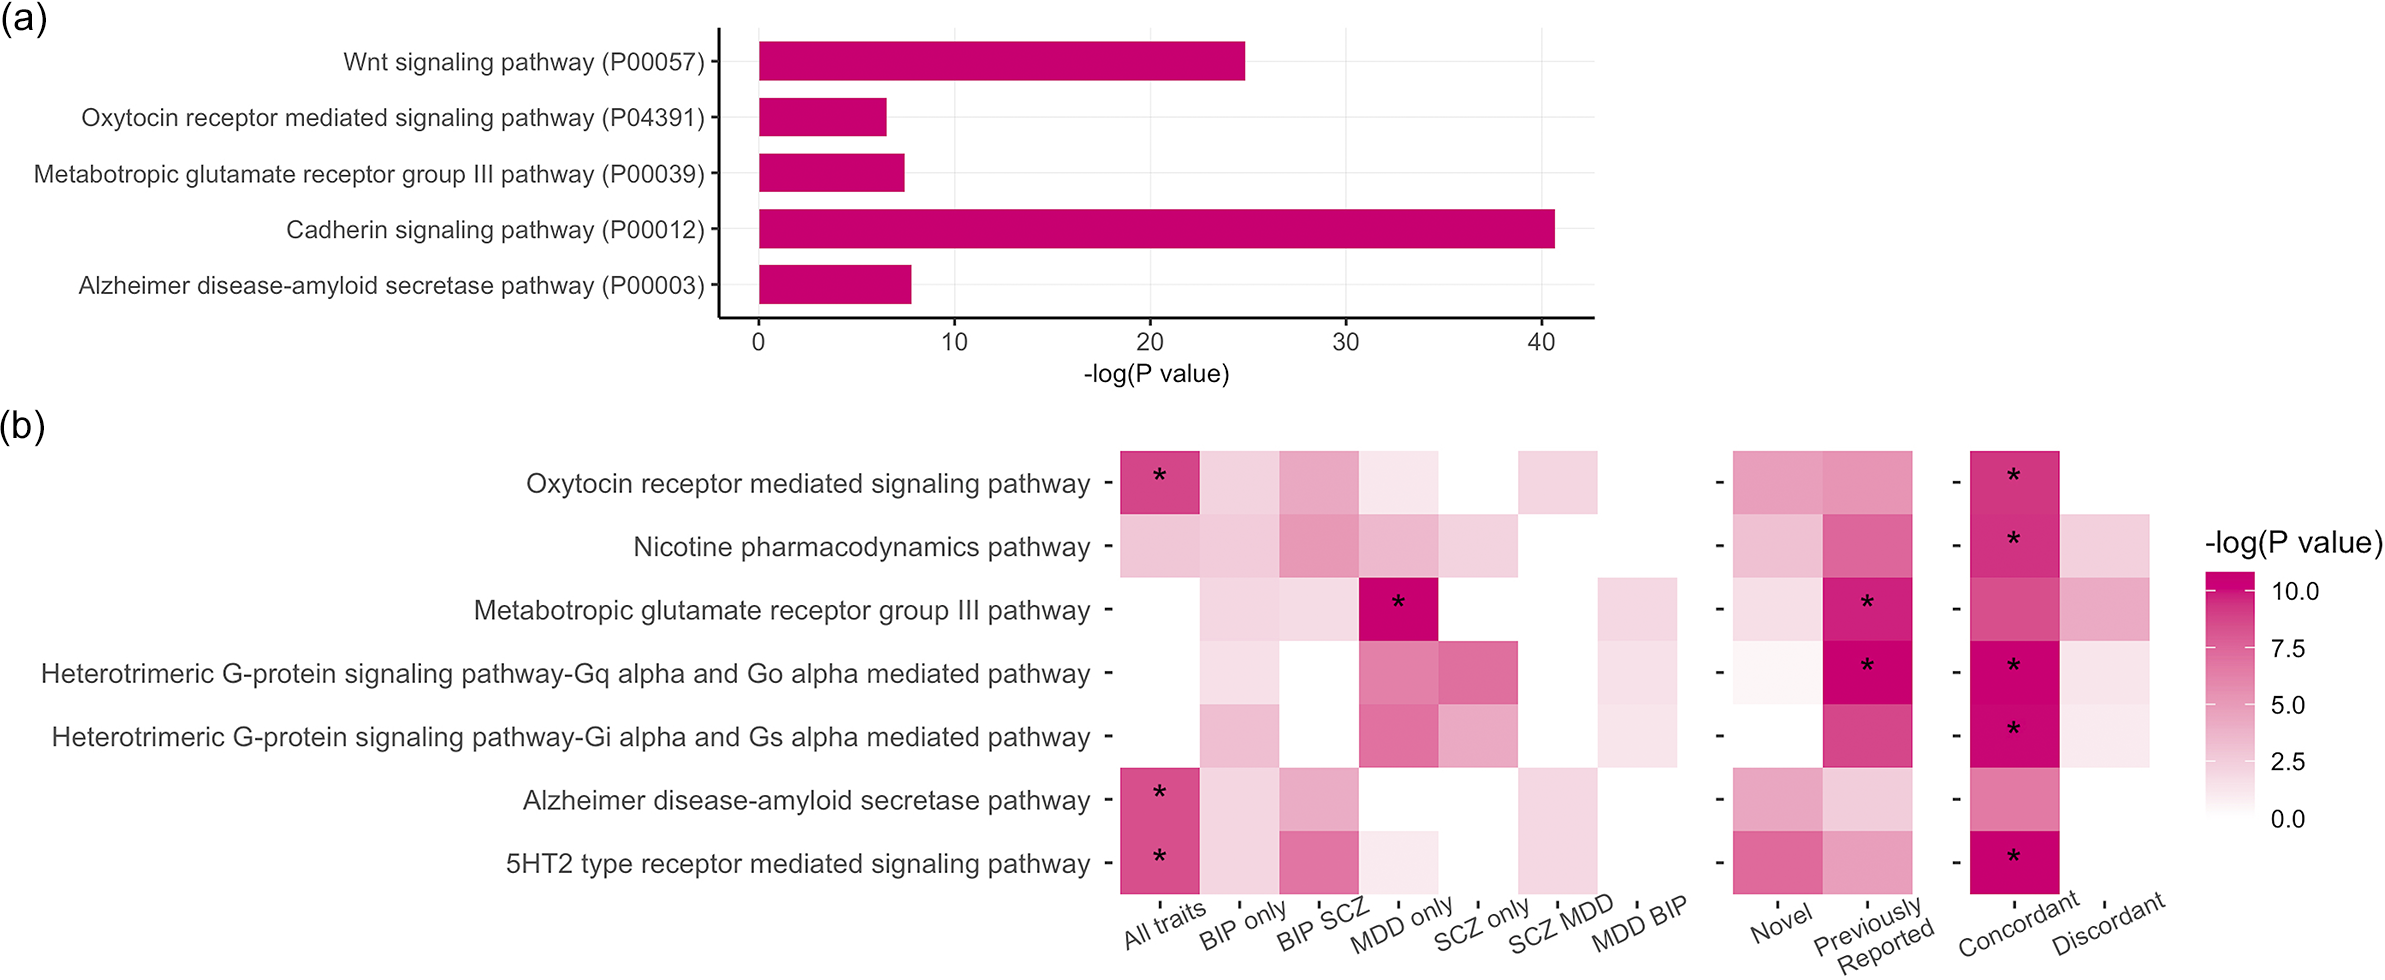
Figure 1. (a) Statistically overrepresented pathways based on the genome-wide pleiotropy among schizophrenia (SCZ), bipolar disorder (BP), and major depressive disorder (MDD). (b) Pathway enrichment analysis by subgroups.
With respect to tissue specificity, PLEIO genome-wide statistics were enriched for brain tissues with the strongest evidence for brain cortex (beta = 0.139, p = 5.8 × 10⁻²⁸), frontal cortex (beta = 0.14, p = 3 × 10⁻³¹), cerebellar hemisphere (beta = 0.118, p = 9.8 × 10⁻²⁸), cerebellum (beta = 0.12, p = 2.8 × 10⁻²⁷), and anterior cingulate cortex (beta = 0.135, p = 5.7 × 10⁻²⁶) (Figure 2a; Supplementary Table S4).
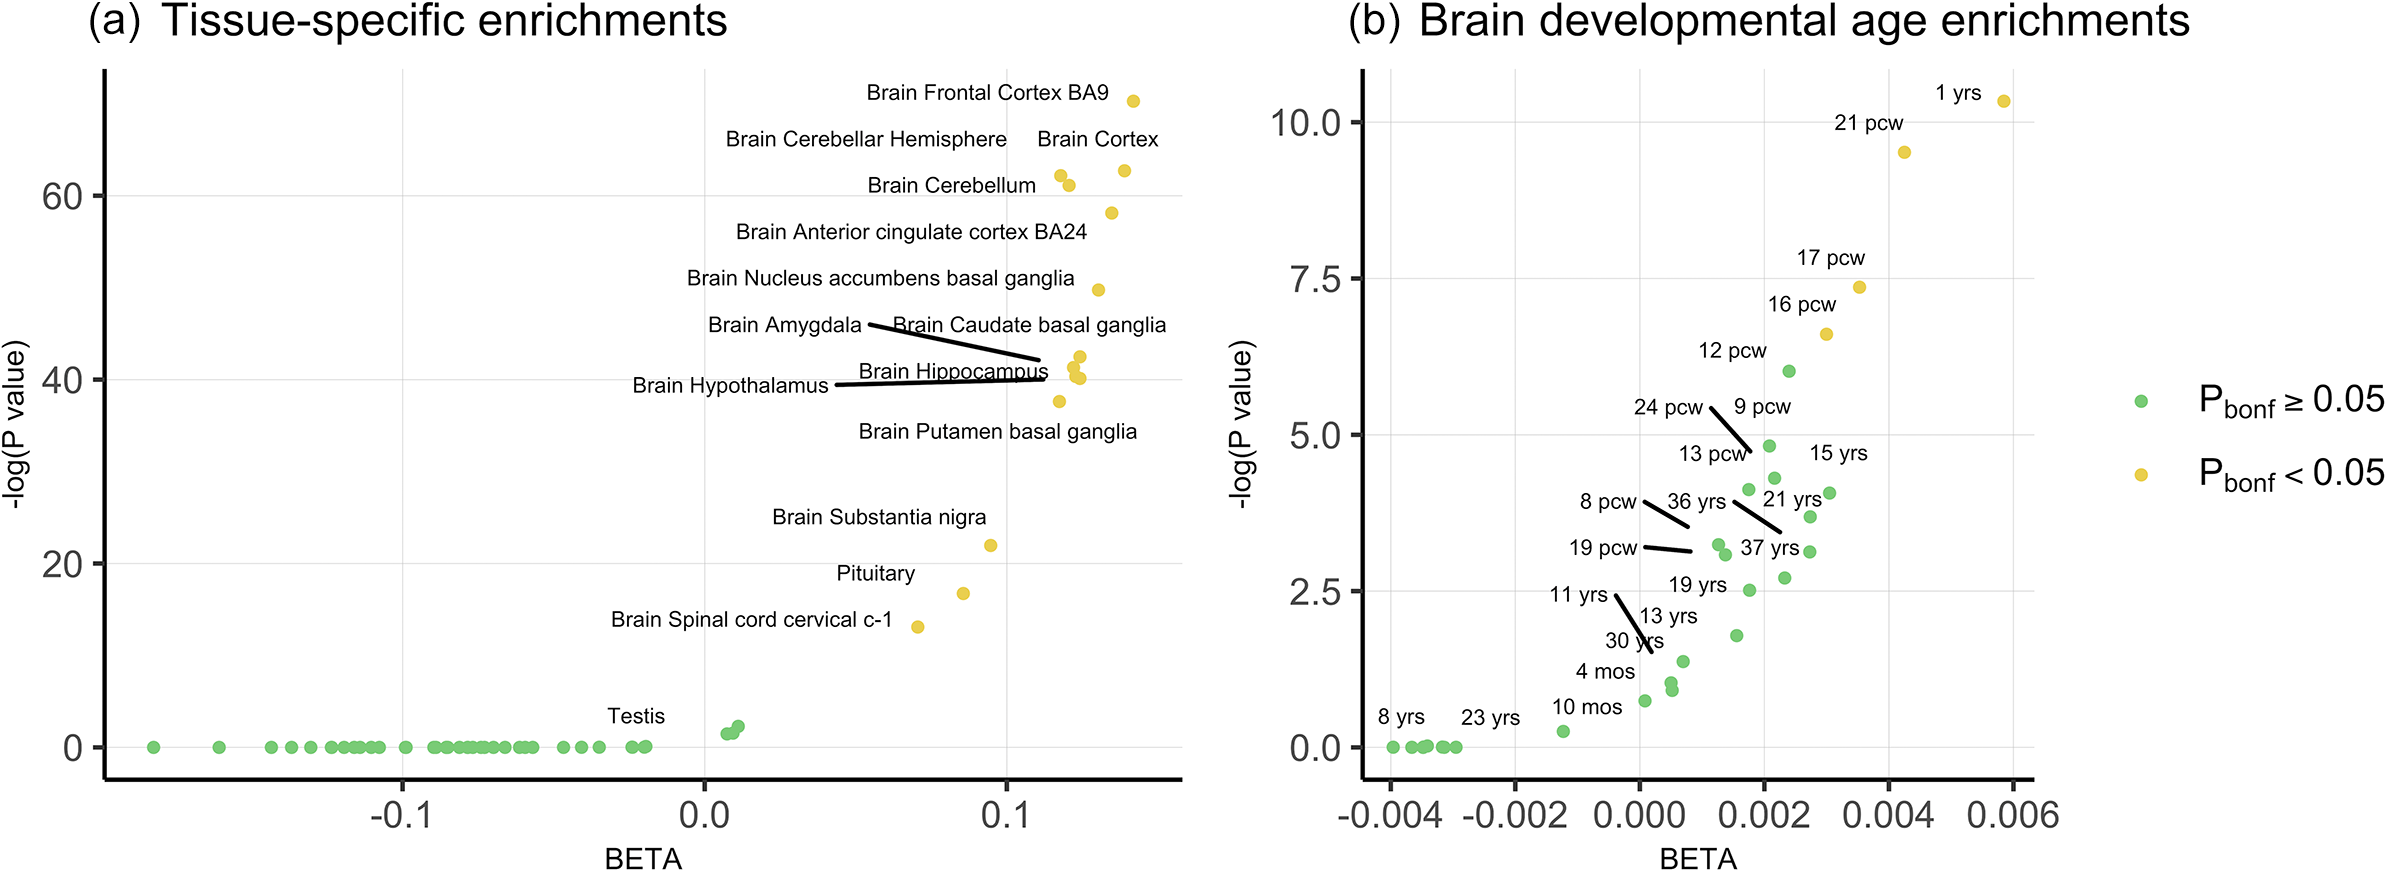
Figure 2. (a) Tissue-specific enrichments for the genome-wide pleiotropy statistics. (b) Temporal enrichments of the genome-wide pleiotropy statistics for 29 brain development stages.
To further investigate the developmental specificity of pleiotropic mechanisms, we tested PLEIO genome-wide statistics with respect to 29 brain developmental stages (Figure 2b; Supplementary Table S5). After Bonferroni correction, significant enrichments were observed for the first year of life (beta = 0.006, p = 3.25 × 10⁻⁵) and two post-conception weeks (pcw 21 beta = 0.004, p = 7.35 × 10⁻⁵; pcw17 beta = 0.004, p = 6.36 × 10⁻⁴).
Characterization of disorder-specific pleiotropic loci
Our PLEIO analysis uncovered 553 loci with pleiotropic effects across BP, MDD, and SCZ that survived genome-wide multiple testing correction (p < 5 × 10⁻⁸; Supplementary Table S6). Among these variants, 192 were LD independent from variants reaching genome-wide significance in the original BP, MDD, and SCZ GWASs (Lam et al., Reference Lam, Chen, Li, Martin, Bryois, Ma, Gaspar, Ikeda, Benyamin, Brown, Liu, Zhou, Guan, Kamatani, Kim, Kubo, Kusumawardhani, Liu, Ma, Periyasamy, Takahashi, Xu, Yu, Zhu, Chen, Faraone, Glatt, He, Hyman, Hwu, McCarroll, Neale, Sklar, Wildenauer, Yu, Zhang, Mowry, Lee, Holmans, Xu, Sullivan, Ripke, O’Donovan, Daly, Qin, Sham, Iwata, Hong, Schwab, Yue, Tsuang, Liu, Ma, Kahn, Shi and Huang2019; Major Depressive Disorder Working Group of the Psychiatric Genomics Consortium, 2025; Mullins et al., Reference Mullins, Forstner, O’Connell, Coombes, Coleman, Qiao, Als, Bigdeli, Borte, Bryois, Charney, Drange, Gandal, Hagenaars, Ikeda, Kamitaki, Kim, Krebs, Panagiotaropoulou, Schilder, Sloofman, Steinberg, Trubetskoy, Winsvold, Won, Abramova, Adorjan, Agerbo, Al Eissa, Albani, Alliey-Rodriguez, Anjorin, Antilla, Antoniou, Awasthi, Baek, Baekvad-Hansen, Bass, Bauer, Beins, Bergen, Birner, Bocker Pedersen, Boen, Boks, Bosch, Brum, Brumpton, Brunkhorst-Kanaan, Budde, Bybjerg-Grauholm, Byerley, Cairns, Casas, Cervantes, Clarke, Cruceanu, Cuellar-Barboza, Cunningham, Curtis, Czerski, Dale, Dalkner, David, Degenhardt, Djurovic, Dobbyn, Douzenis, Elvsashagen, Escott-Price, Ferrier, Fiorentino, Foroud, Forty, Frank, Frei, Freimer, Frisen, Gade, Garnham, Gelernter, Giortz Pedersen, Gizer, Gordon, Gordon-Smith, Greenwood, Grove, Guzman-Parra, Ha, Haraldsson, Hautzinger, Heilbronner, Hellgren, Herms, Hoffmann, Holmans, Huckins, Jamain, Johnson and Kalman2021). Accordingly, we refer to these 192 pleiotropic variants as novel associations. Performing an enrichment analysis testing novel and previously reported pleiotropic loci, we identified two pathways with respect to the latter group: Metabotropic glutamate receptor group III (Pathway Accession: P00039; 9.64-fold enrichment, p = 5.65 × 10⁻⁵), and Heterotrimeric G-protein signaling -Gq alpha and Go alpha mediated pathway (Pathway Accession: P00027; 7.20-fold enrichment, p = 2.39 × 10⁻⁵) (Figure 1b; Supplementary Table S3).
Tissue specificity analysis demonstrated overexpression of the novel loci in the same tissue types as the previously identified ones. In particular, the expression of both groups of SNPs was significantly (p < 0.05) upregulated solely in brain tissues (Supplementary Table S7). Additionally, previously identified loci were over-expressed in the cerebellum (p previously-identified = 3.54 × 10⁻³) and the cerebellar hemispheres (p previously-identified = 1.07 × 10⁻³). Downregulated genes were shown to be over-expressed in the kidney for the novel loci (p novel = 6.9 × 10⁻⁴) and in the minor salivary gland in the previously identified loci (p previously-identified = 8.16 × 10⁻³).
Most pleiotropic variants presented concordant effects across the three disorders (81% of the 553 pleiotropic loci identified). Pleiotropic loci with concordant effect direction were enriched for five pathways surviving multiple testing correction (FDR q < 0.05): Nicotine pharmacodynamics (Pathway Accession: P06587; 12.52-fold enrichment, p = 8.36 × 10⁻⁵), 5HT2 type receptor-mediated signaling (Pathway Accession: P04374; 9.15-fold enrichment, p = 2.02 × 10⁻⁵), Oxytocin receptor-mediated signaling (Pathway Accession: P04391; 8.91-fold enrichment, p = 9.18 × 10⁻⁵), Heterotrimeric G-protein signaling-Gq alpha and Go alpha-mediated pathway (Pathway Accession: P00027; 6.31-fold enrichment, p = 2.19 × 10⁻⁵), and Heterotrimeric G-protein signaling-Gi alpha and Gs alpha mediated pathway (Pathway Accession: P00026; 5.38-fold enrichment, p = 2.82 × 10⁻⁵; Supplementary Table S3). With respect to tissue-specific transcriptomic regulation, loci with concordant effects across BP, MDD, and SCZ mapped to genes significantly up-regulated in all of the aforementioned brain regions (Supplementary Table S7) and the anterior tibial artery (p = 5.36 × 10⁻⁵) and to genes significantly downregulated in the kidney (p = 6.66 × 10⁻⁶) and minor salivary glands (p = 2.27 × 10⁻⁵). Due to their limited number, pleiotropic loci with discordant effect directions across SCZ, BP, and MDD were not enriched for any pathway or tissue-specific transcriptomic regulation.
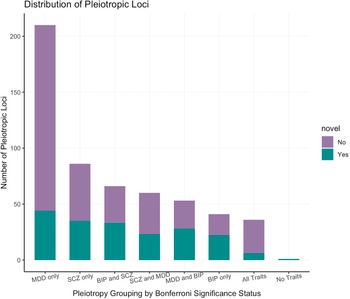
To investigate whether PLEIO results were driven by disorder-specific effects, we applied a Bonferroni correction accounting for the number of pleiotropic variants identified (p = 9.04 × 10⁻⁵) to the associations identified in each individual GWAS and stratified the loci accordingly (Figure 3). We observed that only 36 showed effects across the three disorders, and most of them were novel associations. A similar number of loci showed effects across pairs of disorders: 66 for BP-SCZ (50% novel associations), 60 for MDD-SCZ (38% novel associations), and 53 for MDD-BP (52% novel associations). We also observed that 337 loci identified by our PLEIO analysis were driven by the effect on a specific disorder (BP 41; MDD 210; SCZ 86). Additionally, we identified one variant (rs2588469) that showed genome-wide significant pleiotropic effects (PLEIO p = 1.18 × 10⁻⁸), but showed only nominally significant associations with the three disorders investigated (BP: beta = −0.056, p = 0.0003; MDD: OR = 0.98, p = 9.9 × 10⁻⁵; SCZ OR = 1.062, p = 0.0008).

Figure 3. Distribution of statistically significant pleiotropic variants by disease-specific effect.
Although the loci associated with BP, MDD, and SCZ consist of the 34 variants, we observed strong enrichment for three molecular pathways (FDR q < 0.05; Figure 1b): Oxytocin receptor-mediated signaling (Pathway Accession: P04391; 52.34-fold enrichment, p = 2.85 × 10⁻⁵), Alzheimer disease-amyloid secretase pathway (Pathway Accession: P00003; 46.09-fold enrichment, p = 4.1 × 10⁻⁵), 5HT2 type receptor-mediated signaling (Pathway Accession: P04374; 46.09-fold enrichment, p = 4.1 × 10⁻⁵). The MDD-driven subgroup was overrepresented for the metabotropic glutamate receptor group III pathway (Pathway Accession: P00039; 16.81-fold enrichment, p = 2.42 × 10⁻⁶). No pathway enrichment survived multiple testing correction for the other subgroups investigated.
With respect to tissue-specific transcriptomic regulation, we observed enrichment for multiple brain regions across most of the subgroups investigated: MDD-driven (top result: Brain Frontal Cortex p = 2.53 × 10⁻⁷), SCZ-driven (top result: Anterior Cingulate Cortex p = 3.012 × 10⁻⁶), BP-SCZ (top result: Brain Cortex p = 0.0007), MDD-BP (top result: Brain Frontal Cortex p = 1.96 × 10⁻⁷), and BP-driven (top result: Nucleus Accumbens p = 5.27 × 10⁻⁵). Pairwise comparisons showed no statistically significant differences among the subset-specific brain enrichment estimates.
Finally, we explored drugs potentially relevant to the 553 pleiotropic loci due to their molecular pathway enrichments (Supplementary Table S8). We identified 15 drugs surviving multiple testing correction: chlorambucil (EScore = −0.85, p = 1.7 × 10⁻⁸), 6-bromoindirubin-3′-oxime (EScore = −0.77, p = 1.28 × 10⁻⁶), butirosin (EScore = −0.76, p = 1.61 × 10⁻⁶), isoetarine (EScore = 0.76, p = 2.22 × 10⁻⁶), betazole (EScore = 0.75, p = 3.31 × 10⁻⁶), vorinostat (EScore = 0.345, p = 7.8 × 10⁻⁶), chlorogenic_acid (EScore = −0.73, p = 8.26 × 10⁻⁶), pentetrazol (EScore = 0.71, p = 1.42 × 10⁻⁵), proscillaridin (EScore = 0.34, p = 1.8 × 10⁻⁵), digoxin (EScore = 0.34, p = 1.81 × 10⁻⁵), salsolidin (EScore = −0.70, p = 2.21 × 10⁻⁵), pioglitazone (EScore = −0.70, p = 2.69 × 10⁻⁵), lanatoside_C (EScore = 0.33, p = 2.83 × 10⁻⁵), ketorolac (EScore = 0.69, p = 3.46 × 10⁻⁵), and hydroquinine (EScore = 0.33, p = 3.8 × 10⁻⁵). With respect to SCZ-MDD, the SCZ-BP, and the MDD-driven loci, we observed significantly enriched pathways for each of these subgroups (Supplementary Table S9). Gene2drug results were corrected for 1,309 drugs and 3 subgroups tested (N = 3,918 tests). After Bonferroni multiple testing correction (p < 1.28 × 10⁻⁵), our gene2drug analysis identified potential drug targets for the MDD-driven pleiotropic loci: etynodiol (EScore = −0.63, p = 1.41 × 10⁻⁶) and ifosfamide (EScore = 0.6, p = 4.13 × 10⁻⁶).
Discussion
In the present study, we investigated the shared genetic architecture of BP, MDD, and SCZ, providing insights regarding the common background for the development of those three disorders and the possible molecular mechanisms differentiating between them.
In line with the positive genetic correlation observed among BP, MDD, and SCZ, most of the pleiotropic loci identified exert a convergent effect on all three disorders. Notably, although the loci that were significantly associated with all three disorders after study-wide multiple testing correction constitute only 6.5% of all variants reaching genome-wide significance in the PLEIO analysis, they demonstrate enrichments for the largest number of molecular pathway enrichments among all groups tested. Indeed, they showed an overrepresentation of two of the five molecular pathways identified, considering PLEIO genome-wide statistics: the Alzheimer’s disease-amyloid secretase pathway and oxytocin receptor-mediated signaling. BACE1 secretase activity plays a key role in the generation of β-amyloid and in the pathogenesis of Alzheimer’s disease (Cole & Vassar, Reference Cole and Vassar2007). Additionally, amyloid appears to be implicated in psychiatric disorders through processes related to neurodevelopmental alteration as well as neuronal degeneration (Pandolfo et al., Reference Pandolfo, Iannuzzo, Genovese, Bruno, Pioggia, Baldari and Gangemi2021). Among the other pleiotropy-based groups, the only enrichment observed was for the ‘metabotropic glutamate receptor group III’ pathway with respect to MDD-driven associated variants. This pathway was also observed in the enrichment analysis conducted with respect to PLEIO genome-wide statistics. Given the large sample size of the MDD GWAS, it is possible that the MDD-specific enrichment for the metabotropic glutamate receptor group III pathway drives the genome-wide pleiotropic association as well. MDD enrichment for ‘metabotropic glutamate receptor group III’ pathway is particularly interesting because preclinical studies highlighted that mGlu2/3 receptor antagonists have fast and sustained antidepressant-like effects (Dogra & Conn, Reference Dogra and Conn2021). The analysis based on PLEIO genome-wide association statistics identified enrichments for Cadherin signaling and Wnt signaling that were not observed in the analysis conducted with respect to pleiotropy-based groups. These signaling pathways have been identified as involved in neural development and have been previously associated with SCZ (Vallee, Reference Vallee2022) and BP (Hoseth et al., Reference Hoseth, Krull, Dieset, Morch, Hope, Gardsjord, Steen, Melle, Brattbakk, Steen, Aukrust, Djurovic, Andreassen and Ueland2018). In our study, we identified a variant reaching genome-wide significance in pleiotropy analysis (rs6874218), which mapped within the Protocadherin Alpha (PCDHA) gene cluster and demonstrated discordant effects among the disorders investigated, such that the reference allele (T) had positive effects on BP (OR = 1.05; p = 5.2 × 10⁻⁷) and SCZ (OR = 1.033; p = 0.004), but a negative effect on MDD (OR = 0.99; p = 0.001). This is in line with a previous study reporting that PCDHA7 gene downregulation increases the risk for MDD, while it exerts a protective effect for BP and SCZ (Byrne et al., Reference Byrne, Zhu, Qi, Skene, Bryois, Pardinas, Stahl, Smoller, Rietschel, Owen, Walters, O’Donovan, McGrath, Hjerling-Leffler, Sullivan, Goddard, Visscher, Yang and Wray2021). The discordant effect of this locus on MDD with respect to BP and SCZ may be part of a broader trend. Indeed, 57% of the discordant pleiotropic variants exerted an opposing effect on MDD compared to SCZ and BP. In this context, the higher SCZ-BP genetic correlation compared to MDD-BP and MDD-SCZ pairs may be related to the molecular pathways differentiating SCZ and BP from MDD. This is also supported by the stronger neuronal-cell type enrichment observed for SCZ and BP compared to MDD. This could support a different role of neurons in MDD pathogenesis. Assessing more representative datasets of neuronal and non-neuronal cells will be needed to understand the molecular basis of the differences observed in the present study. From a phenotypic point of view, MDD differentiation may be also reflected by its multi-system nature (Penninx, Milaneschi, Lamers, & Vogelzangs, Reference Penninx, Milaneschi, Lamers and Vogelzangs2013), where certain MDD subtypes may present a positive genetic correlation with SCZ and BP, while others may present distinct genetic profiles. Indeed, a recent study of MDD heterogeneity showed that MDD age of onset, longitudinal course, and various subtypes have different patterns of genetic overlap with psychiatric and comorbid traits (Mitchell et al., Reference Mitchell, Campos, Whiteman, Olsen, Gordon, Walker, Dean, Berk, Hickie, Medland, Wray, Martin and Byrne2022). Further research will be needed to understand how pleiotropy with SCZ and BP can differentially influence MDD subtypes. Unfortunately, the design of the GWAS meta-analyses used in the present study did not permit us to explore this aspect. For instance, although participants with history of mania, hypomania, or non-affective psychosis were excluded from the MDD case definition (Major Depressive Disorder Working Group of the Psychiatric Genomics Consortium, 2025), a portion of MDD cases may fulfill criteria for BP or schizoaffective disorder later in life due to the genetic risk shared with BP and SCZ.
In addition to exploring which biological pathways were more affected by pleiotropic loci shared across BP, SCZ, and MDD, we also investigated tissue-specific and temporal regulation of transcriptomic variation. Our tissue-specific analysis identified enrichment for transcriptomic regulation within multiple brain regions, with the strongest evidence for the brain cortex and frontal cortex, as well as the cerebellum and cerebellar hemisphere. Multiple functional domains of the frontal cortex have been implicated in the pathophysiology of all three disorders through several different mechanisms (Joseph, Reference Joseph1999). The cerebellum has also been shown to manifest a common pattern of intrinsic brain activity in BP and MDD patients (Gong et al., Reference Gong, Wang, Qiu, Chen, Luo, Huang and Wang2020). Importantly, we did not observe differences when compared novel versus previously identified loci. This supports that the pleiotropic loci observed are related to the same pathogenetic processes uncovered by the disorder-specific GWAS.
With respect to temporal regulation of brain transcriptomic variation, we expanded upon existing evidence that pleiotropic loci across eight psychiatric disorders are overexpressed in the second prenatal trimester (Phil et al., Reference Phil, Lee, Won, Feng, Rosenthal, Zhu and Smoller2019). Presently, we analyzed 29 brain developmental stages and observed that the BP, MDD, and SCZ pleiotropic loci are highly expressed across multiple neurodevelopmental stages, ranging from 16 weeks post-conception to the first year of life. It is also noteworthy that this pattern of differential gene expression was distinct from the disorder-specific motifs. SCZ and BP have been previously associated with changes in gene expression in early developmental stages (Jia, Manuel, Fernandes, Dai, & Zhao, Reference Jia, Manuel, Fernandes, Dai and Zhao2021; Pers et al., Reference Pers, Timshel, Ripke, Lent, Sullivan, O’Donovan, Franke and Hirschhorn2016). However, SCZ presents overexpression of certain genes from early infancy through adult life (Pers et al., Reference Pers, Timshel, Ripke, Lent, Sullivan, O’Donovan, Franke and Hirschhorn2016) while BP has been mainly associated with prenatally upregulated genes (Jia et al., Reference Jia, Manuel, Fernandes, Dai and Zhao2021). Conversely, MDD does not appear to have age-specific gene expression profiles (Jia et al., Reference Jia, Manuel, Fernandes, Dai and Zhao2021).
Our drug-repositioning analysis identified several compounds potentially related to molecular pathways shared across BP, MD, and SCZ. Some of these drugs are also supported by previous evidence linking them to the treatment of psychiatric disorders. For example, 6-bromoindirubin-3′-oxime is a glycogen synthase kinase 3 beta (GSK3β) inhibitor that has demonstrated neuroprotective properties (Nguyen et al., Reference Nguyen, Lucero, Chana, Hult, Tatro, Masliah, Grant, Achim and Everall2009; Zhao et al., Reference Zhao, Wei, Zhang, Zhang, Won, Sun, Yu, Li and Wei2017). Chlorogenic acid is a polyphenolic compound that has been previously shown to exert an antidepressant and neuroprotective effect (Nabavi et al., Reference Nabavi, Tejada, Setzer, Gortzi, Sureda, Braidy, Daglia, Manayi and Nabavi2017). Salsonidine is a novel dopaminergic compound that appears to modulate blood biomarkers of Alzheimer’s disease (Niculescu et al., Reference Niculescu, Le-Niculescu, Roseberry, Wang, Hart, Kaur, Robertson, Jones, Strasburger, Williams, Kurian, Lamb, Shekhar, Lahiri and Saykin2020). Chlorambucil has been proposed as a possible BP target in another drug repositioning analysis (Kidnapillai et al., Reference Kidnapillai, Bortolasci, Udawela, Panizzutti, Spolding, Connor, Sanigorski, Dean, Crowley, Jamain, Gray, Scarr, Leboyer, Dean, Berk and Walder2020). Additionally, we identified etynodiol as a potential drug targeting MDD-driven pleiotropic loci. This a steroidal progestin used in oral combined oral contraceptives (COCs). Monophasic drospirenone-containing COCs have been associated with improvement of premenstrual dysphoric disorder, while multiphasic COCs are also associated with mood swings (Pearlstein, Bachmann, Zacur, & Yonkers, Reference Pearlstein, Bachmann, Zacur and Yonkers2005). Zuranolone, a neuropeptide metabolite of progesterone, has been approved as a first-line treatment of severe post-partum depression (Patterson, Balan, Morrow, & Meltzer-Brody, Reference Patterson, Balan, Morrow and Meltzer-Brody2024). To our knowledge, no information is available about etynodiol effect on mood.
While our study contributed to advance the understanding of BP, MDD, and SCZ shared genetic risk, we also acknowledge several limitations in our study. First, our analyses were limited to GWAS conducted in individuals of European descent because of the lack of large-scale GWAS in other population groups. Accordingly, our findings may not be generalized across diverse ancestries. To maximize our statistical power, we analyzed GWAS meta-analyses generated from cohorts including cases with different characteristics (e.g., severity, age of onset, and comorbidities). This did not permit us to investigate how BP-MDD-SCZ pleiotropy contributes to disorder heterogeneity. While the PLEIO approach can analyze phenotypes with diverse genetic architectures, we cannot exclude that the higher polygenicity of MDD compared with BP and SCZ may have influenced our results. Similarly, we cannot exclude that the pleiotropic mechanisms uncovered may have been at least partially affected by misclassification and exclusion criteria in the original studies. Additionally, although the statistical power (based on the SNP-h 2 z-score statistics) appears to be similar among the three GWAS investigated, the larger number of MDD-driven pleiotropic loci may still be due to the differences among the datasets investigated. Finally, we considered novel loci, those not identified as genome-wide significant in the BP, MDD, and SCZ GWAS investigated in this study. However, these variants may have been previously detected in other studies.
In conclusion, our cross-disorder analysis of SCZ, BP, and MDD identified 553 pleiotropic loci. Of those, 192 were not previously identified as associated with either of the three disorders. Pleiotropic mechanisms were shown to exert mostly a concordant effect on the psychiatric disorders investigated, with enrichment for loci highly expressed in early neurodevelopmental stages. Our analysis confirms that genetic architecture across the psychopathology spectrum transcends diagnostic confines and pleiotropy-focused analyses can lead to new insights into psychiatric nosology and therapeutics.
Supplementary material
The supplementary material for this article can be found at http://doi.org/10.1017/S0033291725001217.
Acknowledgments
E.F. would like to acknowledge the support provided by the IT Center of the Aristotle University of Thessaloniki (AUTh) throughout the progress of this research work.
Funding statement
This study was supported by grants from the National Institutes of Mental Health (RF1 MH132337) and the One Mind Rising Star Award. G.A.P. acknowledges support from the Yale Biological Sciences Training Program (T32 MH014276), Alzheimer’s Association (AARF-22-967171), NIH National Institute of Aging (K99AG078503), and the Yale Franke Fellowship in Science & Humanities.
Competing interests
R.P. received an honorarium from Karger Publishers for his work on Complex Psychiatry and a research grant from Alkermes outside the scope of this manuscript. D.K. is the founder and CEO of EndoCare Therapeutics. The remaining authors declare no competing interests exist.


 Open access