

Introduction
Goat milk has higher content of phospholipids and smaller fat globules than cow milk, which makes it easier to be digested and absorbed. In addition, goat milk is hypoallergenic, therefore it is more valuable for consumers (Feng et al. Reference Feng, Wang, Zhao, Wei, Shao, Wang, Cao and Zhang2019; Shang et al. Reference Shang, Liu, Cheng, Gao, Sun and Guo2022). Recent studies have highlighted the important role of milk fat in enhancing immune function, improving gut microbiota and supporting brain development. Milk fat content is also a key economic indicator for evaluating lactation performance of dairy animals, and its production is affected by the combination of nutrition, metabolism and gene transcription. Despite similar feeding conditions, dairy goats exhibit different capacities for milk fat production, and is believed that genetic factors, digestive processes, physiological status, stress levels, dietary intake and management practices all contribute to these differences (Mohan et al. Reference Mohan, O’Callaghan, Kelly and Hogan2021; Razzaghi et al. Reference Razzaghi, Ghaffari and Rico2023). In fact, milk fat synthesis regulation is not limited to a given profile of ruminal microorganisms and involves complex metabolic pathways and biological processes in the animal. Recent studies with dairy cows have underscored that production performance is often associated with unique profiles of ruminal microorganisms and their metabolites (Xue et al. Reference Xue, Sun, Wu, JX and LL2020; Zhang et al. Reference Zhang, Wang, Liu, Jiang, Chen, Liu, Yin, Wang, Deng, Yao and Wu2023). Thus, clarifying the association between individual endogenous factors and milk fat production in dairy goats is important for enhancing milk quality.
The ruminal microbiota work in concert to convert complex plant substances into host-absorbable compounds including microbial proteins, vitamins and volatile fatty acids (VFA) (Matthews et al. Reference Matthews, Crispie, Lewis, Reid, PW and Cotter2019). Acetate, propionate and butyrate, produced through microbial fermentation in the rumen, serve as the main energy sources for ruminants (Bickhart and Weimer Reference Bickhart and Weimer2018). They are absorbed from the rumen, metabolized in the liver and other organs, and in the case of acetate, hydroxybutyrate and the glucose produced from propionate in the liver are ultimately utilized by the mammary gland for milk fat synthesis (Urrutia et al. Reference Urrutia, Bomberger and Matamoros2019). In addition to these well-established contributions of microbial fermentation to the host, the microbial population as a whole could create an “ideal” environment to influence feed efficiency (Li et al. Reference Li, Hitch, Chen, CJ and Guan2019; Na and Guan Reference Na and Guan2022; Wang et al. Reference Wang, Chen, Tang, Yu, Chen, Li, Cao, Lei, Deng, Wu and Guan2023) and milk yield (Xue et al. Reference Xue, Sun, Wu, LL and JX2019).
The use of high-throughput technologies has revealed a high degree of symbiosis among the different microbial populations to the point of highlighting that certain communities are heritable in individual animals and can contribute to regulating milk fat synthesis and quality (Li et al. Reference Li, Li, Chen, Liu, Zhang, Irving, Fitzsimmons, Plastow and Guan2019a; Liu et al. Reference Liu, Wu, Chen, Zhou, Guo, Shi and Zhang2022b). For example, Jami et al. (Reference Jami, White and Mizrahi2014) was among the first to identify a Firmicutes and Bacteroidetes correlation with milk fat yield (Jami et al. Reference Jami, White and Mizrahi2014). Bainbridge et al. (Reference Bainbridge, Cersosimo, Wright and Kraft2016) reported moderate correlations among bacterial communities and milk yield, milk protein percentage and milk fat yield (Bainbridge et al. Reference Bainbridge, Cersosimo, Wright and Kraft2016). Additionally, studies have observed significant differences in ruminal microorganism abundance in Zhongdian yak cows with varying milk fat percentages (Liu et al. Reference Liu, Wu, Chen, Zhou, Guo, Shi and Zhang2022b). Thus, as the understanding of the ruminal microbial ecosystem and its effects on the host deepens, establishing a relationship between ruminal microorganisms and host performance has become feasible.
Metabolomics, another high-throughput technology, can be used to detect small endogenous metabolites in biological samples including blood (Johnson et al. Reference Johnson, Ivanisevic and Siuzdak2016). Because serum or plasma transport nutrients to various tissues and organs for utilization, assessing metabolomics profiles in these biological fluids can help understand the physiological and metabolic status of the animal (Sun et al. Reference Sun, Shi, Wu, MY, ZH, JX and Liu2017). For example, Wu et al. (Reference Wu, Sun, Xue, Wang, LL and Liu2018) reported several serum biomarkers associated with high milk protein yield in dairy cows and identified potential metabolic pathways influencing milk protein synthesis (Wu et al. Reference Wu, Sun, Xue, Wang, LL and Liu2018). However, the sole study focusing on the correlation of serum metabolites and milk fat in dairy goats involved nutritional regulation (Liu et al. Reference Liu, Jiang, Lv, Fan, Chen, Wu, Zhou and Tan2024). Thus, there is clearly a lack of information on ruminal microbial composition and function in dairy goats that could help answer questions such as, what are the key ruminal microorganisms and blood metabolites related to milk fat synthesis? How are they involved in the regulation of milk fat synthesis?
The objectives of the present study were to analyze and explore the characteristics of ruminal microbial composition and serum metabolomics profiles of dairy goats with varying milk fat percentages.
Materials and methods
Animal ethics
This study was designed and carried out in accordance with the guidelines of the Institutional Animal Care and Use Committee (No. 11–0085) of the College of Animal Science and Technology, Henan Agricultural University, China.
Animals and experimental design
Sixty clinically healthy Xinong Saanen dairy goats (150 ± 5 days in milk [DIM]) at mid-lactation without mastitis and of similar body weight (54.45 ± 3.05 kg), second parity and similar milk yield (1.41 ± 0.23 kg/d) were used. They were fed under the same feeding conditions and management regimen for 15 days. During the experiment, milk yield from every goat was recorded every day, and milk samples from every goat were collected once a week to evaluate composition. Milk samples were collected before feeding every morning (06:30) and afternoon (15:30). The twice-daily milk yield was recorded and the average daily milk yield during the 15th day tabulated, and the results are presented in Table 2. On the 1st, 8th and 15th day, a total of 50 mL of milk samples were collected in the morning and afternoon at a ratio of 4:6, milk composition was measured using milk components analyzer (FOSS MilkoScan FT-120, Beijing, China). Based on daily milk yield of dairy goats and the results of milk components determination on the 1st and 8th days of the experiment, five dairy goats with the highest milk fat content (H group, 5.48 %) and five goats with the lowest milk fat content (L group, 2.47 %) were selected for further analysis. The ingredient and nutrient composition of the diet used in this study are reported in Table 1.
Table 1. Composition and nutrient levels of the basal diet (DM basis)
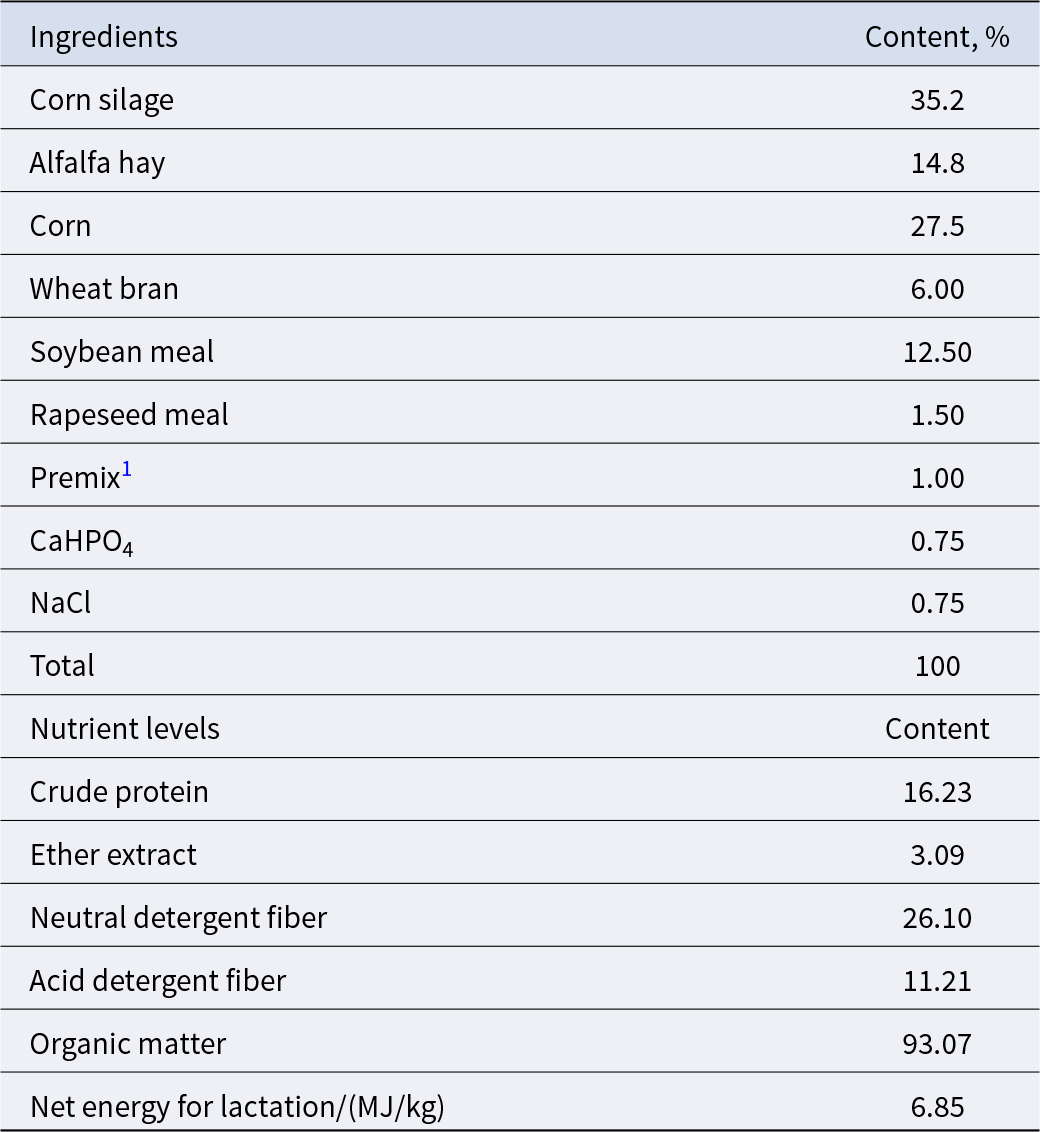
1 The premix provided the following per kg of the diets: VA 10,000 IU, VD3 4,000 IU, VE 30 IU, Cu 20 mg, Fe 76 mg, Zn 45 mg, Mn 30 mg and water content <10%.
Table 2. Milk components in L and H dairy goats
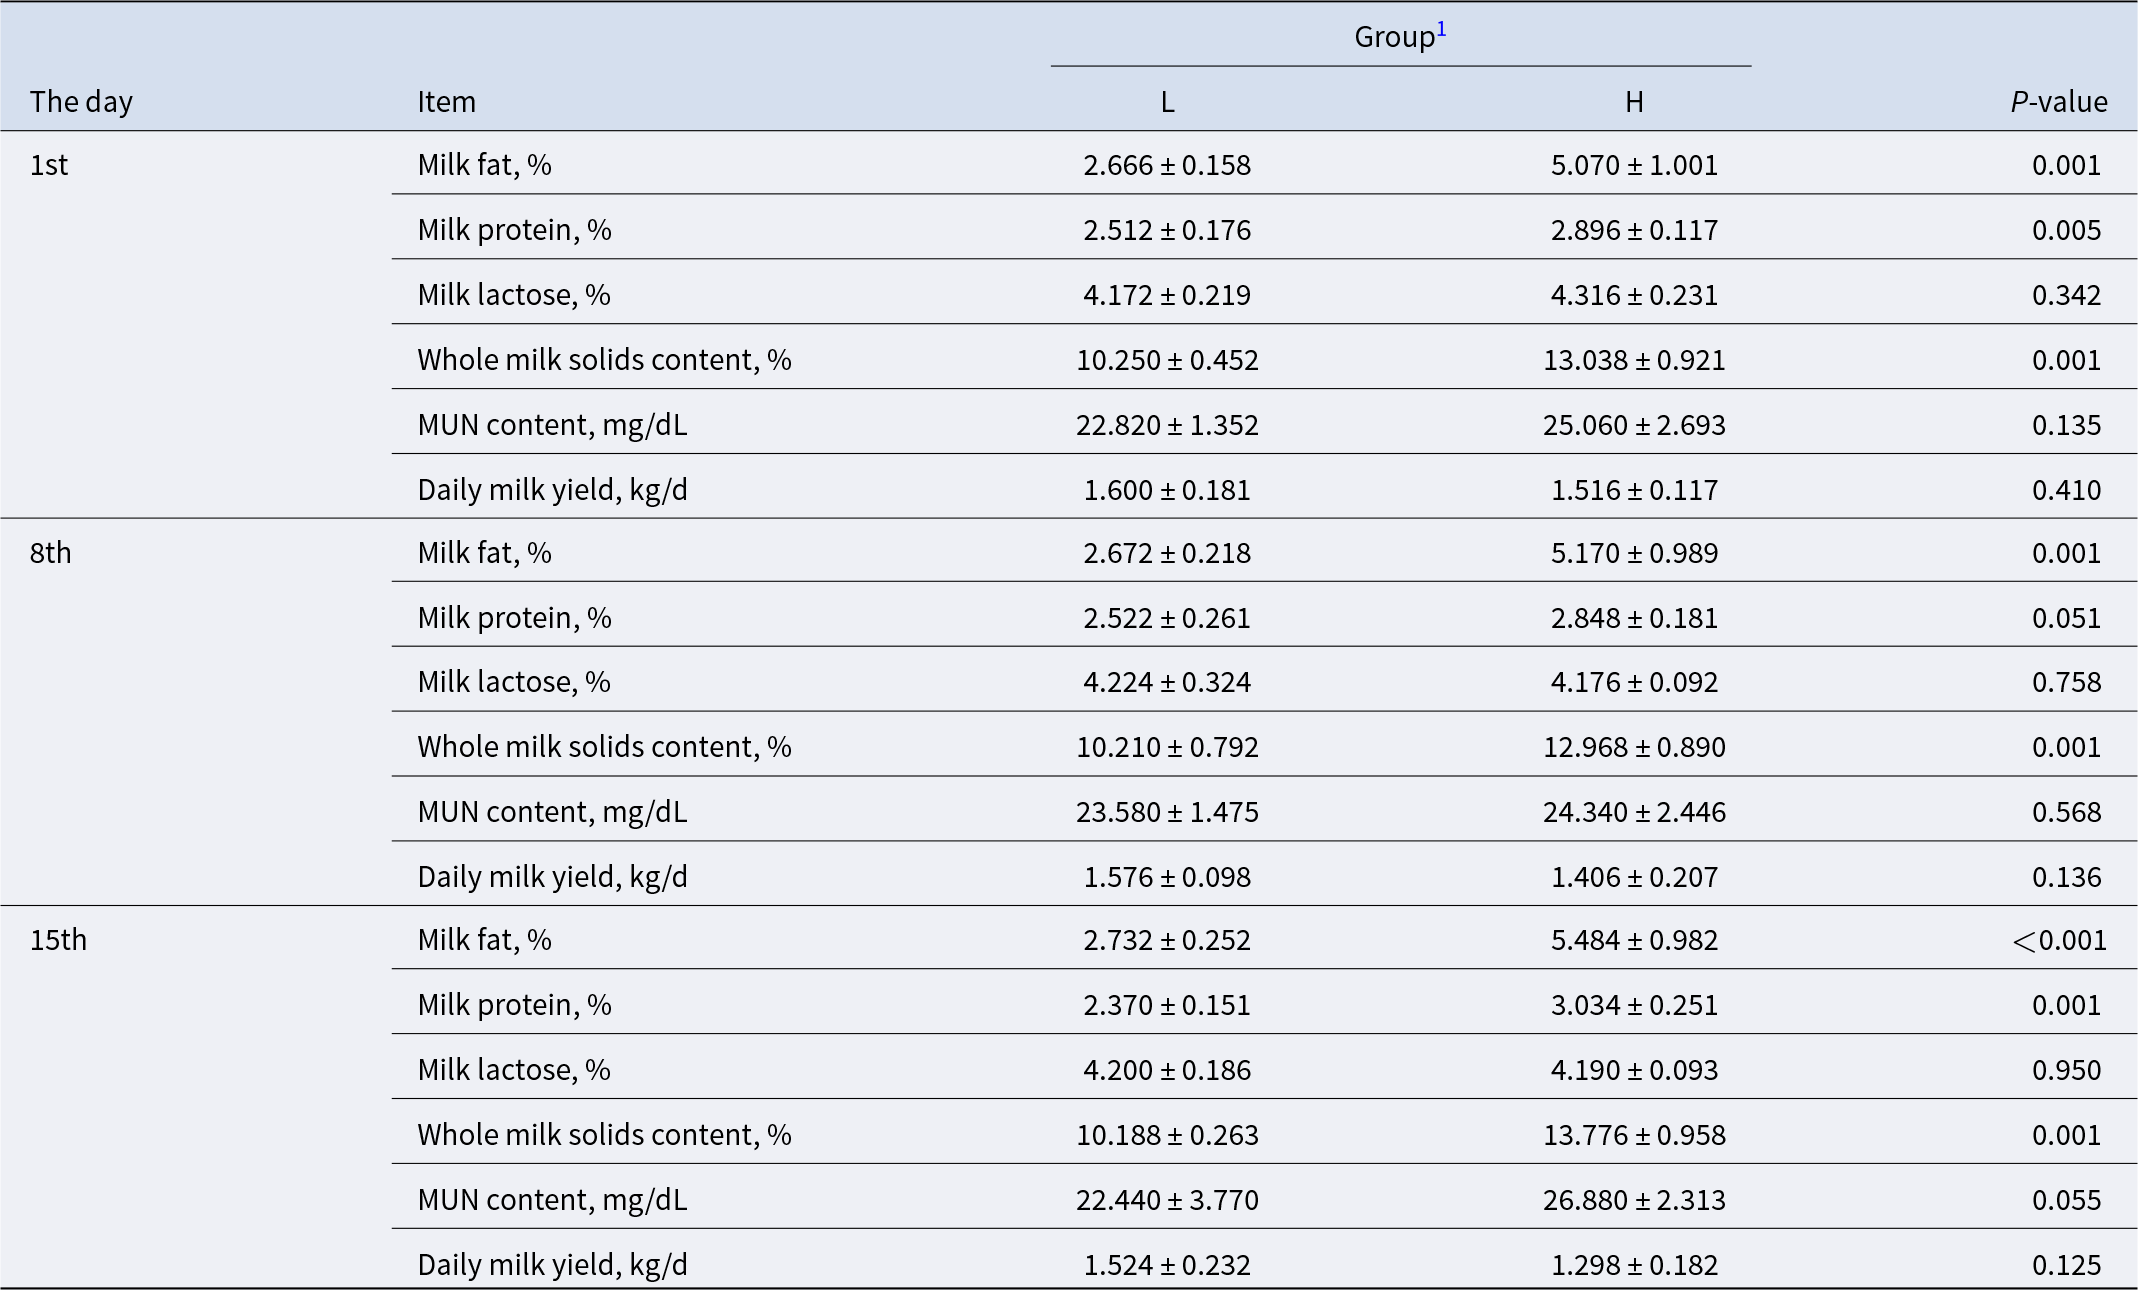
1 L = dairy goats with low milk fat percentage; H = dairy goats with high milk fat percentage.
Sample collection
On the 15th day of the experiment, ruminal fluid samples were collected via an esophageal catheter before feeding in the morning. A portable pH meter (Testo205, Testo, Germany) was used to measure the pH, and then four layers of sterile gauze were used to filter ruminal fluid, which was then sub-packed in 2 mL cryotubes and immediately stored at −80°C. The filtered ruminal fluid was used for detecting VFA concentrations and for microbiome analysis. Blood samples were collected through the jugular vein using vacuum blood collection tubes. The serum was collected immediately after a 15 min centrifugation at 3,000 × g at 4°C. The obtained serum samples were stored at −80°C for serum metabolome analysis.
Ruminal fermentation parameters
Ruminal fluid was centrifuged at 2,862 × g for 10 min and 1 mL of the supernatant aliquoted into 2 mL centrifuge tubes followed by mixing with 0.2 mL of 25% metaphosphoric acid deproteinization solution containing crotonic acid as the internal standard. After 30 min in an ice bath, the mixture was centrifuged at 9,610 × g for 10 min, and the supernatant drawn and filtered through a 0.22 μm filter membrane. The composition and content of VFA was detected by gas chromatography (Agilent 7890B GC System, Santa Clara, CA). The column was an AT-FFAP (30 m × 0.32 mm × 0.5 μm) capillary column, the detection temperature was 250°C, the inlet temperature was 250°C, and the injection volume was 1.0 μL.
Ruminal microbiome analysis
16S rDNA sequencing was performed by Gene Denovo Co., Ltd. (Guangzhou, China). DNA was extracted with the Genomic DNA Extraction Kit (Tiangen, Beijing, China). PCR amplification of the bacterial 16S rDNA genes V3–V4 region was performed using the forward primer 341 F (5’-CCTACGGGNGGCWGCAG-3’) and the reverse primer 806 R (5’-GGACTACHVGGGTATCTAAT-3’). A NanoDrop was used to quantify DNA, and the quality of DNA was assessed via 2% agarose gel electrophoresis. PE250 sequencing was performed with an Illumina NovaSeq 6000 sequencer. The raw sequence data were demultiplexed using the demux plug-in and then primers were cut using the cutadapt plug-in. The DADA2 plug-in was used for sequence quality filtering, denoising, merging and chimeric removal. Through statistical calculation of the ASV/OTU table, the specific composition table of microbial communities in each sample at each classification level was obtained, and the horizontal column chart of phylum and genus was drawn with QIIME2 2019.4 software. Chao1 was used to characterize richness, Faith’s PD index was used to characterize evolution-based diversity, Shannon and Simpson indices were used to characterize diversity, and Good’s coverage index was used to characterize coverage. QIIME2 was used to draw rarefaction curves, which reflected the impact of sequencing depth on the diversity of observed samples. A Venn diagram was drawn according to the ASV/OTU abundance table via the Venn diagram package in R software.
LC–MS analysis
Serum metabolome data were generated and analyzed by Gene Denovo Co., Ltd. (Guangzhou, China). Metabolomic analysis of the serum samples was performed by liquid chromatography (LC)-mass spectrometry (MS) platform. The extraction solution [Methanol: Acetonitrile = 1:1 (V/V), isotopically labeled internal standard mixture] was added to the serum sample, swirled for 30 s, followed by sonication on an ice bath for 10 min. After incubation at −40 °C for 1 h, the samples were centrifuged at 9,610 × g for 15 min at 4°C. The supernatant was then aliquoted into 2 mL vials for analysis. After the original data were converted into mzXML format by ProteoWizard software, peak identification, peak filtration, peak alignment and integration were processed using the XCMS package of R, and then matched with BiotreeDB (V2.1) self-built secondary mass spectrometry database for material annotation. Then, a two-dimensional data matrix, consisting of the mass to charge ratio, retention time and peak area of metabolites was obtained and introduced into SIMCA-P 13.0 software for multivariate statistical analysis. The metabolic pathways were analyzed with MetaboAnalystR 3.0 (https://www.metaboanalyst.ca/).
Statistical analysis
Statistical analysis was performed with Student’s t-test to compare milk composition and ruminal fermentation parameters using SPSS 24.0. Values were presented as the means ± SEM. Linear discriminant analysis effect size (LEfSe) was used to compare the relative abundance of microorganisms. Linear discriminant analysis (LDA) score >2 and P-value <0.05 were considered statistically significant. A variable importance in projection (VIP) >1 and P-value <0.05 were the thresholds to determine differentially expressed metabolites.
Results
Composition analysis of goat milk
Analysis of milk composition from samples collected on the 1st and 8th days revealed that the milk fat percentage in group H goats was significantly higher than that in group L goats (P < 0.05). The analysis of milk composition from samples collected on the 15th day showed that the average milk fat percentages of the H and L groups were 5.48% and 2.73%, respectively (P < 0.001) (Table 2). The daily milk yield of these two groups was similar (P = 0.125). In the H group, the milk protein percentage (P = 0.001) and milk solids (P = 0.001) content were significantly greater, but the milk lactose percentage and milk urea nitrogen (MUN) content did not differ (P > 0.05).
Ruminal fermentation parameters
The pH value of ruminal fluid in the H and L groups was 6.864 and 7.046, respectively, and did not differ (P = 0.174) (Table 3). Compared with the L group, the acetate (P = 0.018) concentration (mmol/L), acetate:propionate ratio (P = 0.043) and total VFA (P = 0.014) concentration in ruminal fluid from the H group were greater, while the concentrations of propionate, butyrate, valerate and isovalerate did not differ (P > 0.05). However, the molar percentage of acetate (P = 0.02) was significantly greater in the H group, while the molar percentage of propionate (P = 0.03) was lower.
Table 3. Comparison of ruminal fermentation characteristics in L and H dairy goats
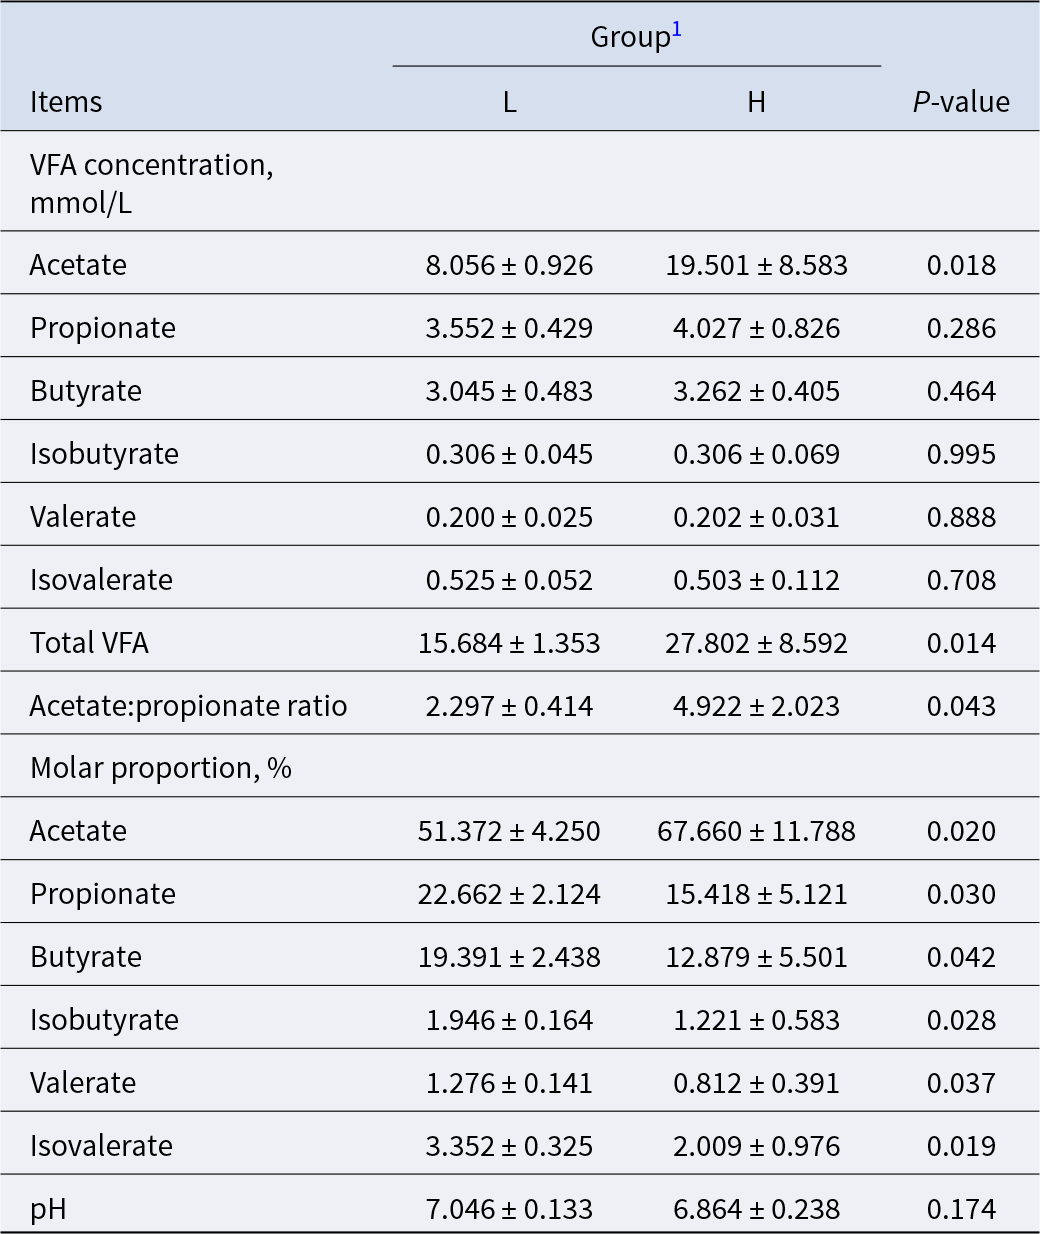
1 L = dairy goats with low milk fat percentage; H = dairy goats with high milk fat percentage.
Ruminal microbiota diversity
As depicted in Fig. 1A, the Chao1, Faith’ PD, Shannon and Simpson indices in the H group did not differ from the L group. There was no significant difference in the richness and diversity of the ruminal microbiota between the two groups. The smoothness of the Good’s coverage sparse curve of the two groups reflected the impact of sequencing depth on the diversity of the sequencing samples (Fig. 1B). The curves of the L and H groups tended to flatten with increasing sequencing depth, indicating that the sequencing depth was sufficient.
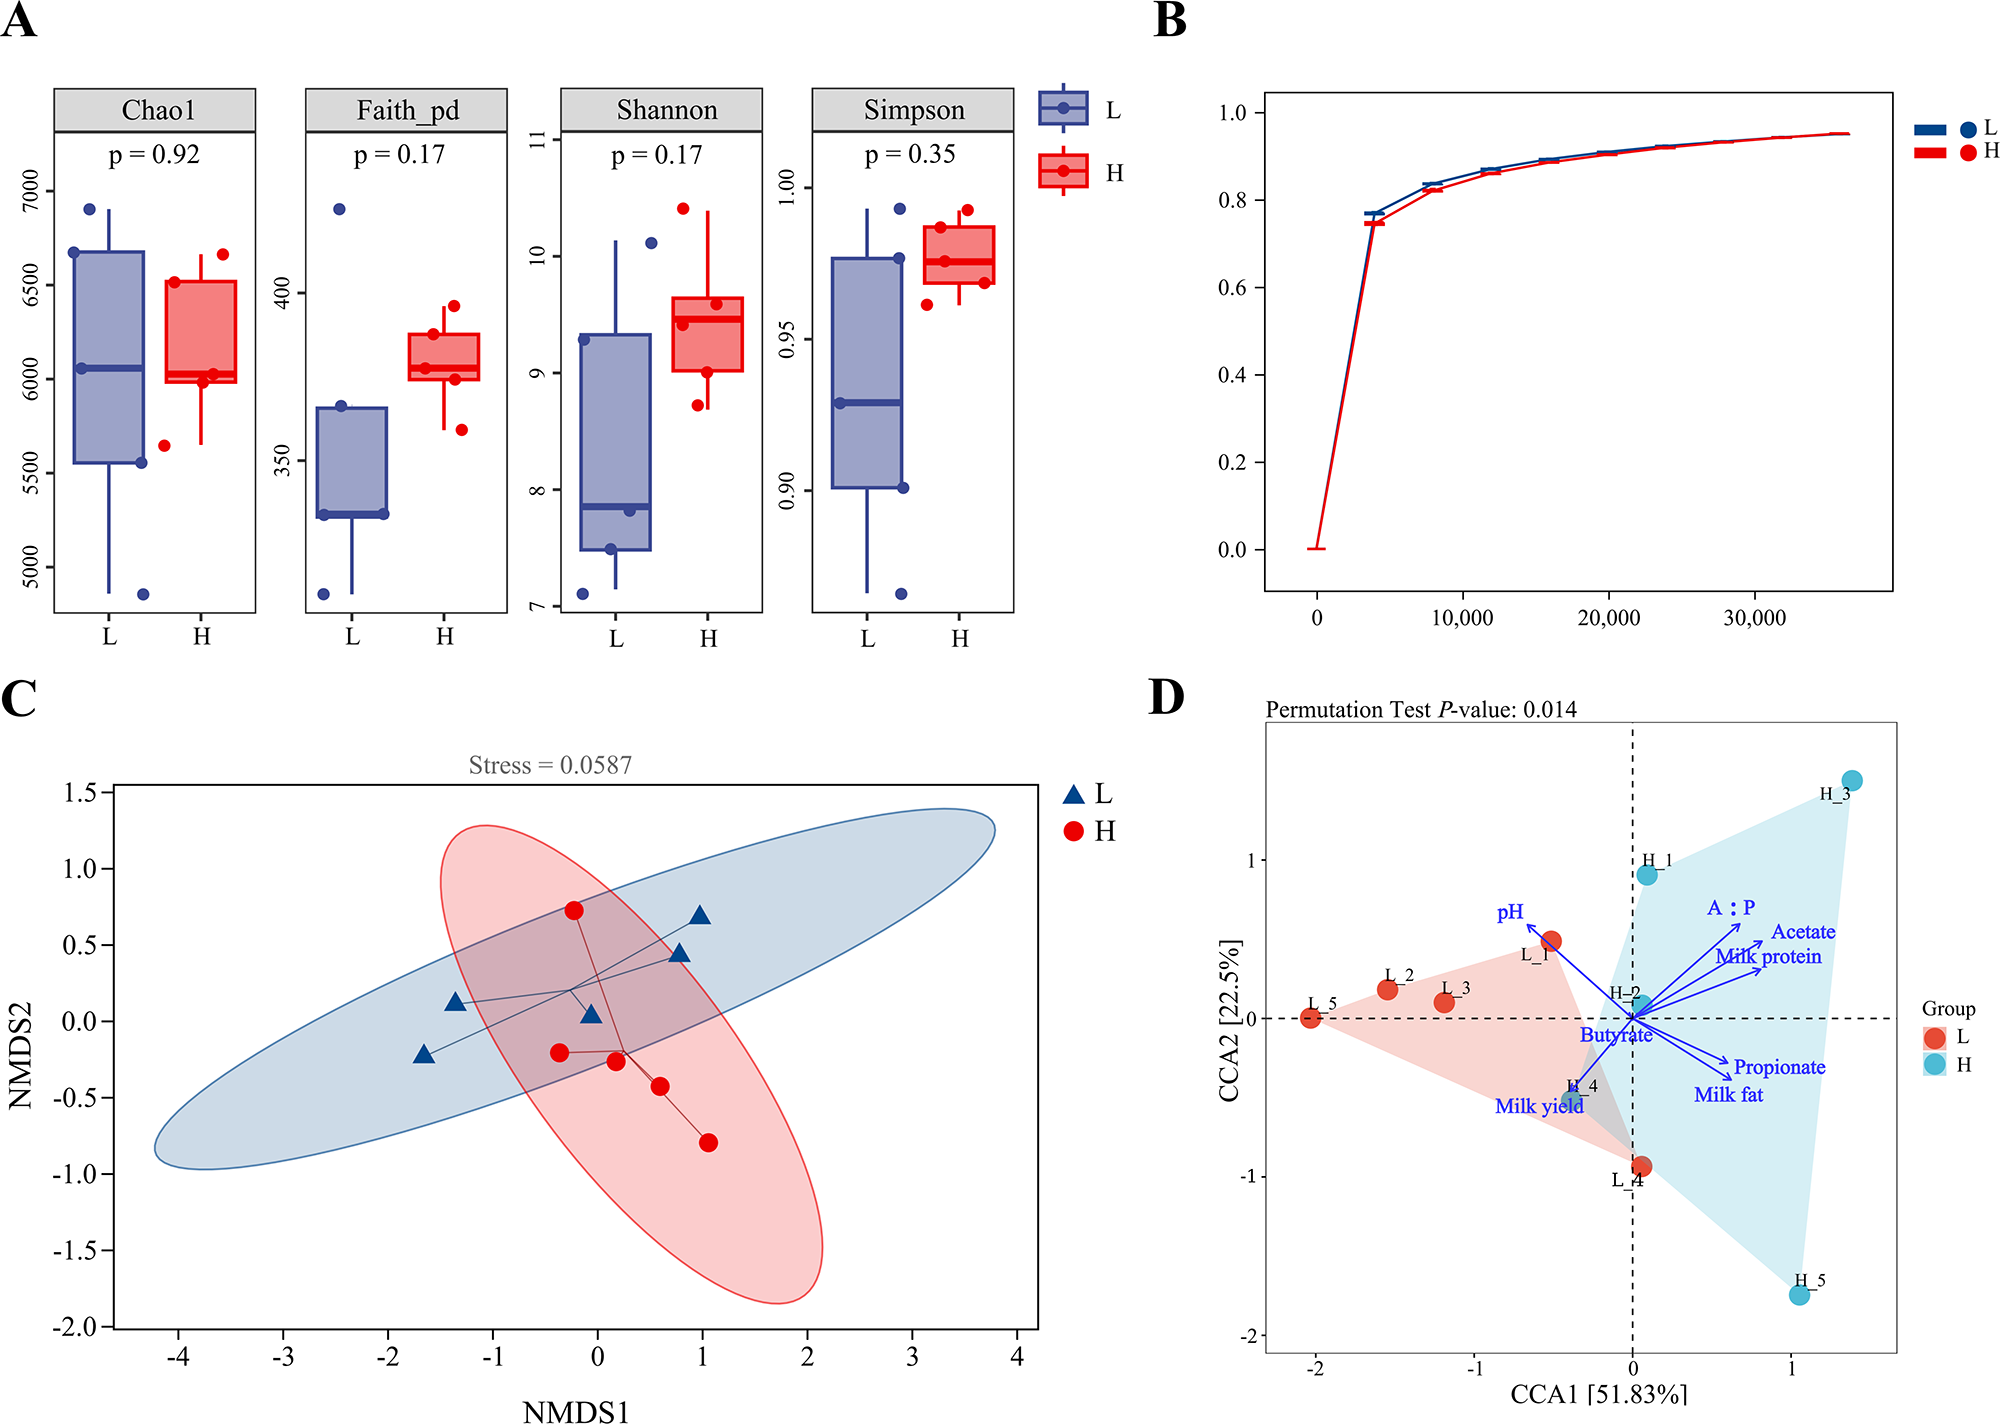
Figure 1. Alpha and beta diversity of l and h groups. (A) Alpha diversity of Chao1, Faith’s PD, Shannon and Simpson indices in l and h groups. (B) Good’s coverage sparse curve reflecting the sequencing depth of 16S rDNA gene sequencing. (C) NMDS analysis results of l and h groups (stress = 0.0587). (D) The CCA diagram of correlation analysis between samples of l and h groups (P = 0.014).
The Bray–Curtis distance matrix calculation method with non-metric multidimensional scaling (NMDS) analysis at the ASV level of all samples allowed the evaluation of microbiota composition (Fig. 1C). Results indicated that H and L clustered into two categories, although there were some overlaps, with a stress value of 0.0587, indicating significant differences in the microbiota composition. In addition, the permutation test multivariate analysis of variance (PERMANOVA) was significant (P = 0.023), underscoring differences in the microbial composition between the two groups. The CCA diagram of the correlation analysis indicated that the milk fat yield and VFA were closely correlated in the H group (Fig. 1D).
Ruminal microbiota and milk fat percentage
Figure 2A depicts the relative abundance of microbiota at the phylum level. Although Firmicutes, Proteobacteria and Bacteroidetes were the dominant phylum in the two groups, accounting for more than 99% of the total, the proportions of these microbial species in each group were completely different. The abundance of the top 15 genera is reported in Fig. 2B. The dominant microorganisms with the highest abundance were Acinetobacter, Lysinibacillus, Comamonas, Rikenellaceae_RC9_gut_group and Prevotella_1. A total of 16,255 and 18,032 unique ASVs were detected in the L and H groups, respectively, and a total of 3,446 ASVs were common between the two groups (Fig. 2C). As depicted in Fig. 2D and 2E, further analysis revealed that the relative abundance of Ruminococcaceae_UCG-005, Saccharoferments, Ruminococcaceae_UCG-002, Prevotellaceae_UCG-003, Bacteroidales_RF16_group and Firmicutes in the H group was greater, while the relative abundance of Proteobacteria was lower than that in the L group (P < 0.05).
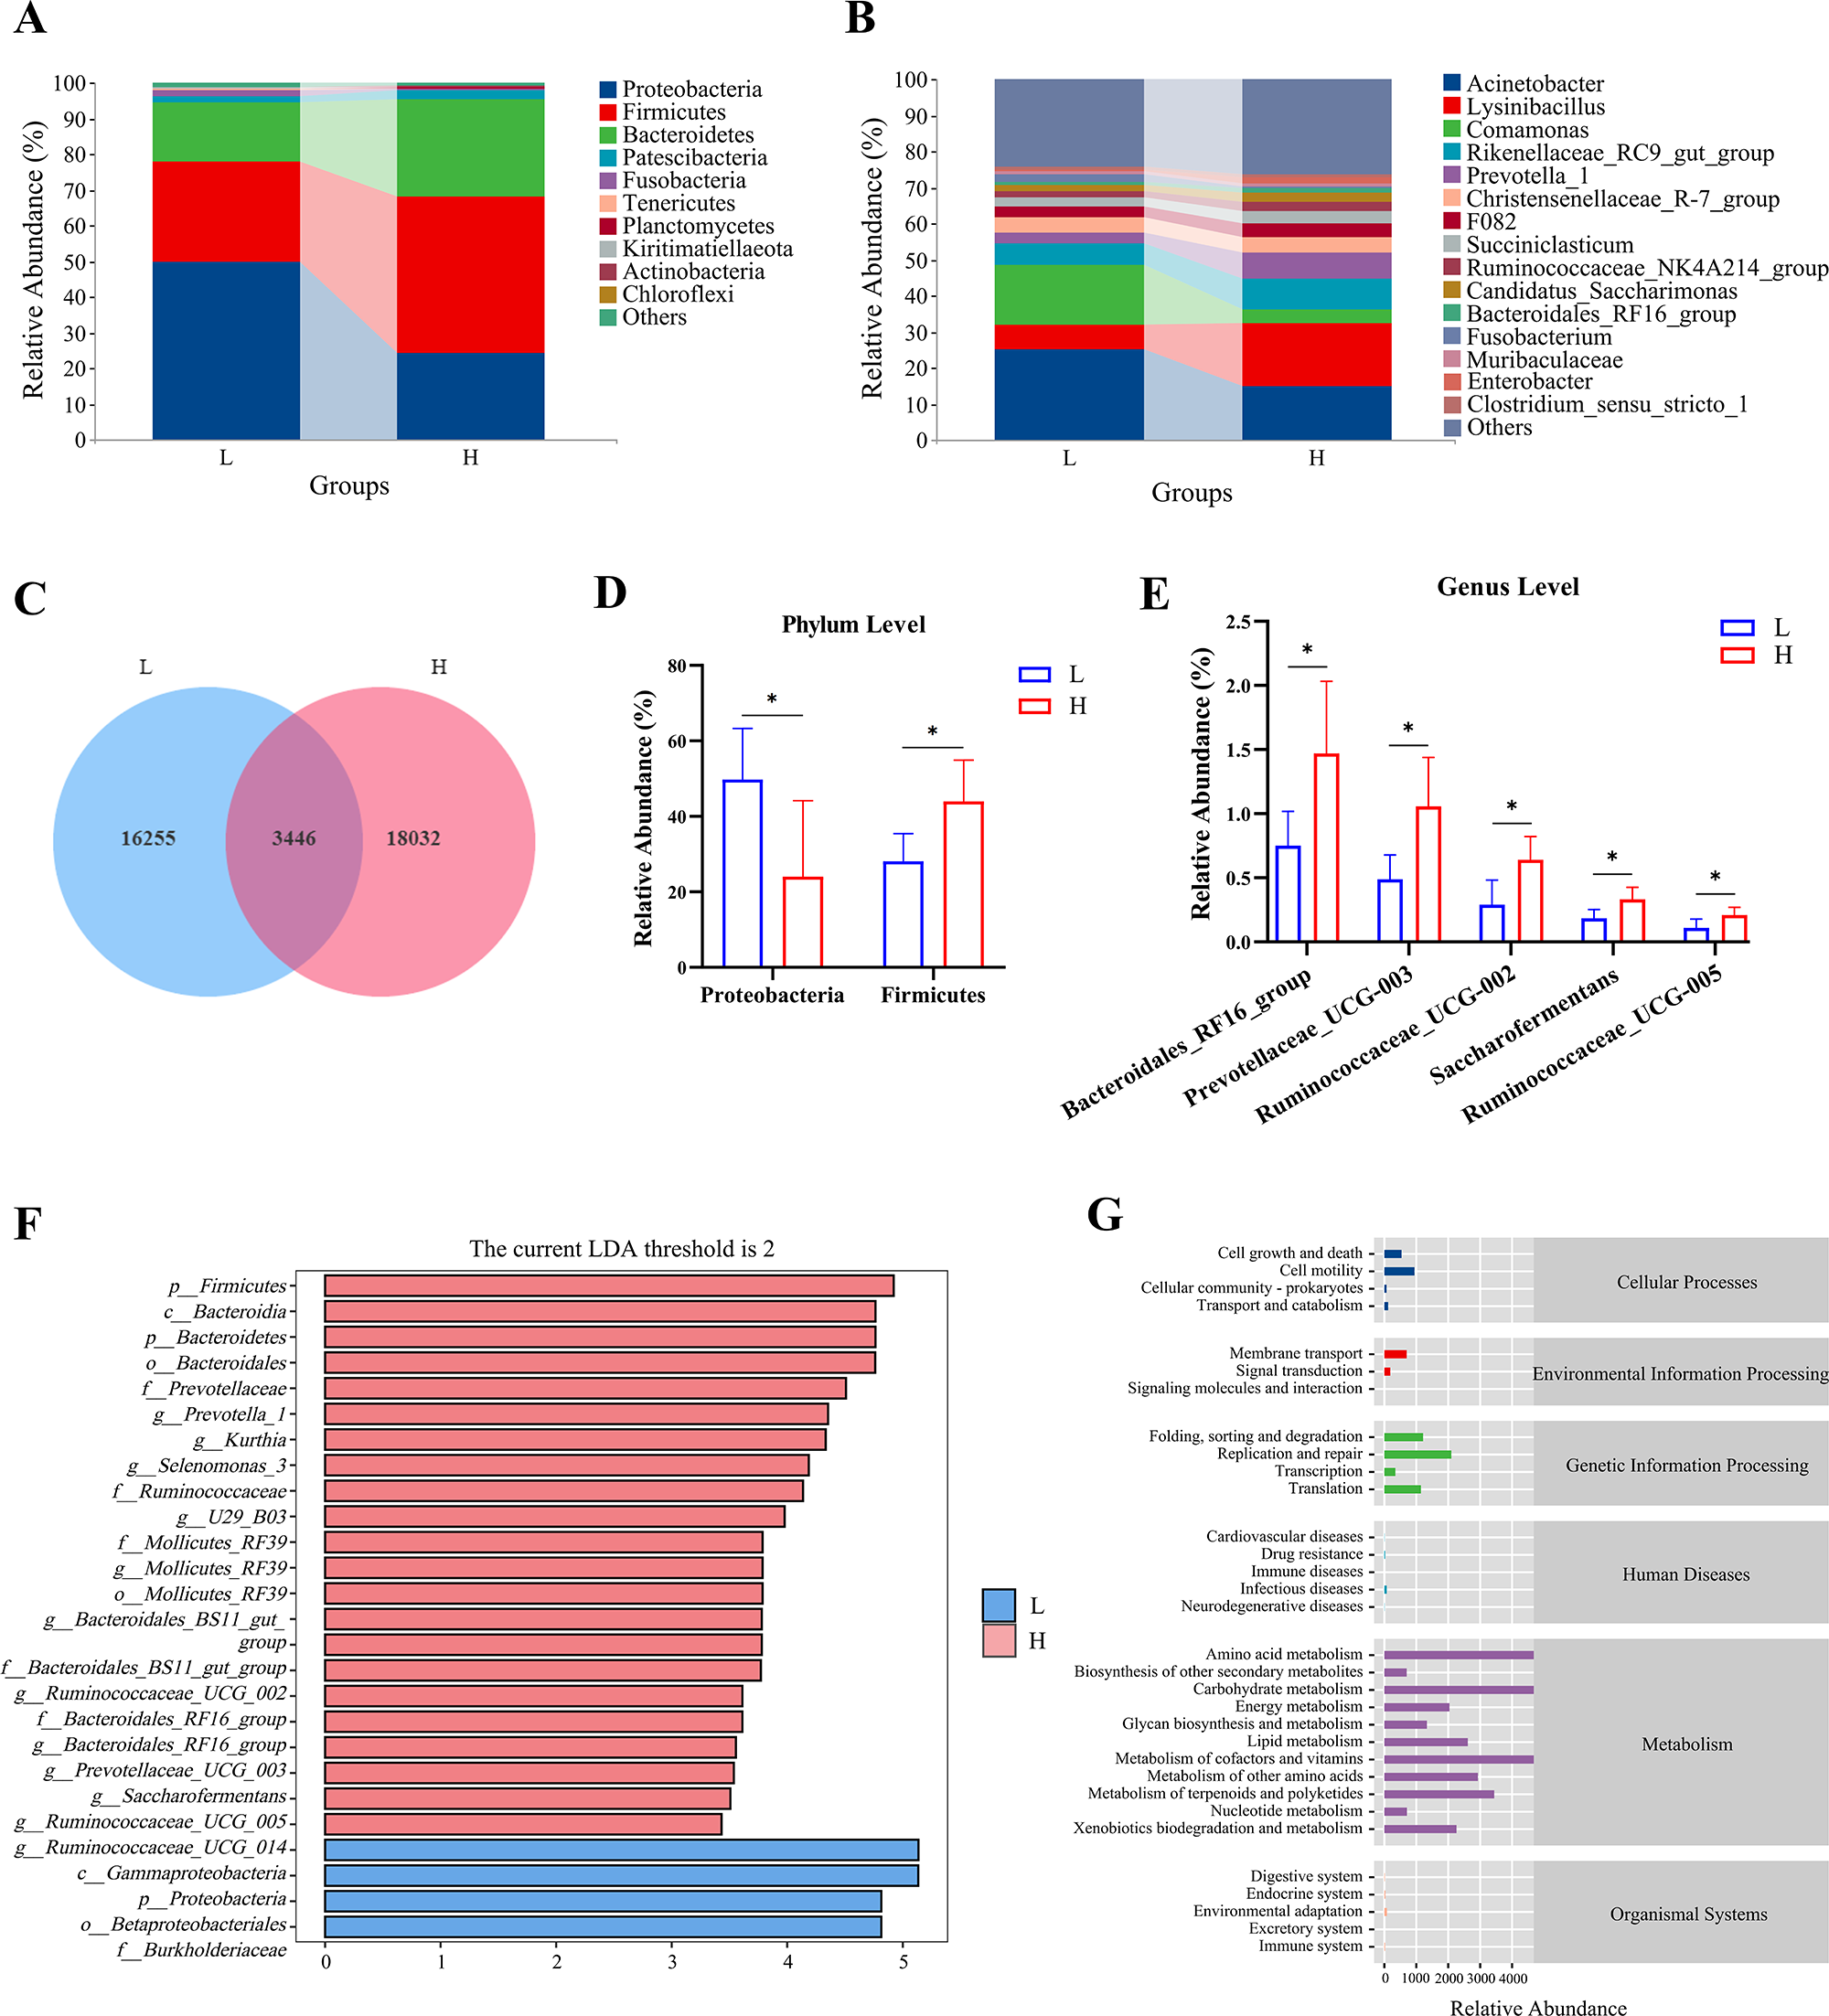
Figure 2. Rumen microbial composition of the l and h groups of dairy goats. (A) Composition and distribution of the l and h groups at the phylum level. (B) Composition and distribution of the l and h groups at the genus level. (C) Differential microbiota between the l and h groups. The differential microbiota on the phylum and (D) the genus levels (E) between the l and h groups according to student’s t-test. (F) the LEfSe analysis of the l and h groups. (G) PICRUSt function prediction based on KEGG database of the l and h groups.
Using LefSe analysis, non-parametric Kruskal–Wallis and Wilcoxon rank sum tests were combined with LDA score to screen for alterations in bacterial species (Fig. 2F). The H group had a major branch of microbiota that were enriched: Firmicutes, Bacteroidetes, Prevotella-1, Selenomonas_3, Ruminococcaceae, Bacteroides_BS11_gut_group, Ruminoccaceae_UCG-002, Bacteroides_RF16_group, Prevotellaceae_UCG-003, Saccharoferments, Ruminoccaceae_UCG-005 and Ruminoccaceae_UCG-014. In contrast, Gammaproteobacteria, Proteobacteria, Betaproteobacteriales and Burkholderiaceae were enriched in the L group. Combined with the results of Student’s t-test to determine differences in genera, Ruminococcaceae_UCG-005, Saccharoferments, Ruminococcaceae_UCG-002, Prevotellaceae_UCG-003 and Bacteroidales_RF16_group might be the key genera that contribute to high milk fat percentage in dairy goats. Functional potential predictive of microbiota in the rumen is shown in Fig. 2G. The relative abundance of pathways related to metabolism was high, mainly including amino acid metabolism, carbohydrate metabolism, metabolism of cofactors and vitamins and lipid metabolism.
Significantly different metabolites and metabolic pathways
Supervised partial least squares discriminant analysis (PLS-DA) was performed to analyze differences in metabolites between the L and the H group. Figure 3A and B highlights obvious separations between the H and L groups in both positive and negative ion modes. Individual samples in each group were clustered closely, indicating a significant separation of metabolites in the two groups. In the positive ion mode, the PLS-DA score graphs had an R 2Y = 0.998, Q 2Y = 0.725; in the negative ion mode, the PLS-DA score chart had an R 2Y = 0.992, Q 2Y = 0.433. Both R 2Y and Q 2Y of this model were greater than 0.5 and 0.4, indicating that the interpretation rate and prediction ability of the model were high.
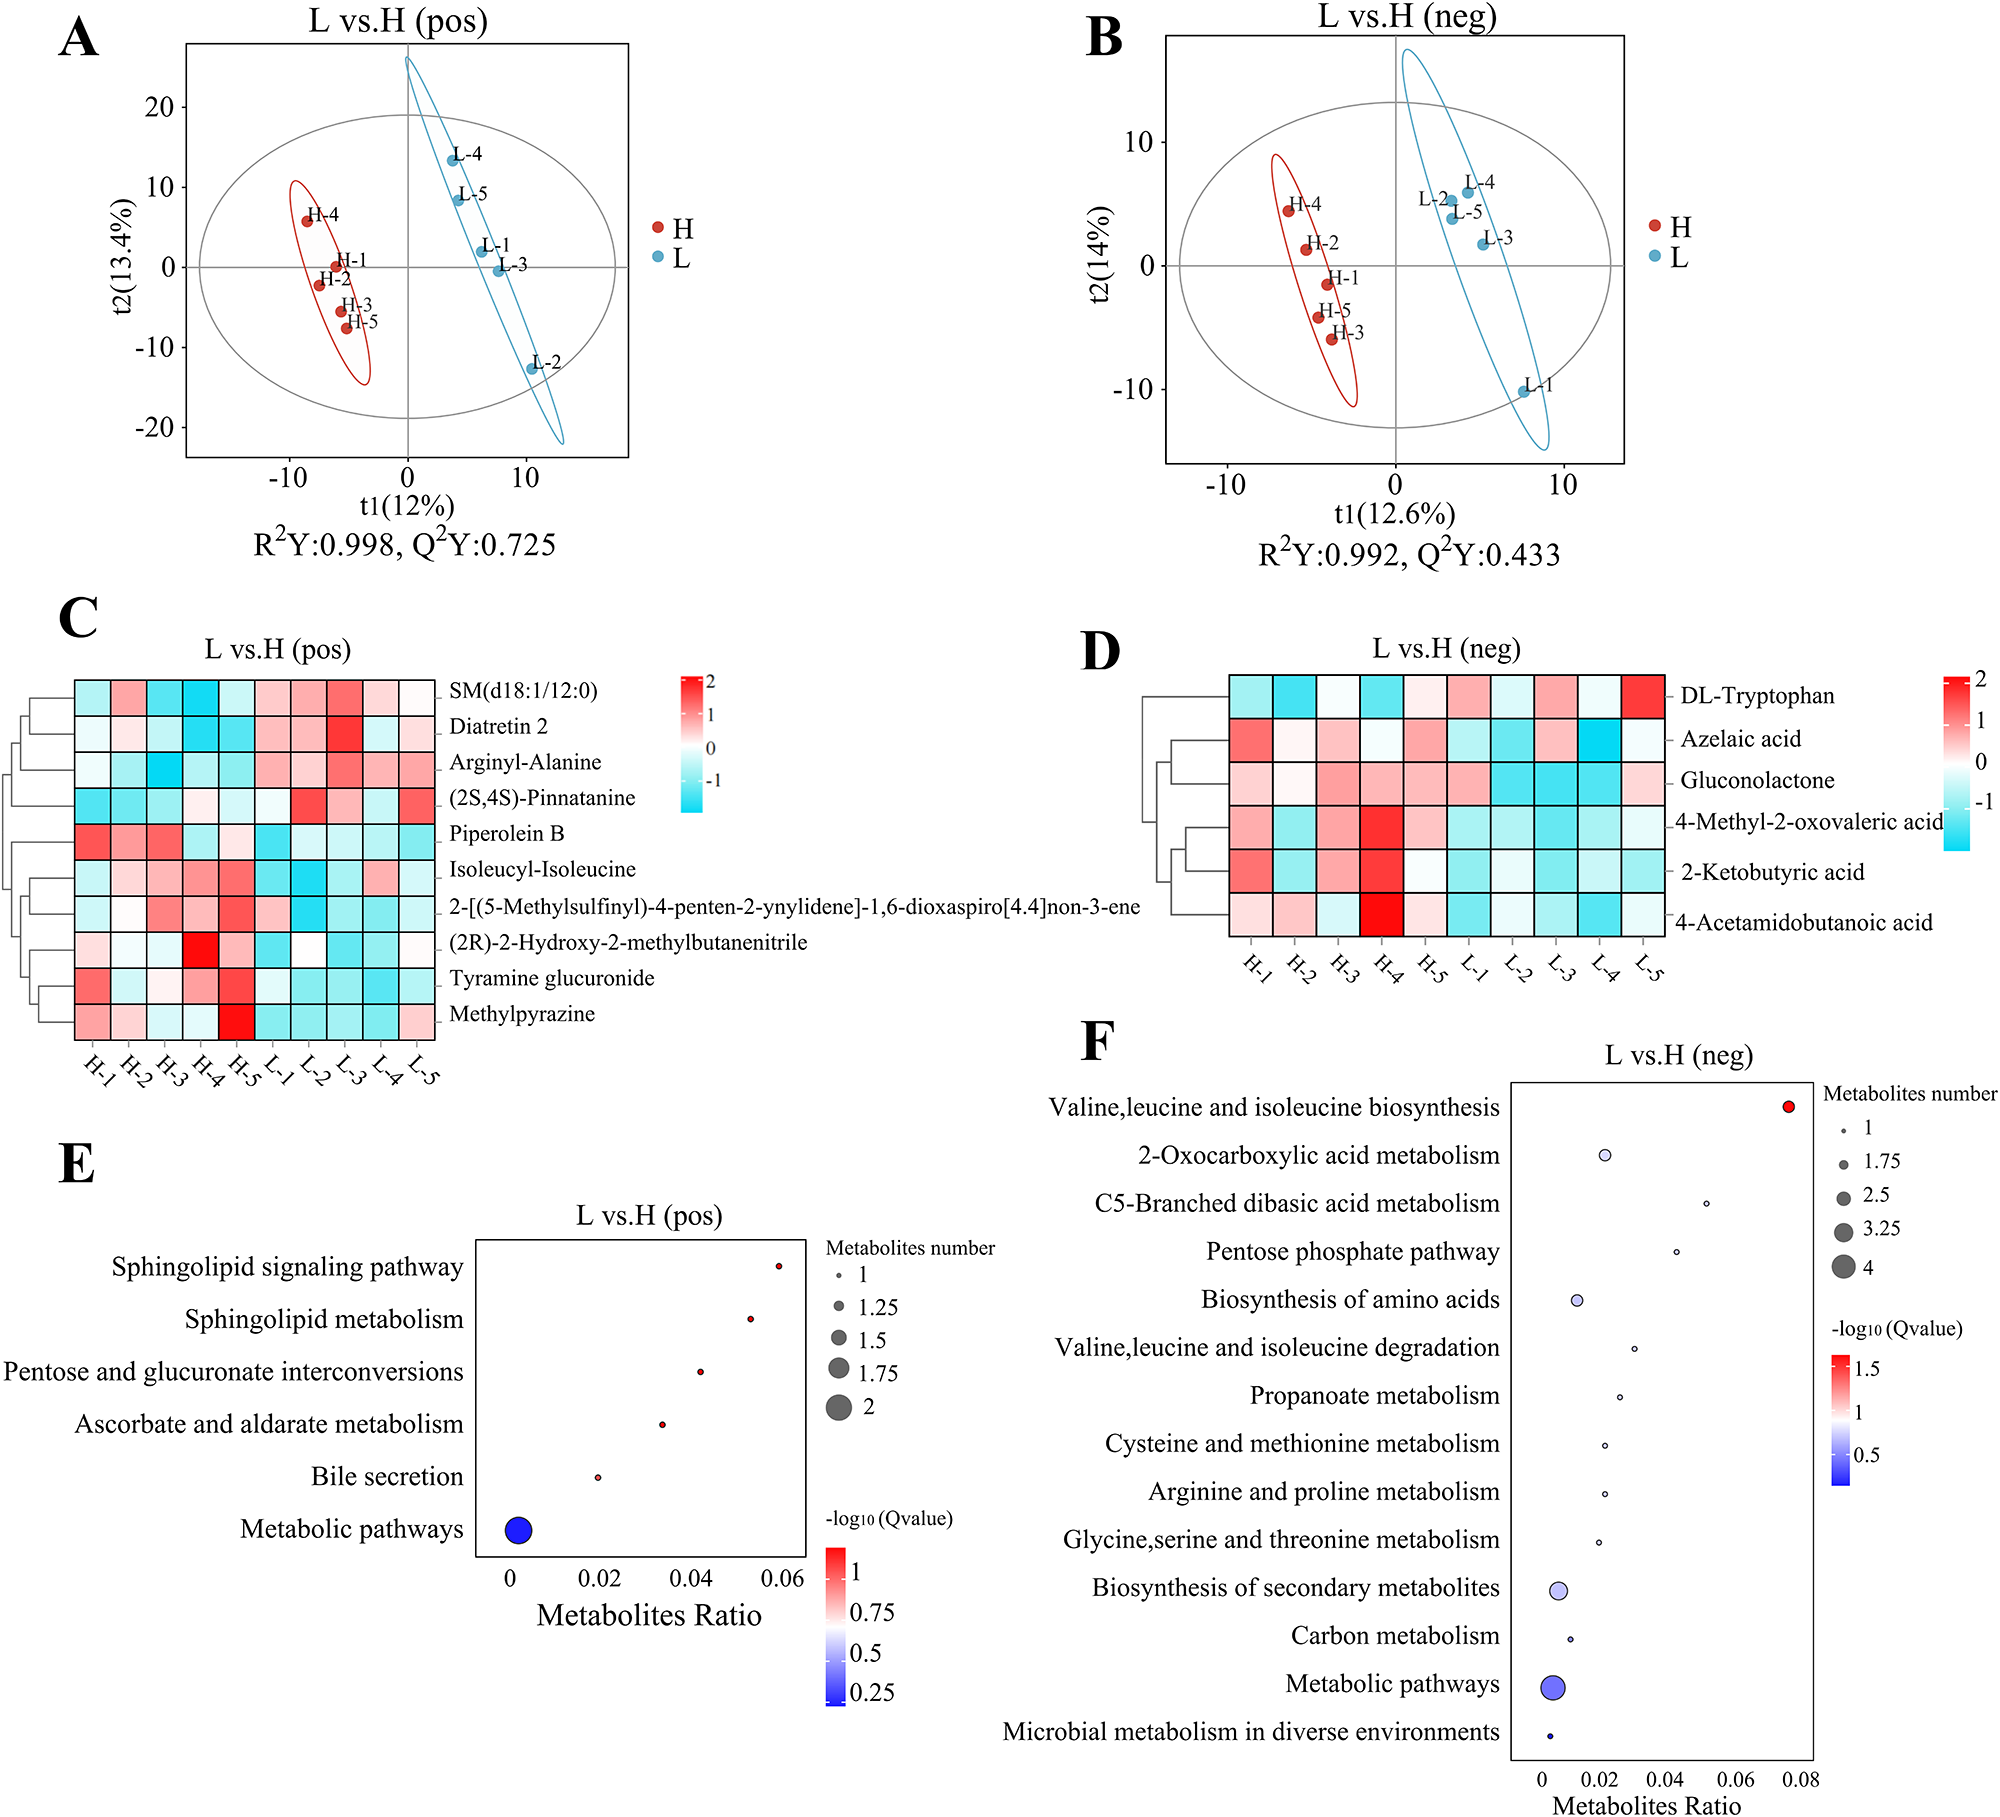
Figure 3. Significantly differential metabolites and metabolic pathways of differential metabolites of the l and h groups. (A, B) PLS-DA score graphs in positive and negative ion modes, respectively. (C, D) Duster heatmaps in positive and negative ion modes. (E, F) Bubble diagrams of KEGG enrichment in positive and negative ion modes.
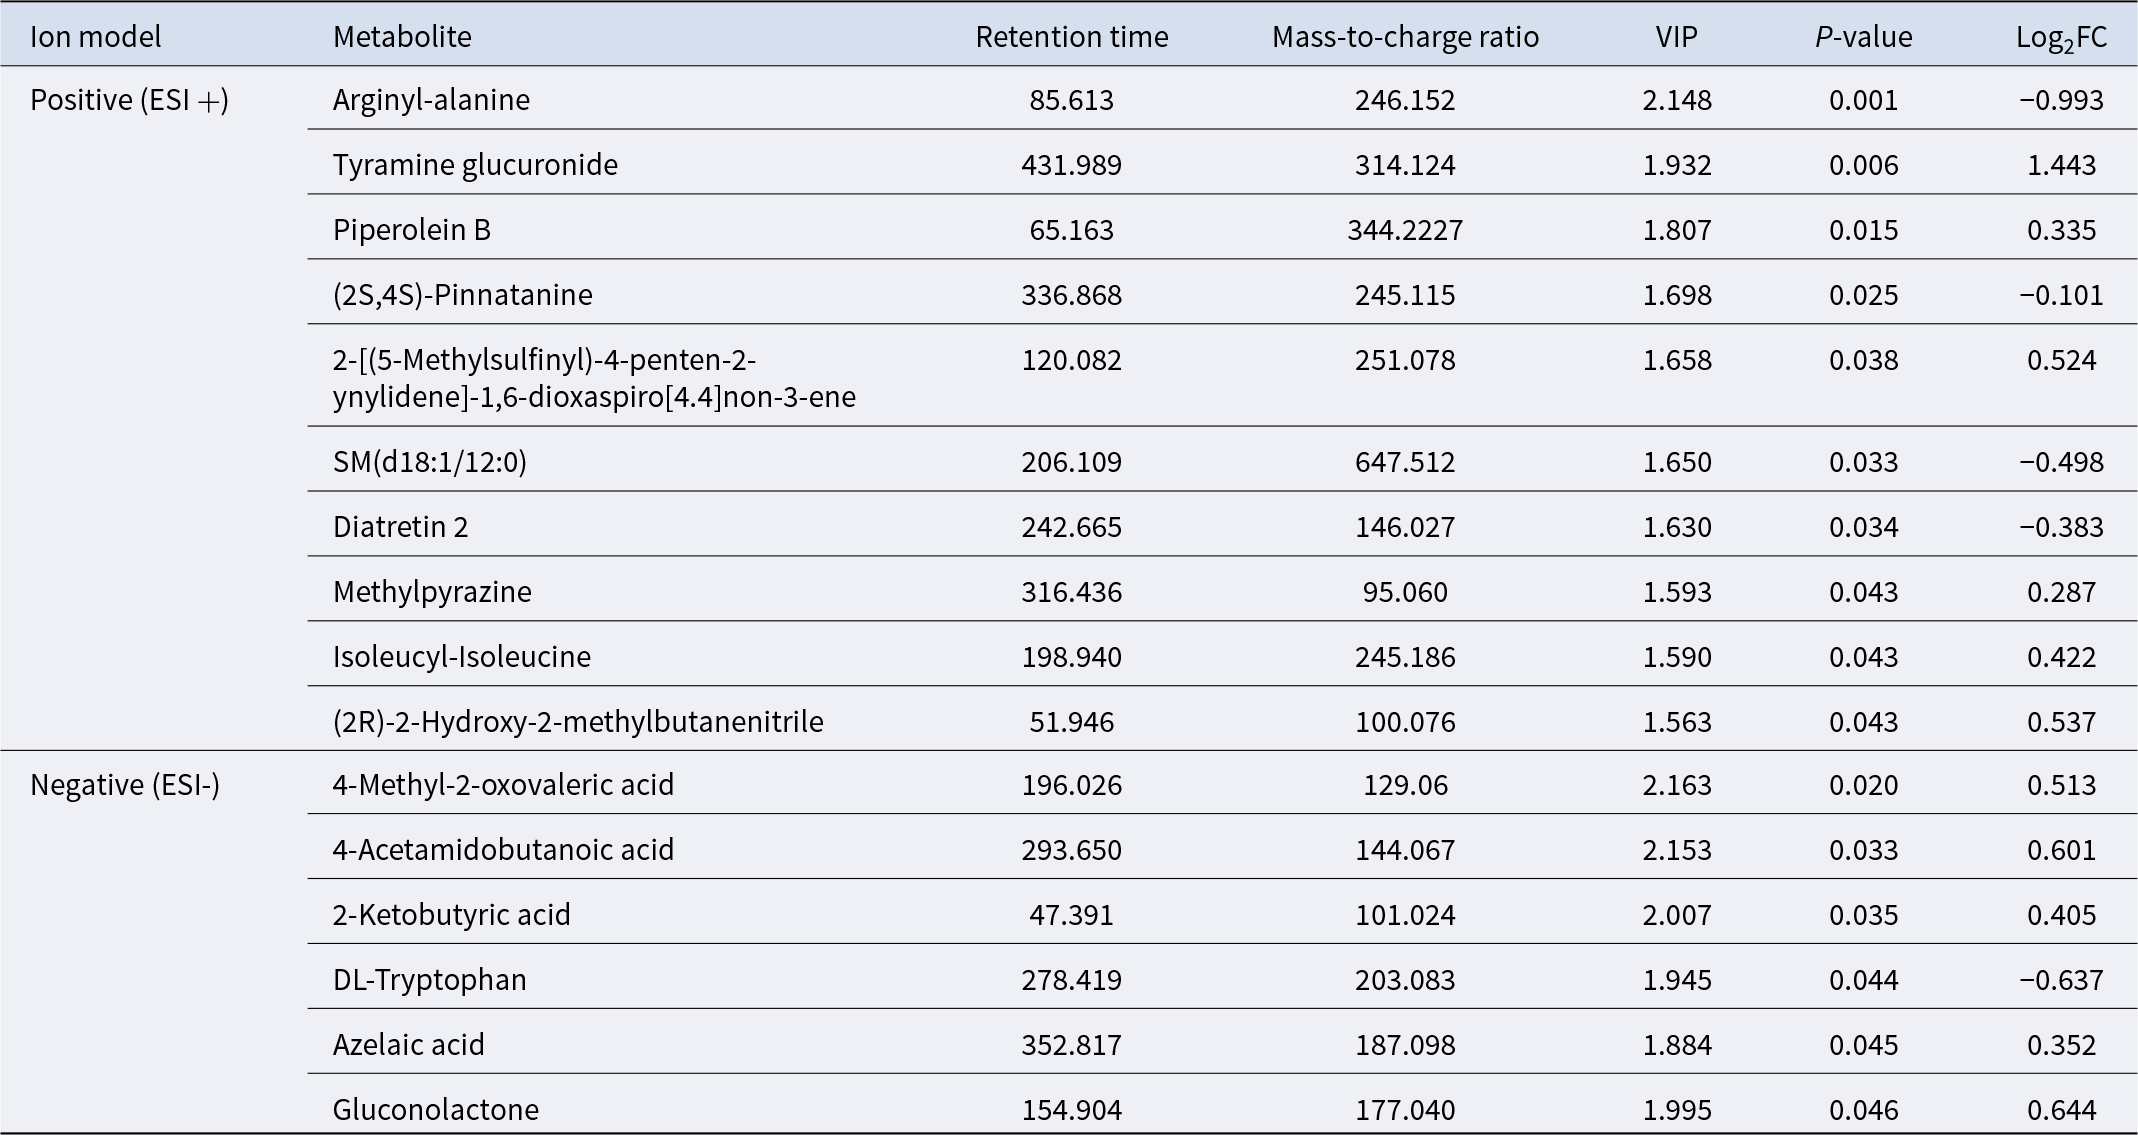
A total of 788 metabolites were identified in this study, including 557 in positive ion mode and 231 in negative ion mode. A total of 16 differentially altered metabolites were detected, including 10 in positive ion mode and 6 in negative ion mode (Table 4). The most abundant metabolites in the H group include mainly organic oxygen compounds (tyramine glucuronide, 2-[(5-methylsulfinyl)-4-penten-2-ynylidene]-1,6-dioxaspiro[4.4]non-3-ene, Gluconolactone), carboxylic acid and its derivatives (isoleucyl-isoleucine, 4-acetamidobutanoic acid), acetone acid and its derivatives (4-methyl-2-oxovaleric acid, 2-ketobutyric acid). The differential metabolites screened in positive and negative ion models were clustered and enriched. Figure 3C and D depicts the expression patterns of metabolites across all samples, with the data within each group forming tight clusters.
Table 4. LC–MS identification of significantly differential metabolites in group L and group H
The bubble diagrams of the KEGG enrichment in the positive ion modes (Fig. 3E) indicated that differentially altered metabolites were mainly enriched in the Sphingolipid signaling pathway, Sphingolipid metabolism, Pentose and glucuronate interconversions, Ascorbate and aldarate metabolism, and Bile secretion. The bubble diagrams of KEGG enrichment in the negative ion mode (Fig. 3F) revealed that differential metabolites were mainly enriched in Valine, leucine and isoleucine biosynthesis, 2-Oxocarboxylic acid metabolism, C5-branched dibasic acid metabolism, pentose phosphate pathway, pentose and glucuronate interconversions, biosynthesis of amino acids, propanoate metabolism, cysteine and methionine metabolism, arginine and proline metabolism, glycine, serine and threonine metabolism, biosynthesis of secondary metabolites and carbon metabolism.
Correlation analysis
As depicted in Fig. 4A, Spearman analysis indicated that ruminal fermentation parameters were correlated with lactation performance. Acetate and acetate to propionate ratio were significantly and positively correlated with milk fat percentage (P < 0.05). Figure 4B depicts how milk protein was positively correlated with the relative abundance of Saccharofermentans, Ruminococceaceae_UCG-014 and Ruminococceaceae_UCG-005 (P < 0.05). Acetate and acetate to propionate ratio were positively correlated with the relative abundance of Bacteroidales_RF16_group, Bacteroidales_BS11_gut_group, Prevotellaceae_UCG-003, Ruminococcaceae_UCG-014, Saccharofermentans, Ruminococceaceae_UCG-005 and Lachnospiraceae_NK3A20_group (P < 0.05), and negatively correlated with Streptococcus (P < 0.05). There was a significant positive correlation between valerate and Clostridium_sensu_stricto-1 (P < 0.05). Figure 4C depicts how ruminal fermentation parameters and lactation performance were correlated with serum differentially altered metabolites. There was a significant positive correlation between 4-acetamidobutanoic acid, tyramine glucuronide, azelaic acid and milk fat percentage (P < 0.05).
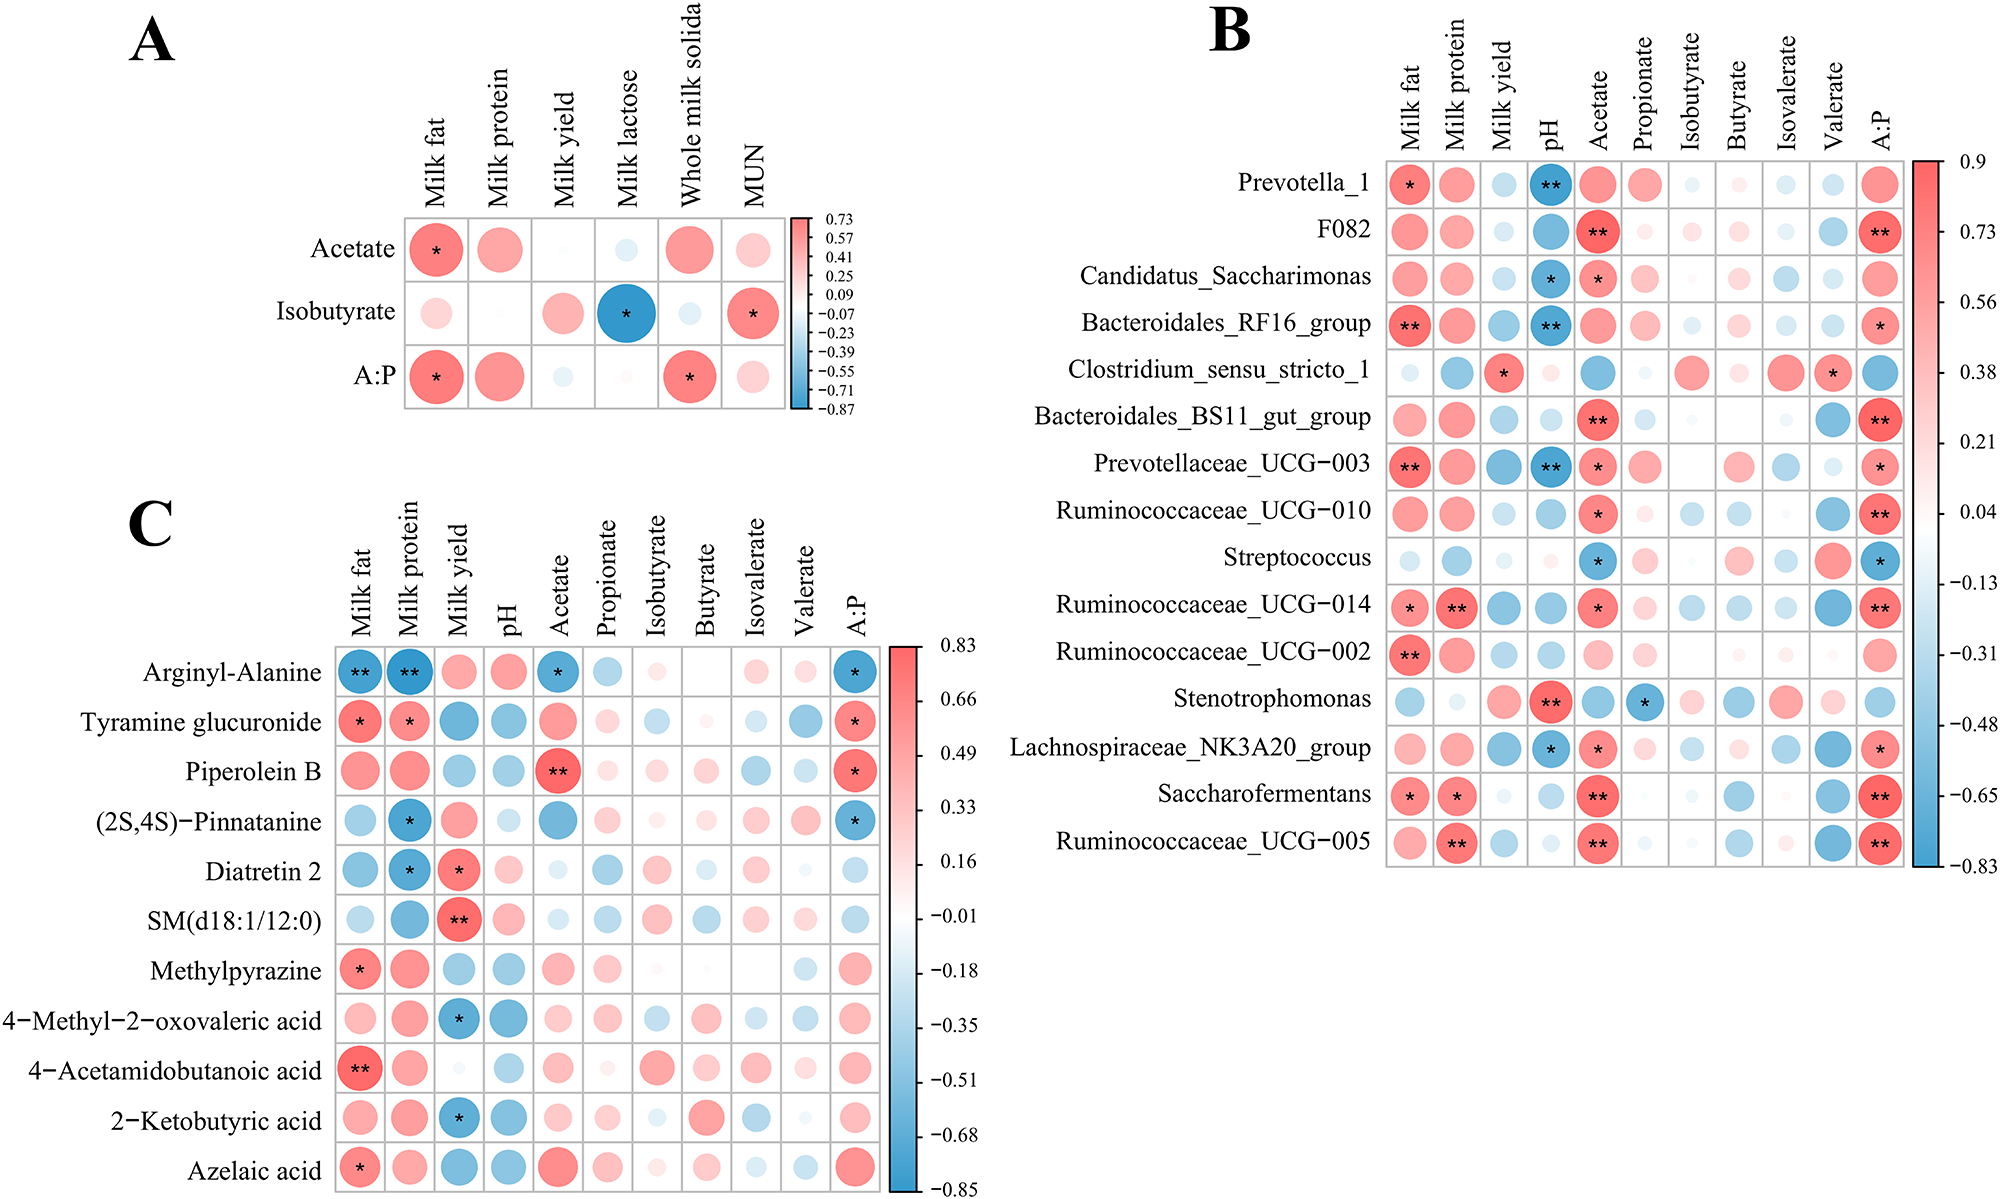
Figure 4. Heat map of correlation analysis of lactation performance and rumen fermentation parameters with rumen microbiota and serum differential metabolites in dairy goats. (A) Correlation analysis of lactation performance with rumen fermentation parameters. (B) Correlation analysis of lactation performance and rumen fermentation parameters with rumen microorganisms. (C) Correlation analysis of lactation performance and rumen fermentation parameters with serum differential metabolites. The correlation or difference with significance is represented as **P < 0.01, *P < 0.05.
Discussion
We investigated the association between ruminal microorganisms, serum metabolites and milk fat percentage in dairy goats under similar feeding conditions. Together, the data revealed the potential influence of ruminal microorganisms and serum metabolites on milk fat production (Zeineldin et al. Reference Zeineldin, Barakat, Elolimy, AZ, MM and JC2018; Zhang et al. Reference Zhang, Wang, Wang, Nan, Guo and Xiong2022). Although the role of acetate and butyrate as precursors for the de novo fatty acid synthesis in the mammary gland is well-known (Urrutia and Harvatine Reference Urrutia and Harvatine2017; Zhang et al. Reference Zhang, Bu, Liu, Huo, Xia, Pei and Liu2023b), recent evidence underscores their role as signaling molecules regulating fatty acid metabolism and milk fat composition and content in dairy cows (He et al. Reference He, Zhang, Shen, Niu, Tan, Chen, Zhao, Bai, Hao, Li and Zhang2020). For example, acetate promotes milk fat synthesis in part by activating acetyl-coenzyme A carboxylase α (ACACA) and fatty acid synthase (FASN) (Zhao et al. Reference Zhao, Guo, Yan, Shi and Sheng2021). Thus, in the present study, the higher content of acetate in ruminal fluid from the high milk fat group could have a dual impact, i.e., as a milk fat precursor to promote de novo synthesis or as an activator of ACACA. These data agree with a recent study where the ruminal acetate to propionate ratio was an important index reflecting microbial community structure (Zhang et al. Reference Zhang, Shen, Zhang and Mao2023c). Although we did not measure individual dry matter intake, the similar milk yield between the H and L groups suggests that the observed differences in acetate, acetate to propionate ratio, total VFA and milk fat percentage can be attributed to variations in microbial diversity. Specifically, the greater relative abundance of fiber-degrading beneficial bacteria in the H group likely explains these differences.
Previous studies have explored factors influencing milk fat content and have indirectly confirmed a strong correlation among ruminal microorganisms, milk fat precursors and milk fat content (Jami et al. Reference Jami, White and Mizrahi2014). For instance, Zhongdian yak cows with higher milk fat percentages had higher abundances of Firmicutes and Proteobacteria, these bacteria were involved in the biosynthesis of unsaturated fatty acids and amino acids, and the elevated gut metabolites in high milk fat percentage Zhongdian yak cows were mainly enriched in lipid and amino acid metabolism, leading to greater efficiency in converting energy to milk fat (Liu et al. Reference Liu, Wu, Chen, Zhou, Guo, Shi and Zhang2022b). Furthermore, studies on dairy cows with milk fat depression (MFD) revealed significant changes in the relative abundance of ruminal microorganisms. Pitta et al. (Reference Pitta, Indugu, Vecchiarelli, Hennessy, Baldin and Harvatine2020) reported that supplemental 2-hydroxy-4-(methylthio)-butanoic acid (HMTBa) alleviated MFD in high-producing cows fed MFD diets, and observed differences in Dialister, Lachnospira, Megasphaera and Sharpea when feeding HMTBa and the control diet during MFD, these bacteria were positively associated with the trans-10 isomer of FA, highlighting a correlation between rumen microbes and milk fat percentage (Pitta et al. Reference Pitta, Indugu, Vecchiarelli, Hennessy, Baldin and Harvatine2020).
The synthesis of milk fat in the mammary gland relies on the degradation of fiber by ruminal microorganisms (Stojanov et al. Reference Stojanov, Berlec and Štrukelj2020) such as Bacteroidetes (Comtet-Marre et al. Reference Comtet-Marre, Parisot, Lepercq, Chaucheyras-Durand, Mosoni, Peyretaillade, AR, KJ, Peyret and Forano2017) and Ruminococcaceae (Wang et al. Reference Wang, Ma, Diao and Tu2019a). The latter, which were greater in the H group, is the most abundant genus in the Firmicutes family and members of Ruminococcaceae can degrade plant cellulose and hemicellulose, producing VFA such as acetate, propionate and butyrate. Ruminococcaceae and Bacteroidota (Guo et al. Reference Guo, Yu, Tian, Zhao, Zhang, Chen and Zhai2021; Liu et al. Reference Liu, Zhao, Zhang, Wang, Yuan, Zhao and Wang2023) also contribute to intestinal barrier function, immune regulation and overall homeostasis (Kong et al. Reference Kong, Hua, Zeng, Ning, Li and Zhao2016). Subtypes of Ruminococcaceae, including Ruminococcaceae_UCG-010, Ruminococcaceae_UCG-014 and Ruminococcaceae_UCG-005, possess VFA-producing capabilities and further enhance intestinal barrier function and immune regulation. Wang et al. (Reference Wang, Nan, Zhao, Wang, Jiang and Xiong2021) reported that supplementing partially protected glucose can inhibit the release of inflammatory and cytotoxic factors by increasing the abundance of Ruminococcaceae, thereby helping to maintain environment stability in the rumen (Wang et al. Reference Wang, Nan, Zhao, Wang, Jiang and Xiong2021). Together, it is likely that greater abundance of Ruminococcaceae and Bacteroidetes in the H group contributed to the greater milk fat percentage.
Xue et al. (Reference Xue, Sun, Wu, JX and LL2020) reported that Prevotella content in the rumen of dairy cows with high milk fat percentage was greater and positively correlated with VFA content (Xue et al. Reference Xue, Sun, Wu, JX and LL2020). Observed a positive correlation between Saccharofermentans and acetic acid, butyric acid and milk fat content (Liu et al. Reference Liu, Xiao, Pu, Xu, Wang, Mao, Hong, Qu and Xue2022a). Gu et al. (Reference Guo, Yu, Tian, Zhao, Zhang, Chen and Zhai2021) reported that feeding rumen-protected methionine to dairy cows promoted the production of α-ketoglutarate by Acetobacter and Saccharofermentan in the rumen and was associated with greater milk fat production (Gu et al. Reference Gu, Liang, Zhu, Liu and Sun2021). It is noteworthy that certain Firmicutes genera, including Ruminococcaceae and Saccharofermentans exhibited a positive correlation with acetate proportion (Schären et al. Reference Schären, Frahm, Kersten, Meyer, Hummel, Breves and Dänicke2018). Song et al. (Reference Song, Malmuthuge, Steele and Guan2018) revealed a mutually beneficial relationship between acetate and other short-chain fatty acids and ruminal microorganisms, where acetate promoted the growth of beneficial bacteria, and the growth of these bacteria stimulated acetate synthesis (Song et al. Reference Song, Malmuthuge, Steele and Guan2018). Thus, the fact that correlations between Ruminococcaceae_UCG-005, Ruminococcaceae_UCG-002 and Saccharofermentans and milk fat percentage were positive suggested that greater acetate production in rumen of the H group could partly account for differences in milk fat percentage.
The mammary gland efficiently obtains nutrients from the blood to support lactation, with some directly released into milk while others serve as precursors for milk components. Through serum metabolomics analyses, Wu et al. (Reference Wu, Sun, Xue, Wang, LL and Liu2018) uncovered potential biomarkers affecting milk protein production in dairy cows (Wu et al. Reference Wu, Sun, Xue, Wang, LL and Liu2018). In our study, the differentially altered metabolites between groups were mainly associated with amino acid synthesis and sphingolipid metabolism. The Sphingomyelin SM(d18:1/12:0) is implicated in the sphingolipid signaling pathway and sphingolipid metabolic pathway, and its low content in the serum of high milk fat dairy goats may indicate that more sphingomyelin was used by peripheral tissues. Whether circulating sphingomyelin is taken up by the mammary gland and the extent to which it may regulate milk fat synthesis is unknown. Sphingolipids are a class of lipids with several functions including stabilization of the membrane structure and cell-to-cell recognition and signaling (Humer et al. Reference Humer, Khol-Parisini, Metzler-Zebeli, Gruber and Zebeli2016; Thangaraj et al. Reference Thangaraj, Ghnenis, Pallas, AK, Gregg and Padmanabhan2024). Humer et al. (Reference Humer, Khol-Parisini, Metzler-Zebeli, Gruber and Zebeli2016) observed that more than half of the detected sphingomyelin in blood increased in cows experiencing high lipomobilization (Humer et al. Reference Humer, Khol-Parisini, Metzler-Zebeli, Gruber and Zebeli2016). Hanamatsu et al. (Reference Hanamatsu, Ohnishi, Sakai, Yuyama, Mitsutake, Takeda, Hashino and Igarashi2014) observed elevated levels of serum sphingomyelin in obese humans and found close correlations with the parameters of obesity, insulin resistance and lipid metabolism (Hanamatsu et al. Reference Hanamatsu, Ohnishi, Sakai, Yuyama, Mitsutake, Takeda, Hashino and Igarashi2014).
We found a potential correlation between azelaic acid and milk fat percentage. Azelaic acid is a nine-carbon linear saturated aliphatic dicarboxylic acid, it is the final product of linoleic acid peroxide decomposition and it possesses various beneficial properties, including anti-inflammatory, antioxidant and immune regulation (Liao et al. Reference Liao, Wu, Luo, Chen, Huang, Ma, Zhang, Wang, Yang, Deng and Wang2023; Litvinov et al. Reference Litvinov, Selvarajan, Garelnabi, Brophy and Parthasarathy2010). Previous studies have confirmed its ability to scavenge reactive oxygen species (ROS) and inhibit their production (Passi et al. Reference Passi, Picardo, Zompetta, CD, AS and Nazzaro-porro1991). Wu et al. (Reference Wu, Hwang, Jia, Choi, YJ, Choi, Pathiraja, IG, SH and Lee2017) discovered that azelaic acid acted as an ectopic olfactory receptor 544 ligand, which specifically induced PKA-dependent lipolysis in adipocytes and promotes fatty acid oxidation and ketogenesis in the liver (Wu et al. Reference Wu, Hwang, Jia, Choi, YJ, Choi, Pathiraja, IG, SH and Lee2017). At present, further investigation is needed to understand how azelaic acid affects milk fat production during lactation.
Recent studies have reported that enhanced post-ruminal supply of certain amino acids can increase the concentration of milk fat synthesis precursors in the circulation or enhance their uptake by mammary tissue (Li et al. Reference Li, Zhou, Li, Yu, Li and Gao2019b; Wang et al. Reference Wang, Shi, Wang, Wang, Cao and Li2019). In non-ruminants, there is a link between excess levels of circulating amino acids and lipid metabolism, with high arginine, leucine, isoleucine and valine all being linked with obesity, insulin resistance and lipid levels (Park et al. Reference Park, Sadanala and Kim2015). Whether the ruminant diverts amino acids for the synthesis of milk fat is unknown, but based on non-ruminant data it cannot be ignored. For example, numerous studies have demonstrated that amino acids can regulate the ability of mammary epithelial cells to synthesize milk (Li et al. Reference Li, Yu, Zhou, Qi, Wen, Hou, Li and Gao2018; Qi et al. Reference Qi, Meng, Jin, Li, Li and Gao2018) and activate the mammalian target of rapamycin (mTOR) signaling pathway (Wang et al. Reference Wang, Shi, Wang, Wang, Cao and Li2019). mTOR is a critical pathway for the regulation of milk protein synthesis (Arriola Apelo et al. Reference Arriola Apelo, Singer, Lin, ML, NR and Hanigan2014) and is also involved in regulating milk fat synthesis (Caron et al. Reference Caron, Richard and Laplante2015; Zhao et al. Reference Zhao, Guo, Yan, Shi and Sheng2021). It remains unclear, however, to what degree and under what physiological conditions the use of amino acids for milk fat synthesis is quantitatively important.
Our finding that several differentially altered metabolites were mainly enriched in amino acid metabolism pathways, e.g., valine, leucine, isoleucine metabolism and arginine metabolism, highlighted a potential role in the milk fat synthesis process. For example, Research has found that leucine regulates milk fat synthesis by stimulating the CRTC2-SREBP1 pathway (Li et al. Reference Li, Zhou, Li, Yu, Li and Gao2019b). Arginine has been reported to stimulate milk fat production in non-ruminant mammals. Holanda et al. (Reference Holanda, Marcolla, Guimarães, MM, GJ, MS, ML and Saraiva2019) reported greater vascularity in the mammary gland of lactating sow fed increased levels of Arg (Holanda et al. Reference Holanda, Marcolla, Guimarães, MM, GJ, MS, ML and Saraiva2019). A greater rate of blood flow to the mammary gland could increase the delivery and uptake of substrates necessary for milk synthesis (Cai et al. Reference Cai, Wang and Liu2018; Madsen et al. Reference Madsen, Cieslar, Trout, MO and Cant2015). Hopkins et al. (Reference Hopkins, Rakes, Daniel, Zimmerman and Croom1994) demonstrated that intraperitoneal infusion of an amino acid solution containing Arg alleviated the decrease in milk fat production induced by feeding low fiber diets to cows (Hopkins et al. Reference Hopkins, Rakes, Daniel, Zimmerman and Croom1994). Supplementation with N-carbamoyl glutamate, an activator of Arg synthesis, increased milk fat production during mid-lactation without affecting milk yield (Gu et al. Reference Gu, Liang, Wei, CP, HY, JX and Wang2018). Ding et al. (Reference Ding, Shen, Jawad, Wu, SK, Wang, Chen and Blache2022) observed that intravenous infusion of Arg enhanced the production of milk fat by promoting de novo synthesis of FA and increasing milk yield (Ding et al. Reference Ding, Shen, Jawad, Wu, SK, Wang, Chen and Blache2022). The effect of Arg on fatty acid metabolism may be related to activation of the AMPK pathway (Carrasco-Chaumel et al. Reference Carrasco-Chaumel, Roselló-Catafau, Bartrons, Franco-Gou, Xaus, Casillas, Gelpí, Rodés and Peralta2005). Thus, although the precise mechanisms are unknown, the data suggests a potential role of certain amino acids in milk fat synthesis.
Among the differentially altered metabolites in the H group, 4-Acetamidobutanoic acid and 2-Ketobutyric acid could exert an indirect impact on milk fat percentage. 4-Acetamidobutanoic acid, an intermediate in arginine and proline metabolism, has antioxidant effects and antibacterial activity, both of which could benefit mammary function (Pang et al. Reference Pang, Chai, Yang, Wang, Liu and Wang2022; Xing et al. Reference Xing, Mi, Chen, JX and XD2020). L-Tryptophan and its metabolites such as kynuuric acid and 5-hydroxytryptophan can protect tissues from oxidative damage and are involved in the body’s energy metabolism, glucose and lipid metabolism, and inflammation regulation and are closely associated with tryptophan metabolism, protein synthesis and fat metabolism (Liu et al. Reference Liu, Yuan, Zhang, YR, SM, JH and Xia2015; Miao et al. Reference Miao, Adewole, Liu, Xi, Yang and Yin2019). In high milk fat percentage dairy goats, the downregulation of DL-tryptophan may indicate enhanced anti-inflammatory and antioxidant capabilities. Although the correlation analysis between differentially altered metabolites in serum and milk fat percentage offers some clues, the lack of serum amino acid concentrations and their arterio-venous differences pose limitations for data interpretation. Thus, the underlying mechanism through which these distinct metabolites influence milk fat percentage in dairy goats would have to be studied in the future.
Conclusions
Compared with low milk fat percentage dairy goats, high milk fat percentage dairy goats had abundant beneficial bacteria including fiber-degrading bacteria, which could promote fiber degradation, increase the concentration of VFA such as acetate and the acetate to propionate ratio in the rumen and promote milk fat synthesis. Several metabolites and pathways associated with phospholipid metabolism seem to be important for the regulation of milk fat synthesis.
Acknowledgements
This work was supported by the National Natural Science Foundation of China (grant U2004159 and 31702100).
Author contributions
M.L. and H.X. designed the experiments. P.K., D.Y. and X.X. contributed to sample collection. H.N., G.D., P.D. and H.C. analyzed the data. H.N. wrote the paper. H.X., Z.C., M.U. and J.J.L. revised the paper.
Financial support
The authors declare no competing interest.
Conflicts of interest
The authors declare no competing interest.


 Open access