


Introduction
About 2% of all known insects have aquatic life stages (Lévêque et al. Reference Lévêque, Balian and Martens2005). Most of these species spend much of their life under water, surviving as terrestrial adults for a short period, primarily for reproduction. When such amphibiotic insects emerge from aquatic environments, they undergo ecdysis, the shedding of the larval exoskeleton and the formation of the final adult stage (Cheong et al. Reference Cheong, Huang, Bendena, Tobe and Hui2015). Insect orders in which all or many species are amphibiotic include Ephemeroptera, Plecoptera, Trichoptera, Odonata, Megaloptera, and Diptera (Barber-James et al. Reference Barber-James, Gattolliat, Sartori and Hubbard2008; Cover and Resh Reference Cover and Resh2008; Ferrington Reference Ferrington2008; Fochetti and Tierno de Figueroa Reference Fochetti and Tierno de Figueroa2008; Kalkman et al. Reference Kalkman, Clausnitzer, Dijkstra, Orr, Paulson and Tol2008; Moor and Ivanov Reference Moor and Ivanov2008). Despite representing a small subset of all insects, these orders make up a large proportion of the diversity of the freshwater benthos (Balian et al. Reference Balian, Segers, Lévêque and Martens2008). Other highly diverse orders such as Hemiptera, Lepidoptera, Coleoptera, and Hymenoptera are primarily terrestrial but contain some amphibiotic species (Bennett Reference Bennett2008; Mey and Speidel Reference Mey and Speidel2008; Polhemus and Polhemus Reference Polhemus and Polhemus2008).
The study of amphibiotic emergence is crucial for conservation of both insects and freshwater habitats. This area of research is becoming increasingly important because freshwater habitats have been ranked among the most threatened ecosystems worldwide (Reid et al. Reference Reid, Carlson, Creed, Eliason, Gell and Johnson2019; Albert et al. Reference Albert, Destouni, Duke-Sylvester, Magurran, Oberdorff and Reis2021; Sayer et al. Reference Sayer, Fernando, Jimenez, Macfarlane, Rapacciuolo and Böhm2025). Furthermore, as climate change and urbanisation increase, emergence times become more variable (Perkin and Wilson Reference Perkin and Wilson2021; Finn et al. Reference Finn, Johnson, Gerth, Arismendi and Li2022). Ideally, the study of amphibiotic insects and their response to anthropogenic change should go beyond diversity assessments because the transition of amphibiotic insects from aquatic to terrestrial ecosystems contributes to ecosystem-level diversity through trophic cascades (Hunter and Price Reference Hunter and Price1992; Kagata and Ohgushi Reference Kagata and Ohgushi2006). As adults, amphibiotic insects transfer mass and energy from aquatic to terrestrial environments (Bartels et al. Reference Bartels, Cucherousset, Steger, Eklöv, Tranvik and Hillebrand2012). Many terrestrial vertebrate species rely on insect emergence for a substantial portion of their diet (Murakami and Nakano Reference Murakami and Nakano2002; Sabo and Power Reference Sabo and Power2002; Salvarina et al. Reference Salvarina, Gravier and Rothhaupt2018; Recalde et al. Reference Recalde, Breviglieri, Kersch-Becker and Romero2021). Decreases in amphibiotic insect abundance or diversity disrupt typical food webs, inevitably causing declines in terrestrial arthropod populations (Recalde et al. Reference Recalde, Breviglieri and Romero2020). Tracking emergence times can help ecologists and conservationists understand the changes in freshwater ecosystem dynamics. Despite this, many methodological limitations remain in the study of amphibiotic insect emergence.
The study of insect emergence typically involves pyramidal traps, which collect adult insects as they emerge from the water column (Mundie Reference Mundie1956). These traps cover only a small portion of the water’s surface, catching insects as they undergo ecdysis. Although this method is effective, it has drawbacks: it impacts insect populations and may be prohibited or logistically challenging in protected areas or in conjunction with research on protected species (McDonald and Simon Reference McDonald and Simon2023). An ongoing movement to transition to noninvasive research methods, which have reduced impacts on study populations (Beja-Pereira et al. Reference Beja-Pereira, Oliveira, Alves, Schwartz and Luikart2009; Zemanova Reference Zemanova2020), encourages the shift away from such traps. In addition, with increased evidence of advanced nervous systems and pain reception in insects, the discussion of insect welfare is becoming increasingly important when conducting research (Crump et al. Reference Crump, Gibbons, Barrett, Birch and Chittka2023). A noninvasive alternative for studying emergence involves the gathering of exuviae from the water’s surface, but typically, this method has only been used in the study of specific taxonomic groups for which exuviae retain morphological traits that permit taxonomic identification (Hadjoudj et al. Reference Hadjoudj, Khelifa, Guebailia, Amari, Hadjadji and Zebsa2014; Arpellino et al. Reference Arpellino, Catanzaro, Montalto, Siri and Donato2022). Most studies using either emergence traps or exuviae collection identify taxa using traditional taxonomic keys. This can be time-consuming and, given the limited number of characteristic traits of exuviae, unreliable. An alternative is DNA barcoding (Hebert et al. Reference Hebert, Cywinska, Ball and deWaard2003) and its extension for community samples, DNA metabarcoding (Hajibabaei et al. Reference Hajibabaei, Shokralla, Zhou, Singer and Baird2011; Taberlet et al. Reference Taberlet, Coissac, Pompanon, Brochmann and Willerslev2012; Porter and Hajibabaei Reference Porter and Hajibabaei2018). In particular, DNA metabarcoding has been applied successfully to bulk arthropod samples with trace amounts of DNA (Elbrecht et al. Reference Elbrecht, Vamos, Meissner, Aroviita and Leese2017, Reference Elbrecht, Lindner, Manerus and Steinke2021; Ritter et al. Reference Ritter, Häggqvist, Karlsson, Sääksjärvi, Muasya, Nilsson and Antonelli2019; Ruppert et al. Reference Ruppert, Kline and Rahman2019; Steinke et al. Reference Steinke, deWaard, Sones, Ivanova, Prosser and Perez2022).
The application of DNA analysis to insect exuviae has been used for terrestrial groups such as cicadas, butterflies, beetles, and tarantulas (Feinstein Reference Feinstein2004; Petersen et al. Reference Petersen, Mason, Akber, West, White and Wilson2007; Lefort et al. Reference Lefort, Boyer, Worner and Armstrong2012; Kranzfelder et al. Reference Kranzfelder, Ekrem and Stur2016, Reference Kranzfelder, Ekrem and Stur2017; Nguyen et al. Reference Nguyen, Kim, Borzée and Jang2017). However, each of these few studies all employed DNA barcoding that focused on a single taxon – for example, the emergence of Odonata species – rather than on bulk arthropod samples (Watts et al. Reference Watts, Thompson, Daguet and Kemp2005; Krosch and Cranston Reference Krosch and Cranston2012; Nguyen et al. Reference Nguyen, Kim, Borzée and Jang2017; Sittenthaler et al. Reference Sittenthaler, Fischer, Chovanec, Koblmüller, Macek and Sattmann2023). To date, no comprehensive study has measured insect emergence of multiple taxa through metabarcoding of DNA from insect exuviae.
The present study aimed to evaluate both the efficacy of DNA metabarcoding of insect exuviae to identify taxa and the ability of this noninvasive identification method to advance the study of amphibiotic insect emergence. As a result, our study used insect exuviae collected from the water surface to determine if such samples contain sufficient residual DNA to identify past and present emerging taxa using metabarcoding. To compare the ability of this noninvasive method with more traditional methods, we also collected insect samples using a standard emergence trap and then identified the species using metabarcoding. To permit a direct comparison of the two sampling methods, both sample types were collected at the same sampling site over the same time period, and identical DNA extraction, amplification, and sequencing protocols were applied to the samples, regardless of which sampling method was used.
Materials and methods
Sample collection
Samples were collected from a site in southwestern Ontario, Canada (43.4921828, −80.6157117) between 29 May and 21 August 2023. Forty emergence trap samples and 26 exuviae samples were collected; however, only samples from the first seven weeks of collecting were included due to damage to two of the traps and a failed DNA extraction, leaving a total of 28 emergence trap samples and 14 exuviae samples. Collection was done at a creek and at a constructed pond that the creek fed into.
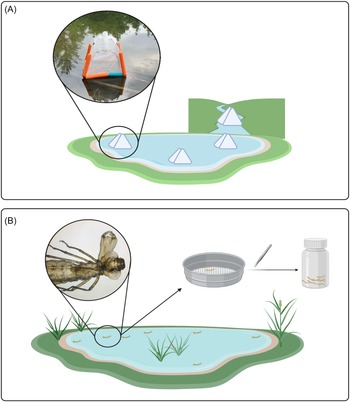
For emergence trap samples, four traps were deployed, three on the pond and one on the creek surface. We used soil emergence traps that were modified for buoyancy and anchored in place (Fig. 1A; Malison et al. Reference Malison, Benjamin and Baxter2010). These traps are pyramidal in shape and are made of light fabric. When insects emerge from the water column beneath the trap, they are funnelled upwards into a bottle containing 95% ethanol. Bottles were collected weekly, and samples were stored in a freezer at −20 °C.
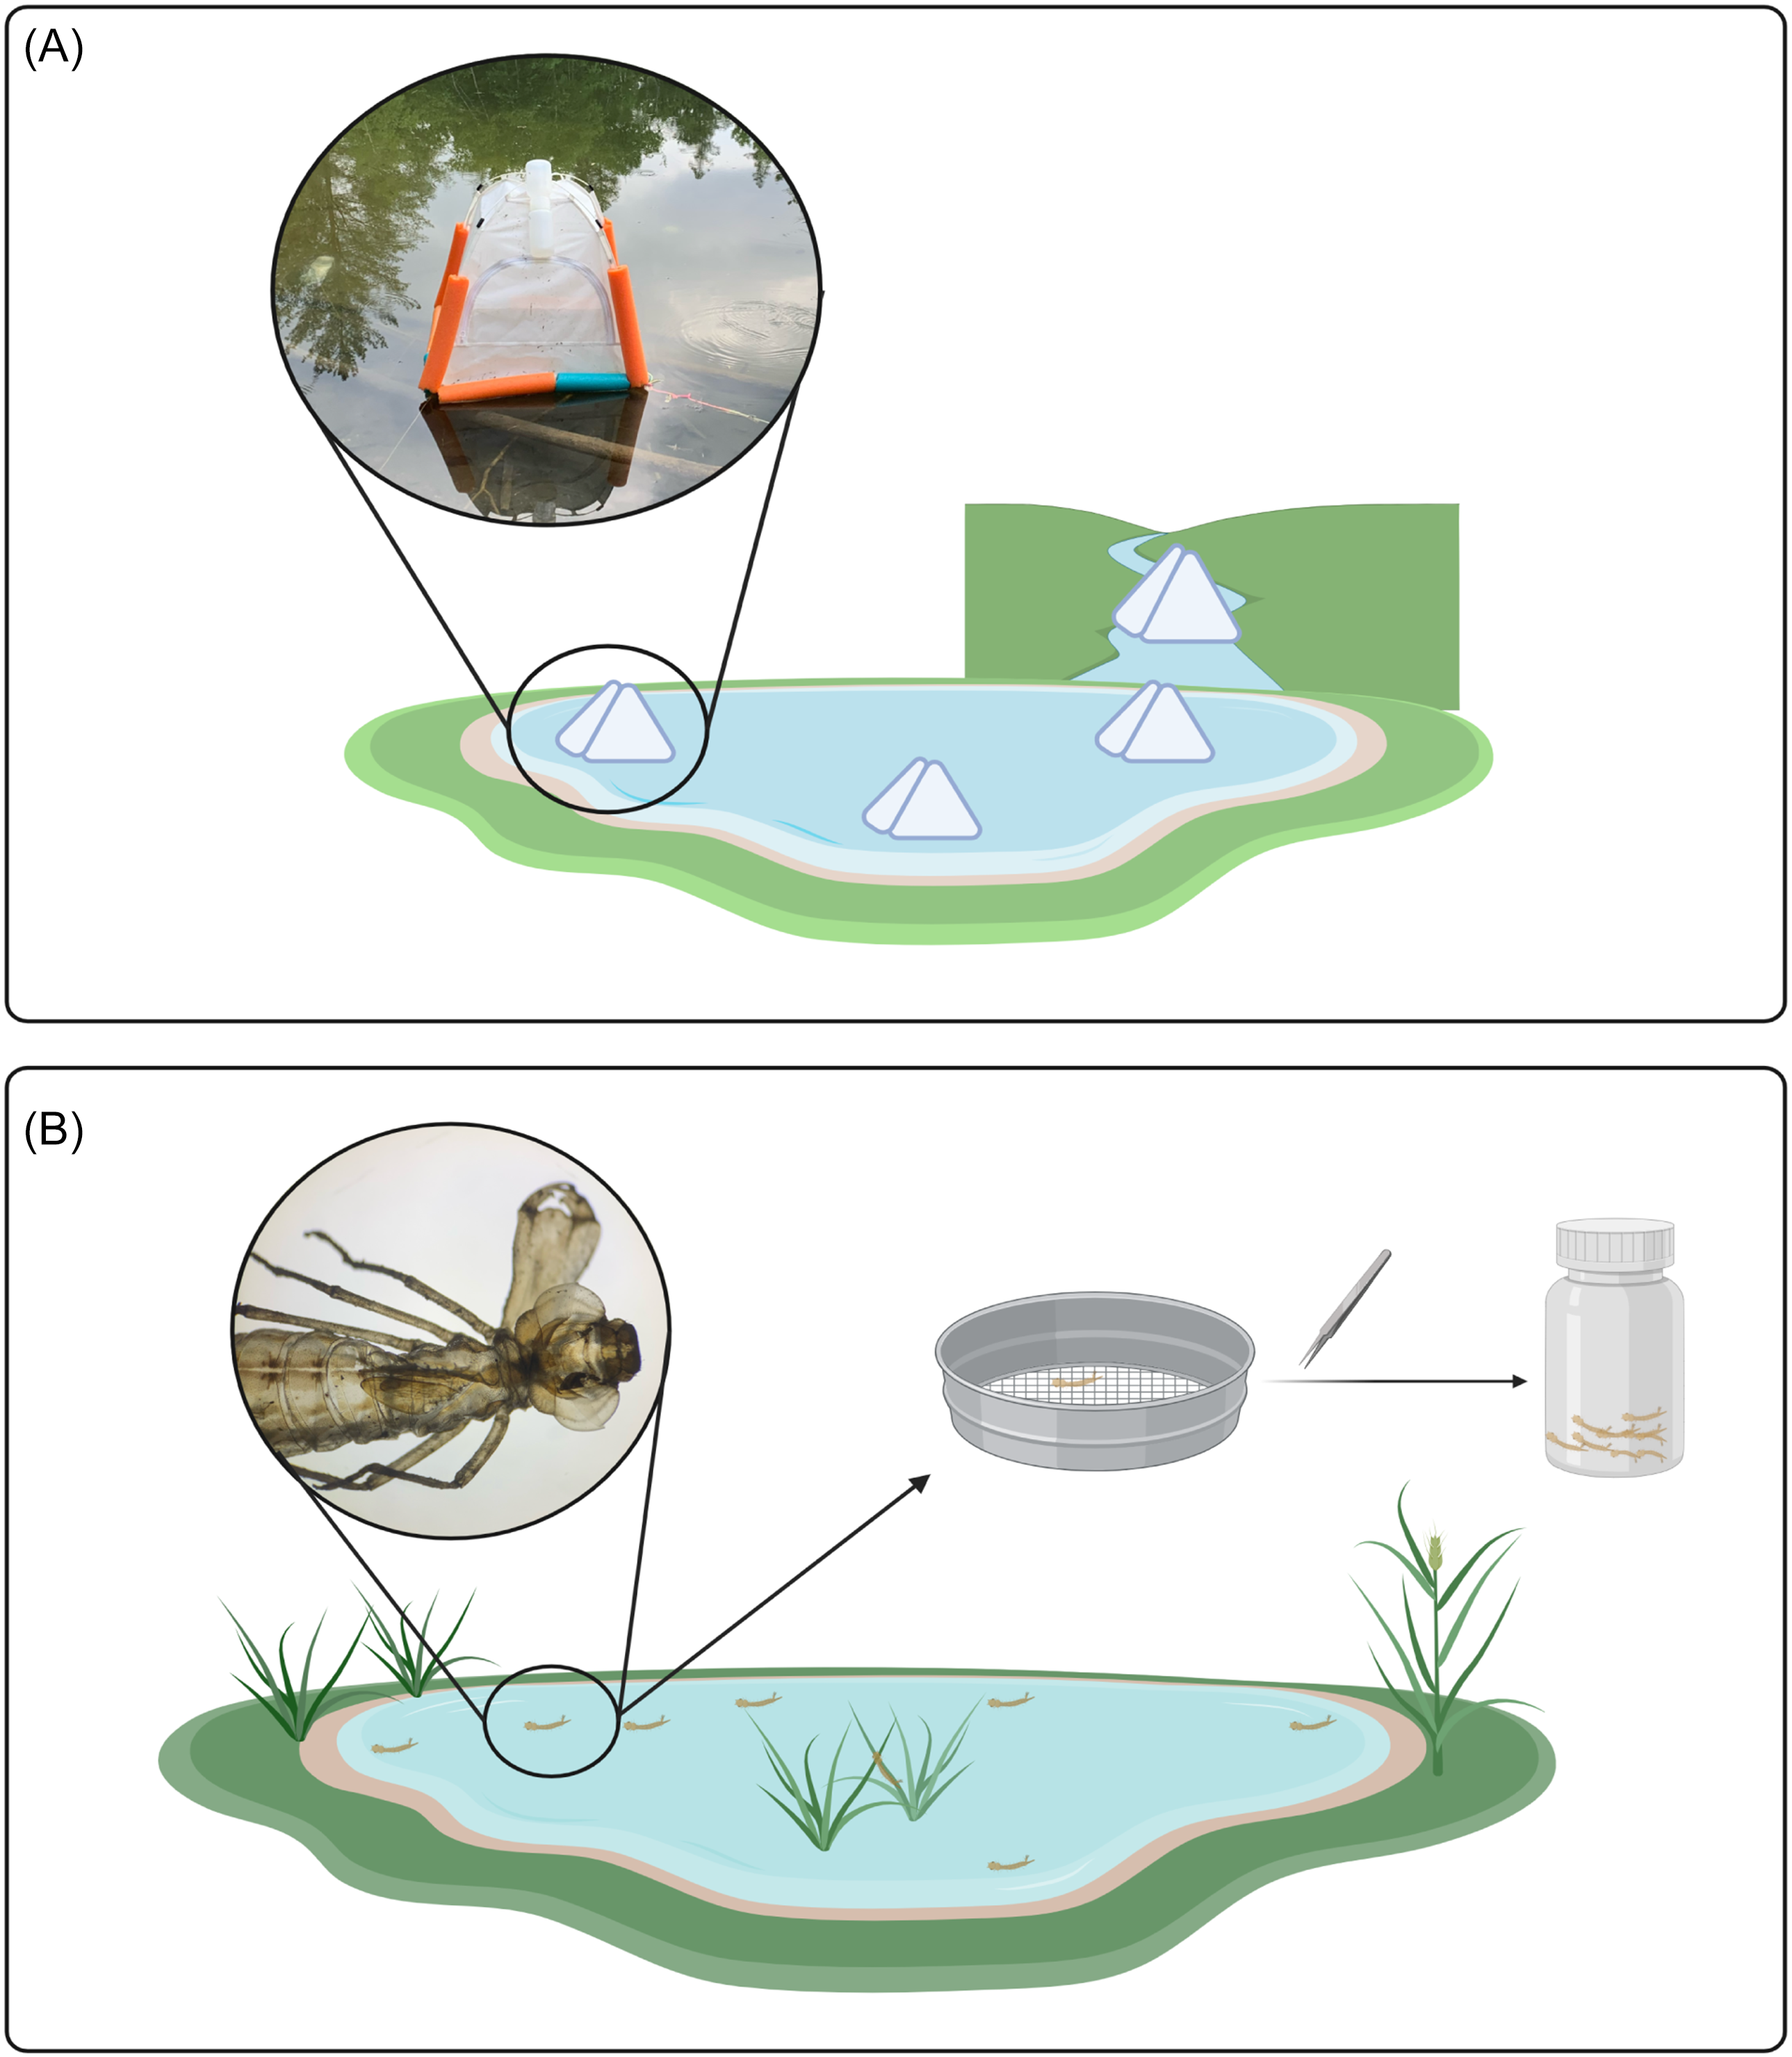
Figure 1. Comparison of two sampling methods: A, three emergence traps located on the pond and one emergence trap located on the creek; and B, workflow of exuviae collection. Diagram created in BioRender (https://BioRender.com/b21n111) by S. Dworatzek.
Exuviae sampling was done weekly for 30 minutes at both the pond and adjacent creek, resulting in two samples per week. Exuviae are lightweight following emergence and typically float on the surface for several days before decomposition occurs and the exuviae begin to sink. The outer perimeter of the pond was searched, and floating debris that was identified to be insect exuviae was collected from the surface using a sieve (Fig. 1B). Because the creek is a lotic environment, the passing water was searched and floating debris that was identified to be insect exuviae was retrieved. In both cases, sterile forceps were used to transfer individual exuviae into bulk sample bottles containing 95% ethanol, and the samples were stored in a freezer at −20 °C.
Lysis and extraction
For both sample types, the ethanol was drained, and the samples were dried in an incubator, bulk exuviae samples for at least four hours and bulk insect samples for eight hours. The exuviae samples generally required less time to dry because of their lower average biomass. Once dry, the samples were ground into a fine powder using either the IKA® tube mill (IKA, Breisgau, Germany) at 25 000 rpm for 3 minutes or by vortex with steel beads (5 mm diameter). Lysis was done using approximately 25 mg of the sample powder, 200 µL of a solution of 90% insect lysis buffer (7000 mM guanidinium isothiocyanate (GuSCN), 30 mM ethylenediaminetetraacetic acid (pH = 8.0), 5% Tween-20, 30 mM Tris hydrochloride (pH = 8.0), 0.5% Triton X-100), and 20 mg/mL 10% proteinase K (Qiagen, Hilden, Germany)). One negative control was incorporated for every 24 samples during the lysis step. These controls were included in subsequent steps and were sequenced to correct for contamination during data analysis. Samples were incubated at 58 °C overnight, with shaking, before DNA was extracted using the DNeasy® Blood and Tissue Kit (Qiagen), according to manufacturer instructions.
Amplification, library preparation, and sequencing
Samples were randomised on a 96-well plate, with one negative polymerase chain reaction control included for every 12 samples. The controls were also sequenced to correct for contamination. The cytochrome c oxidase subunit 1 (COI) gene was amplified using a two-step polymerase chain reaction protocol with the forward primer BF3 (5′-CCHGAYATRGCHTTYCCHCG-3′) and reverse primer BR2 (5′-TCDGGRTGNCCRAARAAYCA-3′; Elbrecht and Leese Reference Elbrecht and Leese2017). The first polymerase chain reaction amplifies the target sequence using the above universal primers, and the second uses modified versions of the same primers to tag each sample and introduce Illumina sequencing tails (Elbrecht and Steinke Reference Elbrecht and Steinke2019). The first polymerase chain reaction was completed with a total volume of 25 µL, using 5 µL of the extracted DNA, 50% Multiplex PCR Master Mix Plus (Qiagen), 0.5 µM of each primer, and molecular-grade water. The second polymerase chain reaction was conducted using the same reagents and 5 µL of the product resulting from the first polymerase chain reaction of each sample (Elbrecht and Steinke Reference Elbrecht and Steinke2019). Both rounds of polymerase chain reaction underwent the same conditions: a 5-minute hot start at 95 °C, 25 cycles with denaturation at 95 °C for 30 seconds, annealing at 50 °C for 45 seconds, and extension at 72 °C for 50 seconds, and 72 °C at the end for 5 minutes. The product was visualised with a 1% agarose gel using the Invitrogen 1-kb DNA ladder and the SYBR safe DNA gel stain (Thermo Fisher Scientific, Massachusetts, United States of America).
The amplicons were normalised using the Invitrogen SequalPrep™ Normalisation Plate Kit (Thermo Fisher Scientific; Harris et al. Reference Harris, Sahl, Castoe, Wagner, Pollock and Spear2010). Five microlitres of each sample were pooled before solid-phase reversible immobilisation–based size selection (Beckman Coulter, Brea, California, United States of America), using the leftside size selection procedure with a bead-to-sample volume ratio of 0.7. Quality was assessed on a 1% agarose gel and was visualised with the SYBR Safe DNA Gel Stain (Thermo Fisher Scientific), and DNA concentration was measured with the Qubit dsDNA HS Assay Kit (Thermo Fisher Scientific; Harris et al. Reference Harris, Sahl, Castoe, Wagner, Pollock and Spear2010). The sample was pooled with other metabarcoding samples and was submitted for sequencing on an Illumina MiSeq with the 600-cycle Reagent Kit, version 3, and 5% PhiX spike-in at the University of Guelph Advanced Analysis Centre (Guelph, Ontario, Canada).
Data analysis
Sequences were demultiplexed according to the unique combination of forward and reverse inline tags incorporated in the second round of polymerase chain reaction. APSCALE software was used for sequence filtering (removal of sequences shorter than 350 bp and with low quality) and clustering (Buchner et al. Reference Buchner, Macher and Leese2022). Taxonomy was assigned to operational taxonomic units using a curated Canadian Reference Library on the Barcode of Life Data System (dx.doi.org/10.5883/DS-CANREF22). Taxonomic assignments were made with an identity threshold of 3% and were removed when they had less than five reads. To mitigate the effects of contamination, the number of reads in each sample was corrected by removing sample operational taxonomic units that were less than or equal to those detected in the negative controls.
All analyses and visualisations were made using R, version 4.2.2 (R Core Team 2022), with the package ggplot2 (Wickham Reference Wickham2016). Collection data (exuviae per sample, dry weight biomass, DNA concentration, and read count) and species richness (operational taxonomic unit richness and amphibiotic species richness) were considered to have a normal distribution and equal variances for P-value correlation coefficients at α > 0.05 in a Shapiro–Wilk test and a Levene’s test, respectively. If these requirements were not met, differences in response variables were measured with the Wilcoxon rank-sum test.
The success of species-level detection and contamination of nonamphibiotic (fully aquatic or terrestrial) organisms were investigated via the relative abundance (proportionate reads). Proportionate reads were considered to have a normal distribution and equal variance for P-value correlation coefficients at α > 0.05 in a Shapiro–Wilk test and a Levene’s test, respectively. A two-way analysis of variance was conducted to determine any significant difference between the proportion of reads (amphibiotic, nonamphibiotic, and no species assigned) in each sample type, and this was followed by a post hoc test using Duncan’s multiple range test. Outliers were excluded when they were three times the interquartile range above or below the third or first quartile, respectively.
Differences in species composition across sampling sites and types were measured with beta diversity via the betapart package in R (Baselga and Orme Reference Baselga and Orme2012). Pairwise differences were calculated using presence–absence data and the Sørensen dissimilarity matrix. Beta diversity was partitioned into turnover (replacement of some species by others) and nestedness (differences in richness due to species loss or gain without replacement). This analysis was particularly helpful for determining whether the three traps located on the pond varied enough to provide new information in the analysis.
The vegan package was used to further analyse differences in species composition between the two trapping types and between sampling locations (Oksanen et al. Reference Oksanen, Simpson, Blanchet, Kindt, Legendre and Minchin2024). Because the three pond emergence traps provided similar information and only the first five weeks of sampling were consistent across sites, data were limited to one pond trap for the first five weeks. Species composition was visualised using nonmetric multidimensional scaling, a nonparametric ordination method that lacks specific assumptions, thereby making it ideal for ecological datasets. Nonmetric multidimensional scaling uses a distance or dissimilarity matrix, allowing for the reduction of samples into two- or three-dimensional space. This permits visualisation of patterns in species composition, with axes representing relative differences between samples. Ordination had to have a stress value below 0.1 to be considered reliable. Differences between groups were assessed for statistical significance using the nonparametric rank technique, analysis of similarity. This analysis relies on the assumption that, if a grouping variable is important, rank distances will be larger across groups than within groups. The test statistic, R, ranges from −1 to 1, with values close to 1 indicating strong dissimilarity between groups and values near 0 suggesting no difference.
For all statistical tests, results were considered significant for P-value correlation coefficients at α < 0.05.
Results
In total, 40 emergence trap samples and 26 exuviae samples were collected. Of these, 28 emergence trap samples and 14 exuviae samples were successfully sequenced. The number of exuviae collected per sample ranged from three to more than 100. The low yield seen in some exuviae samples aligned with weeks in which the biomass for emergence trap samples was also low and may be related to the emergence time of certain taxonomic groups. Both exuviae and emergence trap samples had a high number of failed samples. Most of these failed samples were lysed and extracted in the same sample group and likely failed due to human error. If these samples were redone, they would likely be able to be sequenced, but we did not have the capacity to redo them. This large group of failed samples corresponds to the last five weeks of sampling, for which only five samples were successfully sequenced. Outside of these last five weeks of sampling, only three samples failed. Due to these failed samples and damage to two of the emergence traps, we removed the last five weeks from the analysis.
The pond yielded a significantly higher number of collected exuviae (32 ± 6.97) than the creek did (8.17 ± 1.19; W = 34, P = 0.0128). The same trend was seen in the dry weight of exuviae samples: the pond yielded a higher average biomass of exuviae samples (0.141 ± 0.0321 g) than the creek did (0.00277 ± 0.000739 g; W = 49, P < 0.001). The opposite was seen in the emergence trap samples: the creek had a significantly higher abundance, based on dry weight (0.108 ± 0.0171 g), than the pond did (0.00747 ± 0.00155 g; W = 0, P = 0.002). The biomass did not differ significantly across the three pond emergence traps (Kruskal–Wallis chi-squared = 4.966, P = 0.1743). The quantity of DNA extracted from emergence trap samples (mean concentration 23.4 ± 2.87 ng/µL) was significantly higher than that from exuviae samples (mean concentration 5.66 ± 1.33 ng/uL; W = 348, P < 0.001).
After filtering, Illumina sequencing produced a total of 4.4 million reads, 973 236 of which correspond to the samples discussed in this paper. After accounting for contamination via the reads detected in the negative controls, 968 976 reads remained. The average number of reads was significantly higher in samples from the emergence traps (41 089 ± 7016) than those from exuviae (5320 ± 1817; W = 311, P < 0.001). These reads corresponded to 288 distinct operational taxonomic units; 49% of these were assigned to the species level, 82% were assigned to the subfamily level, and 100% were assigned to the family level. A significant difference in the number of operational taxonomic units was detected across the different sample types (Kruskal–Wallis chi-squared = 17.815, P = 0.003187; Fig. 2A). This difference was primarily due to the significantly higher number of operational taxonomic units that were detected in the emergence creek samples compared to those in all other sample types (P < 0.001; Fig. 2A). The exuviae creek samples also had a significantly lower operational taxonomic unit richness compared to one of the three emergence pond samples (P = 0.024). When focusing on samples collected from the pond, no significant difference was observed between the number of operational taxonomic units in exuviae and the number of operational taxonomic units in emergence traps (W = 42.5, P = 0.881). For the pond samples, an average of 13.1 ± 1.26 operational taxonomic units was detected in emergence traps, and an average of 12.8 ± 3.92 operational taxonomic units was detected in exuviae samples (Fig. 2B). In total, we found 206 distinct operational taxonomic units in emergence traps and 117 distinct operational taxonomic units in the exuviae samples. None of these operational taxonomic units were found to be present across all sampling types and locations (Fig. 2C).
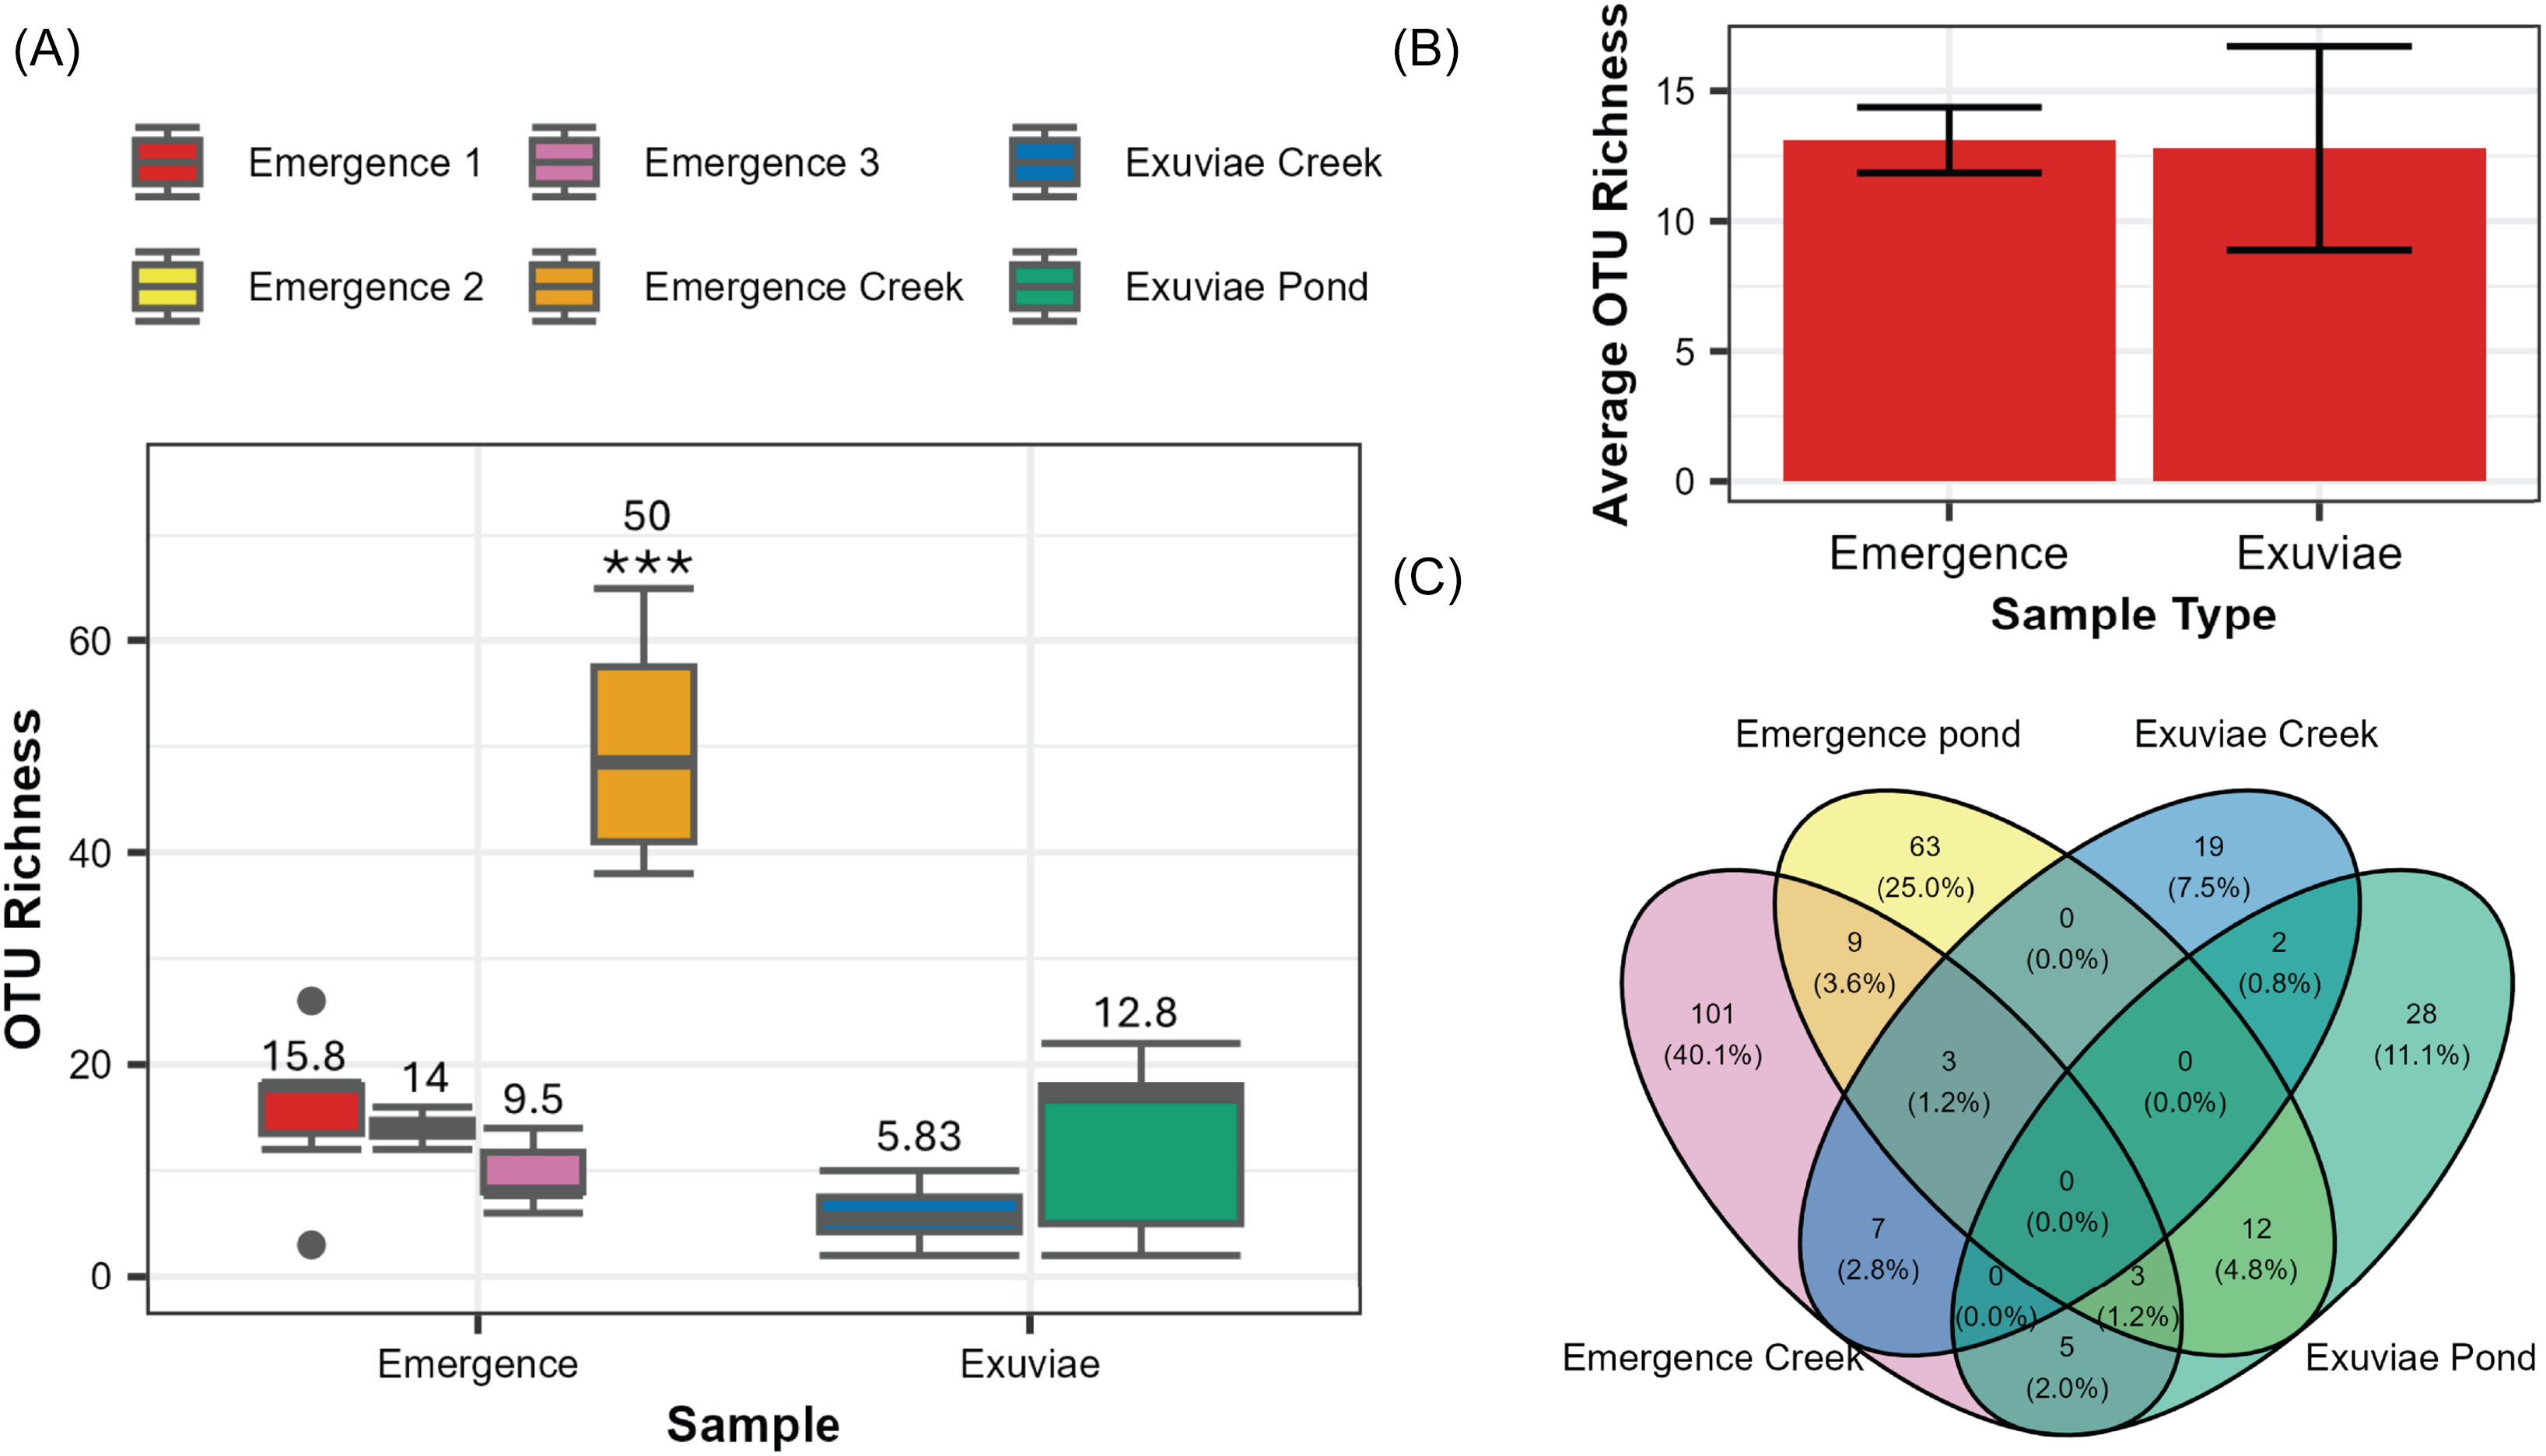
Figure 2. Differences in operational taxonomic unit richness across sample types: A, box plots of operational taxonomic unit richness for each of the six samples, with average operational taxonomic unit richness indicated above each box plot and significant differences indicated by *; B, average overall operational taxonomic unit richness for emergence and exuviae pond samples, with error bars representing the standard error; and C, Venn diagram representing the number of unique and overlapping operational taxonomic units for each location and sampling type.
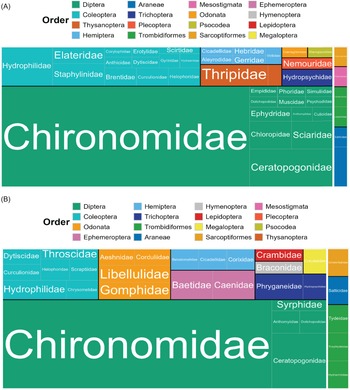
Most taxonomic matches belonged to Insecta (98% of emergence samples, 97% of exuviae sampling). In emergence trap samples, Diptera made up 74% of insects and 72% of all detections (Fig. 3A). In the exuviae samples, Diptera comprised a lower rate but was still the most prevalent taxonomic order, making up 60% of insects and 53% of all detections (Fig. 3B). In both sample types, most Diptera were members of the family Chironomidae. In the emergence trap samples, Chironomidae accounted for 60% of the total detections and 83% of all Dipteran detections (Fig. 3A), whereas in the exuviae samples, they accounted for 40% of all detections and 76% of all Dipteran detections (Fig. 3B). Coleoptera accounted for 13% and 12% of the detections in emergence and exuviae samples, respectively. In both sample types, all other orders represented less than 10% of the total detections (Fig. 3). Some of these less-prevalent taxa were seen at similar rates in both emergence and exuviae samples; for example, Trichoptera accounted for 3% and 4% of the total detections in the emergence and exuviae samples, respectively. Orders such as Odonata were detected at a higher rate in the exuviae samples (5% versus 1%). The opposite was seen with Thysanoptera, which accounted for 5% of the detections in emergence traps but only 1% of the exuviae detections.
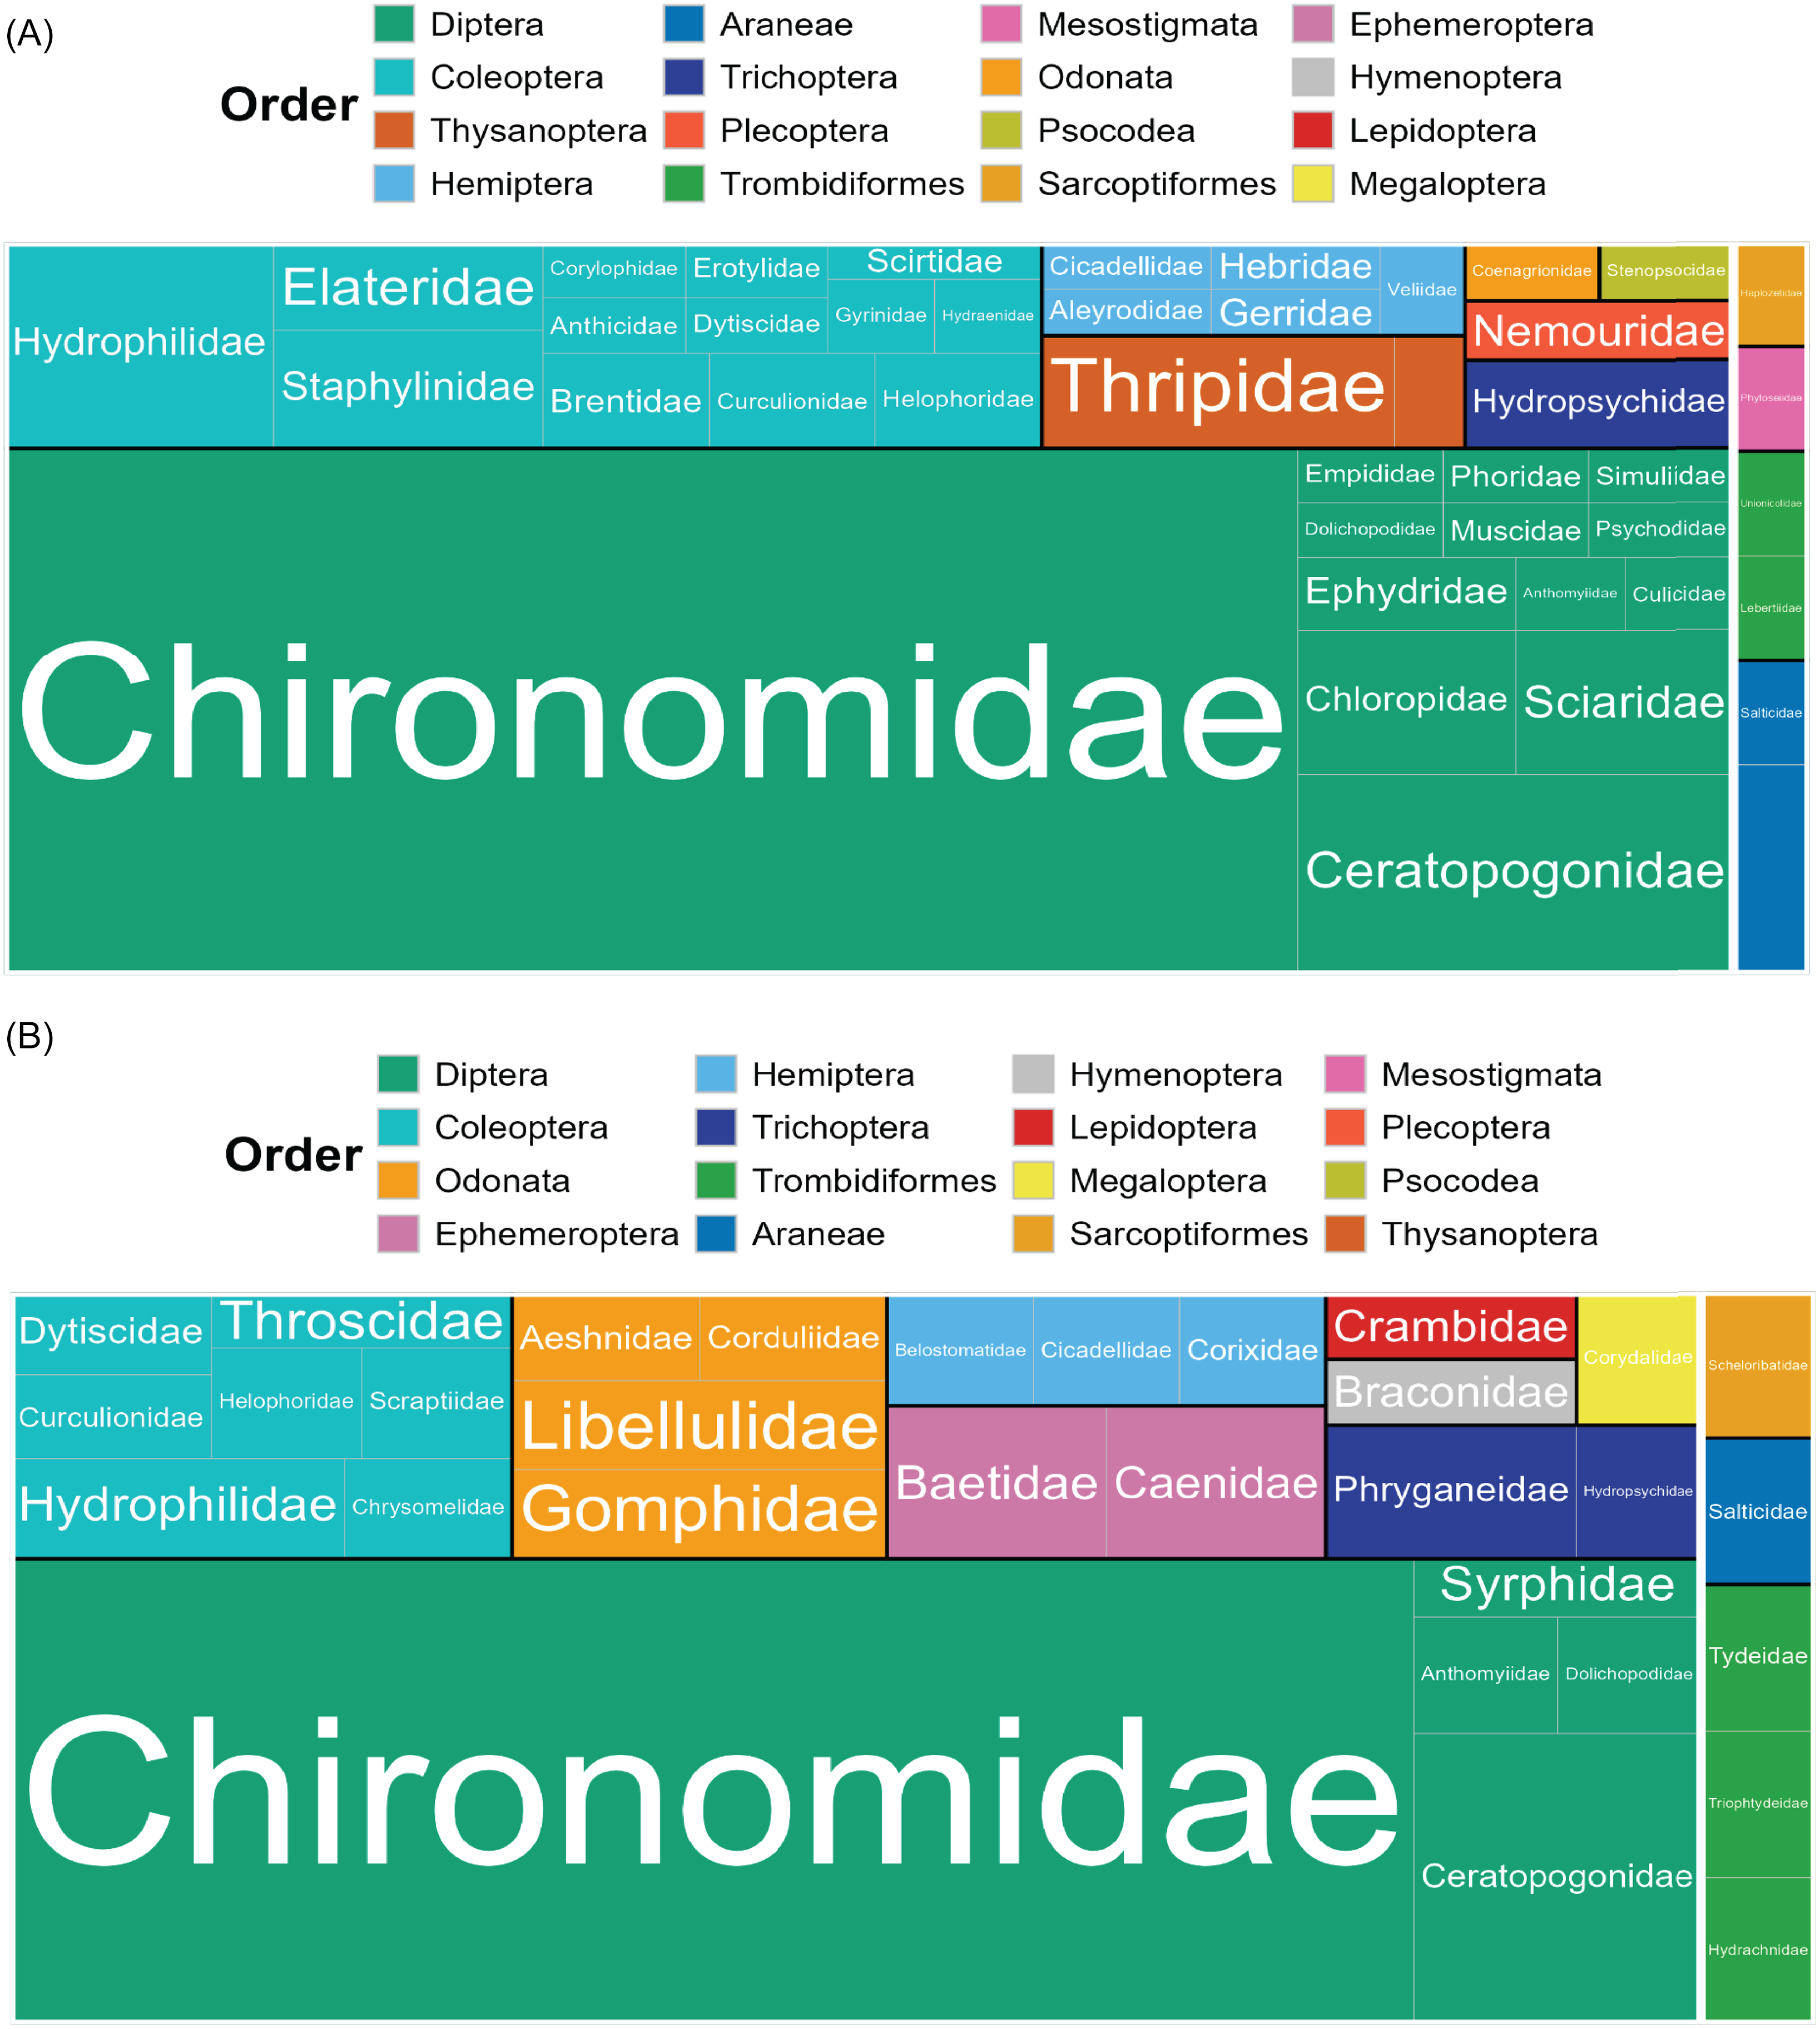
Figure 3. Tree map representing the species richness of arthropod taxonomic orders and families in each sample type: A, emergence trap samples; and B, exuviae samples. Insecta is shown on the left; Arachnida is shown on the right; orders are separated by colour; families are separated by label. The size of each box corresponds to the relative number of operational taxonomic units per group.
Both the portions of reads corresponding to amphibiotic species, nonamphibiotic species, and the species-level assignments in emergence trap and exuviae sampling differed significantly (F = 4.679, P = 0.012; Fig. 4). The proportion of reads corresponding to amphibiotic insects did not differ significantly between exuviae and emergence trap samples (P = 0.0710). However, a significantly higher proportion of reads corresponded to amphibiotic insects than to nonamphibiotic insects in exuviae samples but not in emergence samples (P = 0.007 and 0.390, respectively).
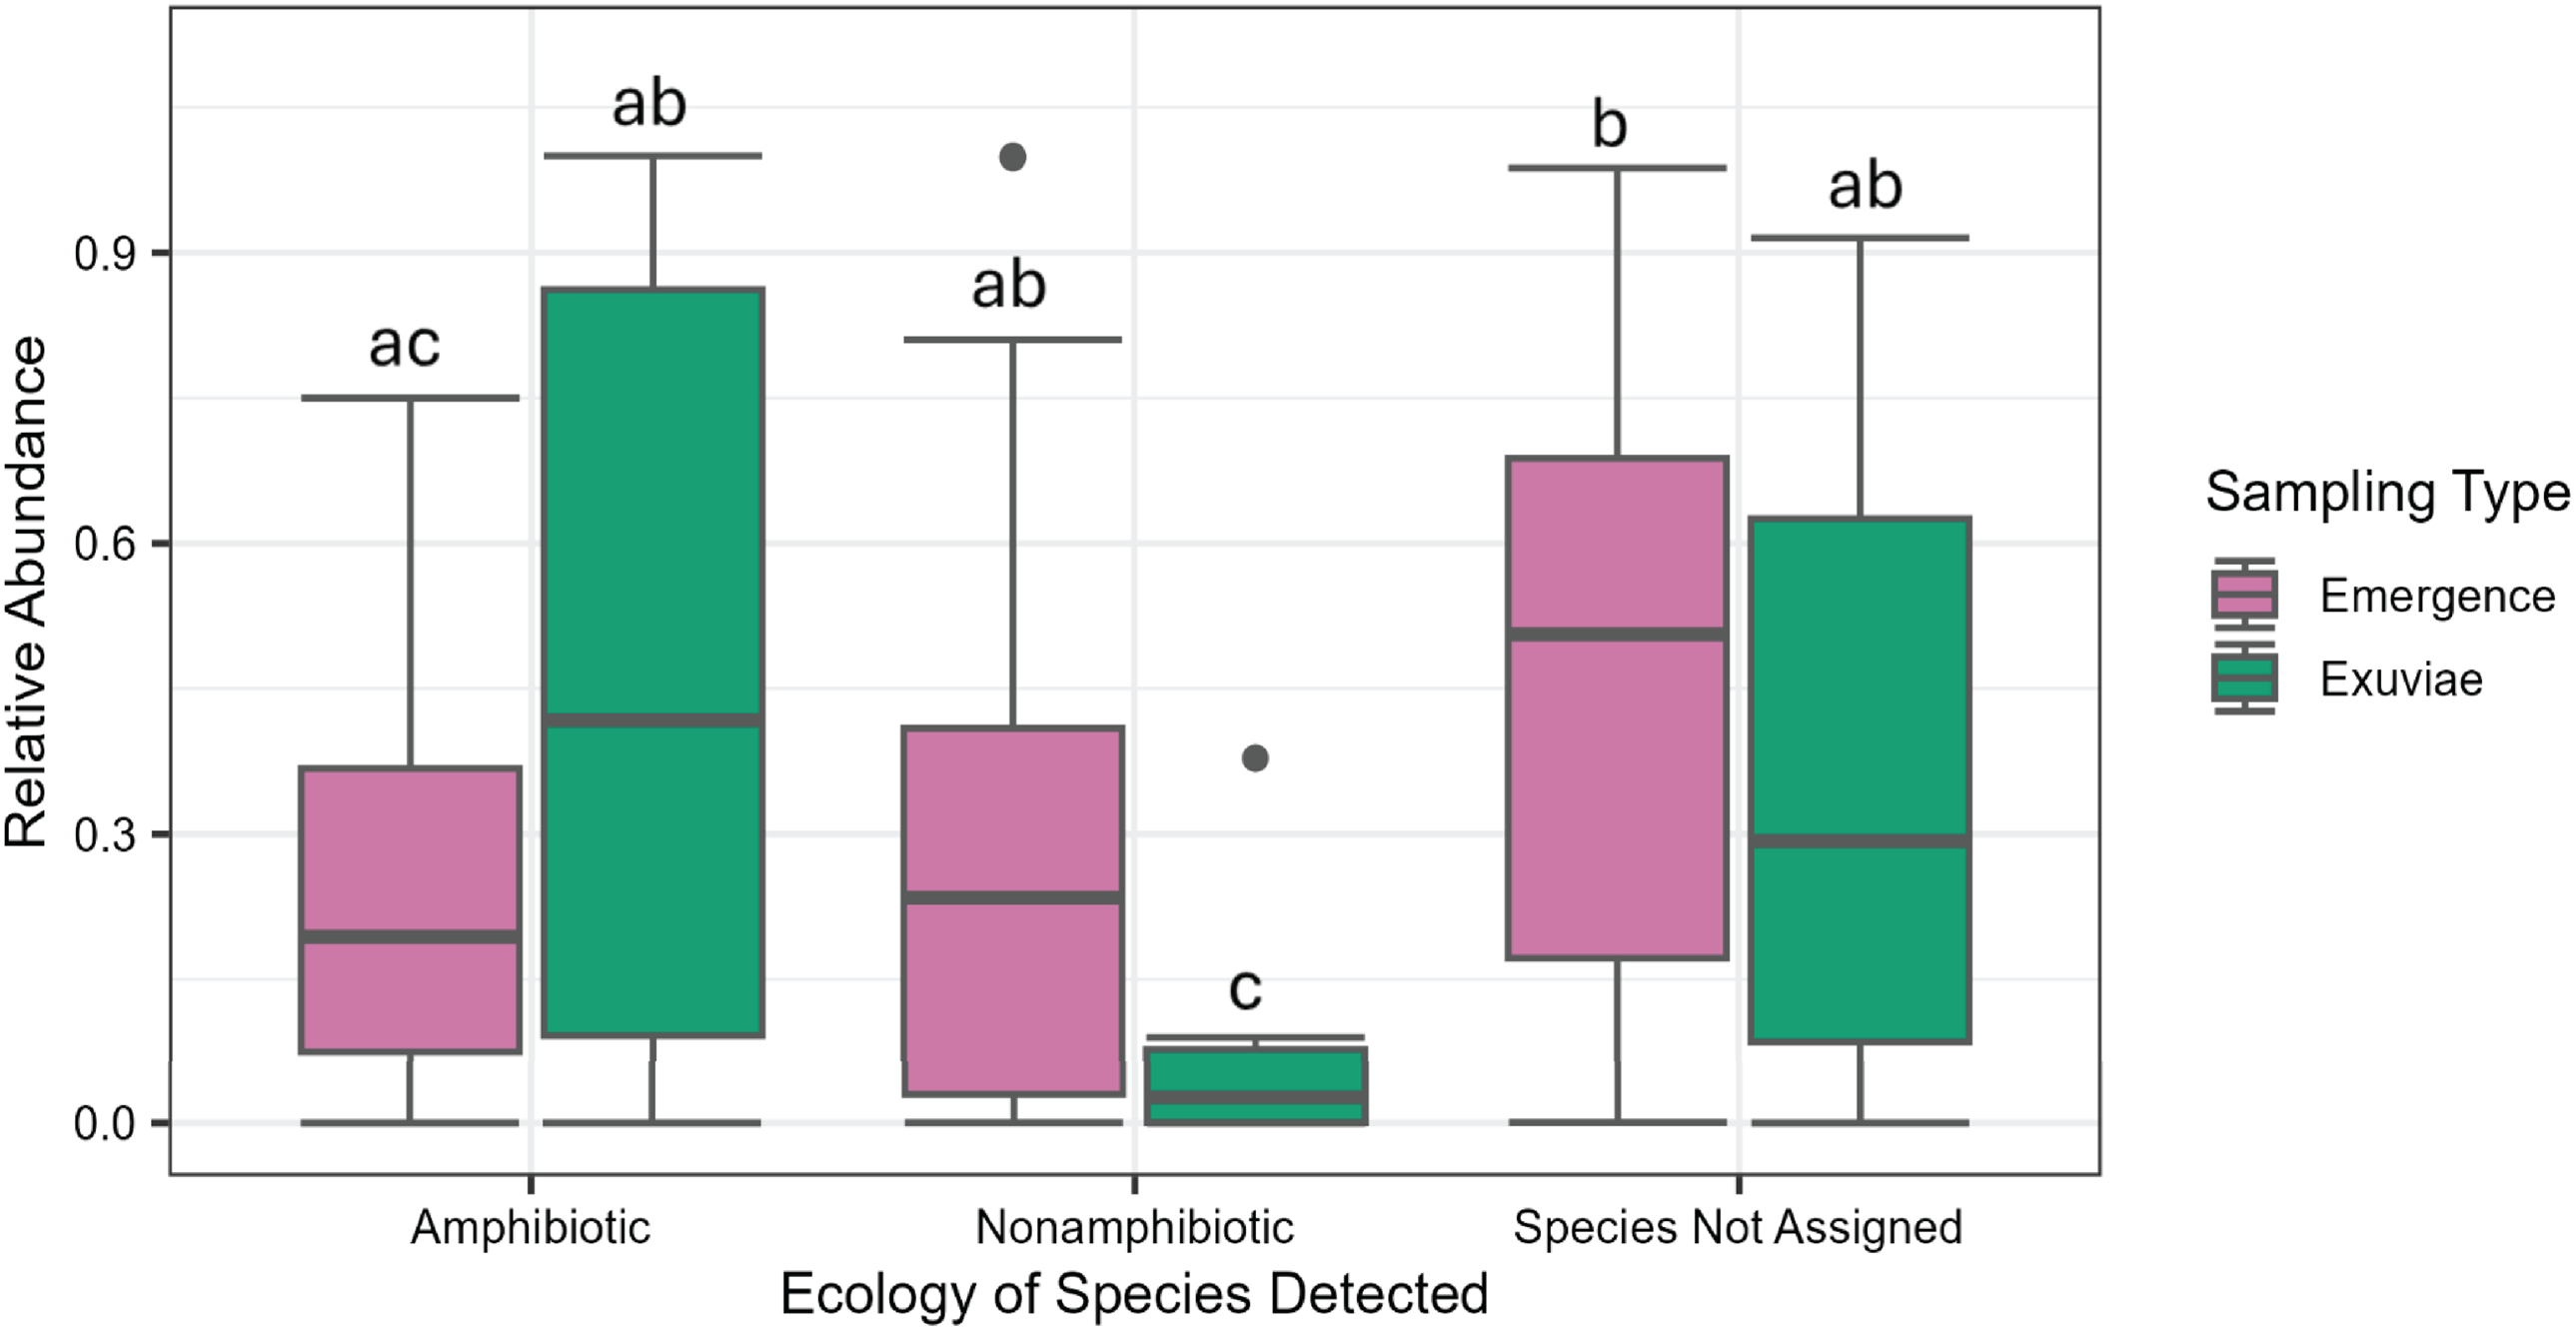
Figure 4. Relative abundance (proportion of reads in each sample) by collection method and species ecology. Letters represent the groups which were not statistically distinguishable in a two-way analysis of variance.
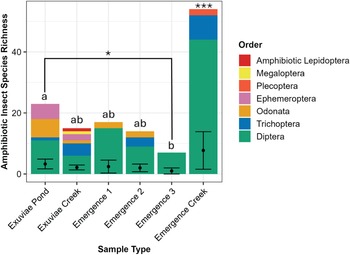
The number of amphibiotic species detected was not statistically distinguishable between emergence trap samples (3 ± 0.743) and exuviae samples (3.33 ± 0.899; W = 121.5, P = 0.878). These species made up seven orders, six of which were detected in exuviae (Diptera, Ephemeroptera, Odonata, Lepidoptera, Megaloptera, and Trichoptera) and four of which were detected in emergence traps (Diptera, Odonata, Plecoptera, and Trichoptera; Fig. 5). For the orders detected in both sample types, only one family within the order Odonata was detected in emergence traps, whereas four were detected in exuviae samples. Similarly, for Trichoptera, only one family, Hydropsychidae, was detected in emergence trap samples, whereas an additional family, Phryganeidae, was detected in exuviae samples. In addition, the exuviae samples contained two families and two genera from Ephemeroptera, whereas only one family and one genus were detected for Plecoptera in emergence traps.

Figure 5. Total species richness of amphibiotic species for each sample type and location, with the corresponding orders distinguished by colour. The average species richness, with standard error, is displayed with error bars. Significantly different groups are indicated by *, and statistically indistinguishable groups are represented by lettering.
Differences in diversity measured through beta-diversity were almost entirely due to turnover rather than to nestedness. Additionally, the three different traps located on the pond showed more similar composition than did the exuviae samples (Fig. 6A). Notably, samples collected from the pond were more similar to each other than were samples from the creek, regardless of the sampling type (Fig. 6A). Ordination identified that 59.7% of the variation in species composition was explained by axis one and 40.3% of the variation was explained by axis two (Fig. 6B). Results of correlation analysis suggest that operational taxonomic unit composition varies significantly based on sample location (r 2 = 0.302, P = 0.005) and varies marginally based on sampling type (r 2 = 0.137, P = 0.098). A similar trend was seen when substituting the various pond emergence traps. Statistical analysis of differences in operational taxonomic unit composition with analysis of similarity indicated that emergence traps and exuviae sampling methods produced significantly different results for two of the three pond traps; however, the effect size of this difference was weak (R = 0.125, P = 0.049; R = 0.186, P = 0.027; and R = 0.109, P = 0.080). Species composition did not vary significantly based on sampling week (R = 0.218, P = 0.589).
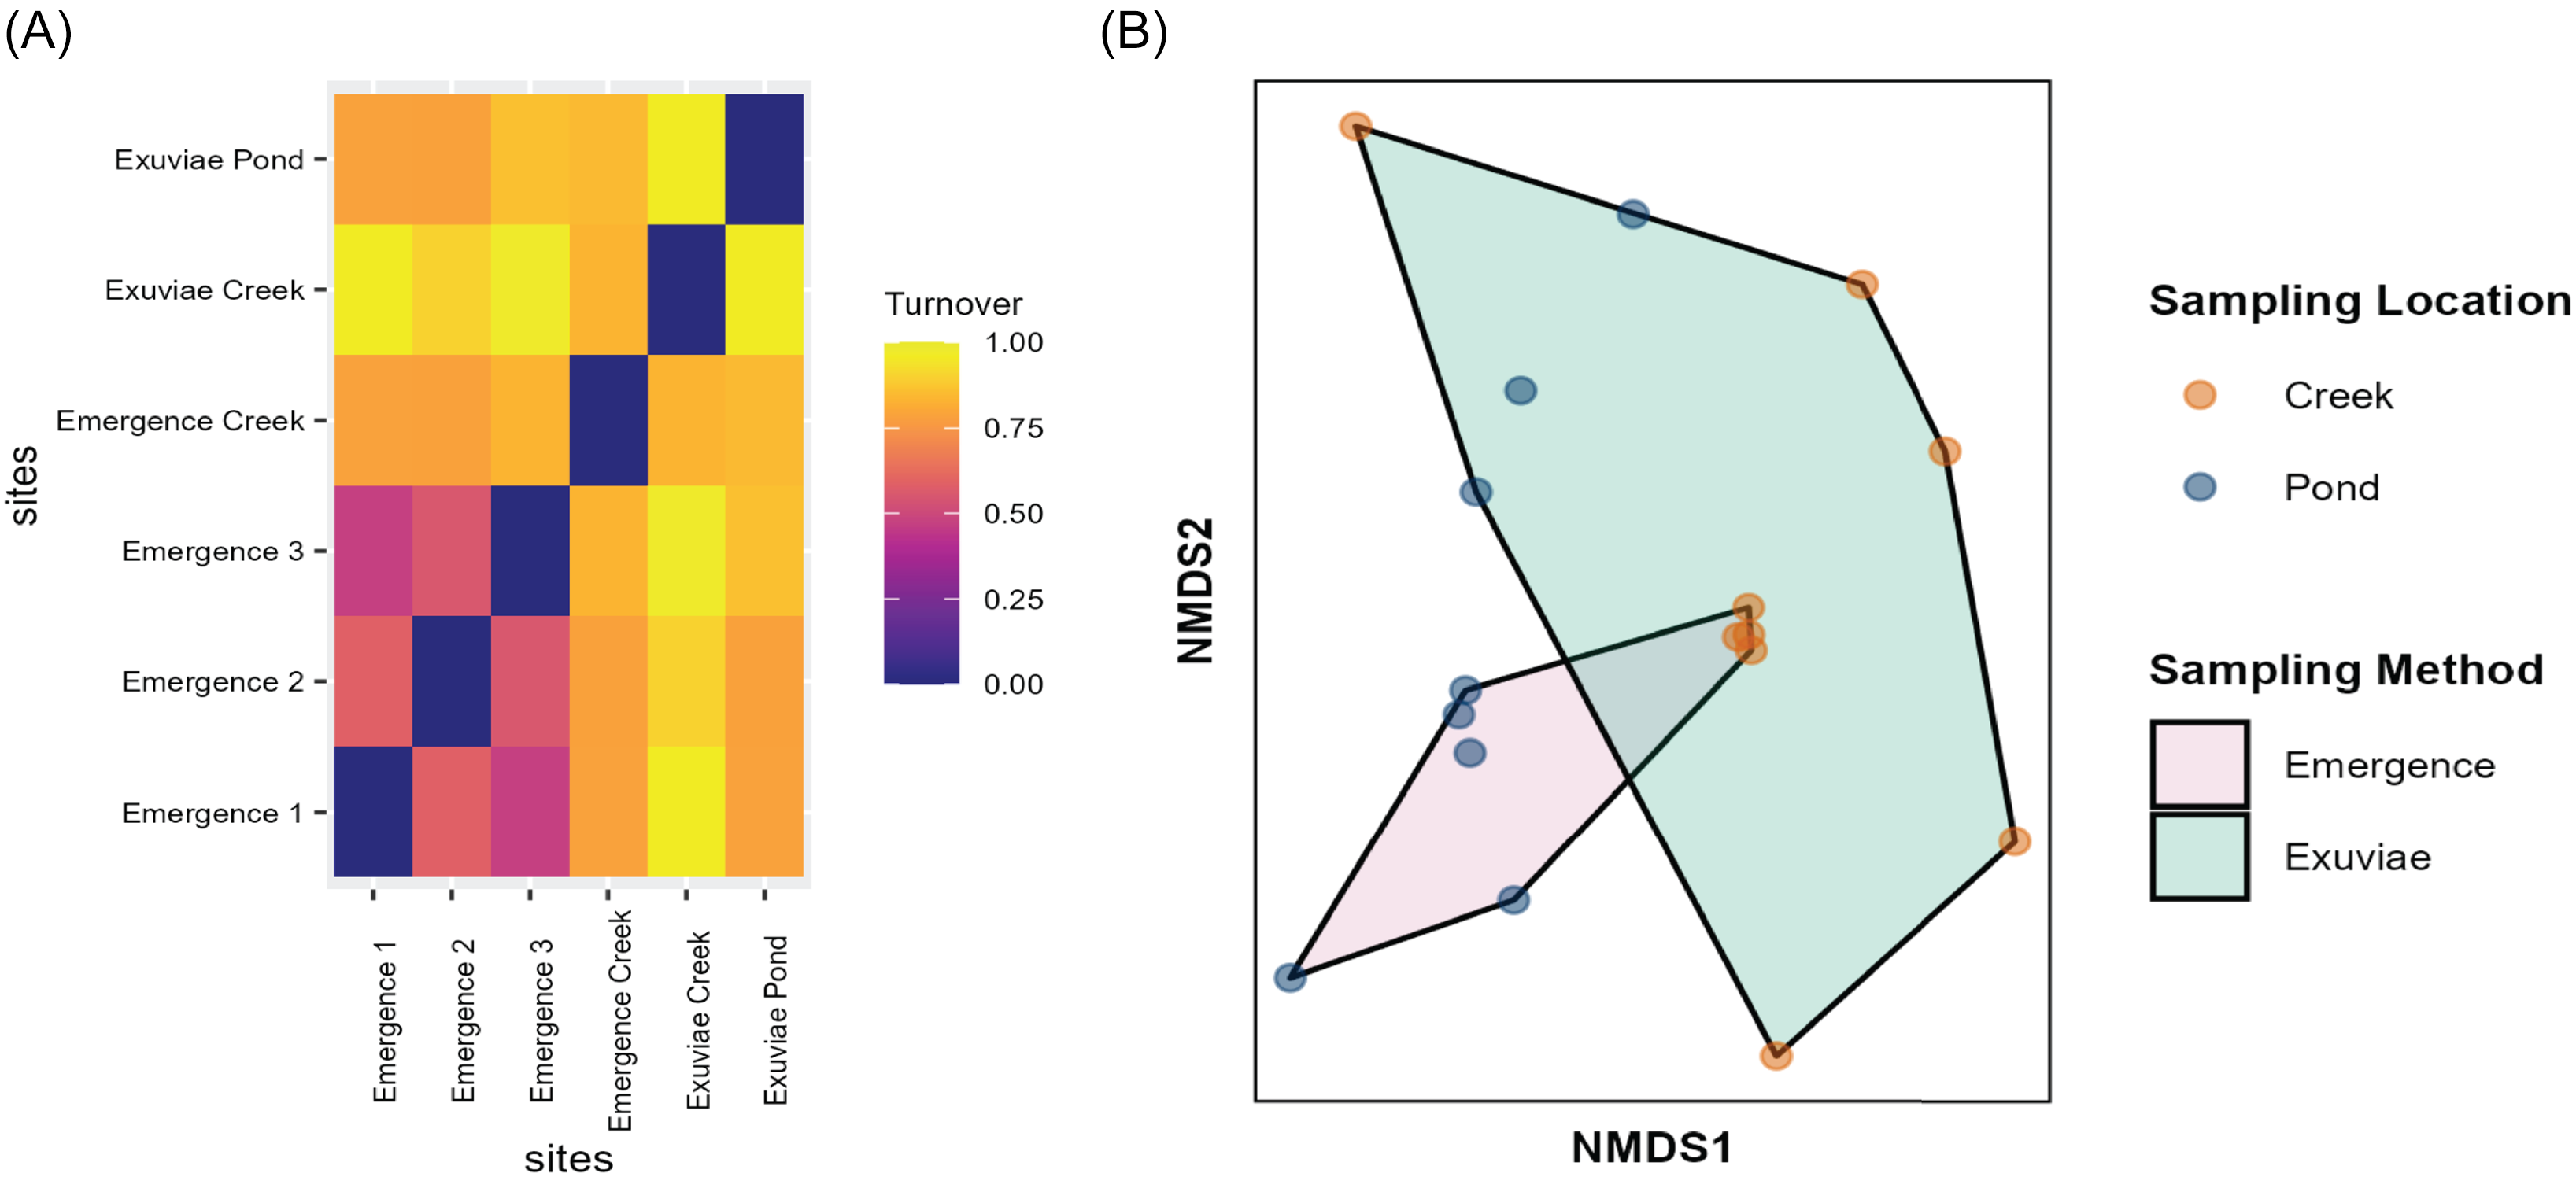
Figure 6. A, Heat map of beta diversity of samples collected, partitioned into turnover, demonstrating the differences in diversity between the exuviae samples and emergence trap samples, as well as between the pond and the creek. The heat map shows that all emergence traps located in different spatial areas of the pond have similar species diversity. B, Nonmetric multidimensional scaling of arthropod species composition. Polygons show exuviae and emergence traps; coloured dots indicate sampling location (either pond or creek).
Discussion
This study demonstrates the feasibility of using metabarcoding of DNA remnants in exuviae to study amphibiotic insects and their emergence.
The number of reads obtained from exuviae samples was low compared to the number of reads obtained from samples collected in emergence traps. This was expected because exuviae do not contain DNA; instead, all isolated genomic material in exuviae is the residual DNA from ecdysis. Furthermore, much of this residual DNA is lost before collection, due to environmental conditions, such as sunlight, that degrade DNA (Sittenthaler et al. Reference Sittenthaler, Fischer, Chovanec, Koblmüller, Macek and Sattmann2023). Nonetheless, with no true difference detected between sample types, the loss of residual DNA from exuviae samples does not appear to lower the efficiency of using DNA metabarcoding of exuviae samples to identify a broad range of taxa.
Taxa observed in both emergence trap and exuviae samples were detected at similar rates. Primary trends were similar: both emergence and exuviae samples were dominated by Diptera – primarily members of the family Chironomidae. We anticipated the high richness and relative read count for chironomids because the group is known to be one of the most prevalent taxa of amphibiotic emerging insects (Koperski Reference Koperski2019). We found the main disadvantage of exuviae sampling to be a lower species richness detected in lotic environments, particularly within Chironomidae. The exuviae samples may have missed some diversity present in Chironomidae due to the combination of sampling occurring in moving water and the Chironomidae family’s smaller relative body size compared to other taxonomic families (Arpellino et al. Reference Arpellino, Catanzaro, Montalto, Siri and Donato2022). A potential solution to this might be the use of a larger net with finer mesh to collect exuviae in moving water. Even so, both emergence and exuviae samples permitted the detection of members of the most common Chironomidae subfamilies (Chironominae, Orthocladiinae, and Tanypodinae), demonstrating that, despite some limitations, metabarcoding of exuviae detects a variety of small-sized insects.
Exuviae detected a number of amphibiotic insect species that was comparable to what was seen in emergence traps. For these species, only three orders, Odonata, Trichoptera, and Diptera, were detected in both sample types. Within these orders, family-level diversity in exuviae samples was higher for both Odonata and Trichoptera and lower for Diptera. Exuviae samples included two additional orders of primarily amphibiotic species, Megaloptera and Ephemeroptera, and one amphibiotic species from the order Lepidoptera (Pabis Reference Pabis2018). Exuviae are free-floating, meaning ecdysis does not necessarily occur at the place of collection, which allows for a larger sampling area. Admittedly, this limits researchers from considering site metadata at small spatial scales. Compson et al. (Reference Compson, Adams, Edwards, Maestas, Whitham and Marks2013) and Cheney et al. (Reference Cheney, Roy, Smith and Dewalt2019) have investigated impacts of small changes in environmental conditions on the emergence patterns of certain amphibiotic insects, but these differences are typically seen across different bodies of water or larger spatial areas. Our results corroborate this: the three emergence traps set on the pond did not differ significantly, despite variation in sampling location. We believe exuviae are unlikely to travel far enough, especially in lentic environments, to impact analysis of site metadata on emergence patterns.
We believe the lower taxonomic diversity detected in emergence trap samples may indicate that emergence traps favour collection of certain taxa over others. Previous studies have demonstrated the tendency of some odonate species to emerge in areas of high vegetation, especially regions of vegetation with higher strata (Hadjoudj et al. Reference Hadjoudj, Khelifa, Guebailia, Amari, Hadjadji and Zebsa2014). These insects tend to climb out of the water and onto vegetation, seeking areas exposed to more sunlight to optimise conditions for the final ecdysis. Emergence traps are not able to accommodate this behavioural adaptation, which may explain the lower observed family-level diversity collected by traps in the present study. Similarly, many species require sunlight to emerge – more sunlight allows for faster drying times after ecdysis (Oliver Reference Oliver1971; Aoki Reference Aoki1999). The design of emergence traps is flawed in that they shade the collection area, likely preventing emergence of certain species into the trap. Although studies on this topic are limited (Oliver Reference Oliver1971; Aoki Reference Aoki1999), it is interesting to note that both the Hydropsychidae – the trichopteran family identified in our emergence trap samples – and many plecopteran families – the only order identified exclusively from samples collected in emergence traps – tend to emerge at night, on cloudier days, or during the day in areas with more shade (Ivković et al. Reference Ivković, Miliša, Previšić, Popijač and Mihaljević2013). This provides further evidence that much of the diversity detected in emergence traps will be limited to species that do not require bright sunlight and other specific conditions to emerge. Because exuviae are collected after ecdysis, collection does not disrupt the emergence process, thereby allowing for a fuller representation of insects collected.
The species composition of both exuviae and emergence trap samples collected in the present study varied with sampling location. In some cases, this variety appears to be a true difference in habitat preference by the species indicated. Plecoptera, which were detected in emergence traps on the creek, are known to primarily inhabit lotic environments (McRoberts and Grubbs Reference McRoberts and Grubbs2021), and Hydropsychidae (Trichoptera), which were detected in exuviae collected from the creek, are typically more abundant and diverse in lotic environments than are Phryganeidae (Trichoptera) (Houghton and DeWalt Reference Houghton and DeWalt2023; Houghton and Haack Reference Houghton and Haack2023), which were detected only in exuviae samples from the pond. Each Ephemeroptera family detected in the exuviae samples was collected only during one week of sampling: this could be expected because mayflies typically emerge in large numbers within a short period (Finn et al. Reference Finn, Johnson, Gerth, Arismendi and Li2022). Regardless, some of the differences in species composition by sampling method are more likely to be due to a combination of our small sample size and random sampling error. Five of the six odonate species detected from exuviae were found in the pond, but they are not known to be specialised for either pond or creek environments (Abbott et al. Reference Abbott, Bota-Sierra, Guralnick, Kalkman, González-Soriano and Novelo-Gutiérrez2022).
Both sampling methods collected samples that permitted detections of terrestrial species; for example, members of the order Thysanoptera were found in emergence trap samples. Other groups collected include various mites and spiders, which were also observed in exuviae samples. These may have been accidental occurrences: most of these species are small and could have been passively transported (by wind) to trap structures or onto the surface of the pond or creek. Nonetheless, exuviae samples had a higher relative abundance of amphibiotic insects compared to nonamphibiotic insects, suggesting that less environmental contamination occurs with this sampling method.
The differences detected in overall operational taxonomic unit composition between the sampling methods are due to the replacement of some species with others rather than a decrease in species richness. This may indicate limitations to emergence trapping, considering the traps not only detected fewer orders of amphibiotic insects but yielded more reads that corresponded to fully aquatic or terrestrial species. Our evidence indicates that differences in operational taxonomic unit richness between sampling methods may be due to high nontarget contamination occurring in emergence traps and better detection with emergence traps in lotic environments, a distinction that could be solved with improved exuviae collection methods in these environments.
Conclusion
Residual DNA found in amphibiotic insect exuviae can be isolated and used to identify a broad range of taxa via DNA metabarcoding, making skimming of the water surface and surrounding vegetation a viable method to replace the trap-based capture of insects as they emerge. Such an alternative collection method could also help to reduce the impact of mass collections on amphibiotic insect populations, which potentially can affect vulnerable species. As a potentially important new method in aquatic entomologists’ toolbox, the collection of residual DNA in amphibiotic insect exuviae should be explored further to improve sample size across lotic conditions and larger water bodies to determine the method’s reliability under different water conditions.
Acknowledgements
This study was supported by funding through the Canada First Research Excellence Fund to the University of Guelph’s “Food From Thought” research programme (Project 000054). The authors thank the Optimist Club of Kitchener–Waterloo for access to their site at Camp Heidelberg and Al Woodhouse for his help at the site. The authors also thank the peer reviewers and editors for providing comments that improved the manuscript.
Author contributions
Conceptualisation: S.L.D. Methods development: D.S. and S.L.D. Conducting research: S.L.D., M.T., K.A., and A.V. Data analysis: S.L.D. Data interpretation: S.L.D. and DS. Figure and table preparation: S.L.D. Writing: S.L.D. and D.S.
Competing interests
The authors declare that they have no competing interests.
Data availability
Raw data are available from the National Center for Biological Information Sequence Read Archive under accession number PRJNA1354807.


 Open access