INTRODUCTION
Schools are frequently identified as important settings for disease transmission [Reference Cauchemez1–Reference Heymann3]. They often contain large numbers of people, relatively immunologically naive, in close proximity. Numerous infectious disease outbreaks take place in schools, and it is expected that schools would feature heavily in any new epidemic of influenza and similar illnesses [Reference Cauchemez1, Reference McVernon4–Reference Baguelin6]. Therefore school closure has been considered as a possibility during an outbreak [Reference Brown7–Reference Milne19]. There are a number of reasons why school closure might take place, including staff illness, high levels of pupil absence, parental concern, or as an intervention to attempt to slow the spread of infection.
One likely result of school closure would be to reduce the amount of social contact between school children, and thus reduce incidence [Reference Heymann3, Reference Glass and Barnes9, Reference Vynnycky and Edmunds14, Reference Cauchemez20–Reference Heymann22]. While there are few studies that have measured the impact of disease-related school closure on contact patterns [Reference Jackson16, Reference Miller17], the impact of school holidays on contact patterns is better documented. Studies have shown that school pupils make considerably fewer social contacts each day during holiday periods than they do during term time [Reference Eames21, Reference Eames, Tilston and Edmunds23–Reference Hens25], and have predicted that the change in social contact patterns would lead to a reduction in the basic reproduction number of an influenza-like illness (ILI) of around 20–35% [Reference Eames21, Reference Hens25].
There are serious disadvantages to closing schools as a precautionary measure, including inconvenience, knock-on economic impacts caused by parental absenteeism from work, and alternative childcare costs [Reference Brown7, Reference House11, Reference Sadique, Adams and Edmunds15, Reference Smith26]. Furthermore, the usefulness of closing schools to prevent an epidemic from taking off is questionable: if school closure could only be feasibly continued for a short period of time its result – unless a mass vaccination campaign could be carried out during the period of closure – would be to delay an epidemic rather than to prevent it.
Of course, regular school closure, in the form of school holidays, does occur, and has a notable effect on disease dynamics. For example, during the 2009 H1N1pdm influenza epidemic in the UK two distinct waves of infection were observed; the first from May to July, which declined once schools closed for the summer, and the second from September to November, which began once schools reopened [Reference Eames21, Reference Baguelin27]. Had the school holidays not taken place, it is reasonable to suppose that there would have been a single large wave of influenza cases. School holidays have also been linked to a reduction in incidence of ILI in France [Reference Cauchemez20] and Israel [Reference Heymann22]. A review of school closures in relation to influenza can be found in Cauchemez et al. [Reference Cauchemez1]. Similar effects are seen for other childhood infections such as measles (e.g. [Reference Fine and Clarkson2]).
In the case of the 2009 H1N1pdm epidemic in the UK, the school holidays began when the epidemic was already well underway. What would have happened if the holidays had come at a different time? Would there have been any benefit of extending the holiday further into the autumn? Here, we attempt to answer these questions. We specifically consider school holidays because these are likely to occur in any future epidemic, independently of decisions made about reactive school closure, and second, because there are reasonable data about the impact of the school holidays on social mixing patterns.
Here we use mathematical models to explore the impact of planned school closures (i.e. school holidays) on epidemic behaviour, investigating the timing and duration of closure. We focus on two key epidemic properties, the total number of people infected and the peak incidence. The first of these is a natural way of quantifying the impact of an epidemic; from a public health perspective the latter is also important when considering the possibility of a healthcare system being overwhelmed by illness [Reference Ferguson8, Reference House11].
We first use a simple general approach to explore a range of different school closure scenarios and epidemic characteristics. Next, as a case study, we use an age-structured model that has been previously developed and fitted to the 2009 H1N1pdm epidemic in the UK [Reference Eames21]. Previous mathematical models of the effect of school holidays [Reference Glass and Barnes9, Reference Cauchemez20] and of reactive school closure [Reference Brown7, Reference Ferguson8, Reference House11–Reference Vynnycky and Edmunds14, Reference Hollingsworth18, Reference Milne19] have suffered from a lack of data about the changes in social contacts that take place during school holidays. Here, in contrast to previous models, we use social contact data collected from the UK population over the same period, explicitly quantifying the impact of school holidays on contact patterns [Reference Eames21].
METHODS
We use simple differential-equation models of epidemic spread. These models assume that individuals are either susceptible, infected (and infectious), or recovered (and immune), and represent an epidemic by considering rates of transition between these categories [Reference Keeling and Rohani28]. S(t), I(t), and R(t) are, respectively, the numbers of susceptible, infectious, and recovered individuals at time t, in a population of size N.
Each susceptible individual is assumed to become infected at a rate βI(t)/N, where β is the transmission parameter; infected individuals recover at a rate g. In such a model, the basic reproduction number, R 0 (the number of secondary cases caused by a single infection introduced into an otherwise susceptible population [Reference Keeling and Rohani28]), is given by β/g. In standard models β is assumed to be constant, but here we allow β to vary between term time and school holidays, reflecting the change in numbers of social contacts.
First, we use a homogeneously mixed susceptible-infectious-recovered (SIR) model described by the following set of equations:
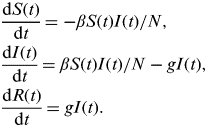 $$\eqalign{& \displaystyle{{{\rm d}S(t)} \over {{\rm d}t}} = - \beta S(t)I(t)/N, \cr & \displaystyle{{{\rm d}I(t)} \over {{\rm d}t}} = \beta S(t)I(t)/N - gI(t), \cr & \displaystyle{{{\rm d}R(t)} \over {{\rm d}t}} = gI(t).} $$
β takes the value β T during term time and β H during school holidays. Analogously to R 0 in the standard model, here we define R 0 T=β T/g and R 0 H=β H/g.
We use this model to explore the consequences of holiday timing and duration on the total number of cases (final size) occurring during an epidemic, and the maximum incidence over a 7-day period (the peak incidence). This simple model allows us to explore the epidemic impact over a wide range of parameters, in particular considering the duration of school holidays and the reduction in the transmission parameter, β, that occurs during the holidays.
Second, we use an extended susceptible-exposed-infectious-recovered (SEIR) version of this simple model that was developed with H1N1pdm influenza in mind [Reference Eames21, Reference Baguelin27]. The model is adapted from that above to include an ‘exposed’ class of individuals who are infected but not yet infectious, and the population is divided into four different age groups (0–4, 5–18, 19–64, ⩾65 years). The model is described by the following set of equations:
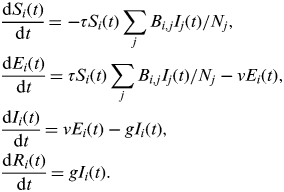 $$\eqalign{& \displaystyle{{{\rm d}S_i (t)} \over {{\rm d}t}} = - \tau S_i (t)\sum\limits_j {B_{i,j} I_j} (t)/N_j, \cr & \displaystyle{{{\rm d}E_i (t)} \over {{\rm d}t}} = \tau S_i (t)\sum\limits_j {B_{i,j} I_j (t)} /N_j - \nu E_i (t), \cr & \displaystyle{{{\rm d}I_i (t)} \over {{\rm d}t}} = \nu E_i (t) - gI_i (t), \cr & \displaystyle{{{\rm d}R_i (t)} \over {{\rm d}t}} = gI_i (t).} $$
Here, S i (t), E i (t), I i (t), and R i (t) are, respectively, the number of susceptible, exposed, infectious, and recovered/immune individuals in age group i at time t; N i is the number of people in age group i; ν is the rate at which individuals move from the exposed into the infectious class. In contrast to the simple model above, in this model β is replaced by τB, where τ is the transmission risk per contact per day and B is a matrix describing the number of social contacts per day between different age groups, taking the value B T during term time and B H during school holidays. Parameters as previously estimated are used: g = 0·56, ν = 1·0, τ = 0·029 (to two significant figures) [Reference Eames21, Reference Baguelin27]. B T and B H are taken from social mixing data collected during the pandemic through the UK flusurvey [29], an internet-based community surveillance system that also includes a social contact survey [Reference Eames21]. B T and B H have been used previously to give a good fit to the patterns of influenza incidence observed in the UK in 2009 [Reference Eames21]. To one decimal place, these are as follows:
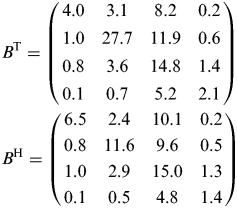 $$\eqalign{& B^{\rm T} = \left( {\matrix{ {4.0} & {3.1} & {8.2} & {0.2} \cr {1.0} & {27.7} & {11.9} & {0.6} \cr {0.8} & {3.6} & {14.8} & {1.4} \cr {0.1} & {0.7} & {5.2} & {2.1} \cr}} \right) \cr & B^{\rm H} = \left( {\matrix{ {6.5} & {2.4} & {10.1} & {0.2} \cr {0.8} & {11.6} & {9.6} & {0.5} \cr {1.0} & {2.9} & {15.0} & {1.3} \cr {0.1} & {0.5} & {4.8} & {1.4} \cr}} \right)} $$
This age-structured model estimated that the UK epidemic had a basic reproduction number of about 1·4 during term time and 0·9 during the holidays. We used values of pre-epidemic immunity as estimated elsewhere [Reference Eames21, Reference Baguelin27, Reference Miller30]. Assuming that everyone is susceptible at the start of the outbreak makes little difference to our results; most immunity is in older individuals, whose social mixing behaviour means that they are less likely than children to become infected. When reporting the final size, we report the fraction of the entire population infected during an epidemic.
In all the models, the population size is assumed to be constant. A single holiday period is considered. Epidemics are begun with 0·0001% of the population infected, and, if prevalence has fallen below this level, are re-seeded after the holiday period, under the assumption that movements into/out of a region would result in the introduction of a small number of new cases.
RESULTS
Homogeneous SIR model
The simple homogeneous model predicts that an outbreak will only grow if S/N>1/R 0, the well-known threshold for herd immunity [Reference Keeling and Rohani28]. The same model predicts that the final size (i.e. proportion of the population infected during the outbreak) of an outbreak that began with a small number of cases, r ∞, is the non-zero solution to the equation r ∞ = 1 – exp(−R 0 r ∞) [Reference Keeling and Rohani28]. An outbreak's final size is often considerably larger than the herd immunity threshold (Fig. 1). This happens because the number of cases increases until S(t)/N = 1/R 0 and thereafter declines; during this period of decline new cases continue to be generated – albeit each case causes <1 secondary infections. Because the decline begins from a high level of infection, a large number of additional cases are generated before the epidemic finally comes to an end. For example, an outbreak with R 0 = 1·5 would infect 65% of the population despite having a herd immunity threshold of 33%.
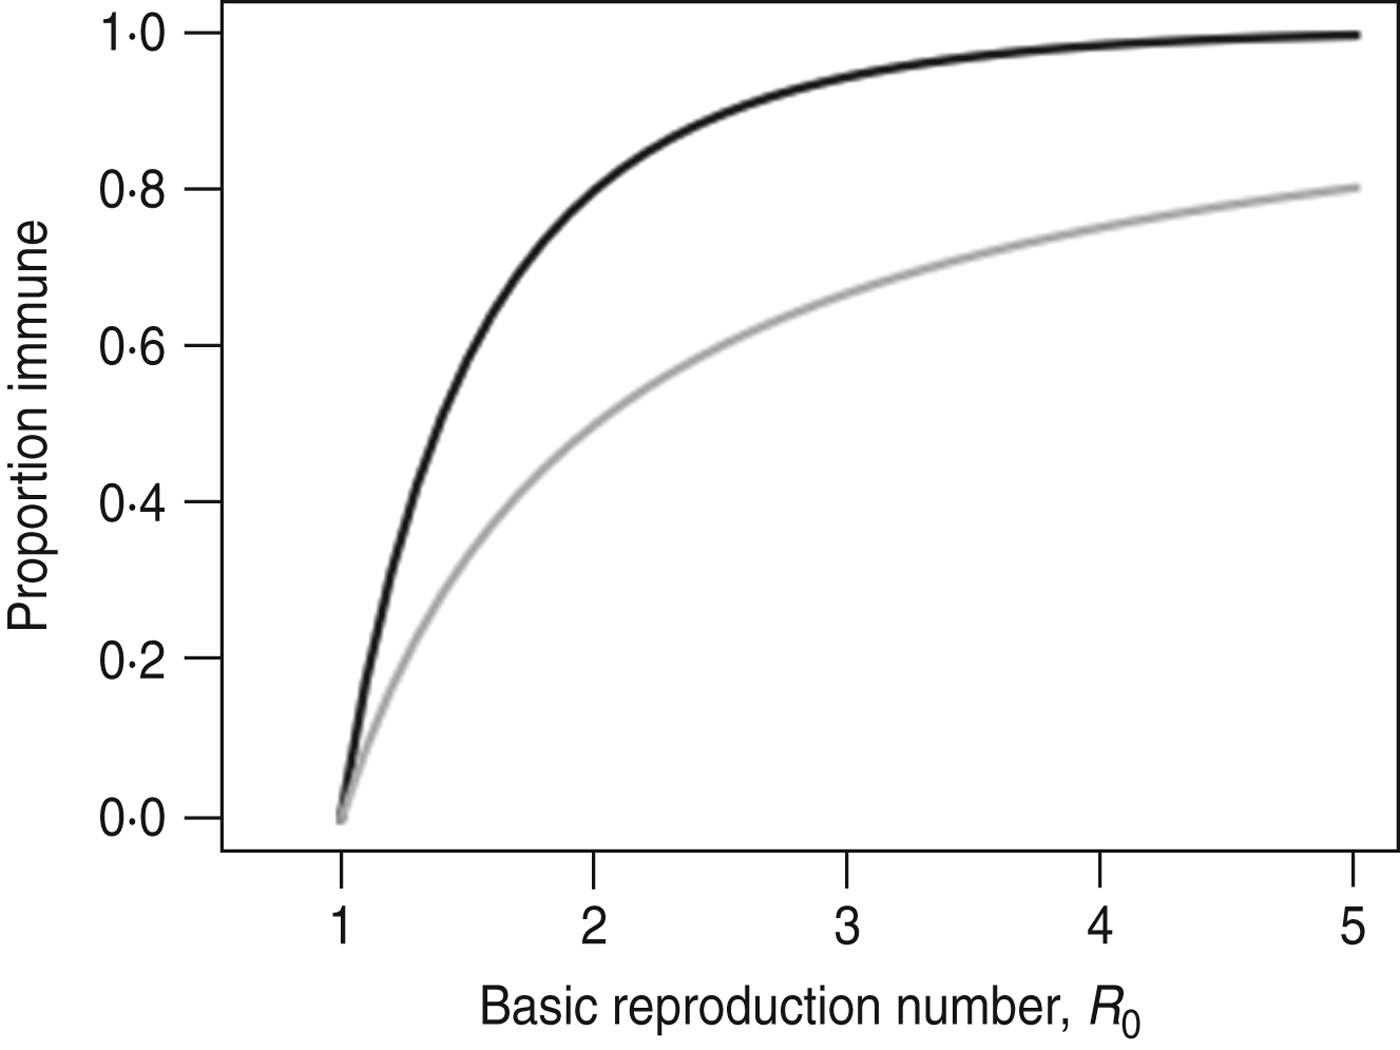
Fig. 1. Comparison of the final size of an epidemic following an outbreak (–––) and the herd immunity threshold (![]() ).
).
The final number of cases would be lower if the transmission rate were reduced once the epidemic had reached its peak. For example, if the peak occurred just before the school holidays began, then the fact that β H<β T would mean that fewer cases would be generated during the epidemic's decline than if the epidemic took place entirely during school term time; if β H = 0, and if the holiday lasted long enough for all cases to have recovered, then the final size of the outbreak would be (1–1/R 0 T). Given that social contacts do not cease during school holidays, the more likely effect is that holiday periods reduce transmission, allowing levels of immunity in the population to continue to rise as the epidemic declines.
The ideal situation would be for cases to have fallen to practically zero and for S to have been reduced to 1/R 0 T by the time schools reopened. This would prevent a second wave of infection from starting after schools reopened, and would restrict the final size to (1–1/R 0 T). However, for this to occur would require a fortunate sequence of events, with school closure, timing, duration, and effect on β combining serendipitously. If school closure happened too late then it would have little impact on the epidemic, whereas if it happened too early then there would be enough susceptible individuals remaining when schools reopened for a second wave of infection to take off.
Figure 2 shows the impact of holiday timing on the peak weekly incidence and final size of an outbreak with influenza-like parameters. When R 0 T = 1·5, starting the holiday at the ‘right’ time can lead to a reduction in final size of 41% (from 58·3% to 34·5%) and in peak weekly incidence of 71% (from 21·9% to 6·3%). We observe that the impact on the epidemic peak is much larger than on the final size. A well-placed holiday can cut an epidemic off in its prime; even if a post-holiday wave does occur the effect will be to convert a single high-peak epidemic into an epidemic with two lower peaks.

Fig. 2. Epidemic impact of a 40-day holiday over a range of holiday timings (days after start of outbreak). Final size is shown in black, peak weekly incidence in grey. Two situations are explored: R 0 T = 1·5 (crosses) and R 0 T = 2 (circles); g = 0·5 and β H/β T = 2/3. Note that optimal impact on final size and on peak height do not occur at the same time.
The possible impact of a holiday period depends on its effect on β and on the duration of the closure. Figure 3 shows the result of an optimally timed holiday, over a range of values of the holiday duration (horizontal axes) and the reduction in the transmission parameter during the holiday (vertical axes). Figure 3(a, b) shows the final size and peak weekly incidence, respectively, for an optimally timed holiday; Figure 3(c, d) shows the holiday timing – days into the epidemic – that minimizes the final size and peak incidence, respectively; Figure 3(d, e) shows the holiday timing – outbreak size at the start of the holiday as a fraction of the holiday-free final size – that minimizes the final size and peak incidence, respectively.

Fig. 3. The effect of an optimally timed holiday period on the impact of an epidemic. Here, holiday periods of different durations (horizontal axes) and different reductions in the transmission parameter (vertical axes) are considered. The impact of an epidemic is measured in terms of the minimum final size [left column: (a), (c), (e)] and the minimum peak weekly incidence [right column: (b), (d), (f)]. (a) Final size for an optimally timed holiday; (b) peak weekly incidence for an optimally timed holiday; (c) optimal closure timing (days after outbreak start) to minimize the final size; (d) optimal closure timing (days after outbreak start) to minimize the peak incidence; (e) optimal closure epidemic size (fraction of holiday-free final size) to minimize the final size; (f) optimal closure epidemic size (fraction of holiday-free final size) to minimize the peak incidence. Fixed parameters: g = 0·5; β T = 0·75 (giving R 0 T = 1·5). β H and the length of the holiday are varied.
As can be seen, the longer the period of closure lasts, the lower the final size (Fig. 3 a) and peak incidence (Fig. 3 b). However, even a short closure can have a substantial impact on peak incidence by splitting an epidemic into two waves, (Fig. 3 b). Somewhat counter-intuitively, school closure can be less beneficial if transmission is reduced to too low a level during the holiday – some transmission during the closure, albeit at a low level, is useful for depleting the reserves of susceptibles and reducing the size of any second wave of infection when schools reopen.
Minimizing the peak incidence requires the holiday to occur earlier in the outbreak than does minimizing the final size (Figs 2, 3 c, d). Holidays with longer duration and lower impact on the transmission rate need to occur earlier in the outbreak to have optimal effect on either peak or final size. For holidays lasting 45 days, causing a reduction of around 33% in transmission (values similar to those in the UK in 2009), the optimal timing for minimizing the final size would be for the holiday to commence once the epidemic had reached around a third of its holiday-free final size (Fig. 3 e). To minimize the peak, the optimal timing would be when the epidemic had reached around 10% of its holiday-free final size (Fig. 3 f).
Age-structured influenza model
For the more complex age-structured model fitted to H1N1pdm influenza in the UK, we also see considerable effects of school holiday timing. Figure 4 shows the epidemic as it occurred and the model prediction of what would have happened if schools had not closed for the summer holidays. Without the holidays, in the absence of other interventions, the final size (24·2% vs. 20·3%) would have been higher, as would the peak weekly incidence (5·2% vs. 1·9%).
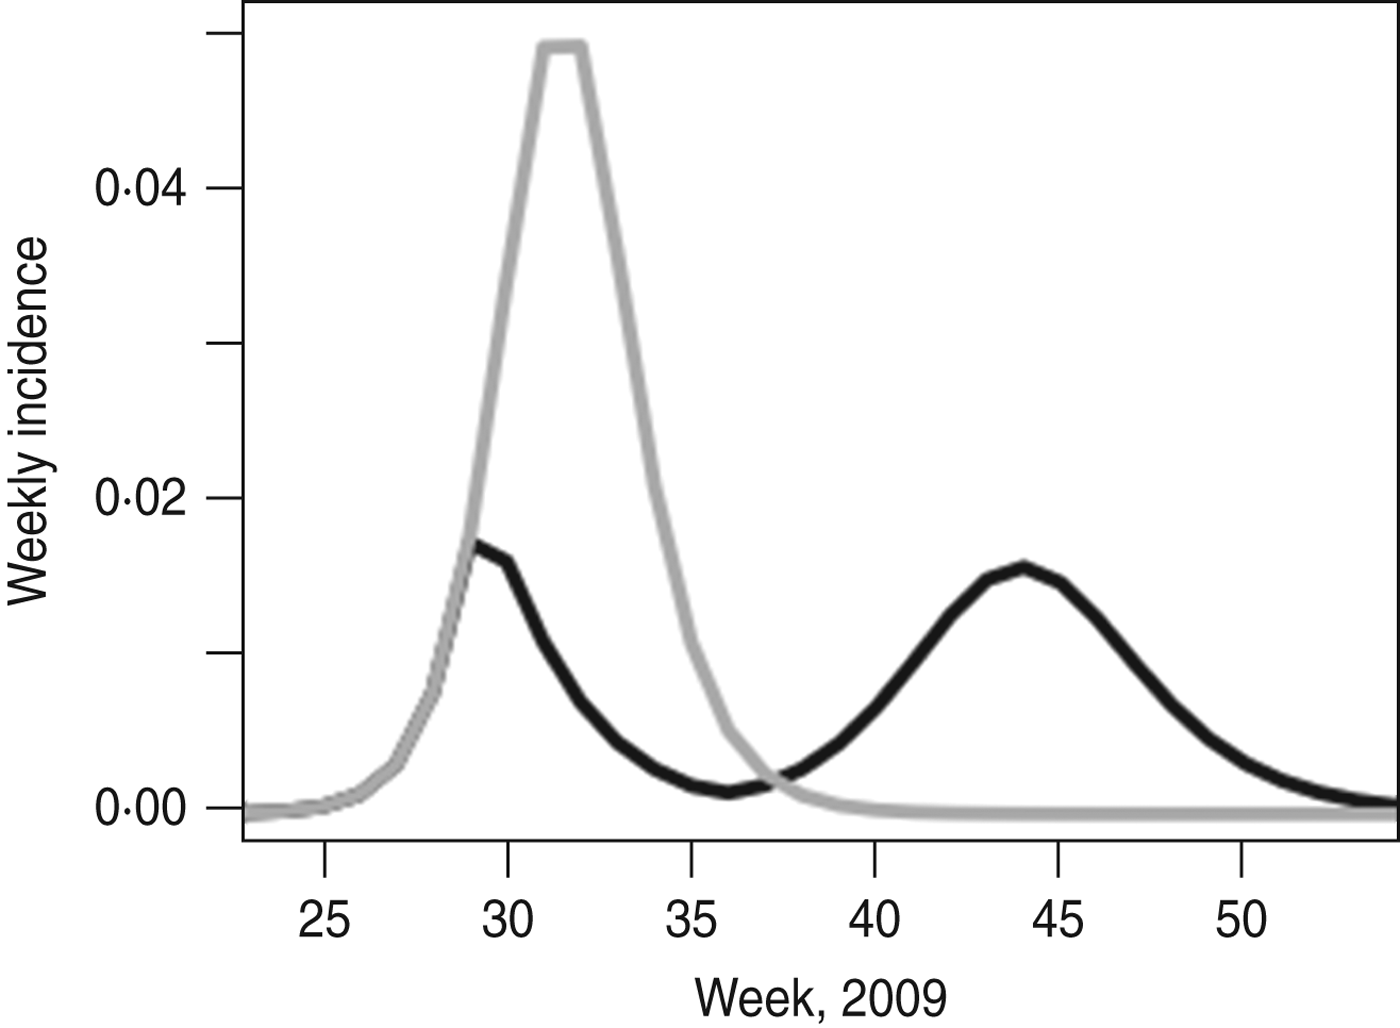
Fig. 4. UK 2009 H1N1pdm with and without the school holiday. The black line shows the best fit of the model to the epidemic as it took place; the grey line shows the model prediction of what would have happened if the summer holiday had not taken place. Model parameters are taken from [Reference Eames21].
Figure 5 shows the model predictions for what would have happened during the 2009 epidemic if the summer holidays had occurred at a different time. The minimum final size is 15·6%, and the minimum peak weekly incidence is 1·8%; thus, an optimally timed holiday could have led to a reduction in final size of 36% and in peak incidence of 64% (compared to no holiday). The holiday in summer 2009 occurred at almost the perfect moment in terms of minimizing the peak incidence, although if it had begun a week or two later the final size would have been smaller.

Fig. 5. (a) Epidemic behaviour for shifted holiday periods. The black line shows the holidays as they occurred. Grey lines show holidays starting earlier (5, 10, 15 days earlier); dashed black lines show holidays starting later (5, 10, 15 days later). (b) As in Figure 2, but with the H1N1pdm UK model, showing the impact of holiday timing on the final size (left axis) and peak weekly incidence (right axis). Black lines, final size; circles, peak height (black circles indicate peak week occurs after the holidays; white circles indicate peak week occurs before the holidays; grey circles indicate peak week straddles the start of the holidays). (c) As in Figure 5 b, but including different lengths of holidays. The solid lines show the holiday length as it was in summer 2009; dashed lines show holidays starting at the same time but with duration ±2 weeks and ±4 weeks. The black lines (left axis) show the final size; the grey lines (right axis) show the peak incidence.
As in the simple model, it is not possible to minimize both the peak and the final size (Fig. 5 a); an earlier closure gives a lower peak, since it breaks the epidemic into two waves, but at the expense of a larger final size overall. We see (Fig. 5 b) that, as might be expected, the week of peak incidence takes place entirely before or entirely after the holidays, or straddles the start of the holiday. A longer holiday could further reduce the final size of the outbreak, but, as in the SIR model, the length of holiday makes little difference to peak incidence – once the epidemic has been interrupted the length of the interruption is fairly unimportant (Fig. 5 c).
We see similar results for larger R 0 (Fig. 6). We keep the infectious period constant and increase R 0 by increasing the transmission parameter, τ; here, R 0 T = 2 and R 0 H≈1·3. Since in this case R 0 H > 1, it is possible to have an epidemic that takes place almost entirely during the holiday period. In this example, therefore, school closure might seem unhelpful, since incidence can continue to grow during the holiday, but in fact this ‘holiday time epidemic’ is considerably smaller – in terms of final size and peak incidence – than a term-time epidemic would be. Here, the peak week of the epidemic can occur during the holiday period (Fig. 6 b). In this case, an optimally timed holiday could have led to a reduction in final size of 21% (from 46·6% to 37·0%) and in peak weekly incidence of 70% (from 18·2% to 5·5%). Once again, extending the holiday potentially makes more difference to final size than to peak incidence; in this situation, an advantage of a longer holiday is that it is less important exactly when the holiday begins (Fig. 6 c).

Fig. 6. As in Figure 5, but with τ = 0·04, resulting in larger R 0. In panel (b) the grey circles without borders denote that the peak week entirely takes place during the holidays.
DISCUSSION
In contrast to unplanned school closures, holidays happen regularly; their influence on social mixing patterns is now reasonably well known and their impact on an epidemic can therefore be estimated. Holiday periods are associated with a reduction in transmission of close contact infections such as influenza, and therefore holidays can interrupt epidemic spread, resulting in a reduced final size and reduced peak incidence. As noted elsewhere [Reference Ferguson8, Reference Hollingsworth18, Reference Milne19], the effect on peak incidence may be larger than that on final size.
The simple SIR model allows an exploration of a range of scenarios and parameters. More complex individual-based models have been developed to predict the impact of interventions [Reference Milne19]; as with simple models, the results are sensitive to assumptions made about the impact of school closure on social contact patterns (see [Reference Milne19] for a comparison of different individual-based models). The age-structured SEIR model used here allows the incorporation of social contact data collected from the UK population during the 2009 H1N1pdm influenza epidemic.
The timing of holidays has a clear impact on their effect. In agreement with Hollingsworth et al. [Reference Hollingsworth18] but in contrast to Glass & Barnes [Reference Glass and Barnes9], we find that the greatest benefit is achieved when the holiday begins after a substantial number of people have already been infected. However, it is not possible to minimize both the peak and the final size. Therefore, if it were decided to attempt to adjust the timings of a holiday in an epidemic situation, a decision would need to be taken about what, precisely, the aim was. The final size of an outbreak, i.e. the total number of people infected, may be expected to be the most important consideration in terms of illness and deaths. However, a large epidemic peak can cause concerns about the functioning of a health system: GPs’ surgeries and hospitals may be overwhelmed, for example, with knock-on consequences for managing other health conditions [Reference House11]; similarly, high levels of absenteeism over a short period of time might be more disruptive than lower levels for a longer period, even if these lower levels result in more days of work missed.
We have seen that further extending holidays makes little difference to the epidemic peak, although longer holidays can help reduce the final size by allowing a gradual depletion of susceptibles. Short holidays of 2–3 weeks can have a large effect on the peak incidence, so if the prime concern is about the peak of an epidemic, then a short school closure may be worthwhile even though it may have little impact on final epidemic size. From a population health point of view, holidays are useful for two reasons: they allow prevalence levels to fall, and they allow the population to gradually acquire additional immunity. Thus, there is little to be gained from continuing to extend a holiday once prevalence has reached very low levels.
Shutting schools at the onset of an outbreak only to reopen them 6 weeks later would give little benefit unless it were possible to introduce other control measures, e.g. vaccination, during those 6 weeks [Reference Hollingsworth18]. If the 2009 influenza pandemic experience is repeated [Reference Baguelin27], the prospect of having sufficient vaccine doses available to make an impact at the population level in such a time period is unlikely. However, if stocks were available there might be scope to use the time to immunize groups at particularly high risk of serious disease, e.g. pregnant women or people with underlying health conditions.
The work presented here has been performed with influenza in mind, prompted by the effect of school holidays on the 2009 epidemic in the UK. It is expected that similar effects would be seen for other infections, particularly those that have a high attack rate in school-aged children, whose social contact behaviour changes markedly during holiday periods. All else being equal, the impact of holidays would be greatest for infections with a short generation time, for which an epidemic could make sufficient ‘slow progress’ during the holiday to make a difference to its behaviour once the holiday ends.
In practice, it may be felt that there is no flexibility in school holiday timings, and that holidays will continue to take place exactly as planned, even in the face of an ongoing epidemic. In reality, it is unlikely that it would be possible to predict the optimal time to start a holiday, especially if the decision had to be made some time in advance. However, a shift of a week or two in holiday timing can make a marked difference to the impact of an outbreak, and should be considered. Unplanned school closures are expected to be highly disruptive, but school holidays occur whether or not an epidemic is taking place. It seems reasonable, therefore, to consider the possibility of allowing some flexibility in holiday timing – with as much warning as possible for schools, parents, and carers – in order to gain the maximum health benefit from the holiday period.
ACKNOWLEDGEMENTS
This report is independent research arising from a Career Development Fellowship supported by the National Institute for Health Research (grant no. NIHR-CDF-2011-04-019). The views expressed in this publication are those of the author and not necessarily those of the NHS, the National Institute of Health Research or the Department of Health. The author thanks Marc Baguelin and members of the Centre for the Mathematical Modelling of Infectious Diseases at the London School of Hygiene and Tropical Medicine for useful discussions.
DECLARATION OF INTEREST
None.


