Dietary guidelines in the USA and in France have stressed the important contribution of milk and milk products to a healthy diet( 1 , 2 ). Milk, yogurt and cheese are the principal dietary sources of Ca and vitamin D, identified as nutrients of concern in both French and American diets( 1 , Reference Clerfeuille, Maillot and Verger 3 ). A diversified source of bone-building ‘lactonutrients’, dairy products contribute important amounts of high-quality protein, P and K( Reference Clerfeuille, Maillot and Verger 3 – Reference Drewnowski 7 ). On the basis of modelled food patterns, the US and French dietary guidelines for Ca cannot be met in the absence of milk or dairy products( Reference Fulgoni, Keast and Auestad 8 ).
On the basis of analyses of dietary patterns, milk and dairy products have been classified as nutrient-rich foods (NRF), supplying substantially more nutrients than energy to the total diet( Reference Drewnowski 7 , Reference Drewnowski 9 ). However, milk and milk products also contain naturally occurring SFA and Na and can contain added Na or added sugars. Although some dairy products are of low energy density, others can be high in energy per 100 g or per serving. Nutrient profiling models have balanced beneficial nutrients against nutrients to limit to arrive at overall scores of nutritional value. Both the SAIN,LIM( Reference Darmon, Vieux and Maillot 10 ) and the NRF indices( Reference Drewnowski 9 , Reference Drewnowski and Fulgoni 11 , Reference Fulgoni, Keast and Drewnowski 12 ) used the foods’ content of SFA, added sugar and Na to create a composite score of nutrients to limit (LIM).
European regulations require that a product contain >15 % daily value (DV) of a given nutrient per reference amount to be considered a ‘good’ source of that nutrient. Given that the reference daily value for Ca in France is 800 mg, 15 % DV translates into 120 mg of Ca. We therefore calculated the amounts of energy (kJ (kcal)), LIM scores and monetary costs (€) associated with the provision of 120 mg of Ca by a wide variety of milks and dairy product. The goal was to identify those categories of dairy products that provided 120 mg Ca at low cost, while minimising energy, Na, added sugars and SFA.
The present approach built on previously published value metrics estimating nutrients per unit cost( Reference Drewnowski 13 , Reference Drewnowski and Rehm 14 ). The Affordable Nutrition Index( Reference Drewnowski 15 ) and other measures, based on national food prices in the USA, were intended to identify those food groups and individual foods that were nutrient rich, had low energy density and were affordable. One such study( Reference Drewnowski and Rehm 14 ), applied to school lunch programmes in the USA, showed that potatoes and beans provided most nutrients per penny. The present metrics extended this approach to the study of dietary Ca, provided by a range of dairy products in France.
Methods
Dairy products database
The dairy products database (n 837) was created to represent different types of milks, yogurts and cheeses in the French food supply. Data on patterns of dairy consumption in France were obtained from the National Milk Industry Interprofessional Center( 16 ). These data were based on the Kantar consumer panel (available on the French National Interprofessional Center for the Dairy Economy (Centre National Interprofessionnel de l'Économie Laitière) (CNIEL) website) and on consumption data obtained from the Association of Milk Processors( 17 ). The 837 milks and dairy products were divided into four major groups, following industry standards. The first group (n 101) was fluid milks (whole, low fat, skimmed and flavoured). The second group was fermented milks, including plain, flavoured and ‘light’ yogurts and yogurts with fruit (n 326). The third group was Greek yogurts, dairy desserts and dessert creams (n 162). The very heterogeneous cheese category (n 248) included soft and hard cheeses, blue cheeses, cream cheeses and processed and low-fat cheeses. Cluster analyses, conducted within each of the four major groups, served to create twenty-one product categories.
Nutrient composition database
Energy and nutrient composition data for the 837 milk and dairy products were obtained from multiple sources, including the product label and the publicly available French nutrient composition database (CIQUAL 2012) maintained by the French Agency for Food, Environmental, and Occupational Health and Safety( 18 ). Additional information was obtained from vendors, company websites and from CNIEL( 19 ). Data were obtained for energy, Ca, SFA, total sugars and Na. Added sugars in yogurts and in flavoured milks were estimated on the basis of data for total sugars and lactose in milk in the CIQUAL nutrient composition table( 18 ). Plain fluid milks, plain yogurts and most cheeses do not contain added sugars. Nutrient composition of food was expressed per 100 g of edible portion.
Serving sizes
To calculate Ca content by serving size, we used serving sizes corresponding to the manufacturers’ recommendations for fluid milk (200 ml), fermented milks (yogurts) (125 g), dairy desserts (125 g) and cheeses (30 g). For comparison purposes, the Reference Amounts Customarily Consumed used by the US Food and Drug Administration for labelling and regulatory purposes are set at 240 ml for fluid milk, 225 g for yogurt, about 100 g for ice cream (half cup equivalent) and 30 g for most cheeses( 20 ).
Retail prices for milk and dairy products
To establish nutrient composition and retail price of branded items, fresh dairy products (all types and all brands) were systematically purchased from six Paris supermarkets in 2013 (Carrefour, Auchan, E.Leclerc, Système U, lntermarché and Cora). Data for fluid milks were obtained from three large supermarkets (Carrefour, Auchan and E.Leclerc) and data for cheeses from Auchan and E.Leclerc. For national brands such as Danone, retail prices were obtained from company websites. The pricing of foods followed consistent rules, with prices based on the most-common packaging. For example, yogurts in France are sold in units of four, whereas ‘Petits Suisse’ fresh cheese is sold in units of twelve. All prices were converted to 100 g. The cost vector (euros/100 g) was then added to the nutrient composition database.
The LIMiting nutrients score
Reference values for SFA, added sugars and Na – also based on French standards( 21 ) – were used to create the LIM nutrient density score, a part of the SAIN,LIM nutrient density model( Reference Darmon, Vieux and Maillot 10 ). LIM stands for nutrients to LIMit in the SAIn,LIM model. The French standards were 3153 mg/d for Na, 22 g/d for SFA and 50 g/d for added sugars, based on a standard 8368 kJ/d (2000 kcal/d) diet. The previously developed and validated LIM score was the mean of % DV for SFA, added sugar and Na, with all DV calculated per 100 g. The algorithms for the LIM subscore had been published before( Reference Darmon, Vieux and Maillot 10 , Reference Drewnowski 13 ).
In past studies, LIM has been expressed per 100 g( Reference Darmon, Vieux and Maillot 10 ) and per 418.4 kJ (100 kcal)( Reference Drewnowski, Maillot and Darmon 22 ). The usual serving sizes of milk and dairy products can vary from 30 g (cheeses) to 200 ml (fluid milk). Nutrient profiling methods based on 100 g have had difficulty in accommodating diverse serving sizes( Reference Drewnowski and Fulgoni 11 ). LIM values were therefore also calculated per serving.
The energy, monetary and LIM costs of meeting 15 % daily value for calcium
All calculations used % DV based on the French reference for daily intakes( 21 ). Given that French standards for Ca are set at 800 mg/d, all calculations were based on 15 % DV, equivalent to 120 mg Ca. The amount of energy (kJ (kcal)), volume (g), nutrients to limit (LIM score) and monetary costs (€) that were associated with the provision of 120 mg Ca per reference amount were calculated for each dairy product.
To calculate LIM scores associated with meeting the 15 % DV Ca requirement, the weight of product providing 15 % DV Ca requirement was calculated first. Then, the LIM score for that weight of product was calculated as follows:
 $$\eqalign{ \scriptstyle{{\rm LIM}\,{\rm (15\,\%\,}\,{\rm DV}\,{\rm Ca){\equals}}}\cr&\quad={{{{{\rm Na}\,{\rm (15\,\%\,}\,{\rm DV}\,{\rm Ca)}} \over {3153}}{\plus}{{{\rm SF}{\rm A}\,{\rm (15\,\%\,}\,{\rm DV}\,{\rm Ca)}} \over {22}}{\plus}{{{\rm added}\,\,{\rm sugar}\,({\rm 15\,\%\,}\,{\rm DV}\,{\rm Ca)}} \over {50}}} \over \scriptstyle{3}}\scriptstyle{{\times}100.$$
A value of 0 indicated that the product provided 15 % DV Ca and no nutrients to limit, whereas a value of 100 indicated that the product supplied 15 % DV Ca as well as the maximum recommended amount of nutrients per limit. A value of 15 indicated that the product provides as much Ca as nutrients to limit.
To identify best sources of Ca at the lowest cost, we used a novel value metric that combined monetary cost and the LIM score: price (15 % DV Ca)×LIM (15 % DV Ca). Lower scores identified those dairy products that met 15 % DV for Ca at low cost and had the lowest LIM score.
Statistical analyses
All analyses were performed using the Statistical Package for the Social Sciences version 11.0. Comparisons between means using one-way ANOVA were the principal analyses performed. An α level of 0·05 was used to determine statistical significance.
Results
Cluster analyses to identify twenty-one product categories
The four major groups of dairy products – milks, fermented milks, desserts and cheeses – vary greatly in nutrient composition. Although fluid milks are comparable in terms of energy and Ca content, fermented milks and cheeses most definitely are not. Greek yogurts contain more protein but also more fat than does regular yogurts and tend to be classed with desserts.
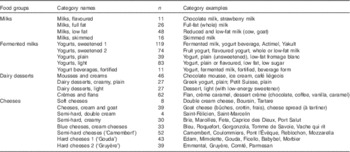
Cluster analyses, conducted within each of the four major dairy groups, were used to create meaningful product categories on the basis of nutrient composition. The clustering variables – energy, SFA, added sugars and Na – were expressed per 100 g product or in amounts associated with 15 % DV for Ca. As noted above, SFA, added sugar and Na constitute the LIM component of the SAIN,LIM nutrient profiling model (10). The method used was hierarchical clustering using Ward’s criteria for Euclidean distances between items. Dendrograms were used to assign items into a variable number of clusters per major dairy group, for a total of twenty-one categories in all. As shown in Table 1, milks were divided into skimmed, low-fat, whole and flavoured milks, an assignment in line with industry standards. Fermented milks were divided into categories corresponding to sweetened yogurts (solid and beverage forms), plain yogurts, light yogurts and fortified yogurt beverages, also in line with industry standards. Cheeses were subdivided into eight categories. Table 1 shows the twenty-one categories and lists key examples within each.
Table 1 Milks and dairy products (n 837) aggregated to four major dairy food groups and twenty-one product categories
Energy and nutrient profiles by food group and category
Table 2 shows the energy and nutrient profiles for the twenty-one categories, along with cost in euros, calculated per 100 g reference amount. Milks, including flavoured milks, had the lowest energy density, the lowest LIM scores and the lowest € cost (all P<0·001). Fresh dairy products (yogurts) came next, followed by light dairy desserts and plain creamy dairy products. Cheeses had the highest Ca content per 100 g but were also associated with the highest energy density, higher monetary cost (€) and higher LIM scores, all calculated per 100 g.
Table 2 Calcium content, energy density, monetary cost and LIM scores per 100 g for four dairy food groups and twenty-one categories (Mean values and standard deviations)
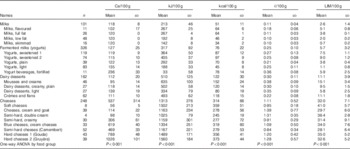
The amounts of Ca provided by the twenty-one categories of dairy products were highly variable, ranging almost 20-fold, from 56 mg/100 g (soft cheese) to 1026 mg/100 g (Emmenthal). The amount of Ca provided by fluid milk and yogurt was in the order of 120 mg/100 g.
Energy density of milk and dairy products varied 10-fold from 142·3 kJ/100 g (34 kcal/100 g) for skimmed milk to 1560·6 kJ/100 g (373 kcal/100 g) for hard cheese. Cost per 100 g varied >10-fold, from 0·10 euros/100 g for skimmed milk to 1·39 euros/100 g for goat cheese. LIM scores, tracking nutrients to limit, varied from a very favourable 0·7 (skimmed milk) to a less favourable 41·0 (soft cheese). As demonstrated in Table 2, dairy products, milk, yogurts and cheese were extremely heterogeneous with respect to Ca content, energy density and cost (€).
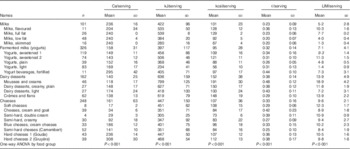
Milks and dairy products were also heterogeneous in terms of recommended servings, which varied from 30 g to 200 ml. Table 3 shows the energy and nutrient profiles per serving for the four groups and the twenty-one categories. There were still significant differences in Ca content per serving across groups. Milks and fresh dairy products provided larger amounts of Ca per serving than did dairy desserts and most cheeses. Although milks and fresh dairy products provided 140–240 mg of Ca per servings, cheeses remained a very heterogeneous group. The monetary cost per serving was lower for milk group than for the cheese group, and the associated LIM scores were lower as well.
Table 3 Calcium content, energy, monetary cost and the LIM scores per recommended serving for four dairy food groups and twenty-one categories (Mean values and standard deviations)
Meeting calcium requirements at low cost
The new metrics aimed to identify those dairy categories that provided 120 mg Ca per reference amount (serving) without excessive energy or nutrients to limit and at low monetary cost. Table 4 shows, for different groups and categories of dairy products, the weight of product (g), energy (kJ (kcal)), monetary cost (euros) and LIM scores that were associated, respectively, with the provision of 120 mg of Ca per serving.
Table 4 Weight, energy, monetary cost and the LIM scores associated with meeting 15 % daily values (DV) calcium for four dairy food groups and twenty-one categories (Means values and standard deviations)
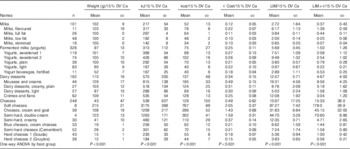
First, the amount of energy associated with the provision of 120 mg Ca was significantly lower for fresh dairy products – fluid milks and yogurts – as compared with cheeses or dairy desserts (P<0·001). However, given that the energy density of cheeses greatly exceeds the energy density of milk and yogurt, some cheeses were able to provide Ca in a relatively small portion. Table 4 shows the weight of products (g) associated with 120 mg Ca. Ca-rich products such as hard and semi-hard cheeses, followed by fortified yogurt, provided Ca in small portions. By contrast, soft and cream cheeses, mousses and creams required a large volume to provide 120 mg Ca.
As shown in Table 4, fresh dairy products, especially plain milks, were the most affordable Ca source. Even though cheeses as a group were more expensive, some Ca-rich hard cheeses were an affordable Ca source. Also shown are the LIM scores for each food group and category. LIM scores per 15 % DV Ca were significantly lower for fresh dairy products, fluid milks and yogurts as compared with cheeses or to dairy desserts (P<0·001). The lowest LIM scores per 15 % DV Ca were observed for skimmed milk and light yogurts, and the highest LIM scores were observed for double cream and cream cheeses. The LIM×€ price index – a novel measure – was likewise most favourable for fresh dairy products, milks and yogurts than for desserts or cheeses. The combined LIM price index was obtained by multiplying LIM score for each product by its monetary cost in euros.
The cheeses’ category was very heterogeneous in terms of energy density, Ca content and cost. Ca-rich hard cheeses (Comté, Gruyère, Gouda), semi-hard cheeses (Camembert) and blue cheeses (Roquefort) followed fresh dairy products in supplying Ca at low LIM and monetary cost. All cross-group comparisons based on one-way ANOVA were significant (P<0·001).
The interrelations between Ca content per serving and the cost in energy and LIM scores are illustrated further in Fig. 1. Ca content per serving is indicated on the y-axis and the 15 % DV (120 mg) is indicated by a broken line. The size of each bubble reflected the cost in euros associated with the provision of 120 mg of Ca.
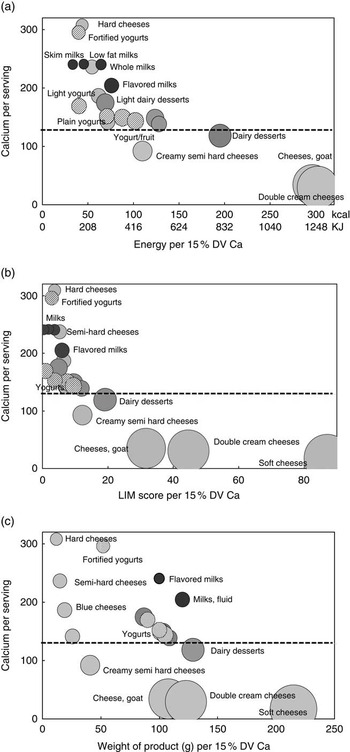
Fig. 1 The relation between mean amount of calcium per serving (y-axis) and (a) mean amount of energy (kJ (kcal)) associated with obtaining 15 % daily value (DV) calcium, (b) LIM score associated with obtaining 15 % DV calcium and (c) mean gram weight of products associated with obtaining 15 % DV calcium. Size of the bubble denotes cost in euros associated with obtaining 15 % DV calcium. The data are for twenty-one product categories in four major groups: milks (![]() ), yogurts (
), yogurts (![]() ), desserts (
), desserts (![]() ) and cheeses (
) and cheeses (![]() ).
).
Fig. 1(a) shows the relation between the amount of Ca per serving and energy cost associated with 15 % DV Ca (kJ 502·1 mg (kcal/120 mg) Ca). It can be seen that most dairy products provided more (or much more) than 120 mg Ca per serving. Fresh dairy products and hard cheeses provided Ca at the lowest energy cost.
Fig. 1(b) shows LIM scores associated with 15 % DV Ca. Again, milks, yogurts and some cheeses provided Ca at low LIM cost. Product amounts, shown in Fig. 1(c) show that the most Ca-rich cheeses, along with flavoured yogurts, provided Ca within a relatively compact product volume.
Discussion
The present analyses of a large number of dairy products in France showed that the French Ca requirements( 21 ) could be met by a wide variety of dairy products at an affordable cost and without excessive energy or nutrients to limit (LIM). Dairy products are the principal source of dietary Ca in France( Reference Coudray 23 ) and in the USA( Reference Drewnowski 7 ). Fluid milks and yogurt had three advantages: (1) low Ca price index; (2) low energy density; and (3) low amount of energy associated with meeting Ca requirements. Interestingly, some cheeses had favourable price index values but were associated with higher energy density.
Foods and food groups that provide relatively more nutrients than energy can be classified as nutrient rich( Reference Drewnowski 7 , Reference Coudray 23 ). For example, although milk and milk products contributed only 10–13 % of dietary energy to the American diet, this food group was among the main dietary sources of several key micronutrients( Reference Drewnowski 7 ). Although some foods may contribute more energy than nutrients, milk and dairy products tend to provide more nutrients than energy. Being able to separate nutrient-rich from energy-dense foods is one important aspect of nutrition education and guidance and being able to identify affordable NRF is another.
New value metrics have helped to identify foods that were affordable, accessible and nutrient rich( Reference Drewnowski 13 ). These metrics, developed for selected foods in the US and in the French food supply, were based on calculations of nutrients per energy and nutrients per unit cost( Reference Drewnowski 9 , Reference Darmon, Darmon and Maillot 24 ). We have now adapted these metrics to analyses of milk and dairy products in France. As might be expected, milks and dairy products – including cheeses – were very heterogeneous. Although all dairy products contained Ca, the Ca content varied sharply across product categories as did the associated energy and some nutrients of public health concern. Plain fluid milks provided 120 mg Ca at the lowest price and at the lowest energy and LIM cost. Fresh plain and ‘light’ yogurts and fermented milks were next, followed by sweetened yogurts and flavoured milks, all provided at relatively low cost. Light dairy desserts had low energy and low LIM scores but were more expensive. Cheeses were a very heterogeneous category. Ca-rich hard cheeses were comparable to plain yogurts in terms of Ca costs. Semi-hard and blue cheeses were comparable on most metrics to sweetened yogurts and flavoured milks. However, double cream and soft cheeses, along with goat cheeses, had a relatively low Ca content per serving and were less-than-optimal Ca sources.
Nutrient profiling techniques can help consumers identify NRF in relation to cost, can help them make better food choices and improve the quality of their diets. The joining of the nutrient composition and price databases opens the door to new studies on foods’ nutritive value in relation to their monetary cost.
Better measures of nutrient affordability can be created by calculating nutrients per unit cost. Ca density per serving multiplied by food prices per serving was the basis of the Ca-affordability score.
The present model examined the cost associated with meeting Ca guidelines, taking into account the foods’ content of SFA, added sugar and Na. To be truly useful, such models need to take into account food prices and the frequency of consumption.
Consumers select foods on the basis of taste, cost, convenience and nutritional value. Low-income consumers faced with budgetary constraints may opt for lower-cost foods of high energy density but potentially lower nutritional value. The present calculations, thus far limited in scope to a selected number of food subgroups, illustrate how the econometric approach to nutrient profiling can help identify affordable NRF within each food group.
Conclusions
Clearly, Ca requirements from dairy products can be met at very different levels of energy and cost. The wide range of dairy options ensures that the Ca requirements (15 % DV for Ca per serving) are met, while minimising energy, added sugar, SFA and Na. New affordability metrics can help consumers identify those dairy foods that provide optimal nutrition and the lowest cost. Joining nutrient density profiling with the economics of food-choice behaviour is a relatively novel area of research. More work is needed to develop appropriate metrics to identify affordable NRF and their likely adoption by the public.
Acknowledgements
This study was funded by Danone Research, France. A. D. has received grants, honoraria and consulting fees from numerous food, beverage and ingredient companies and other commercial and nonprofit entities with an interest in the nutrient density of foods. The University of Washington receives research funding from public and private sectors.
A. D. conceptualised the study, drafted the manuscript and had primary responsibility for the final content. W. T. assisted drafting tables and figures. R. B. reviewed databases and assisted in necessary calculations. All the authors read and approved the final manuscript.
W. T. and R. B. have no conflicts of interest.


