Kaolin minerals consist of dioctahedral 1:1 layers of Al2Si2O10(OH)4 composition. Each layer is formed by one octahedral sheet and one tetrahedral sheet bound together by tetrahedral sheet apical oxygen atoms. The octahedral sheet contains three possible octahedral cation sites differing in the arrangement of OH groups and oxygen atoms, and dioctahedral 1:1 layers are designated by the letter A, B or C corresponding to the type of vacant site (Bailey, Reference Bailey1963). Kaolin minerals are divided into two groups. The first includes kaolinite, dickite and nacrite in which cohesion of the adjacent layers is related to hydrogen bonding from OH groups on the basal surface of the alumina octahedral sheet and the oxygen atoms of the basal surface of the tetrahedral sheet of the adjacent 1:1 layer. The second group is the halloysite minerals formed by weathering in many soils and as important economic accumulations in deposits of hydrothermal origin (Dixon, Reference Dixon, Dixon and Weed1989; Joussein et al., Reference Joussein, Petit, Churchman, Theng, Righi and Delvaux2005; Guggenheim, Reference Guggenheim, Pasbakhsh and Churchman2015; Keeling, Reference Keeling, Pasbakhsh and Churchman2015; Churchman et al., Reference Churchman, Pasbakhsh, Lowe and Theng2016; Hillier et al., Reference Hillier, Brydson, Delbos, Fraser, Gray, Pendlowski, Phillips, Robertson and Wilson2016; Joussein, Reference Joussein, Yuan, Thill and Bergaya2016; Wilson & Keeling, Reference Wilson and Keeling2016). In contrast to kaolinite, halloysite is typically hydrated. In a fully hydrated state, halloysite interlayers contain two H2O molecules per unit cell and the thickness of the 1:1 layer plus the interlayer is equal to ~10 Å. Hydrated halloysite is unstable and readily and irreversibly transforms into a dehydrated state with a periodicity along the c* axis of ~7 Å. It has been recommended to refer to these various states as halloysite (10 Å) and halloysite (7 Å) (Churchman & Carr, Reference Churchman and Carr1975).
It is generally accepted that the initial form of halloysite (i.e. at the time of its formation) is halloysite (10 Å) and that partially or fully dehydrated forms have smaller d spacings of the basal reflections as a result of some degree of post-formation dehydration. The other distinct difference between kaolinite and halloysite is that kaolinite consists exclusively of platy particles with hexagonal outlines, whereas halloysite has been described in a wide variety of morphologies, most commonly cylindrical and prismatic tubular, as well as spheroidal forms, although rare Fe-rich platy forms are also known (Joussein et al., Reference Joussein, Petit, Churchman, Theng, Righi and Delvaux2005; Moon et al., Reference Moon, Lowe, Cunningham, Wyatt, Churchman, de Lange, Mörz, Kreiter, Kluger, Jorat, Rotonda, Cecconi, Silvestri and Tommasi2015; Churchman et al., Reference Churchman, Pasbakhsh, Lowe and Theng2016; Hillier et al., Reference Hillier, Brydson, Delbos, Fraser, Gray, Pendlowski, Phillips, Robertson and Wilson2016).
The tubular forms of halloysite attract special attention due to a rapidly expanding range of their applications in a wide variety of technologies (Lvov et al., Reference Lvov, Schukin, Mohwald and Price2008; Pasbakhsh et al., Reference Pasbakhsh, Churchman and Keeling2013; Shchukin et al., Reference Shchukin, Sukhorukov, Price and Lvov2015; Yuan et al., Reference Yuan, Tan and Annabi-Bergaya2015). Moreover, the cylindrical and prismatic tubular forms are the most common particle forms in most halloysite samples (Chukhrov & Zvyagin, Reference Chukhrov, Zvyagin, Heller and Weiss1966; Dixon & McKee, Reference Dixon and McKee1974; Bailey, Reference Bailey, Farmer and Tardy1990; Guggenheim, Reference Guggenheim, Pasbakhsh and Churchman2015; Churchman et al., Reference Churchman, Pasbakhsh, Lowe and Theng2016; Hillier et al., Reference Hillier, Brydson, Delbos, Fraser, Gray, Pendlowski, Phillips, Robertson and Wilson2016).
Several different models were suggested to explain the factors controlling the various morphological forms of halloysite particles (Bates et al., Reference Bates, Hildebrand and Swineford1950; Bailey, Reference Bailey, Farmer and Tardy1990; Newman et al., Reference Newman, Childs and Churchman1994; Singh, Reference Singh1996; Singh & Mackinnon, Reference Singh and Mackinnon1996; Bordallo et al., Reference Bordallo, Aldridge, Churchman, Gates, Telling, Kiefer, Fouquet, Seydel and Kimber2008; Matusik et al., Reference Matusik, Gawel, Bielanska, Osuch and Bahranowski2009; Kogure et al., Reference Kogure, Mori, Drits and Takai2013).
Recently, an inherent relationship between cylindrical and prismatic forms of hydrated halloysite was suggested by Hillier et al. (Reference Hillier, Brydson, Delbos, Fraser, Gray, Pendlowski, Phillips, Robertson and Wilson2016). Based on systematic relationships between tube form and size and other regularities, they argued that prismatic tubular forms of halloysite are a late stage in a natural growth sequence of tubular forms that evolves from cylindrical to prismatic as tube size increases.
Investigation of individual tubular particles of hydrated and dehydrated halloysite by selected area electron diffraction (SAED) indicates that at least some of the particles or their fragments have a two-layer periodic structure (Honjo et al., Reference Honjo, Kitamura and Mihama1954; Honjo & Mihama, Reference Honjo and Mihara1954; Zvyagin, Reference Zvyagin1964, Reference Zvyagin1967; Chukhrov & Zvyagin, Reference Chukhrov, Zvyagin, Heller and Weiss1966; Kohyama et al., Reference Kohyama, Fukushima and Fukami1978; Singh & Gilkes, Reference Singh and Gilkes1992; Guggenheim, Reference Guggenheim, Pasbakhsh and Churchman2015). Application of SAED to the structural study of prismatic halloysite particles showed that these particles have a two-layer monoclinic cell with space group Cc (Chukhrov & Zvyagin, Reference Chukhrov, Zvyagin, Heller and Weiss1966) that corresponds to the 2M 1 polytype (Zvyagin, Reference Zvyagin1964, Reference Zvyagin1967). Recently, Kogure et al. (Reference Kogure, Mori, Kimura and Takai2011, Reference Kogure, Mori, Drits and Takai2013), using high-resolution transmission electron microscopy (HRTEM) and SAED, investigated cylindrical and prismatic forms of halloysite. Analysis of the HRTEM images of cylindrical particles showed that their stacking structure is generally disordered, but ordered fragments with one-layer kaolinite-like periodicity were often observed. In contrast, the prismatic forms of halloysite have two distinguishing features. The SAED patterns obtained from some particles demonstrate the two-layer stacking according to 2M 1 polytype, but the corresponding HRTEM images indicates that the two-layer periodicity is observed only as local fragments within otherwise-disordered layer stacking.
The information concerning structural features of halloysites obtained from powder X-ray diffraction (XRD) patterns is even less informative. Regardless, of their origin, the XRD patterns of many halloysites (7 Å) lack hkl reflections, suggesting completely random layer stacking in their structure, whereas others contain rather sharp reflections overlapping on two-dimensional hk bands, indicating a partial ordering in the corresponding structures. Kogure et al. (Reference Kogure, Mori, Drits and Takai2013) were the first to interpret the XRD pattern of a dehydrated prismatic halloysite using a modelling method. They concluded that the two well-defined peaks at 4.26 and 4.03 Å in the experimental XRD pattern correspond to the strong 021 and 11![]() $\bar{2}$ reflections of the 2M 1 structure (Chukhrov & Zvyagin, Reference Chukhrov, Zvyagin, Heller and Weiss1966; Zvyagin, Reference Zvyagin1967). Hillier et al. (Reference Hillier, Brydson, Delbos, Fraser, Gray, Pendlowski, Phillips, Robertson and Wilson2016) carried out a comprehensive study of a representative collection of halloysite (10 Å) and halloysite (7 Å) by various methods and deduced a correlation matrix for the XRD Cylindrical/Prismatic (CP) index, the infrared (IR) ‘OH-stretching band intensity ratio’, particle size and adsorption data.
$\bar{2}$ reflections of the 2M 1 structure (Chukhrov & Zvyagin, Reference Chukhrov, Zvyagin, Heller and Weiss1966; Zvyagin, Reference Zvyagin1967). Hillier et al. (Reference Hillier, Brydson, Delbos, Fraser, Gray, Pendlowski, Phillips, Robertson and Wilson2016) carried out a comprehensive study of a representative collection of halloysite (10 Å) and halloysite (7 Å) by various methods and deduced a correlation matrix for the XRD Cylindrical/Prismatic (CP) index, the infrared (IR) ‘OH-stretching band intensity ratio’, particle size and adsorption data.
To conclude, one must note that despite many recently published reviews and original articles (Bailey, Reference Bailey, Farmer and Tardy1990, Reference Bailey, Murray, Bundy and Harvey1993; Joussein et al., Reference Joussein, Petit, Churchman, Theng, Righi and Delvaux2005; Inoue et al., Reference Inoue, Utada and Natta2012; Kogure et al., Reference Kogure, Mori, Drits and Takai2013; Churchman, Reference Churchman, Pasbakhsh and Churchman2015; Guggenheim, Reference Guggenheim, Pasbakhsh and Churchman2015; Churchman et al., Reference Churchman, Pasbakhsh, Lowe and Theng2016; Hillier et al., Reference Hillier, Brydson, Delbos, Fraser, Gray, Pendlowski, Phillips, Robertson and Wilson2016; Joussein, Reference Joussein, Yuan, Thill and Bergaya2016), fundamental problems related to the actual crystal structure of halloysites still remain unresolved. One of these problems is the relationship between the structural features of kaolinite and halloysites. Brindley & Robinson (Reference Brindley and Robinson1946, Reference Brindley and Robinson1948) assumed that halloysites are the end members of a series of minerals ranging from highly crystalline kaolinite at one end to highly disordered halloysite at the other. On the other hand, one of the conclusions of the review of Churchman et al. (Reference Churchman, Pasbakhsh, Lowe and Theng2016) is that halloysites are structurally different from kaolinite. The main task of the present manuscript is to clarify the relationships between the defect-free structure of kaolinite and the periodic 2M 1 structure of halloysite of Zvyagin (Reference Zvyagin1967). As such, it is hoped that discussion of this matter will be considered closed. Additionally, by using the relationships determined together with modelling of the experimental XRD patterns of dehydrated tubular halloysite samples, the phases and the structural features of the studied halloysite samples are revealed.
REVIEW AND RELATIONS OF STRUCTURAL FEATURES
Idealized 2M1 structure
Zvyagin (Reference Zvyagin1964, Reference Zvyagin1967) theoretically deduced possible polytype modifications of dioctahedral and trioctahedral 1:1 layers and established their diffraction features. Using SAED, Chukhrov & Zvyagin (Reference Chukhrov, Zvyagin, Heller and Weiss1966) discovered that the diffraction features of some prismatic halloysite particles correspond to those of the two-layer polytype 2M 1. In the symbolic notation developed by Zvyagin (Reference Zvyagin1964, Reference Zvyagin1967), the idealized two-layer structure is represented by a stacking sequence expressed as σ3τ+ σ3τ– with a monoclinic symmetry and space group Cc. In this notation, σ is the intralayer displacement in the (001) projection between the centres of the ditrigonal rings of the lower tetrahedral sheet and the centres of the vacant octahedral in the upper octahedral sheet of the same kaolin 1:1 layer. The 1:1 layer has an orthogonal unit cell with a0 and b0 parameters in which the [100] direction coincides with the layer mirror plane. In this case, σ3 is equal to –a0/6, while τ+ and τ– correspond to the interlayer displacements between the centres of vacant octahedra of a lower 1:1 layer and the centres of the ditrigonal rings of the tetrahedral sheet of an upper 1:1 layer and are equal to + b 0/6 and –b 0/6, respectively. This stacking sequence is also described as the regular alternation of the layer displacements with –a 0/6 + b 0/6 (σ3τ+) and –a 0/6 – b 0/6 (σ3τ–). Thus, in the projection on the (001) plane, the layer displacement (Guggenheim et al., Reference Guggenheim, Adams, Bergaya, Brigatti, Drits, Fromoso, Galan, Kogure, Stanjek and Stucki2009) for the two-layer structure is 2σ3 + τ+ + τ– = –2a 0/6 + b 0/6 – b 0/6 = –a 0/3 and corresponds to a monoclinic unit cell (Zvyagin, Reference Zvyagin1964, Reference Zvyagin1967; Chukhrov & Zvyagin, Reference Chukhrov, Zvyagin, Heller and Weiss1966). To summarize, the idealized two-layer structure of halloysite is the ordered interstratification of the kaolinite layers having Cm symmetry, identical interlayer displacements along the mirror plane and shifted with respect to each other by + b 0/6 and –b 0/6, respectively.
Defect-free kaolinite
According to Bookin et al. (Reference Bookin, Drits, Planćon and Tchoubar1989), the layer periodicity of the ordered 1Tc kaolinite can be described equally well by the orthogonal layer cell {a 0, b 0, γ0} (γ0 = 90°) as well as by two enantiomorphic oblique cells {a 1, b 1, γ1} and {a 2, b 2, γ2}. The oblique cells are related by the actual or pseudo-mirror plane passing through the C-vacant octahedral sites and the centres of the ditrigonal rings of the tetrahedral sheet in the kaolinite layer (Fig. 1). The parameters of the oblique cells related by the mirror plane are those determined experimentally by Bish & von Dreele (Reference Bish and von Dreele1989) for the defect-free kaolinite sample from Keokuk: a 1,2 = 5.1554(1) Å, b 1,2 = 8.9448(2) Å, γ1,2 = 89.822(2)° (Table 1). The mutual arrangements of the right- and left-hand oblique unit cells and the layer displacement vectors t1 and t2, which correspond to individual kaolinite enantiomorphs related by the mirror plane, are shown in Fig. 1. Each of the layer displacements t1 or t2 forms the same defect-free 1Tc kaolinite. Indeed, coexistence of both right- and left-handed micro- and nano-crystals of kaolinite formed by weathering of ancient crust was experimentally visualized by Samotoin (Reference Samotoin2011).
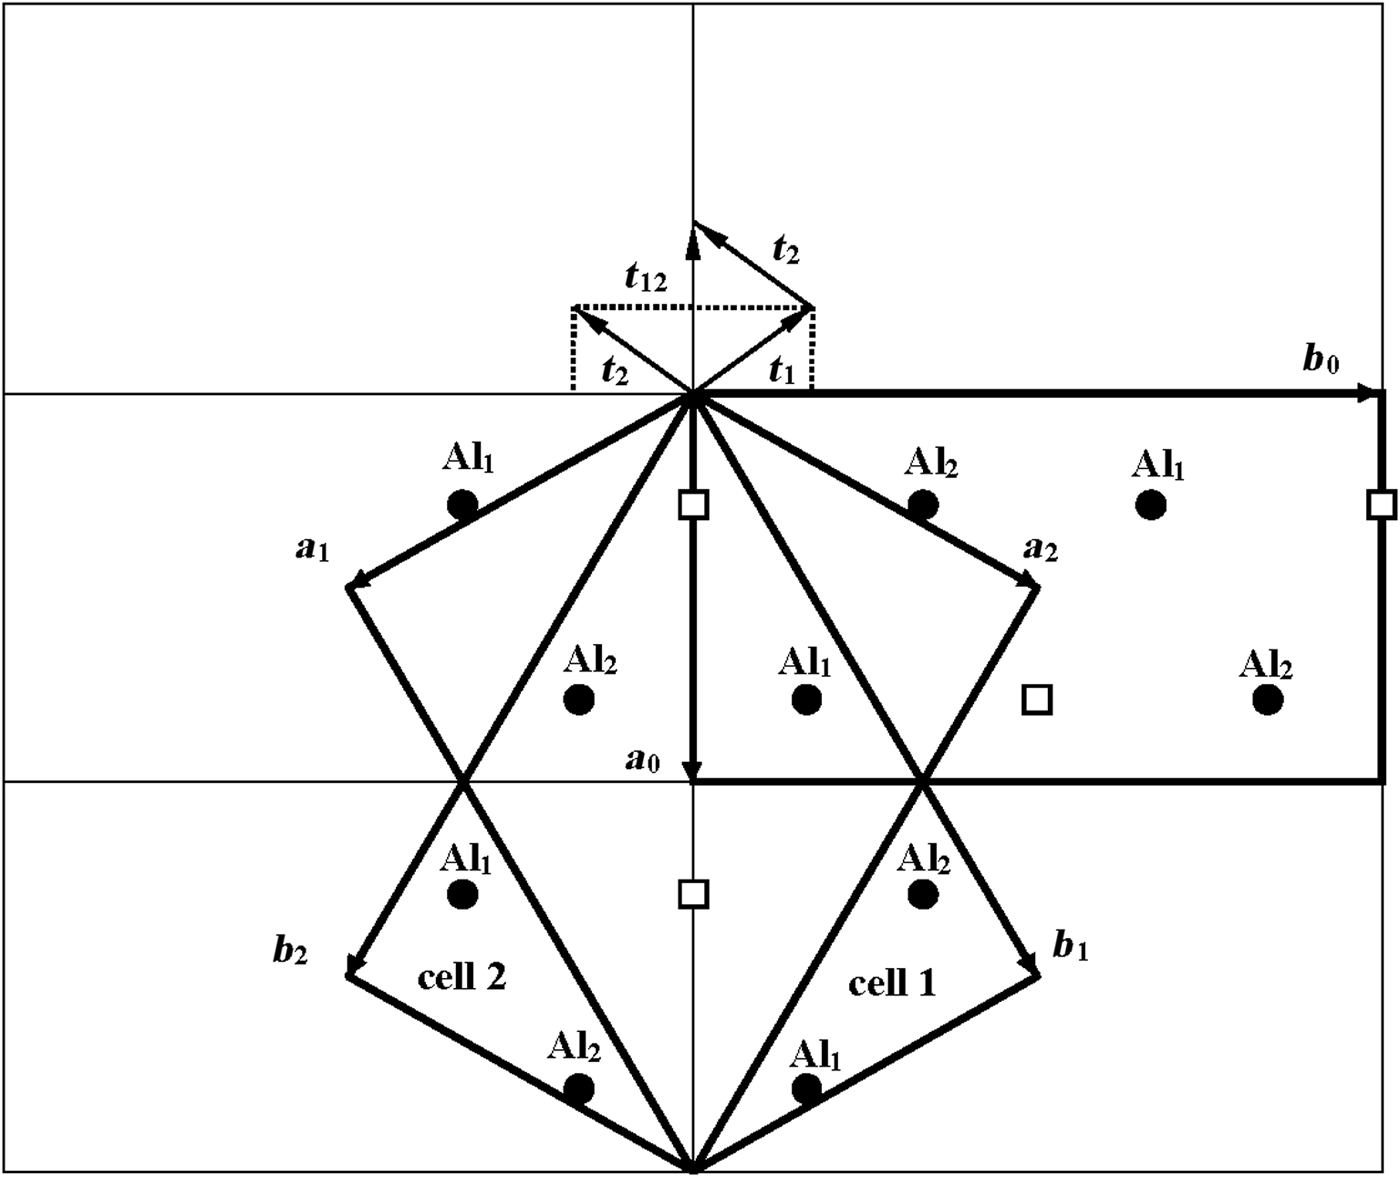
Fig. 1. Mutual arrangement of two-layer oblique unit cells (cell 1 and cell 2) related by a mirror plane passing through the a 0 axis and forming a perpendicular to the b 0 axis of the orthogonal layer unit cell. The layer displacements t1 and t2 form the right- and left-handed kaolinite enantiomorphs, respectively, and t12 is the layer-displacement vector forming the two-layer periodic halloysite structure.
Table 1. Refined and corrected parameters of the triclinic kaolinite unit cell transformed into the orthogonal unit cell with the oblique layer unit cell and C1 layer symmetry and transformed into the orthogonal unit cell with the orthogonal layer unit cell and Cm layer symmetry.

Δx, Δy, Δx 0, Δy 0 = components of layer displacements along a, b or a 0, b 0 axis; h = thickness of the kaolinite layer.
Along with the oblique layer cells, Fig. 1 shows the orthogonal cell with the a 0 axis coinciding with the actual or pseudo-mirror plane. If the kaolinite layer with the orthogonal unit cell has Cm symmetry, then the regular alternation of the layer displacements t1 and t2 are equivalent to the 2M 1 structure of halloysite. To confirm this proposal, the following operations are required: first, determine layer a 0 and b 0 parameters at γ0 = 90°, which satisfy the oblique cell parameters a, b, γ <90° determined for the defect-free kaolinite; second, obtain atomic coordinates in the orthogonal unit cell; and third, demonstrate that a new set of atomic coordinates conforms with the mirror plane.
Transformation from the oblique to orthogonal layer unit cells
As seen in Fig. 1, both oblique cells (cell 1 and cell 2) have the same refined a, b and γ = 89.822° parameters and ratio b/a >![]() $\sqrt {3\;} $ (Table 1). These refined parameters are interrelated with parameters a 0 and b 0 of the idealized orthogonal unit cell (Fig. 2):
$\sqrt {3\;} $ (Table 1). These refined parameters are interrelated with parameters a 0 and b 0 of the idealized orthogonal unit cell (Fig. 2):
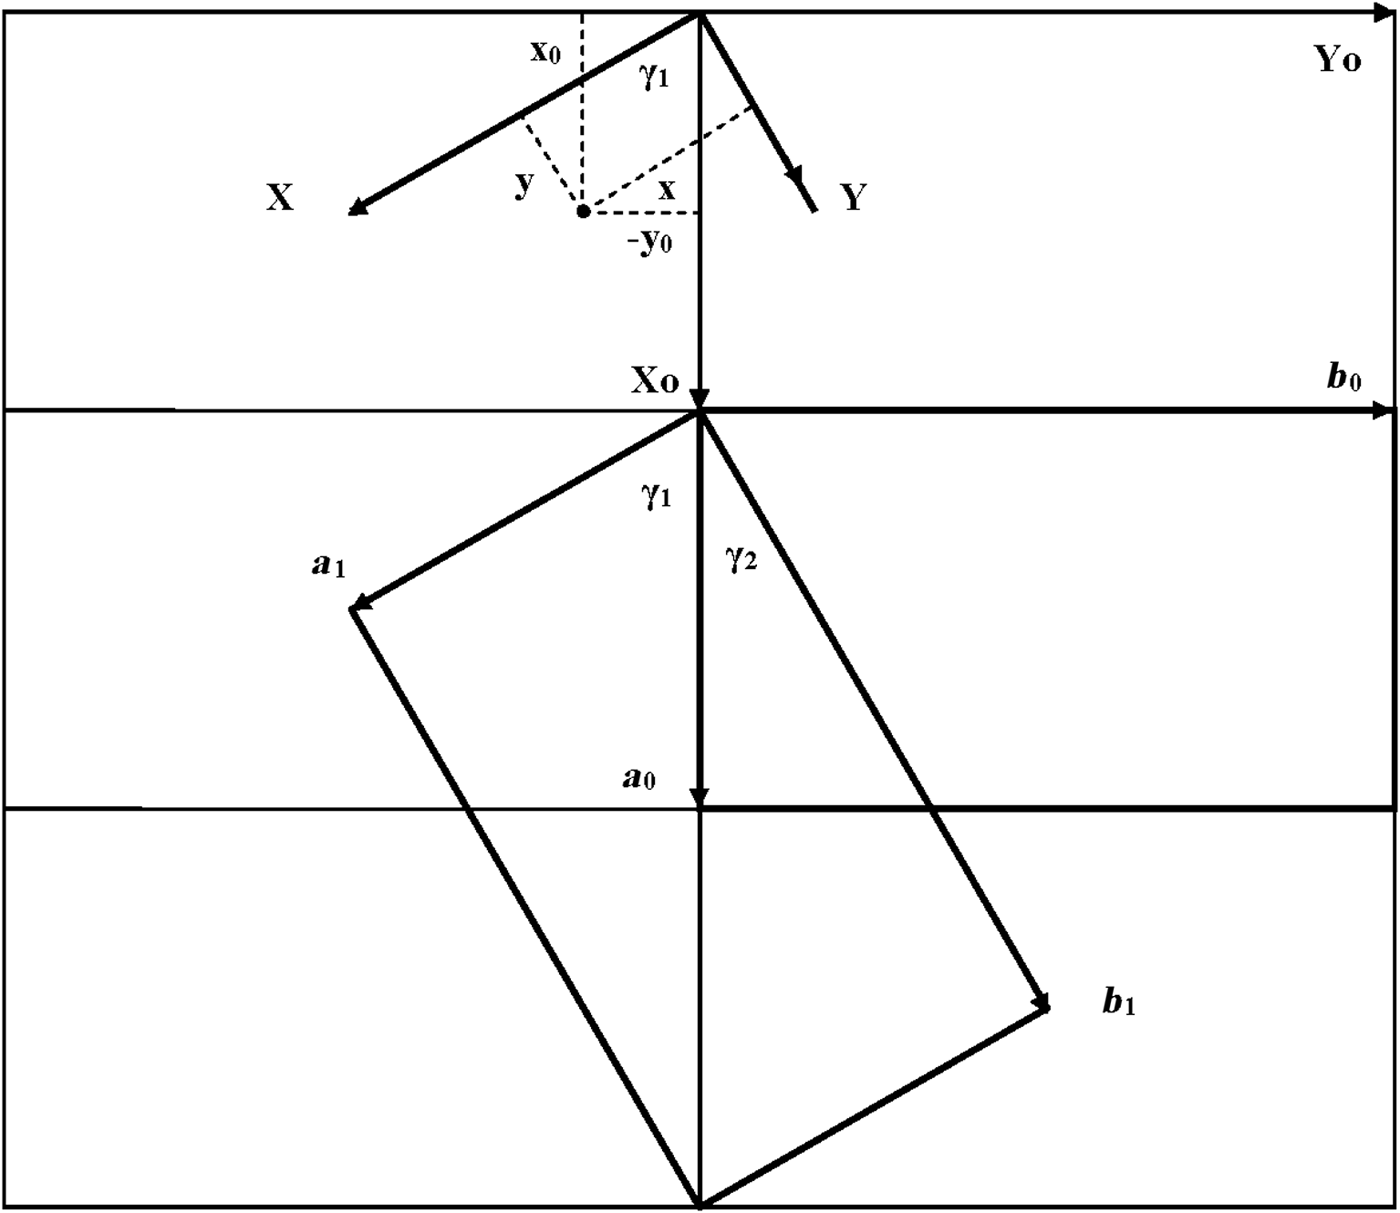
Fig. 2. Oblique cell 1 rotated clockwise by ~60° with respect to the orthogonal cell and described by a 1, b 1; parameters γ1 and γ2 are the angles between the a 0 and a 1 and b 1 axes, respectively. The relationships between the coordinates of any point in the orthogonal, x0, y0, z0, and in the oblique, x, y, z, cells are shown in the upper part of the figure.
The a 0 and b 0 values were determined from equation 1 using the refined a and b parameters of the oblique cells (Table 1). Note that b/a and b 0/a 0 are interrelated because:
Thus, because b/a >![]() $\sqrt 3 $, b 0/a 0 should be <
$\sqrt 3 $, b 0/a 0 should be <![]() $\sqrt 3 $. In the refined structure of kaolinite (Bish & von Dreele, Reference Bish and von Dreele1989), the a and b axes of the oblique cell 1 are rotated clockwise by ~60° with respect to those of the idealized orthogonal unit cell. The latter cell is oriented such that a mirror plane or pseudo-mirror plane of the layer is parallel to the a 0 axis. Figure 2 shows that
$\sqrt 3 $. In the refined structure of kaolinite (Bish & von Dreele, Reference Bish and von Dreele1989), the a and b axes of the oblique cell 1 are rotated clockwise by ~60° with respect to those of the idealized orthogonal unit cell. The latter cell is oriented such that a mirror plane or pseudo-mirror plane of the layer is parallel to the a 0 axis. Figure 2 shows that
 $$\eqalign{& b_0/a_0 = {\rm} {\rm tan}{\rm \gamma} _1,b_0/3a_0 = {\rm tan}{\rm \gamma} _2,{\rm} \cr &{\rm sin}{\rm \gamma} _1=b_0/2a,{\rm} {\rm cos}{\rm \gamma} _1 = a_0/2a,{\rm} \cr &{\rm sin}{\rm \gamma} _2 = b_0/2b{\rm} \ {\rm and} \ {\rm} {\rm cos}{\rm \gamma} _2 = 3a_0/2b}$$
where γ1 and γ2 correspond to the angles between the a 0, b 0 and a, b axes, and γ = γ1 + γ2 is the angle between a and b of the oblique cell 1.
To provide a careful correlation between parameters of the refined oblique and orthogonal layer cells, the value of the a parameter is reduced by 1σ and the values of the b and γ values are increased by 1σ (Table 1). After application of equations 1–3, the corrected oblique layer cell parameters (a = 5.1553 Å, b = 8.9450 Å, γ = 89.825°) correspond to the orthogonal layer cell parameters with a 0 = 5.1689 Å, b 0 = 8.9214 Å, γ0 = 90°, b 0/a 0 = 1.7260 (Table 1). Thus, the refined triclinic oblique layer cell of kaolinite is consistent with the orthogonal two-dimensional layer periodicity.
Fractional atomic coordinates of the orthogonal and oblique unit cells
To determine these relationships, the refined atomic coordinates were transformed from the oblique to the orthogonal coordinate system of the structure. The coordinates of any point in the orthogonal cell, X 0, Y 0, Z 0, and the oblique layer unit cell 1, X, Y, Z (Fig. 2), are related by equation 4:
 $$\eqalign{&{\rm X}_0 = {\rm} {\rm Xcos}{\rm \gamma} _1 + {\rm} {\rm Ycos}{\rm \gamma} _2,{\rm} \cr &{\rm Y}_0 = {\rm} - {\rm Xsin}{\rm \gamma} _1 + {\rm} {\rm Ysin}{\rm \gamma} _2,\cr &{\rm Z}_0 = {\rm} {\rm Z}}$$
From equation 3, the fractional Cartesian atomic coordinates of the orthogonal x0, y0 and oblique x, y cells are related as in equation 5:
Symmetry of the kaolinite layer
The atomic coordinates for the oblique x, y, z and orthogonal x0, y′0, z0 unit cells are given in Table 2. The y coordinate in the orthogonal cell is denoted as y′0 because Bish & von Dreele (Reference Bish and von Dreele1989) fixed the coordinate origin at the site of the basal oxygen atom O3 that is located away from the actual or pseudo-mirror plane (Fig. 3). As a result, the y′0 coordinates of atoms O4, OH1 and (OH)4 in the orthogonal cell, which should lie on the mirror plane, are shifted by 0.0156b 0 from this plane (Fig. 3). Therefore, the orthogonal cell was shifted by –0.0156 along the b 0 axis to appropriately adjust the y0 coordinates for all atoms in the cell (Table 2). The refined components of the layer displacement along the [100] and [010] directions, –0.3683a and –0.0239b, of the oblique layer cell were transformed using equation 5 into the corresponding components, –0.2200a 0 and 0.1722b 0, of the layer displacement of the orthogonal cell (Table 1).
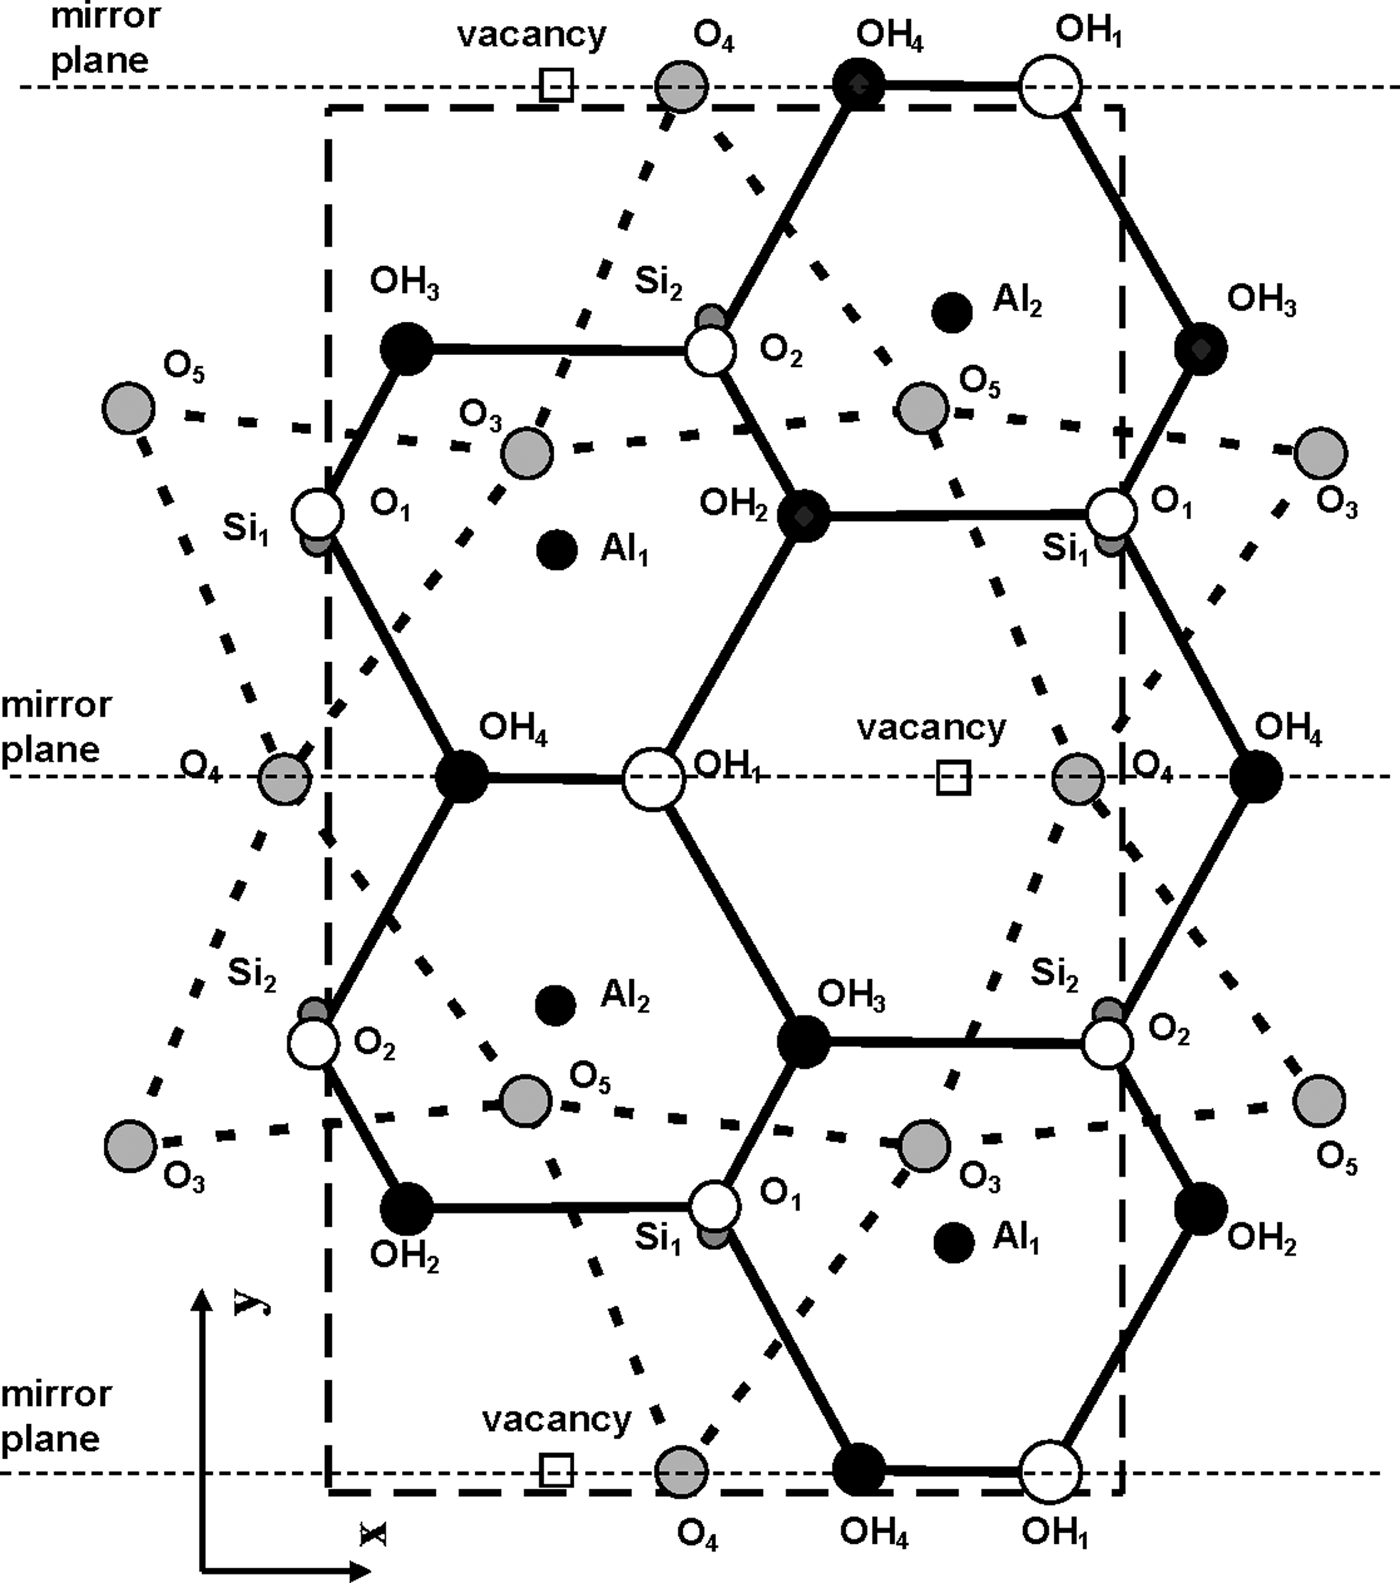
Fig. 3. Mutual arrangement of atoms comprising the kaolinite unit cell in projection on the (001) plane. Coordinates of each atom are given in Table 2. The unit cell chosen by Bish & von Dreele (Reference Bish and von Dreele1989), outlined by the large dashed box, is shifted along the b 0 axis with respect to the mirror plane of the layer.
Table 2. Transformation atomic coordinates from unit cell of triclinic kaolinite with oblique layer cell to orthogonal layer cells.

Analysis of the x0 and y0 values in Table 2 shows that there are two sets of atoms. One of them includes O4, (OH)1 and (OH)4, which have y0 values very close either to 0 or 0.5. Thus, these atoms are most probably located on the mirror plane, and the layer has Cm symmetry. The observed shift of the orthogonal layer cell relative to the mirror plane is caused by the choice of the coordinate origin in the refined kaolinite structure of Bish & von Dreele (Reference Bish and von Dreele1989). In the second group of atomic coordinates, there are pairs of atoms having very similar x0 and y0 values, but their y0 values are of opposite signs (+ or –). Therefore, the absolute values of x0 and y0 for each pair were averaged to produce < x0> and < y0>, which have a direct relation to the refined x and y and to x0 and y0. Indeed, the XRD pattern calculated using the corrected oblique layer cell parameters and coordinates x, y, z (Table 2) and that are calculated using the x0, y0, z0 coordinates and the orthogonal unit cell with C1 layer symmetry coincide (Rp = 0.006%). On the other hand, these patterns also practically coincide with those calculated using the same orthogonal unit cell but with the atomic coordinates < x0>, <y0>, <z0> corresponding to Cm layer symmetry (Rp = 1.06% and Rwp = 1.92%). The reason for this is that, for most atoms, the estimated standard deviations determined for the refined atomic positions x, y, z are equal to or greater than the < x0> – x0, <y0> – y0 and < z0> – z0 values, showing that the differences between the atomic coordinates corresponding to the structural models with layer symmetry Cm and C1 are negligible (Table 3). This fact can be considered as a strong argument in support of Cm layer symmetry in kaolinite layers.
Table 3. Comparison of the estimated standard deviation (e.s.d.) values with the difference between atomic coordinates < x0> – x0; <y0> – y0; <z0> – z0 in which x0, y0, z0 correspond to the 1Tc kaolinite structure with C1 layer symmetry, whereas < x0>, <y0>, <z0> correspond to the same triclinic kaolinite but with Cm layer symmetry.

Relationship of the actual structures of 1Tc kaolinite and 2M1 halloysite
The transformation of the oblique cell 1 into those of the orthogonal unit cell with Cm layer symmetry was repeated for the enantiomorphic cell 2 (Fig. 1). At the same set of atomic coordinates and < x0> – x0, <y0> – y0 and < z0> – z0 values, the layer displacement components, in contrast to cell 1, are equal to –0.2200a 0 and –0.1722b 0 (Table 1). Thus, to reconstruct the right- and left-hand defect-free kaolinite structure, one must use the same orthogonal unit cell with Cm layer symmetry and the < x0>, <y0>, <z0> atomic coordinates but various layer displacements t1 = –0.2200a 0 + 0.1722b 0 and t2 = –0.2200a 0 – 0.1722b 0, respectively. In contrast, a structure in which the layer-displacement vectors t1 and t2 are interstratified regularly as t1t2t1t… has a two-layer periodicity, monoclinic symmetry and space group Cc. Indeed, the layer displacement of the structure is –0.2200a 0 + 0.1722b 0 – 0.2200a 0 – 0.1722b 0 = –0.4400a 0, d(001) = 14.3078 Å because d(001) kaolinite is 7.1539 Å (Bish & von Dreele, Reference Bish and von Dreele1989) and β = 90° + arctan(0.44a 0/14.3078) = 99.03°. Thus, the unit cell parameters of the periodic two-layer structure of halloysite (7 Å) are a 0 = 5.1689 Å, b 0 = 8.9214 Å, c = 14.4887 Å, β = 99.03°, α = γ = 90°. The XRD pattern of the structure and the d spacings and hkl of the observed reflections are shown in Fig. 4 and Table 4, respectively. To summarize, the t1 and t2 layer-displacement vectors have the same length and two fixed directions, each of which is determined by the components of the vector relative to the a and b parameters of the corresponding oblique cell or to the a 0 and b 0 parameters of the orthogonal unit cell.
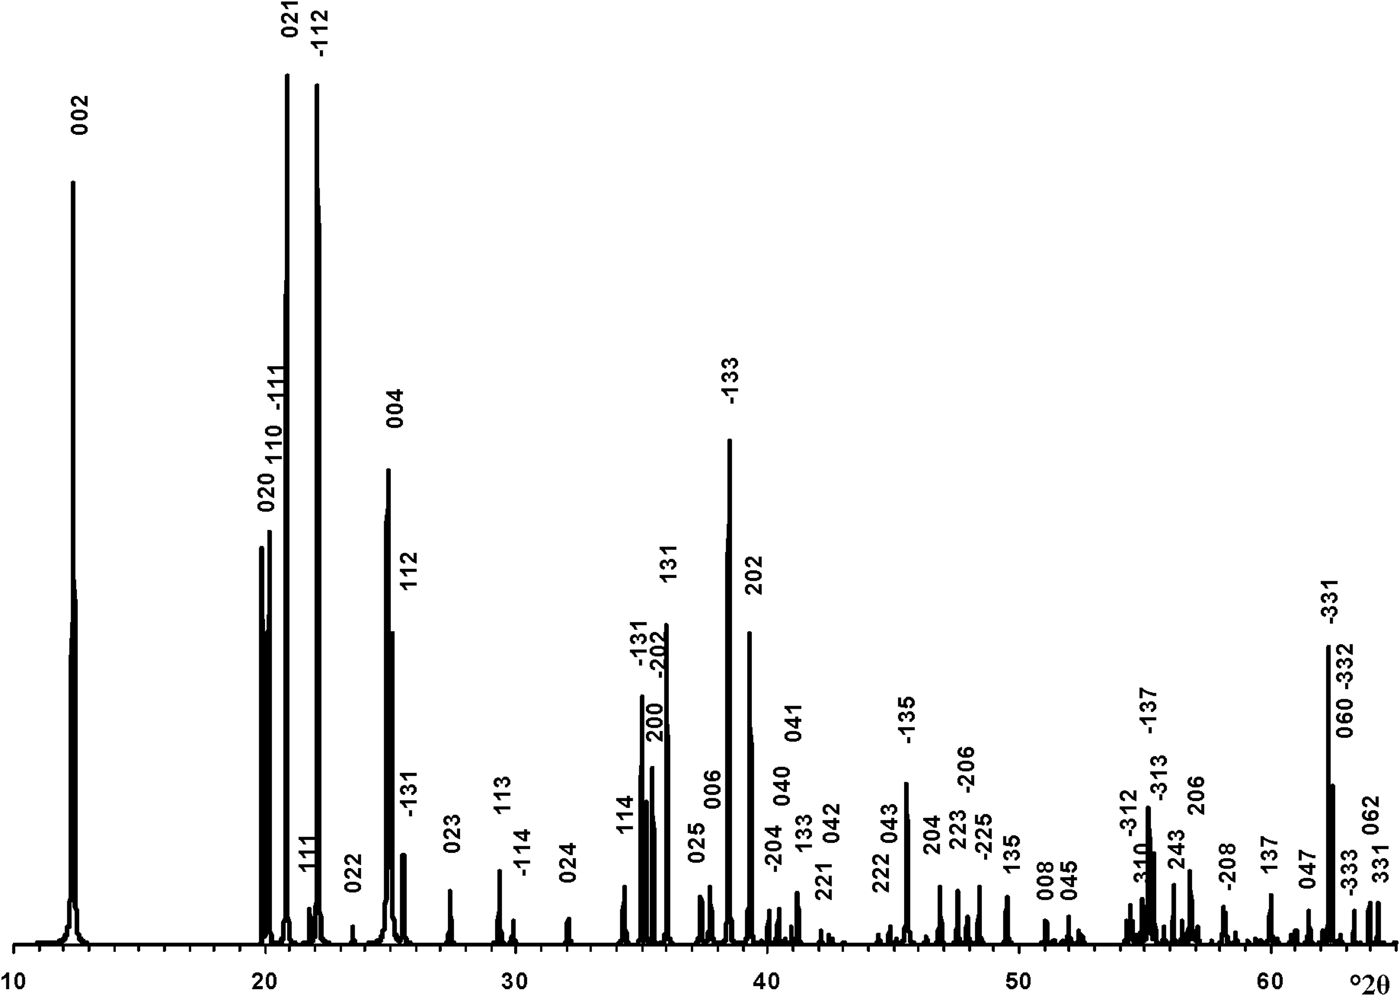
Fig. 4. XRD pattern of the idealized defect-free two-layer structure of halloysite (7 Å). hkl indices are indicated above each distinct reflection and d values are given in Table 4.
Table 4. The d spacings and hkl of reflections corresponding to the defect-free two-layer periodic structure of halloysite (7 Å).

The model described above shows that the intralayer displacements of the C-vacant layers are identical and coincide with the layer mirror plane. Therefore, to obtain the two-layer periodicity, the regular alternation of + 0.1722b 0 and –0.1722b 0 interlayer displacements should occur. A fragment of the periodic two-layer structure in the projection along the a 0 axis is shown in Fig. 5. This shows that both displacements retain identical hydrogen bonds but create electrostatic interactions in adjacent interlayers between the nearest superposing tetrahedral Si cations of the upper layer and octahedral cations (Al1 or Al2) of the lower layer, related to each other by the c-glide plane (Fig. 5).
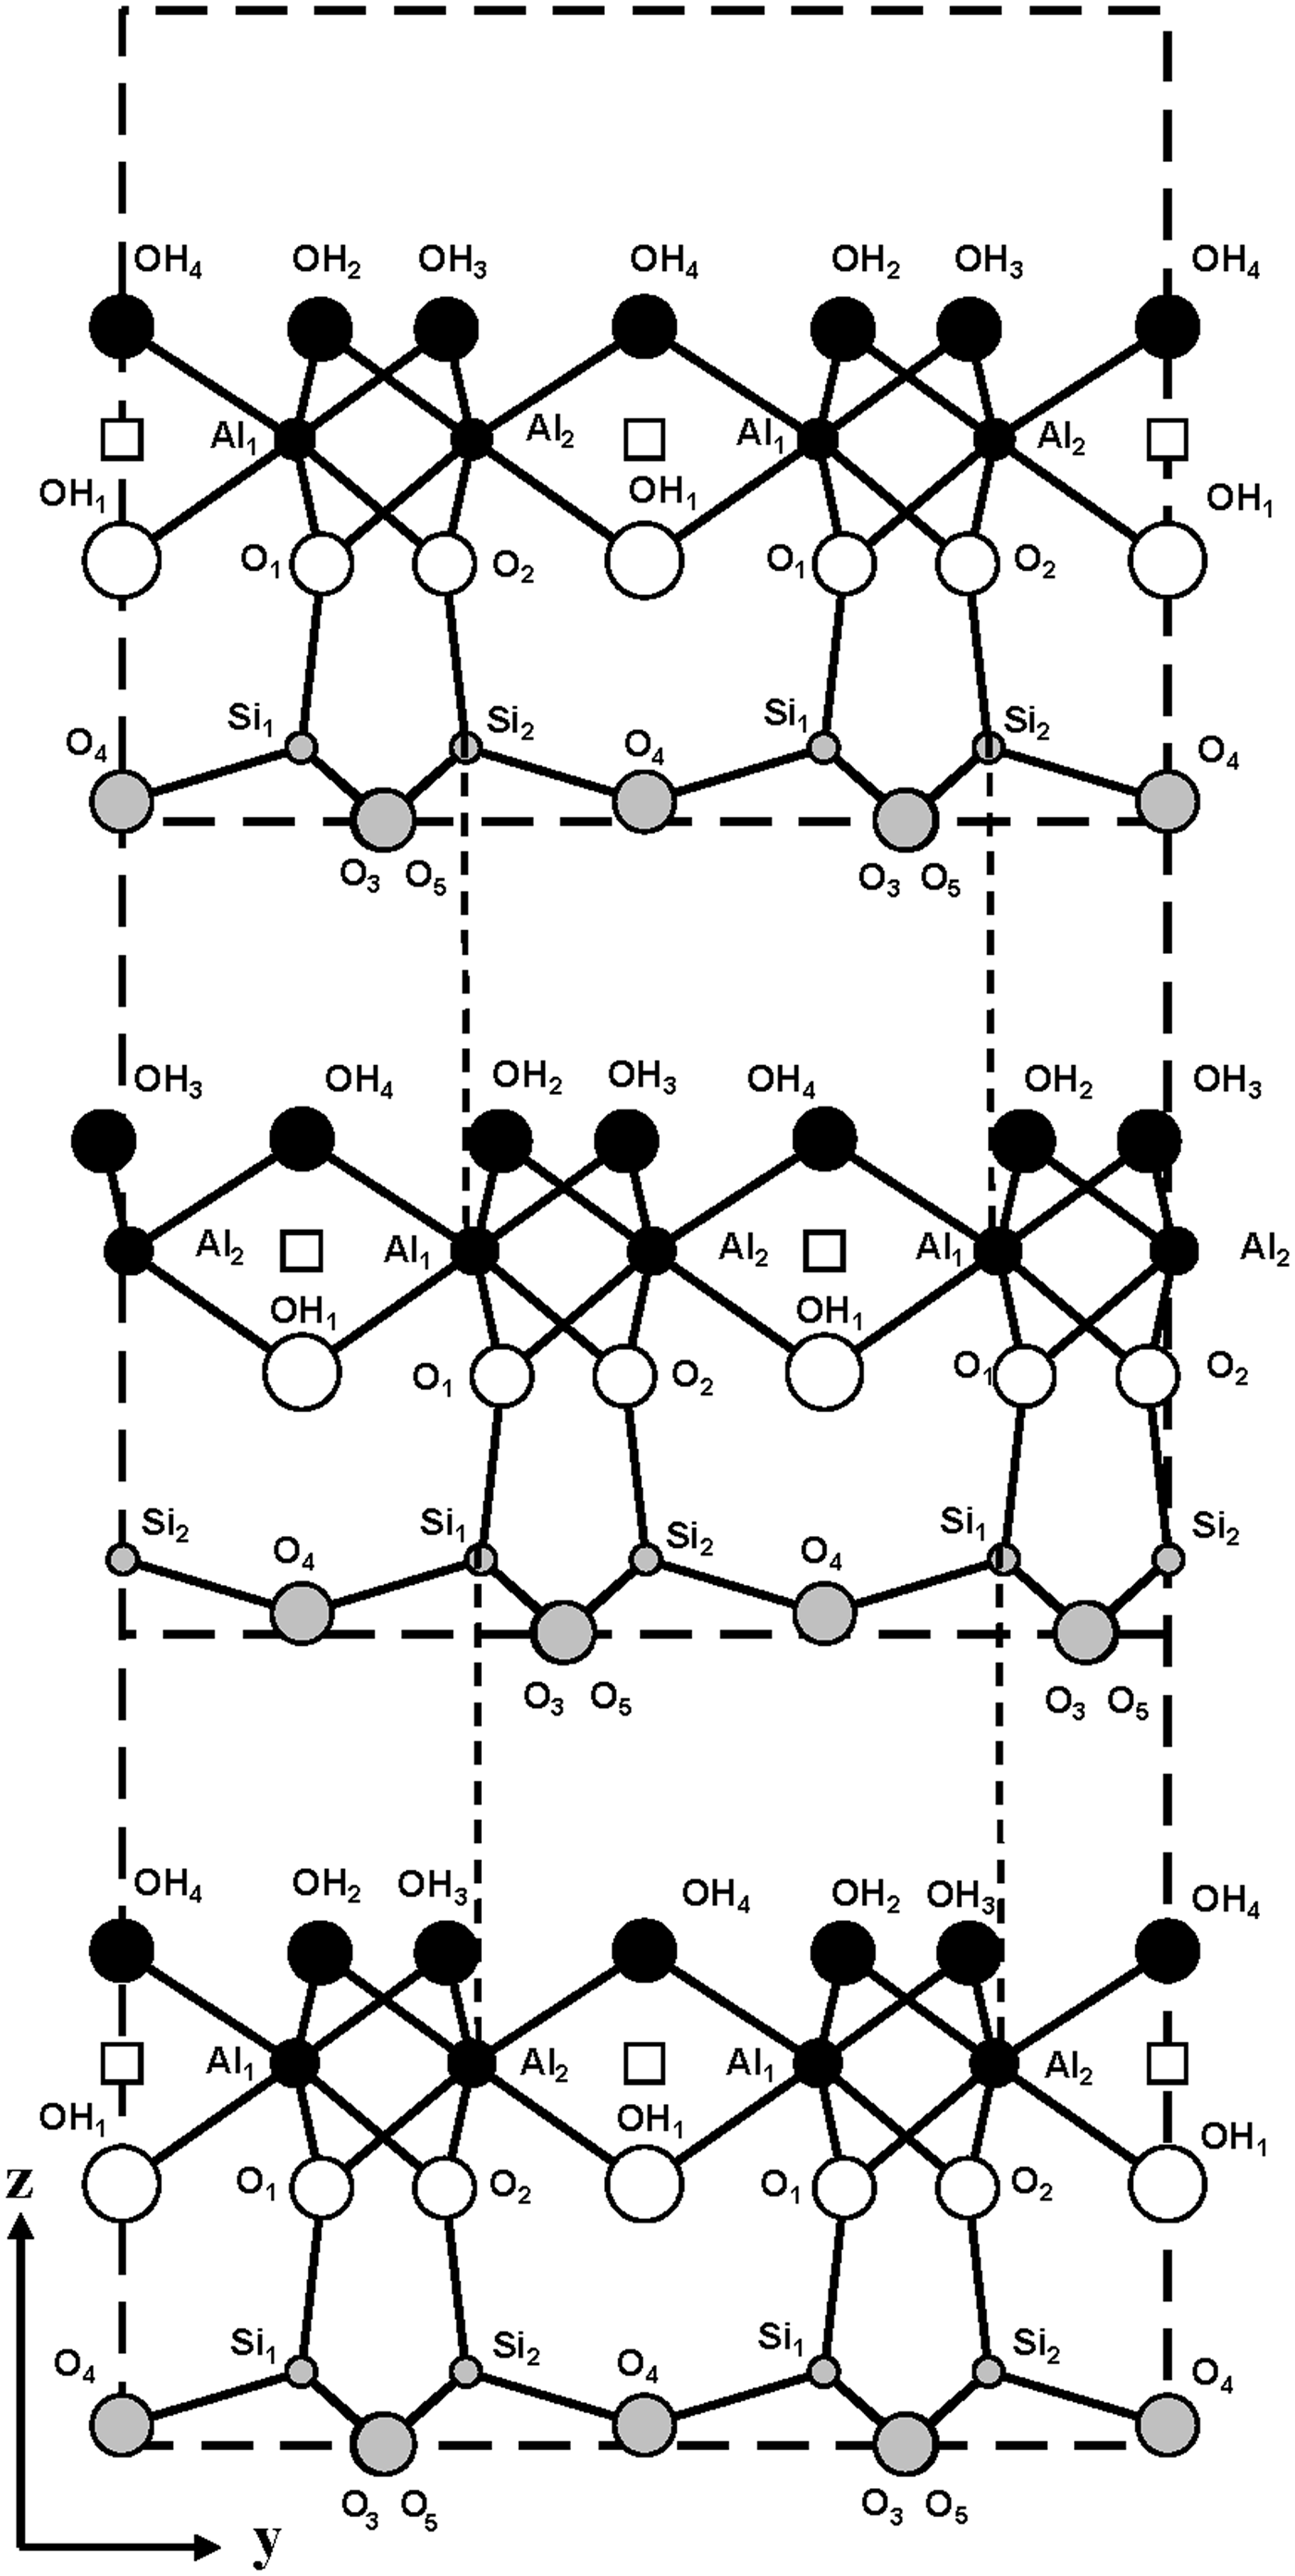
Fig. 5. Fragment of the mutual arrangement of layers of the two-layer periodic halloysite structure in the projection along the a 0 axis. Vertical dashed lines demonstrate the superposition of the tetrahedral Si cations of the upper layer on the octahedral Al cations of the lower layer.
MATERIALS AND METHODS
Samples
Nine samples of tubular halloysites (7 Å) were obtained from occurrences in Russia, the USA and China. Sample Ru-1 is from Olkhon Island, Lake Baikal, Russia, and was formed by weathering of oligoclase (Chekin et al., Reference Chekin, Samotoin and Finko1972, Reference Chekin, Samotoin and Finko1976). The sample was previously studied by Kogure et al. (Reference Kogure, Mori, Drits and Takai2013) by XRD, SAED and HRTEM. In cross-sections, the halloysite crystallites displayed various prismatic forms. Sample Ru-3 of halloysite (7 Å) is from the Voznesenskoe fluorite deposit, Priamursk region, Russia, and was described by Chekin et al. (Reference Chekin, Samotoin and Finko1984). Two tubular samples, Col-1 and Col-2 from Wagon Wheel Gap, CO, USA, were obtained from Prof A. Derkowski (Institute of Geological Sciences, Polish Academy of Science, Krakow, Poland). The XRD patterns of two samples, Dragon-actual and Dragon-vs, from the Dragon Mine, UT, USA, were obtained from S. Hillier (The James Hutton Institute, Aberdeen, UK) and hereafter are referred to as Drag-1 and Drag-2. The halloysite (7 Å) specimen from Eureka, NV, USA, obtained from Prof T. Kogure (Department of Earth and Planetary, University of Tokyo, Tokyo, Japan), was studied by Kogure et al. (Reference Kogure, Mori, Kimura and Takai2011) using SAED and HRTEM. Sample Ru-2 is most probably from Russia, but its exact source is unknown. Sample 5-Ch is from the Bifa deposit, Yunnan Province, China, and was described by Hillier et al. (Reference Hillier, Brydson, Delbos, Fraser, Gray, Pendlowski, Phillips, Robertson and Wilson2016).
Experimental XRD data
Random powder XRD patterns of the samples were obtained with a Bruker D8 diffractometer, at 40 kV, 40 mA, in Bragg-Brentano mode with 250 mm goniometer radius, using Cu-Kα radiation and a graphite monochromator from 10 to 65°2θ with a 0.05°2θ step increment and a count time of 100 s/step.
Modelling of XRD patterns
To simulate diffraction effects for tubular halloysite, the atomic coordinates obtained above for the kaolinite layer having the orthogonal unit cell, Cm layer symmetry and the t1 and t2 layer displacements were used with the computer program of Sakharov and Naumov, which is based on algorithms described by Drits & Tchoubar (Reference Drits and Tchoubar1990). In addition, model structures may contain an arbitrary number of various types of defects and the distribution of the defects may obey an arbitrary value of the short-range order factor R. The XRD patterns were calculated for halloysite structural models for a statistically homogeneous population of crystallites, each of which has a given content of the interstratified layer-displacement vectors and a set of structural parameters as described above. In the model, the crystallites or coherent scattering domains (CSDs) in the ab plane have a disk-like shape and various radii, each of which occurs with equal probability. However, the number of each CSD diameter varies depending on the hk diffraction region. To explain the relationships between the size of the CSD and hk regions, one must recall that most dispersed crystallites are subject to small deformations that perturb the regular sequence of their constituent atoms (Guinier, Reference Guinier1964; Drits & Tchoubar, Reference Drits and Tchoubar1990; Sakharov & Lanson, Reference Sakharov, Lanson, Bergaya and Lagaly2013). Hence, their description has to include the fact that the atoms do not occupy positions that are strictly defined with respect to the regular lattice nodes, but are slightly displaced from their ideal positions. Such fluctuations in the positions of atoms within layers is intrinsic to dehydrated tubular halloysite as a result of the morphological variability of the particles. The positions of the hkl reflections in the XRD pattern from a structure composed of layers containing this type of crystalline defect should coincide with those of a layer structure composed of layers with perfectly regular distributions of atoms. However, the widths of hkl reflections of the defective layer structure should be increased with corresponding increases of hk values. Therefore, ranges of the CSD diameters in the studied samples were divided into three groups with various hk values: (02,11;20,13), (04,22;31,24,15) and (06,33), for which 3h2 + k2 are varied within 4–12, 16–28 and 36, respectively. The ranges of the CSD diameters for the second and third groups were decreased by excluding the maximum diameter of the CSDs in the preceding group. The CSD thicknesses were distributed log-normally along the c* axis and parameters were determined using the mean thickness of CSD, equal to the mean number of layers, N, multiplied by the layer thickness, and the regression given by Drits et al. (Reference Drits, Środoń and Eberl1997). Corrections for instrumental factors, such as horizontal and vertical beam divergence, length, width and sample thickness, were made according to the recommendations of Drits et al. (Reference Drits, Kameneva, Sakharov, Dainyak, Tsipursky, Smoliar-Zviagina, Bookin and Salyn1993) and Reynolds (Reference Reynolds1986). If the layer displacement is not fixed in length, variation of the length around the average value is described by Gaussian distributions, where σx, σy and σz are, respectively, the characteristic widths (in fractions of the unit cell parameters) of the distribution in the a, b and c directions.
Powder XRD patterns from halloysite samples may differ because of variations in relative orientations of halloysite particles. The degree of particle preferred orientation was estimated by the angular parameter α equal to the full width at half maximum of the particle distribution (Drits & Tchoubar, Reference Drits and Tchoubar1990). For each model, two XRD patterns were calculated using Cu-Kα1 and Cu-Kα2 wavelengths and were summed in the ratio of 2:1, respectively. When the structural parameters for each model are fixed, the program automatically seeks the best agreement (minimum Rp factor) between the experimental and calculated XRD patterns by varying the content of each population in a sample. The same program was used to provide the best possible agreement between the XRD pattern from a sample consisting of a mixture of two phases named as N and M, respectively, and an XRD pattern simulated as a sum of XRD patterns corresponding to the N and M phases. For this case, the content of N and M phases in the studied sample is equal to the contribution of the XRD patterns of the N and M phases in the XRD pattern of the sample.
Layer displacements for XRD modelling
Application of the trial-and-error approach showed that the best possible agreement between the experimental and calculated d(hkl) values can be achieved when the layer-displacement vectors t1 and t2 within the (001) plane are equal to –0.2200a0 + 0.1722b0 and –0.2200a0 – 0.1722b0, which coincide with those deduced above. The Cm layer symmetry provides a possibility for a third layer-displacement vector t0 = 0.3698a0, which is placed along the mirror plane. The lengths of t1, t2 and t0 are equal to each other, and the thickness of the CSD was determined by modelling of the basal reflection profiles. A model of the defective halloysite structure consisting of the same layer type was defined by the probability of t1, t2 and t0 translations Wt1, Wt2 and Wt0. The mean and maximum thicknesses of CSD having a log-normal distribution are used as variable parameters.
Statistical distribution of the layer displacements in defective planar structures
The symmetrical arrangement of atoms with respect to a mirror plane in a dioctahedral C-vacant 1:1 layer suggests that the most favourable model for stacking faults in a planar defective kaolin structure is one in which the layer-displacement vectors t1 and t2, related to each other by the mirror plane, are interstratified with a short-range order factor, R. The best possible agreement between the experimental and simulated XRD patterns of disordered kaolinite samples was previously obtained for the model in which layer-displacement vectors t1 and t2 are interstratified at random (i.e. where the occurrence probability of a given type of layer displacement does not depend on the type of the layer displacement of the preceding layer and the short-range order factor R = 0) (Plançon et al., Reference Plançon, Giese, Snyder, Drits and Bookin1989; Kogure & Inoue, Reference Kogure and Inoue2005; Kogure et al., Reference Kogure, Johnston, Kogel and Bish2010, Reference Kogure, Mori, Kimura and Takai2011; Sakharov et al., Reference Sakharov, Drits, McCarty and Walker2016). In a more specific case, the type of the following layer displacement depends on the particular layer displacement of the preceding layer and the short-range order factor R = 1. In such a structure, t1 and t2 layer displacements are interstratified with their relative contents Wt1 and Wt2 and their subsequences in a crystal fully described by four junction probability parameters Pt1t1, Pt1t2, Pt2t1 and Pt2t2. For example, the Pt1t2 coefficient denotes the probability for the vector t2 to follow a preceding vector t1. Therefore, the occurrence probabilities for pairs t1t2 and t2t2 or triples t1t2t1 and t2t2t1 of vectors t1 and t2 are equal to Wt1Pt1t2 and Wt2Pt2t2 or Wt1Pt1t2Pt2t1 and Wt2Pt2t2Pt2t1, respectively. Similarly, any subsequence of t1 and t2 can be calculated. In a structure with R = 1 where the t1 and t2 layer displacements occur with equal probability, the probability parameters are related by equations 7:
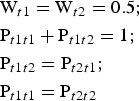 $$\eqalign{&{\rm W}_{t1} = {\rm} {\rm W}_{t2} = {\rm} 0.5;\cr &{\rm} {\rm P}_{t1t1} + {\rm} {\rm P}_{t1t2} = {\rm} 1;{\rm} \cr &{\rm P}_{t1t2} = {\rm} {\rm P}_{t2t1};{\rm} \cr &{\rm P}_{t1t1} = {\rm P}_{t2t2}}$$
Under such conditions, all junction probability parameters are determined if one of them (e.g. Pt1t1) is specified. If the t1 and t2 layer displacements do not occur with equal probability, the probability parameters are related by equations 8:
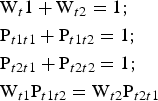 $$\eqalign{&{\rm W}_t1 + {\rm} {\rm W}_{t2} = {\rm} 1;\cr &{\rm} {\rm P}_{t1t1} + {\rm} {\rm P}_{t1t2} = 1;\cr &{\rm} {\rm P}_{t2t1} + {\rm} {\rm P}_{t2t2} = {\rm} 1;\cr &{\rm} {\rm W}_{t1} {\rm P}_{t1t2} = {\rm} {\rm W}_{t2} {\rm P}_{t2t1}}$$
Thus, to describe each particular sequence in the structure, where the layer displacements t1 and t2 are interstratified with R = 1, two of them (e.g. Wt1 and Pt1t1) named as independent probability parameters should be specified (Drits & Tchoubar, Reference Drits and Tchoubar1990; Sakharov & Lanson, Reference Sakharov, Lanson, Bergaya and Lagaly2013). Thus, the studied structural phases are not single phases having three-dimensional periodicity, but are described by a set of parameters that specify the occurrence probabilities of various layer subsequences.
RESULTS
Visual inspection of the diffraction features of the XRD patterns of the samples allow us, using criteria described by Hillier et al. (Reference Hillier, Brydson, Delbos, Fraser, Gray, Pendlowski, Phillips, Robertson and Wilson2016), to separate them into two groups, one of which includes 5-Ch, Ru-2 and the Eureka samples consisting of presumably cylindrical tubes, and a second group consisting of primarily prismatic forms (Fig. 6).
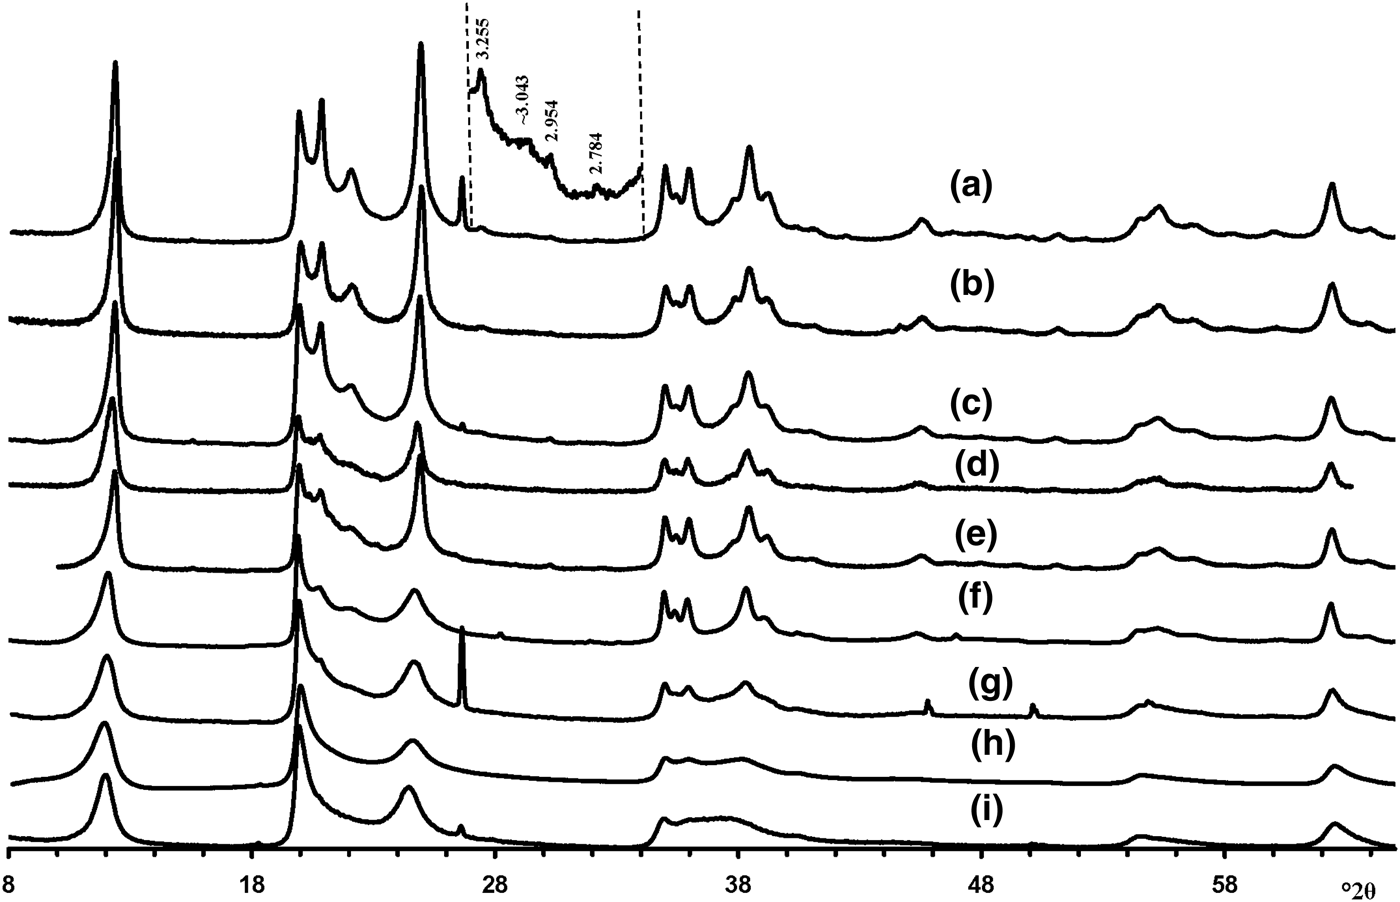
Fig. 6. Experimental XRD patterns of the tubular halloysites (7 Å): (a) Col-1, (b) Drag-2, (c) Ru-1, (d) Drag-1, (e) Col-2, (f) Ru-3, (g) Ru-2, (h) Eureka and (i) 5-Ch.
Modelling of XRD patterns of halloysite (7 Å) with predominantly cylindrical tubes
Diffraction effects from cylindrical tubes of halloysite
According to Hillier et al. (Reference Hillier, Brydson, Delbos, Fraser, Gray, Pendlowski, Phillips, Robertson and Wilson2016), the most obvious difference between cylindrical and prismatic tubes is observed in the 20,13 diffraction region. In particular, the 20,13 region of the cylindrical tubes consists of a single broad, slightly rounded maximum with a sharp leading edge, reminiscent of diffraction bands from a two-dimensional turbostratic structure. The XRD pattern of a cylindricalexample (5-Ch) is compared with that calculated for a planar two-dimensional turbostratic kaolinite structure (Fig. 7). In general, these patterns are similar; that is, intensities and profiles for the most distinct maxima coincide, except for intensities in the diagnostic profiles of the broad 20,13 bands within 36–40°2θ (Fig. 7). The varying distribution of the intensities between the compared 20,13 bands is a direct result of the various diffraction effects produced by cylindrical and platy objects. Therefore, the XRD pattern of the 5-Ch sample can be considered as a standard to account for the contribution of proper cylindrical tubes to the experimental XRD patterns of halloysite samples containing some amount of halloysite cylindrical structure, hereafter termed ‘HCS’. In contrast, the 20,13 region from a planar or nearly planar phase will contain at least two distinct individual maxima in addition to the peaked leading edge of the band. In this example (Fig. 7), the intensities and profiles of basal reflections of the planar turbostratic structure were adjusted to those observed in the XRD pattern of the 5-Ch sample.
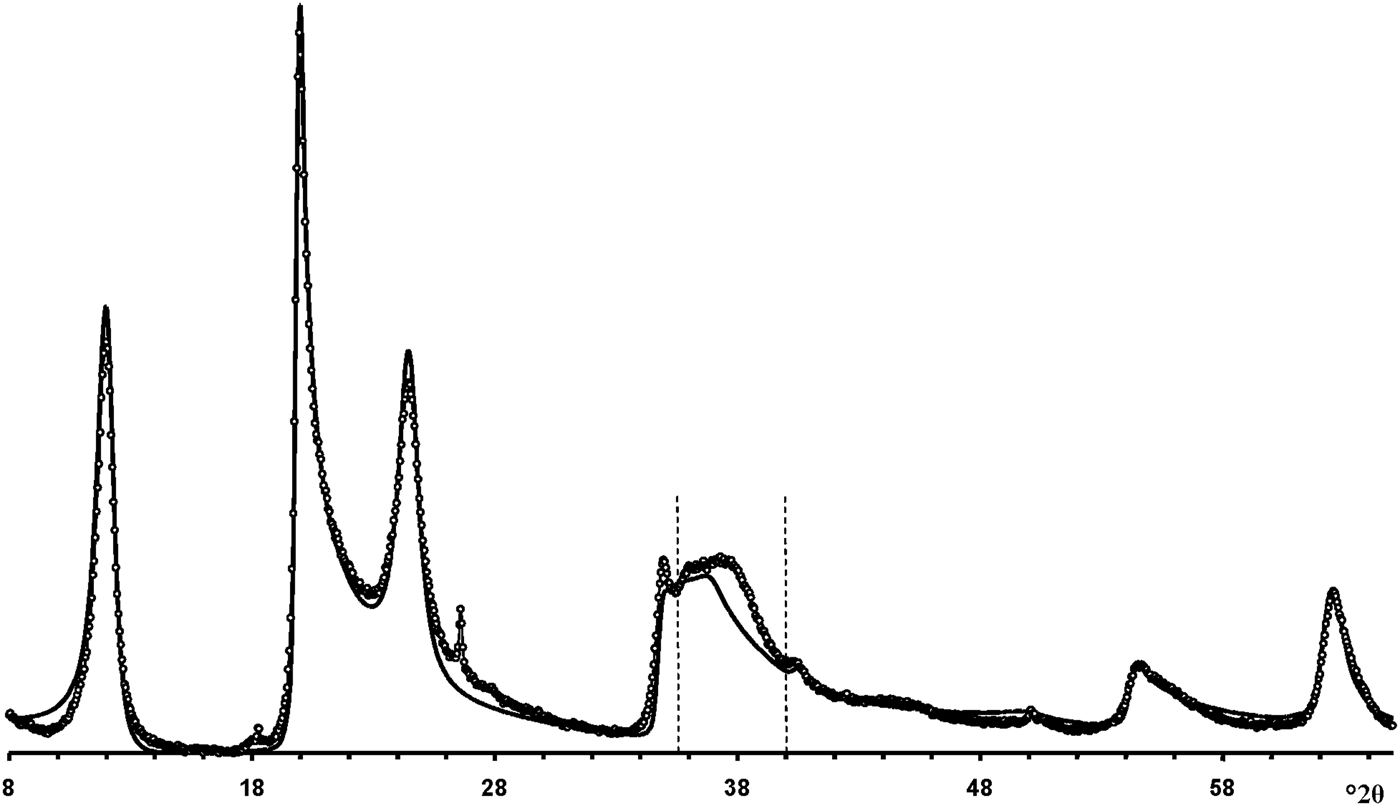
Fig. 7. Comparison of the XRD pattern (dotted line) of sample 5-Ch consisting of cylindrical tubes with those calculated for a planar turbostratic kaolinite structure (solid line). The most significant differences in intensities are observed between the dotted vertical lines at 36–39°2θ.
Sample Ru-2
Modelling of the Ru-2 XRD pattern showed two phases, one of which corresponds to the HCS phase, the other hereafter is referred to as kaolinite-like structure (KLS). One of the most distinct features of the KLS phase is that their layers have various degrees of hydration. Indeed, the first two orders of basal reflections have high and non-rational values of their d spacings equal to 7.348 and 3.611 Å, respectively. The positions and intensities of both reflections were reproduced from the model in which 7.25 and 10.0 Å layer types are interstratified at R = 1 in the ratio 0.94:0.06. Let us denote 7.25 Å layers in the KLS as At1 or At2 and 10 Å layers as Bt1 or Bt2 depending on the layer displacement t1 or t2 that determines the stacking of the interstratified layers. The parameters of the orthogonal unit cell and the components of the t1 or t2 layer displacements along the a0 and b0 axes are given in Table 5. The ratio of the layer types is WAt1:WAt2:WBt1:WBt2 = 0.47:0.47:0.03:0.03. The values of the independent junction probability parameters controlling the occurrences of various layer pairs such as PAt1At1, PAt2Bt1, PAt2Bt2, etc., are given in Table 5. The occurrences of a full set of the junction probability parameters for all possible layer pairs in matrix form are given in Table 6. Figure 8a compares the 02,11 and 20,13 regions of the experimental XRD pattern with those obtained by summation of the XRD patterns of the KLS and HCS phases. Evidently, the XRD pattern of the HCS phase produces the main contribution to the experimental 02,11 region, whereas the modulated maxima in the experimental 20,13 region are related to the contribution of the KLS phase. Note that some structural features of the studied KLS phase are as follows: first, adjacent layers of the AB or BB layer pairs independently of their particular layer displacement types are shifted with respect to each other in an arbitrary direction by an arbitrary length (Wa = 100% in Table 5). However, because the total content of 10 Å layers in the KLS phase is only 6%, the contribution of the AB and BB layer pairs to the total diffraction effects from the KLS phase is non-significant. Second, interlayers of the layer pairs AA and AB, independently of their particular layer-displacement vectors, contain 15% of arbitrary stacking faults (for details, see Drits & Tchoubar, Reference Drits and Tchoubar1990). Third, the lengths of the layer thicknesses are varied around the average one along the z-axis according to a Gaussian distribution with characteristic width σz = 0.25. Finally, the most distinguishing structural feature of the KLS phase is that the layer subsequences with identical layer displacement, t1 or t2, have a strong tendency to segregation. Indeed, as can be seen in Table 6, WAt1 = WAt2 and the values PAtAt1 = PAt2At2 = 0.60 are significantly higher than those of PAt1At2 = PAt2At1 = 0.34. This signifies that in the KLS phase the t1 and t2 layer displacements are distributed in such a way that instead of their random interstratification, the right- and left-hand kaolinite fragments contain relatively large numbers of identical layer types, At1 or At2. The optimal agreement between the experimental XRD pattern and that calculated as an optimal sum of the XRD patterns of the KLS and HCS (and a minor impurity of quartz) was obtained at Rp = 9.1% for a phase ratio of 0.39:0.54:0.07 (Table 5, Fig. 9a). The relationships between the CSD diameters and the particular set of hk regions are given in Table 5.

Fig. 8. Portions of the experimental XRD patterns of Ru-2 (a) and Eureka (b) samples (dotted lines) corresponding to the 02,11 (left) and 20,13 (right) regions are compared with those obtained by the optimal summation of the XRD patterns of sample 5-Ch (HCS) (solid line) and the KLS phases (dashed line). Q = reflections of quartz impurity.
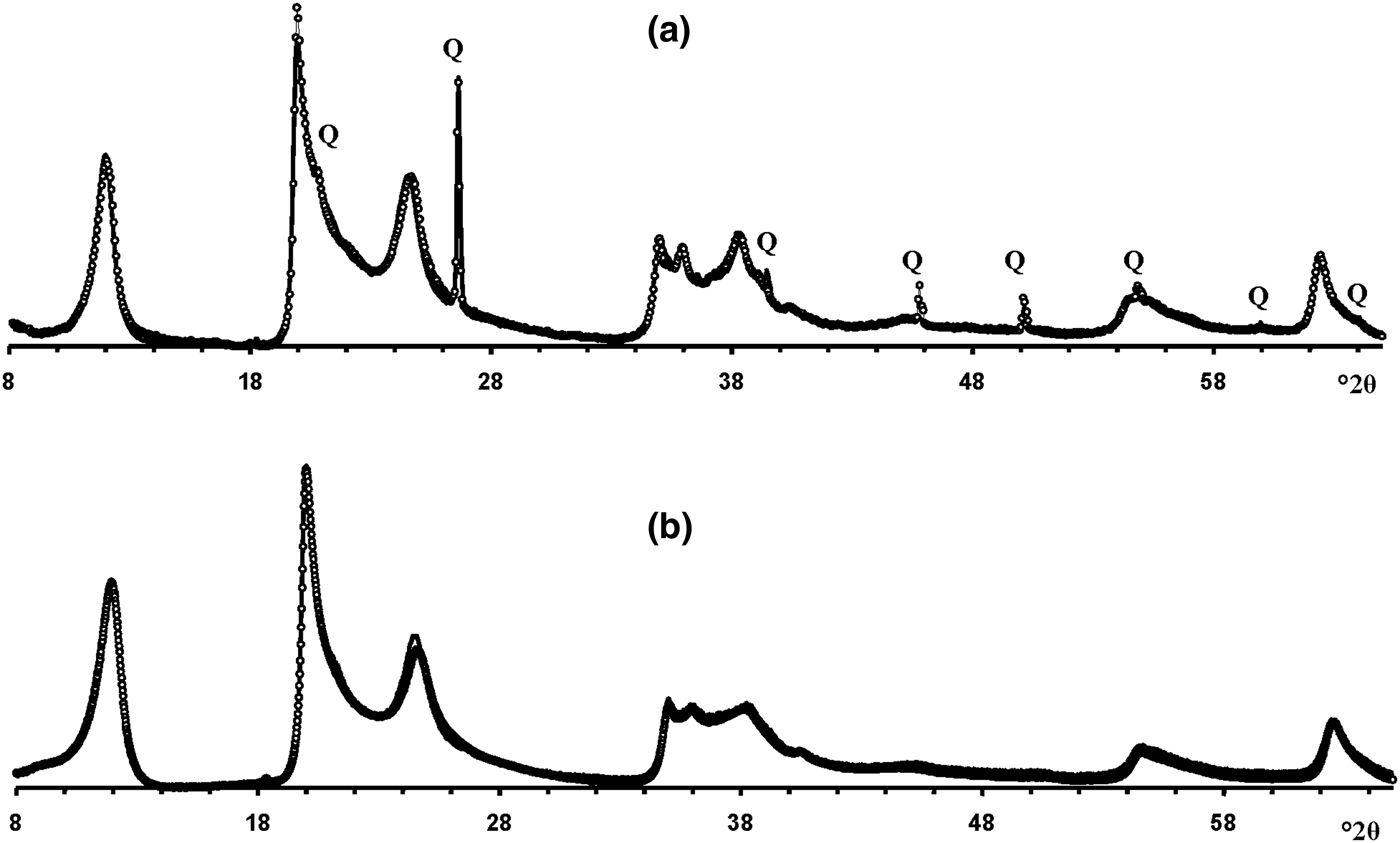
Fig. 9. The best possible agreement between the experimental XRD patterns of samples Ru-2 (a) and Eureka (b) and those obtained by the optimal summation of the XRD patterns of the KLS and HCS phases. Q = reflections of quartz impurity.
Table 5. Parameters of defective phase KLS and phase contents, WKLS and WHCS, in the Ru-2 and Eureka samples.
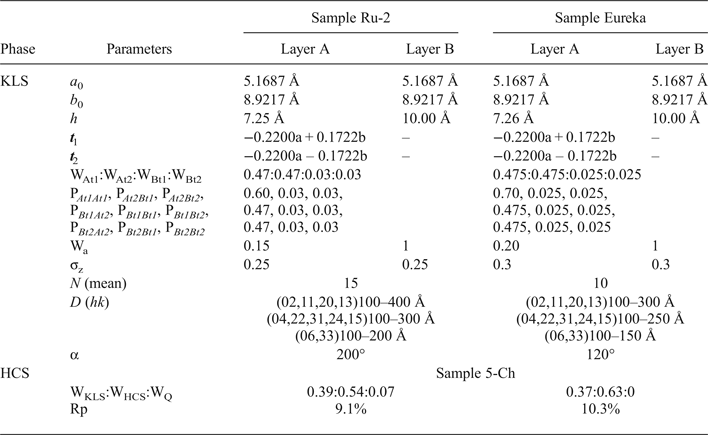
WQ = content of quartz.
Table 6. Occurrence of the junction probability parameters for different layer pairs presented in matrix form for samples Ru-2 and Eureka. The different layer pairs are formed by combination of At1, At2, Bt1 and Bt2 layer types.
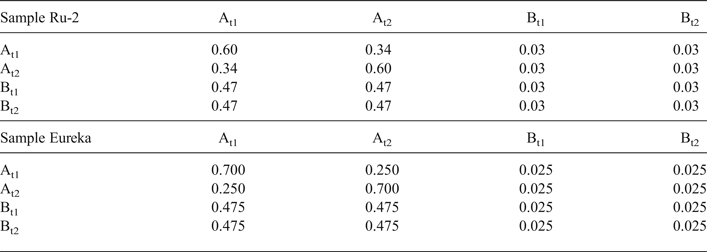
Eureka sample
Modelling the Eureka XRD pattern shows that the phase composition and the main structural features are similar to those determined for sample Ru-2 (Table 5, Fig. 8b). Indeed, the sample consists of the same two phases with 7.26 and 10 Å layers interstratified in the ratio 0.95:0.05 so that the ratio of the layer types is WAt1:WAt2:WBt1:WBt2 = 0.475:0.475:0.025:0.025 (Table 5). The values of the independent junction probability parameters controlling the occurrence of various layer pairs are given in Table 5 and a full set of such parameters is given in Table 6. As in the KLS phase of sample Ru-2, interlayers in the AA and AB layer pairs, independently of the type of the layer displacement, contain 20% of arbitrary stacking faults. In the BA and BB layer pairs, the adjacent layers are shifted with respect to each other in an arbitrary direction by arbitrary length (Wa = 100%). In addition, lengths of the layer thicknesses are varied around the averaged one along the z-axis with σz = 0.3. The best agreement between the XRD pattern of the sample and that obtained by the optimal summation of the XRD patterns corresponding to sample 5-Ch and the KLS phase was obtained for the phase ratio equal to 0.63:0.37 at Rp = 10.3% (Fig. 9b). The prevalence of HCS means that the presence of the KLS phase can be noted only by the visible intensity modulations in the 20,13 region of the XRD pattern (Fig. 8b). Table 5 also gives the relationship between CSD diameters and the hk regions.
Diffraction effects from prismatic halloysite (7 Å)
Defect-free 1Tc kaolinite to 2M1 polytype of halloysite via defective kaolinite and halloysite structures
Figure 10 shows calculated XRD patterns for which Pt1t1 values increase from 0 to 1. The XRD pattern calculated at Pt1t1 = 1.0 corresponds to that of a 1Tc kaolinite enantiomorph and contains 11l, 02l and 20l, 13l reflections characteristic of its defect-free structure. The structure in which Pt1t1 = 0 corresponds to a perfectly ordered 2M 1 polytype of halloysite. The interstratification of t1 and t2 layer displacements at any Pt1t1 has a minimal influence on the positions and intensity distributions in the diffraction region containing 20l, 13l reflections (Fig. 10). The most distinct feature of the XRD pattern corresponding to 2M 1 halloysite is the presence of characteristic reflections in the 11l, 02l diffraction region with d = 4.259 and 4.020 Å, which were indexed as 021 and ![]() $\bar{1}$12 (Zvyagin, Reference Zvyagin1964, Reference Zvyagin1967; Chukhrov & Zvyagin, Reference Chukhrov, Zvyagin, Heller and Weiss1966). Remarkably, these two reflections are reproduced in the XRD patterns within a wide range of Pt1t1 values varying from 0 to 0.4. Even at the most disordered state corresponding to a completely random interstratification of the t1 and t2 layer displacements (Pt1t1 = 0.5 = Wt1), two weak and wide maxima are observed at similar positions in the calculated XRD pattern (Fig. 10). Increasing the Pt1t1 values from 0 to 0.4 has little influence on the positions of the most intense 020, 021, 11
$\bar{1}$12 (Zvyagin, Reference Zvyagin1964, Reference Zvyagin1967; Chukhrov & Zvyagin, Reference Chukhrov, Zvyagin, Heller and Weiss1966). Remarkably, these two reflections are reproduced in the XRD patterns within a wide range of Pt1t1 values varying from 0 to 0.4. Even at the most disordered state corresponding to a completely random interstratification of the t1 and t2 layer displacements (Pt1t1 = 0.5 = Wt1), two weak and wide maxima are observed at similar positions in the calculated XRD pattern (Fig. 10). Increasing the Pt1t1 values from 0 to 0.4 has little influence on the positions of the most intense 020, 021, 11![]() $\bar{2}$ reflections, but changes significantly their relative widths and intensities. Indeed, an increase of the Pt1t1 value decreases the values of Pt1t2 and Pt2t1 and increases the proportion of stacking faults due to formation of adjacent layer pairs related to the same layer displacement t1 or t2. This is accompanied by a relative decrease of the intensities of the 021 and 11
$\bar{2}$ reflections, but changes significantly their relative widths and intensities. Indeed, an increase of the Pt1t1 value decreases the values of Pt1t2 and Pt2t1 and increases the proportion of stacking faults due to formation of adjacent layer pairs related to the same layer displacement t1 or t2. This is accompanied by a relative decrease of the intensities of the 021 and 11![]() $\bar{2}$ reflections with respect to those of the overlapping 020 and 110 reflections (Fig. 10). Similarly, a decrease of Pt1t1 values from 1.0 to 0.7 also has little effect on the positions of reflections in the 11l, 02l diffraction regions, but decreases significantly the intensities and increases the widths of the
$\bar{2}$ reflections with respect to those of the overlapping 020 and 110 reflections (Fig. 10). Similarly, a decrease of Pt1t1 values from 1.0 to 0.7 also has little effect on the positions of reflections in the 11l, 02l diffraction regions, but decreases significantly the intensities and increases the widths of the ![]() $\bar{1}$10, 110 and 1
$\bar{1}$10, 110 and 1![]() $\bar{1}\bar{1},$ 11
$\bar{1}\bar{1},$ 11![]() $\bar{1}$ reflections relative to those of the 020 reflection (Fig. 10).
$\bar{1}$ reflections relative to those of the 020 reflection (Fig. 10).
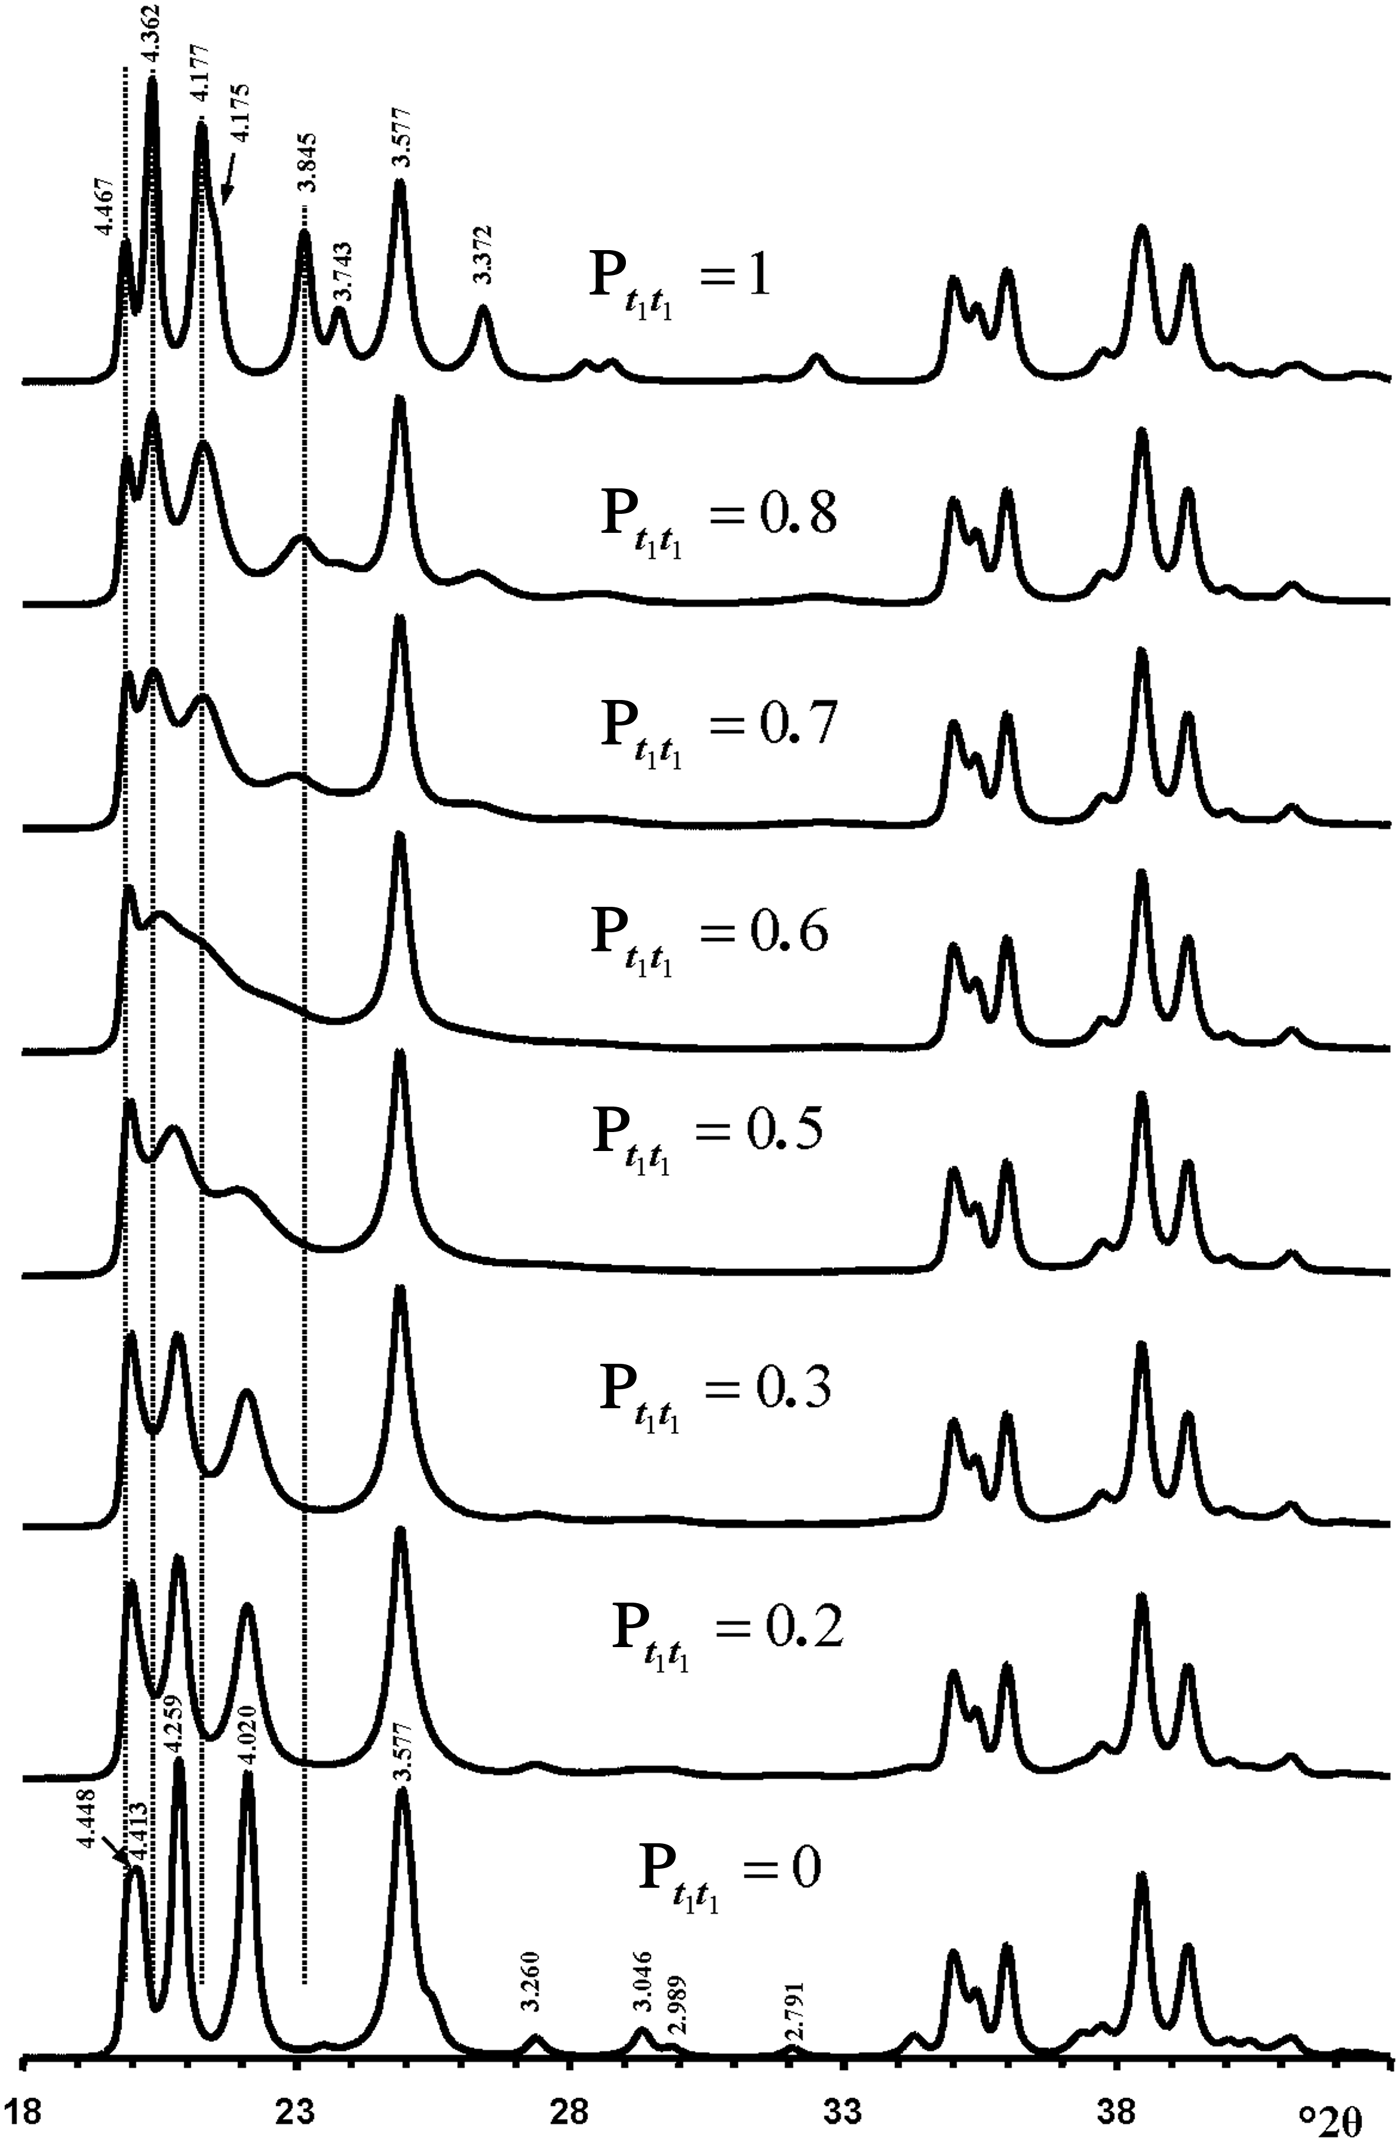
Fig. 10. Evolution of the XRD patterns reflecting a structural transformation from the defect-free kaolinite (Pt1t1 = 1) to the defect-free two-layer periodic halloysite structure 2M 1 (Pt1t1 = 0) via a set of defective halloysite structures calculated at various Pt1t1 values.
Furthermore, increasing or decreasing the Pt1t1 value from 0 and 1.0, respectively, significantly increases the intensity of the diffuse background within the 02l, 11l diffraction region. Finally, a remarkable feature of the XRD patterns shown in Fig. 10 is that the most intense 021 and 11![]() $\bar{2}$ reflections of the ordered and disordered halloysite are located in the middle of the positions of the most intense 1
$\bar{2}$ reflections of the ordered and disordered halloysite are located in the middle of the positions of the most intense 1![]() $\bar{1}$0, 110 and 1
$\bar{1}$0, 110 and 1![]() $\bar{1}\bar{1}$, 11
$\bar{1}\bar{1}$, 11![]() $\bar{1}$ maxima of the ordered and partially disordered kaolinite structures.
$\bar{1}$ maxima of the ordered and partially disordered kaolinite structures.
Simulation of the experimental XRD patterns of prismatic halloysite
Analysis of the XRD patterns of the samples consisting of prismatic halloysite particles (Fig. 6a–f) has shown that the Drag-2 and Col-2 samples are very similar and that the diffraction features of Drag-1 are intermediate between those of samples Col-1 and Ru-1. Similarly, diffraction features of Ru-3 are intermediate between those of Col-2 and Ru-2. For this reason, the samples from the Dragon Mine and Ru-3 were excluded from the simulation procedure, because their structural features should be intermediate or similar to those determined by modelling of the other halloysite samples.
Sample Col-1
The most distinct feature of the XRD pattern of this sample is that, along with rather strong and narrow 021 and 11![]() $\bar{2}$ reflections, it contains a set of very weak reflections whose positions are similar to those of the ordered 2M 1 halloysite; compare Fig. 10 (Pt1t1 = 0) and insert in Fig. 6a. At first sight, the pattern indicates a monomineralic halloysite phase and a small amount of quartz. However, a more careful comparison of the XRD pattern with those calculated for the structural models with various Pt1t1 (Fig. 10) shows – at least at a qualitative level – that the sample consists of two phases that differ from each other by the nature and content of stacking faults. Indeed, the comparison of the relative intensities of the 020, 021 and 11
$\bar{2}$ reflections, it contains a set of very weak reflections whose positions are similar to those of the ordered 2M 1 halloysite; compare Fig. 10 (Pt1t1 = 0) and insert in Fig. 6a. At first sight, the pattern indicates a monomineralic halloysite phase and a small amount of quartz. However, a more careful comparison of the XRD pattern with those calculated for the structural models with various Pt1t1 (Fig. 10) shows – at least at a qualitative level – that the sample consists of two phases that differ from each other by the nature and content of stacking faults. Indeed, the comparison of the relative intensities of the 020, 021 and 11![]() $\bar{2}$ reflections in the experimental XRD pattern with those in the XRD patterns calculated at various Pt1t1 varying from 0 to 0.4 indicates that the most similar intensity distribution of these reflections is observed in the XRD pattern calculated at Pt1t1 = 0.2 (Figs 6, 10). Nevertheless, the direct comparison of the experimental XRD pattern and that calculated for the model at Pt1t1 = 0.2 reveals two distinct features (Fig. 11). First, the relative intensity of the calculated 11
$\bar{2}$ reflections in the experimental XRD pattern with those in the XRD patterns calculated at various Pt1t1 varying from 0 to 0.4 indicates that the most similar intensity distribution of these reflections is observed in the XRD pattern calculated at Pt1t1 = 0.2 (Figs 6, 10). Nevertheless, the direct comparison of the experimental XRD pattern and that calculated for the model at Pt1t1 = 0.2 reveals two distinct features (Fig. 11). First, the relative intensity of the calculated 11![]() $\bar{2}$ reflection is much higher than that of the experimental one. Second, the significant background separating individual 020, 021 and 11
$\bar{2}$ reflection is much higher than that of the experimental one. Second, the significant background separating individual 020, 021 and 11![]() $\bar{2}$ reflections from the baseline of the experimental XRD pattern is probably due to a contribution from a low-ordered population of kaolinite crystallites. As was mentioned above, the strongest reflections of halloysite are located at the midpoint between the positions of the most intense reflections of kaolinite. In addition, decreasing Pt1t1 values from 1 significantly redistributes the intensities of the 02l, 11l reflections and increases the background separating these reflections from the baselines of the calculated XRD patterns. Figure 11 compares the experimental XRD pattern corresponding to the 02l, 11l and 20l, 13l diffraction regions with that obtained by summation in a 50:50 ratio of the XRD patterns calculated at Pt1t1 equal to 0.2 and 0.7. This result supports the assumption of a two-phase composition. However, various Pt1t1 values do not have any influence on the intensities and positions of reflections in the 20l, 13l diffraction regions (Fig. 11). As a result, the observed difference between experimental and calculated profiles corresponding to the 20l, 13l diffraction region shows that some additional structural parameters are needed to provide better correlation between the experimental and calculated profiles in this particular region.
$\bar{2}$ reflections from the baseline of the experimental XRD pattern is probably due to a contribution from a low-ordered population of kaolinite crystallites. As was mentioned above, the strongest reflections of halloysite are located at the midpoint between the positions of the most intense reflections of kaolinite. In addition, decreasing Pt1t1 values from 1 significantly redistributes the intensities of the 02l, 11l reflections and increases the background separating these reflections from the baselines of the calculated XRD patterns. Figure 11 compares the experimental XRD pattern corresponding to the 02l, 11l and 20l, 13l diffraction regions with that obtained by summation in a 50:50 ratio of the XRD patterns calculated at Pt1t1 equal to 0.2 and 0.7. This result supports the assumption of a two-phase composition. However, various Pt1t1 values do not have any influence on the intensities and positions of reflections in the 20l, 13l diffraction regions (Fig. 11). As a result, the observed difference between experimental and calculated profiles corresponding to the 20l, 13l diffraction region shows that some additional structural parameters are needed to provide better correlation between the experimental and calculated profiles in this particular region.
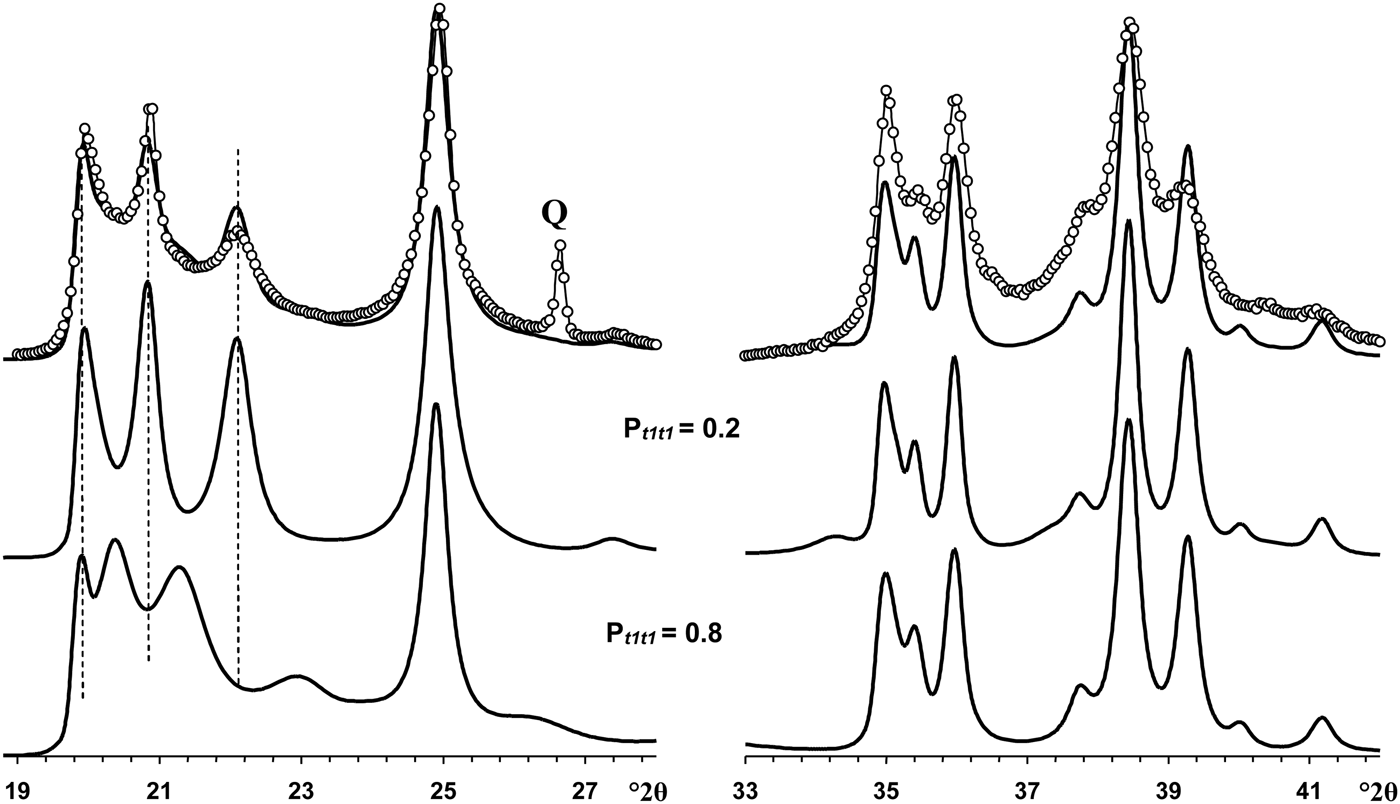
Fig. 11. Portions of the experimental XRD pattern of sample Col-1 (dotted line) corresponding to the 02,11 (left) and 20,13 (right) regions compared with those obtained by summation of the XRD patterns calculated at Pt1t1 = 0.2 and Pt1t1 = 0.8 and taken in the ratio 50:50. Q = reflection of quartz impurity.
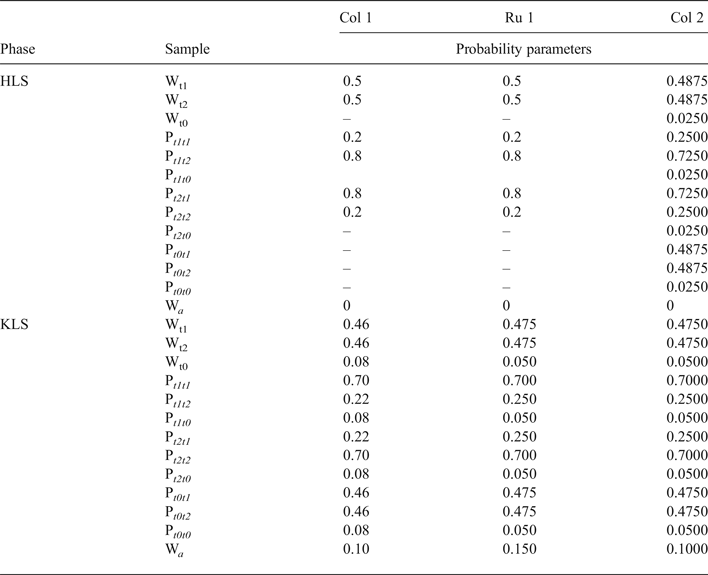
The defective structure of each of the coexisting phases in the sample was determined by a trial-and-error method by variation of structural parameters, which influence both the positions and intensities of the coexisting HLS and KLS structural model phases, respectively. The best possible agreement between the experimental and modelled powder XRD patterns of the sample was achieved using a set of parameters that describe the structural models of the HLS and KLS phases (Table 7). Both phases have identical unit cell parameters, Cm symmetry of the orthogonal layer cell, the same set of layer displacements and atomic coordinates as given in Tables 1 and 2. Two characteristic features of the sample should be mentioned: first, the basal reflections of both phases are narrow and form rational series; and second, the thickness of the layers (1:1 layer + interlayer), equal to 7.145 Å, is smaller than those of defect-free and defective kaolinites (7.1575 Å; Sakharov et al., Reference Sakharov, Drits, McCarty and Walker2016). Indeed, Dixon & McKee (Reference Dixon and McKee1974), who studied tubular halloysites from Wagon Wheel Gap, CO, USA, also noted that the sharpness of the basal reflections at 7.14 and 3.57 Å of their samples is more characteristic of kaolinite than many halloysites.
Table 7. Simulation parameters of defective phases HLS and KLS and phase contents, WHLS, WKLS and WHCS in the Col-1, Ru-1 and Col-2 samples.

W Q = content of quartz.
In the HLS phase, the t1 and t2 layer-displacement vectors occur with the same probability and have the short-range order factor R = 1. The independent probability parameters describing subsequences of the interstratified layer displacements are equal to Pt1t1 = Pt2t2 = 0.2 and Pt1t2 = Pt2t1 = 0.8. The complete set of probability parameters is given in Table 8. The particular feature of the HLS phase is that the length of the interlayer displacement varies around the average one along the a 0 axis according to a Gaussian distribution with the characteristic width (in fraction of the a 0 parameter) δx = 0.06 (Table 7).
Table 8. Completed set of probability parameters characterizing the alternation of layer translations in the Col-1, Ru-1 and Col-2 samples.
The KLS phase along with the t1 and t2 layer displacements contains the third displacement, t0 = 0.3698a0, which occurs in the relative proportion 0.08 and is interstratified with t1 and t2 interlayer-displacement vectors with R = 1. To describe the three-component system, one has to specify each of 12 probability parameters, which are related by equations 9 (Drits & Tchoubar, Reference Drits and Tchoubar1990; Sakharov & Lanson, Reference Sakharov, Lanson, Bergaya and Lagaly2013):
 $$\eqalign{&{\rm P}_{t1t1} + {\rm P}_{t1t2} + {\rm P}_{t1t0} = {\rm} 1;\cr & {\rm} {\rm W}_{t1} = {\rm} {\rm W}_{{\rm t}1}{\rm P}_{t1t1} + {\rm} {\rm W}_{{\rm t}2}{\rm P}_{t2t1} + {\rm} {\rm W}_{{\rm t}0}{\rm P}_{t0t1};\cr & {\rm} {\rm W}_{{\rm t}1} + {\rm} {\rm W}_{{\rm t}2} + {\rm} {\rm W}_t0 = {\rm} 1 \cr &{\rm P}_{t2t1} + {\rm P}_{t2t2} + {\rm P}_{t2t0} = {\rm} 1;\cr & {\rm} {\rm W}_2 = {\rm} {\rm W}_{{\rm t}1}{\rm P}_{t1t2} + {\rm} {\rm W}_{t2}{\rm P}_{t2t2} + {\rm} {\rm W}_{{\rm t}0}{\rm P}_{t0t2};\cr & {\rm P}_{t0t1} + {\rm P}_{t0t2} + {\rm P}_{t0t0} = {\rm} 1;\cr & {\rm W}_3 = {\rm} {\rm W}_{{\rm t}1}{\rm P}_{t1t0} + {\rm} {\rm W}_{{\rm t}2}{\rm P}_{t2t0} + {\rm} {\rm W}_{{\rm t}0}P_{t0t0},{\rm} \cr & {\rm as} \ {\rm} {\rm W}_{{\rm t}0} = {\rm} 0.08,{\rm} {\rm W}_{{\rm t}1} = {\rm} {\rm W}_{{\rm t}2} = {\rm} 0.46}$$
Because of the relations in equations 9, the number of independent junction probability parameters needed to characterize the three-component structural model of the KLS phase is four: Pt1t1 = 0.70, Pt0t2 = 0.46, Pt2t0 = Pt0t0 = 0.08 – the complete set of probability parameters is given in Table 7. The second feature of the KLS phase is the presence of 10% of arbitrary stacking faults, Wa, which displace adjacent layers in arbitrary directions and lengths within each interlayer (details in Drits & Tchoubar, Reference Drits and Tchoubar1990). The XRD patterns corresponding to the HLS, KLS and quartz phases taken in the ratio 0.46:0.48:0.06, respectively, provides the best agreement of the experimental and calculated XRD patterns at Rp = 11.5%.
In the 02l, 11l diffraction region (Fig. 12a), the HLS phase contributes significantly to the positions, widths and intensities of the reflections, whereas the KLS crystallites mostly contribute to the background, to decreasing resolution between adjacent 020, 021 and 11![]() $\bar{2}$ reflections and to the intensity of the 020 reflection. However, in the 20l, 13l diffraction region, the correlation between the experimental and simulated XRD patterns is not perfect, mostly because of a gap observed between the experimental and simulated intensities from 36.6 to 38.0°2θ (Fig. 12a). This gap is probably related to the presence of the HCS phase because it is exactly in this angular range that the XRD pattern of the HCS phase contains a significantly enhanced intensity in the 20,13 band (Fig. 7). To check this possibility, the experimental XRD patterns were compared with a sum of the XRD patterns of the HLS, KLS and HCS phases. The best agreement between the experimental XRD pattern and that obtained by the optimal summation of the XRD patterns of the coexisting phases was achieved at Rp = 9.4% with a ratio of 0.51:0.29:0.15:0.05 for the HLS, KLS, HCS and quartz phases, respectively (Figs 13a, 14a). The addition of the HCS phase is accompanied by a significant decrease of the KLS phase (from 0.50 to 0.30) and an increase of the HLS content (from 0.46 to 0.50) – all parameters are given in Table 7.
$\bar{2}$ reflections and to the intensity of the 020 reflection. However, in the 20l, 13l diffraction region, the correlation between the experimental and simulated XRD patterns is not perfect, mostly because of a gap observed between the experimental and simulated intensities from 36.6 to 38.0°2θ (Fig. 12a). This gap is probably related to the presence of the HCS phase because it is exactly in this angular range that the XRD pattern of the HCS phase contains a significantly enhanced intensity in the 20,13 band (Fig. 7). To check this possibility, the experimental XRD patterns were compared with a sum of the XRD patterns of the HLS, KLS and HCS phases. The best agreement between the experimental XRD pattern and that obtained by the optimal summation of the XRD patterns of the coexisting phases was achieved at Rp = 9.4% with a ratio of 0.51:0.29:0.15:0.05 for the HLS, KLS, HCS and quartz phases, respectively (Figs 13a, 14a). The addition of the HCS phase is accompanied by a significant decrease of the KLS phase (from 0.50 to 0.30) and an increase of the HLS content (from 0.46 to 0.50) – all parameters are given in Table 7.
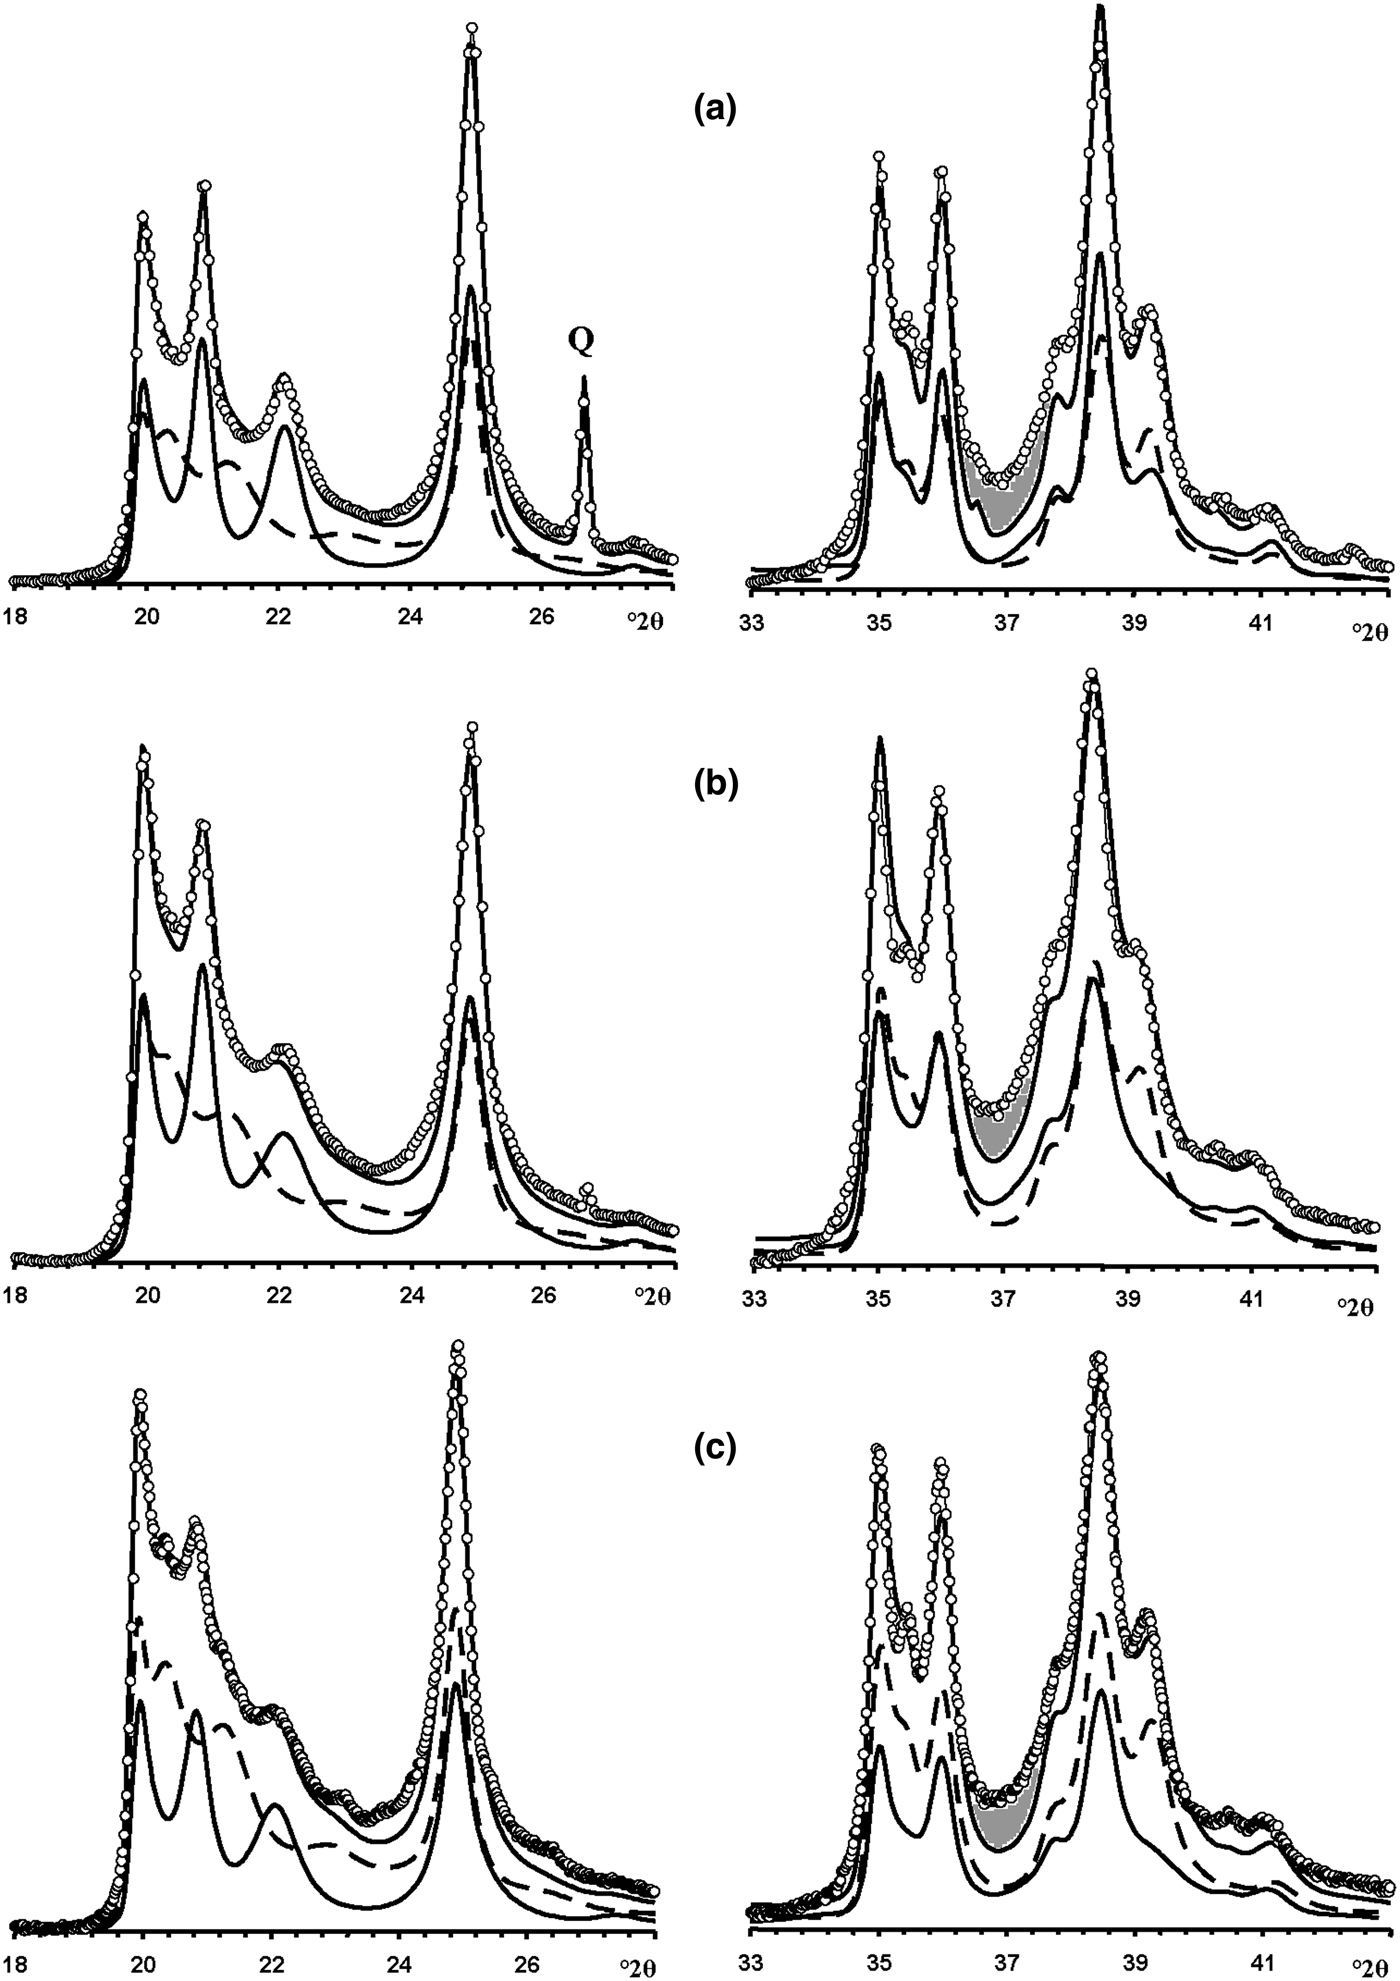
Fig. 12. Portions of the experimental XRD patterns of samples Col-1 (a), Ru-1 (b) and Col-2 (c) (dotted lines) corresponding to the 02,11 (left) and 20,13 (right) regions compared with those (solid lines) obtained by the optimal summation of the XRD patterns of the HLS and KLS phases (lower solid and dashed lines). Dark shaded areas denote the most significant difference between the experimental and calculated intensities observed within 36–39°2θ.
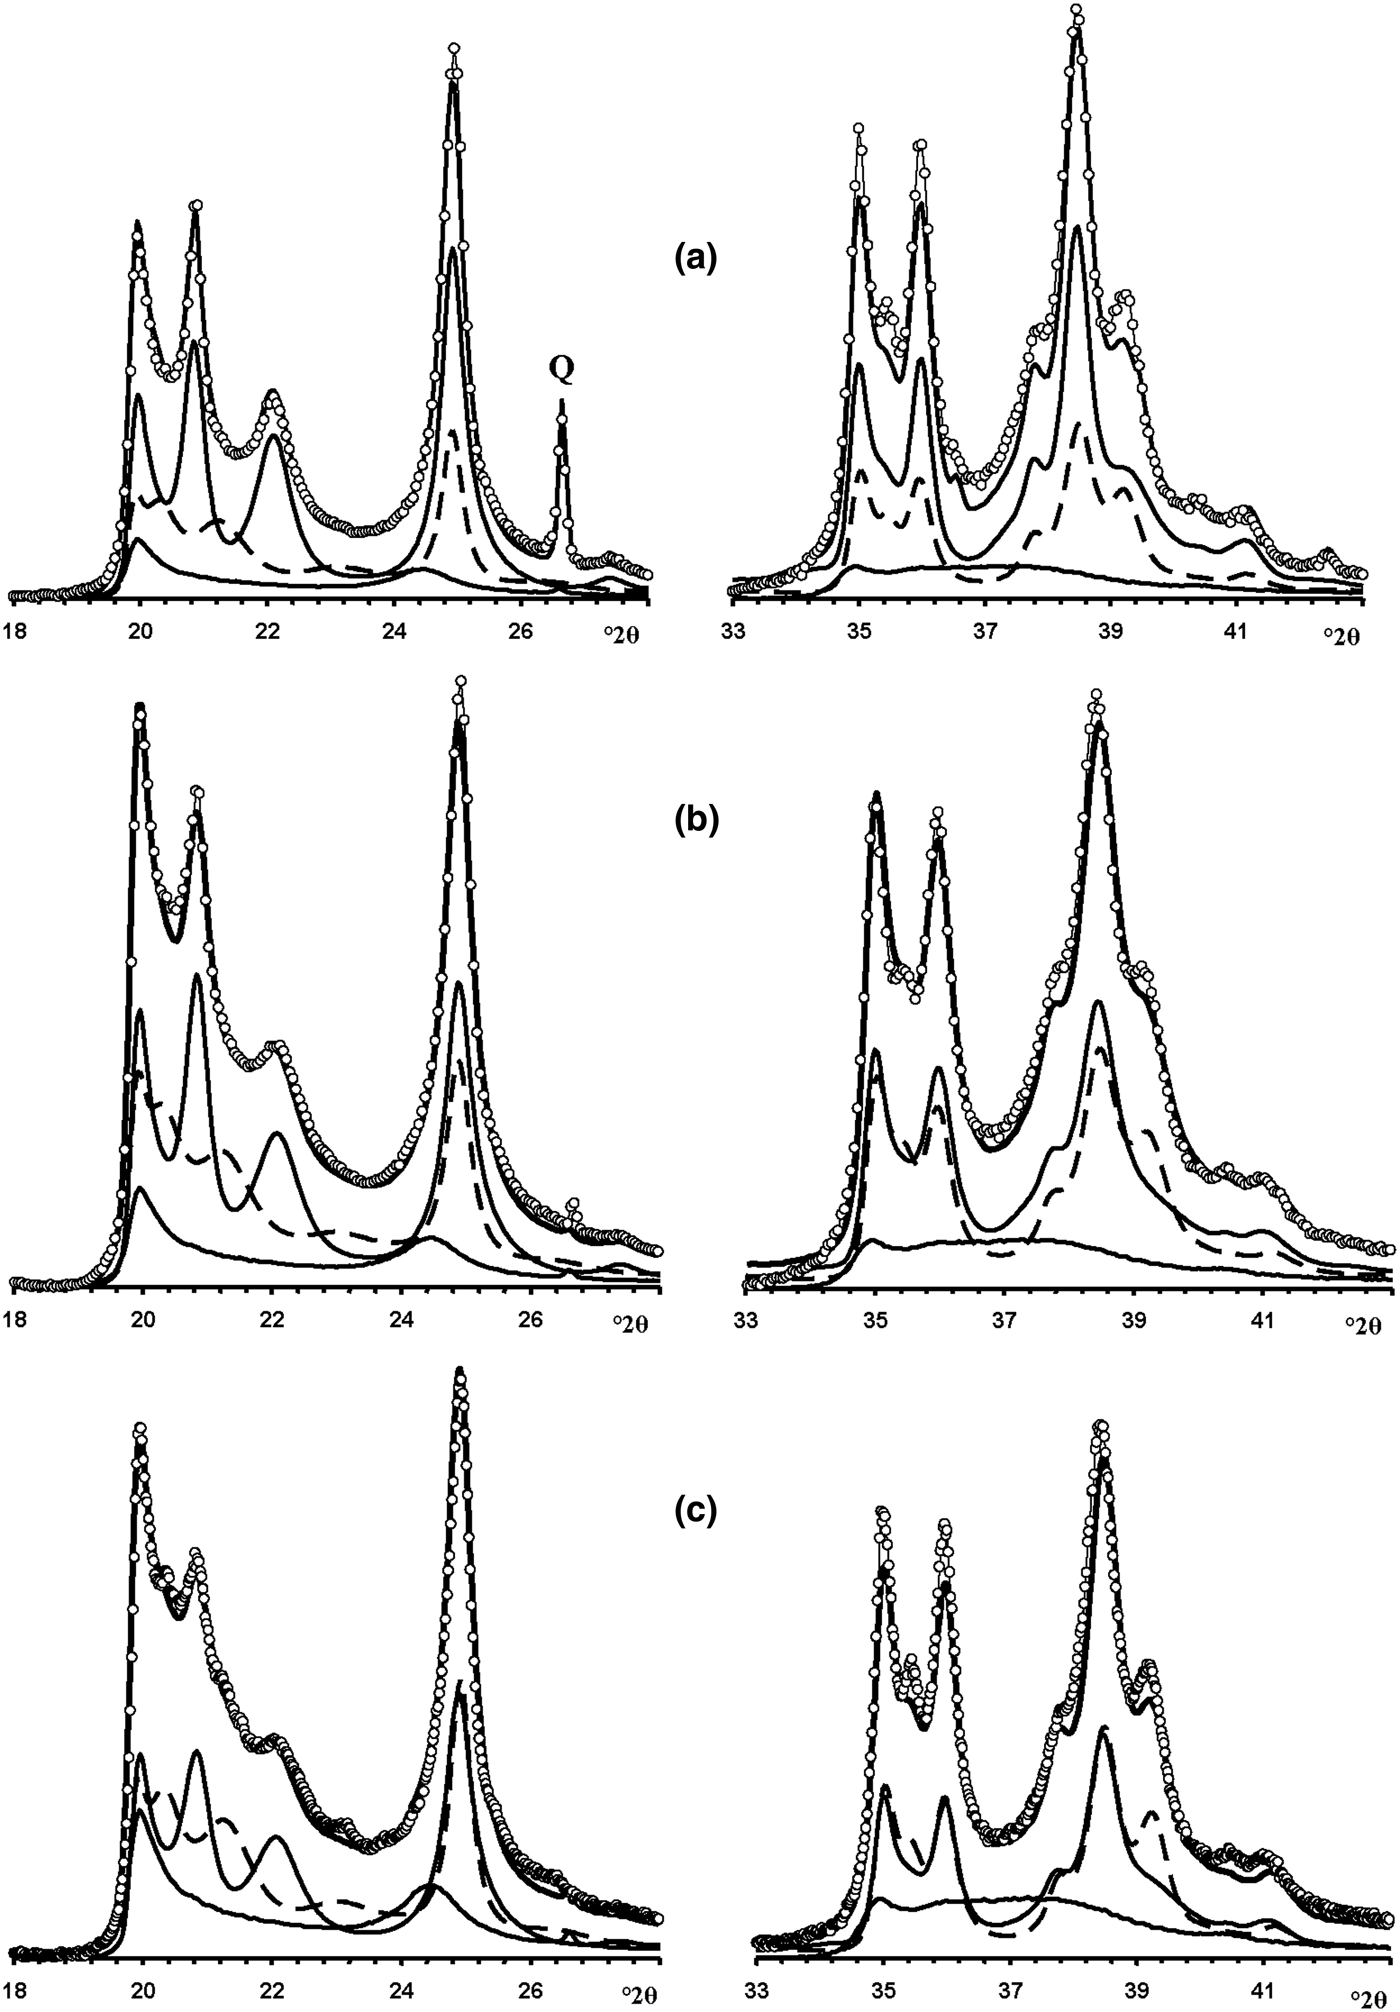
Fig. 13. Fragments of the experimental XRD patterns of samples Col-1 (a), Ru-1 (b) and Col-2 (c) (dotted lines) corresponding to the 02,11 (left) and 20,13 (right) regions compared with those (solid lines) obtained by the optimal summation of the XRD patterns of the HLS, KLS and HCS phases (lower solid and dashed lines).
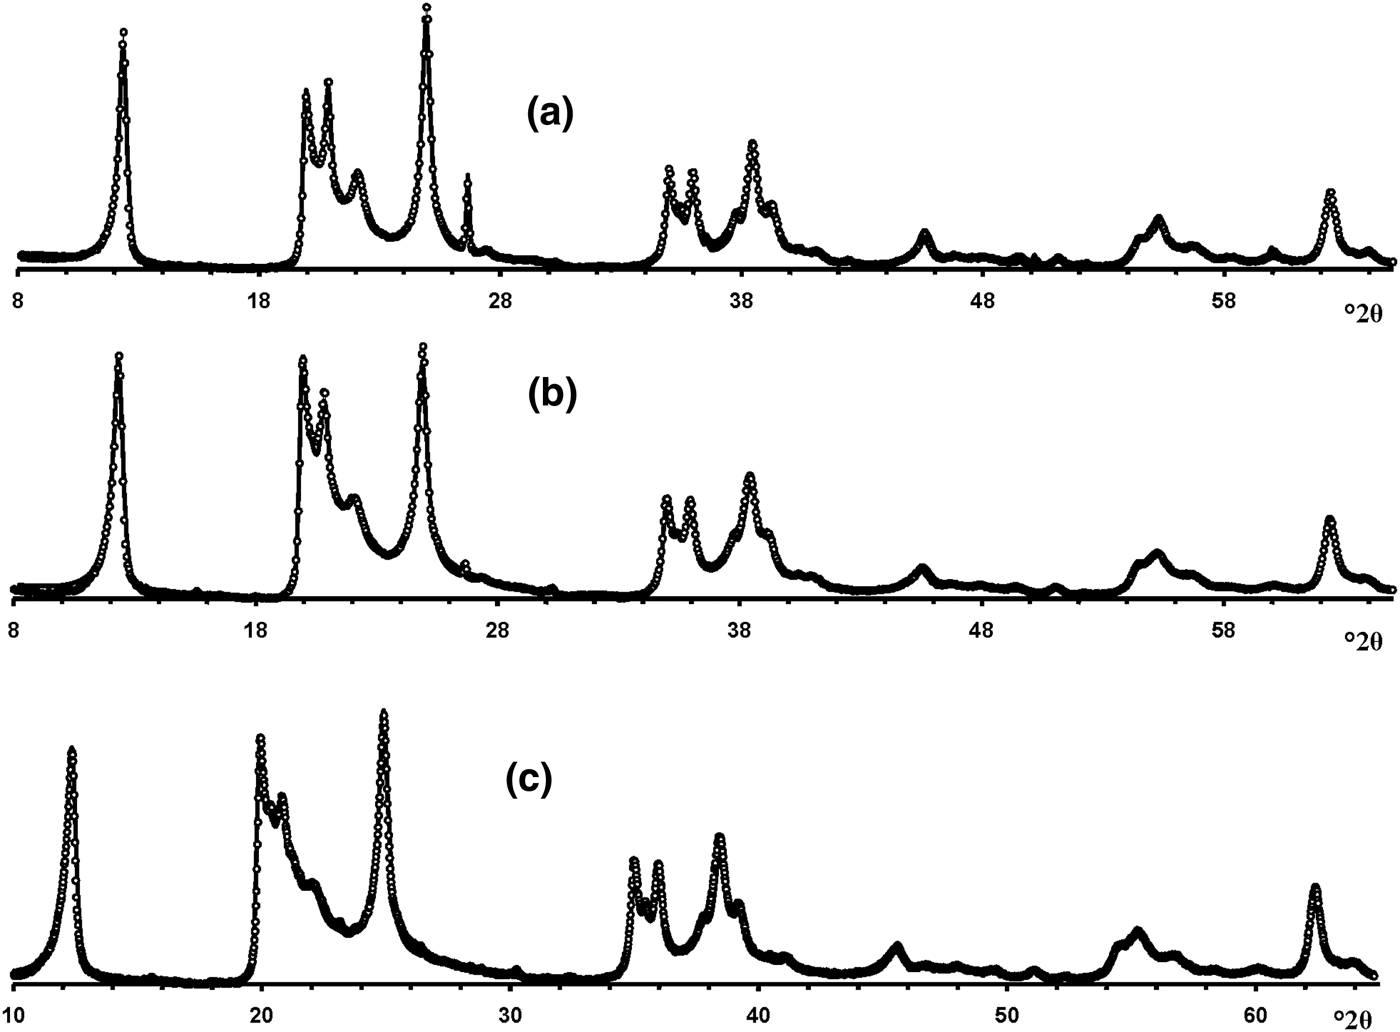
Fig. 14. Best possible agreement between the experimental XRD patterns of samples Col-1 (a), Ru-1 (b) and Col-2 (c) and those calculated by the optimal summation of the XRD patterns of the HLS, KLS and HCS phases.
Sample Ru-1
Modelling of this sample (Fig. 14b) showed that its phase composition is similar to that of sample Col-1. Both samples contain the HLS and KLS phases, which have similar unit cell parameters and layer displacements (Table 7). In both samples, the HLS phases have the same ratio and distribution of the t1 and t2 layer displacements, and the length of the interlayer displacement varies around the average one along the a 0 axis with the characteristic width equal to δx = 0.10 compared to δx = 0.06 for the HLS phase in Col-1 (Table 7). In the KLS phases of both samples, the t1, t2 and t0 layer displacements, occurring in a ratio of 0.475:0.475:0.05, are interstratified with R = 1, and four independent probability parameters (Pt1t1 = 0.70, Pt0t2 = 0475, Pt2t0 = Pt0t0 = 0.05) in combination with equation 9 fixes the other five values (Table 8). In the KLS phase, the occurrence probability of arbitrary stacking faults is equal to 0.15, compared to 0.10 determined for the KLS phase of Col-1. The XRD patterns corresponding to the HLS and KLS phases taken in equal proportions provided the optimal agreement between the experimental and calculated XRD patterns at Rp = 10.5% (Table 7, Fig. 12b). However, again, the 20,13 region from 36 to 38°2θ shows a gap between the intensities of the XRD pattern and those simulated in terms of the two-phase model. As with sample Col-1, the experimental XRD pattern of the sample was simulated using XRD patterns of the HLS, KLS and HCS phases. The best agreement between the experimental and simulated XRD patterns was achieved at Rp = 8.7% with the ratio of the coexisting phases equal to 0.46:0.38:0.16 (Table 7, Figs 13b, 14b). As in sample Col-1, the transition from the two-phase to the three-phase model results in a significant decrease of the KLS phase content (from 0.50 to 0.38) with little variation of the HLS phase content (0.46 vs. 0.50) (Table 7). The relationship between CSD diameters and the particular set of hk regions used for simulation of the XRD pattern is given in Table 7.
Sample Col-2
The main diffraction feature of the XRD pattern of this sample is the further decrease of intensities of the reflections, which are diagnostic of the HLS phase. Nevertheless, the sample contains both HLS and KLS phases, each of which has identical unit cell parameters (Table 7). The HLS phase, in contrast to those described above, contains three layer displacements, t1, t2 and to, in the ratio 0.4875:0.4875:0.025, interstratified at R = 1. Their distribution is described by four independent probability parameters: Pt1t1 = 0.25, Pt0t2 = 0.4875, Pt2t0 = Pt0t0 = 0.025 (Table 7), and the complete set of the probability parameters is given in Table 8. In the HLS phase, as in the prismatic samples described above, the length of each interlayer displacement varies around the average one along the a 0 axis with the characteristic width δx = 0.08 (Table 7).
In the KLS phase of the sample, the t1, t2 and to layer displacements are interstratified at R = 1 in the ratio 0.475:0.475:0.05 and their distribution is described by four independent probability parameters, Pt1t1 = 0.7, Pt0t0 = 0.475 and Pt2t0 = Pt0t0 = 0.05, with the amount of arbitrary stacking faults within interlayers equal to 0.10. The complete set of the probability parameters is given in Table 8. The XRD patterns corresponding to the HLS and KLS phases taken in a ratio of 0.37:0.63, respectively, provides the optimal agreement of the experimental and calculated XRD patterns at Rp = 10.8% (Fig. 12c). The dominating contribution of the KLS phase to the experimental XRD pattern is reflected in the low intensity of the halloysite-like reflections at 4.262 and 4.029 Å (Fig. 12c). Nonetheless, like the previous prismatic samples, a significant discrepancy between intensities of the profiles of the experimental and calculated XRD patterns in the 20l, 13l diffraction region within 36.4–38.0°2θ (Fig. 12c) shows that the sample contains some of the HCS phase. The optimal summation of the XRD patterns of the HLS, KLS and HCS phases in the ratio 0.37:0.37:0.26 provided the best agreement with the experimental XRD pattern at Rp = 8.7% (Figs 13c, 14c). As with the previous two samples, addition of the HCS phase does not change the HLS content, but the presence of the HCS phase was compensated by a substantial decrease of the KLS phase. Table 7 shows the relationship between the CSD diameter values and the particular set of hk regions used for simulation of the XRD pattern.
DISCUSSION
The main aim of this work was to determine the phase composition and structural features of the coexisting phases in halloysite samples having tubular morphology using an XRD modelling approach. The good agreement between the experimental and calculated XRD patterns obtained for the entire 10–65°2θ diffraction region, with low profile fitting factors (Rp = 8.7–10.3%), is considered strong evidence for the validity of the models (Figs 8–14). The samples investigated consist of either single, two or three phases, and a number of structural features of the coexisting phases depend on the morphology of the particles. The samples formed of prismatic particles consist of the HLS, KLS and HCS phases, populations of proper cylindrical tubes consist of a single HCS phase, whereas those samples formed by particles having morphologies intermediate between proper cylindrical and well-developed prismatic forms consist of the KLS and HCS phases. This may imply that the HLS crystallites were formed on the flat faces of the prismatic tubes. In contrast, the structural features of the KLS phase depend on the particular morphology of the sample. The HCS phase exists in all tubular halloysites, but its content is much lower in the prismatic samples. However, the most significant result of the current work is that the structural models of the coexisting HLS and KLS phases, which provide the good correlation between the experimental and calculated XRD patterns of halloysite (7 Å), were all obtained using the same structural and probability parameters that can be used to describe the defect-free planar kaolinite structure refined by Bish & von Dreele (Reference Bish and von Dreele1989). That is, the studied samples consist of the same (C-vacant) type of layers with the same set of atoms and atomic coordinates, and the layer-stacking arrangements are composed of the same layer-displacement vectors t1, t2 and t0. In other words, kaolinite and halloysite varieties are all built of the same structural units.
Structural similarities and differences between planar and tubular kaolin varieties
Until recently, the relationship between kaolinite and halloysite had remained unclear. For example, in the comprehensive review devoted to the genesis, crystal structure and morphological diversity of halloysite, Joussein et al. (Reference Joussein, Petit, Churchman, Theng, Righi and Delvaux2005) noted that the differentiation of halloysite and kaolinite was still problematic and required further special attention. They stated that there is no ideal test to distinguish halloysite from kaolinite in mixtures. More recently, Churchman et al. (Reference Churchman, Pasbakhsh, Lowe and Theng2016), based on the results of intercalation of halloysite by a set of polar organic molecules, concluded that the intercalation process does not lead to a kaolinite layer stacking, suggesting that halloysites are structurally different from kaolinite. New insights into the phase composition and structural features of the coexisting phases obtained by simulation of the experimental XRD patterns of the studied samples in combination with the structural features of natural kaolinites (Brindley & Robinson, Reference Brindley and Robinson1948; Brindley, Reference Brindley and Brown1961; Bailey, Reference Bailey1963; Bookin et al., Reference Bookin, Drits, Planćon and Tchoubar1989; Plançon et al., Reference Plançon, Giese, Snyder, Drits and Bookin1989; Sakharov et al., Reference Sakharov, Drits, McCarty and Walker2016) creates an opportunity to propose a more coherent relationship between kaolinite and halloysite (7 Å) structural features.
Planar kaolin varieties
As mentioned previously, kaolinite varieties have either the defect-free or a medium or strongly defective structure. The main source of defects in kaolinite structures is the interstratification of thin enantiomorphic kaolinite fragments that are formed due to the random interstratification of the layer-displacement vectors t1 and t2 (Fig. 1). Perfectly ordered kaolinite is of rather rare occurrence and it more commonly forms a physical mixture with a low-ordered kaolinite. Such mixtures are usually referred to as ‘well-ordered’ kaolinites, but previous modelling of their XRD patterns has shown that the relative content of the high-ordered phase is typically only 25–35% (Plançon et al., Reference Plançon, Giese, Snyder, Drits and Bookin1989; Sakharov et al., Reference Sakharov, Drits, McCarty and Walker2016). The low-ordered kaolinites along with t1 and t2 layer displacements contain up to 5% of the layer-displacement vector t0, which has the same length as that of the t1 and t2 vectors and is oriented along the layer mirror plane. In addition, the interlayer of these kaolinite varieties may contain up to 5% of arbitrary stacking faults (Plançon et al., Reference Plançon, Giese, Snyder, Drits and Bookin1989; Sakharov et al., Reference Sakharov, Drits, McCarty and Walker2016).
Prismatic kaolin varieties (7 Å)
The studied prismatic samples consist of three phases – KLS, HLS and HCS – and their characteristic feature is that the stacking of the layers along the c* axis is periodic, the layer thicknesses of the coexisting phases are identical for each sample and the values for various samples vary from 7.145 to 7.154 Å (Table 7). The same thickness of layers in each of the coexisting phases present in the studied prismatic samples may indicate that dehydration proceeds more readily to a completely dehydrated structure in the planar layers of prismatic samples.
KLS phase
The structural parameters describing the KLS phase are like those of the low-ordered kaolinite varieties that occur together with defect-free kaolinite. Indeed, both phases have identical unit-cell parameters, layer-displacement vectors and arbitrary stacking faults. However, the content and distribution of these parameters, at least for the studied KLS phases, differ substantially from those found for low-ordered kaolinite. In the latter, the layer displacements are distributed at random, whereas in the KLS phase found in tubular halloysites, the layer displacements are distributed at R = 1 in such a way that t1 and t2 displacements have a strong tendency to be segregated. In other words, the occurrence probabilities for the layer pairs having identical layer displacements t1t1 and t2t2 are significantly higher than those for layer-displacement fragments t1t2 and t2t1 (Tables 5, 7). As a result, the partially segregated, rather thick enantiomorphic kaolinite fragments produce well-defined diffraction maxima in the 02,11 region of the XRD patterns of the KLS phase (Figs 9, 11). In further contrast to low-ordered kaolinite, the KLS phase contains a significant content of arbitrary stacking faults increasing up to 10–20% (Tables 5, 7). These stacking faults may be a result of the layer curvature near boundaries with the surfaces of the HCS phase or may appear within the numerous border zones between adjacent faces in the prismatic particles. Their presence significantly modifies the intensity distribution in the 20,13 diffraction regions.
As demonstrated, the best possible agreement between the experimental and calculated XRD patterns was obtained for the model in which both phases (KLS, HLS) of each sample have Wt1 = Wt2. This assumption is justified for the HLS phase in which a noticeable tendency to the ordered alternation of the layer-displacement vectors t1 and t2 is reasonable. However, the equal content of t1 and t2 layer displacements in the KLS phase is not obvious. The most distinct feature of the KLS phase with respect to that of low-ordered kaolinite is a tendency for the same type of layer displacements to be segregated. One can show that this effect depends on both the proportions of the t1 and t2 vectors and the occurrence probability parameters Pt1t1 and Pt2t2, controlling the distribution of these vectors in the KLS phase. In particular, almost the same XRD patterns were obtained for the two following models: Wt1 = Wt2 = 0.5, Pt1t1 = 0.7 and R = 1; and Wt1 = 0.7, Wt2 = 0.3, Pt2t2 = 0.5 and R = 1, because in both models the occurrence probability for layer displacements Pt1t1 and Pt2t2 is higher than that for Pt1t2 and Pt2t1.
HLS phase
In our collection, each sample having particles of prismatic shape contains a significant content of the HLS phase. Therefore, in the 02,11 regions, the XRD patterns of the KLS phases are overlapped with those of the HLS phases. As a result, the weak but diagnostic peaks of the KLS phase located between the more intensive maxima of the HLS phase are observed like a background in the experimental XRD patterns of the samples (Figs 11, 12).
Structural parameters describing the HLS phase are identical to those describing the KLS phase (Table 7). The main difference between them is in the distributions of the layer displacements. In contrast to the KLS phase in which a tendency to segregation of the same type of layer displacement t1 or t2 prevails, in the HLS phase, a tendency to the regular alternation of these displacements dominates. Indeed, as can be seen in Table 8, in the HLS phase, the occurrence probabilities for the layer displacement pairs t1t2 and t2t1 are higher than those for the layer displacement pairs t1t1 and t2t2. Another structural feature that is characteristic of the HLS phases is that the length of the interlayer displacement along the a 0 axis varies around the average one and the δx values are equal to 0.06–0.10. The most significant difference in the parameters describing the KLS and HLS phases is that the latter phase does not contain arbitrary stacking faults. One possible explanation for this is that the formation of the HLS phase took place in parts of the prismatic particles in which faces were built up by successive planar layers with only a low level of distortion of hydrogen bonds at the boundaries joining adjacent planar faces of the prismatic tubes.
Cylindrical kaolin varieties
Cylindrical tubes are scrolled dioctahedral 1:1 layers having kaolinite composition, and their population forms the HCS phase that is a single representative of halloysite that has no obvious layer-stacking features in common with those of planar kaolinite. Samples consisting of particles having morphologies intermediate between cylindrical and prismatic forms contain the HCS and KLS phases. The most distinct feature of the latter is interstratification of hydrated 10 and 7.25 Å layers. The thickness of 7.25 Å layers is larger than that of layers of the prismatic KLS and HLS phases. Presumably, this signifies that the 7.25 Å layers are not completely dehydrated and their enhanced thickness is related to the presence of some H2O molecules in their interlayers. The distributions of these molecules within individual interlayers and among various interlayers are presumably heterogeneous. Indirect evidence of partial dehydration of the KLS phase consists of the length of the layer thickness varying around the averaged one along the z-axis with an unusually high value of the Gaussian distribution width, σz = 0.25–0.30 (Table 5). It is possible to assume that the KLS phases in the two-phase samples represent a spectrum of mixed-layer structures containing various proportions of 10 and 7.20–7.25 Å layers. The layer thickness in the KLS phases being >7.16 Å shows that hydrogen bonding between adjacent layers is weaker, and potentially this creates a favoured ability for such interlayers to expand when the sample is intercalated by certain polar organic molecules (Churchman & Gilkes, Reference Churchman and Gilkes1989).
Which crystallographic direction is preferential for scrolling of halloysite tubes?
Many authors have supposed that, in tubular halloysite, the long axis of the tubes frequently coincides with the b axis and only seldom with the a axis without specification of these crystallographic directions, or they assume that these directions correspond to those of kaolinite (Bates et al., Reference Bates, Hildebrand and Swineford1950; Honjo & Mihama, Reference Honjo, Kitamura and Mihama1954; Chukhrov & Zvyagin, Reference Chukhrov, Zvyagin, Heller and Weiss1966; Zvyagin, Reference Zvyagin1967; Kohyama et al., Reference Kohyama, Fukushima and Fukami1978; Bailey, Reference Bailey, Farmer and Tardy1990; Robertson & Eggleton, Reference Robertson and Eggleton1991; Bobos et al., Reference Bobos, Duplay, Rocha and Gomes2001; Joussein et al., Reference Joussein, Petit, Churchman, Theng, Righi and Delvaux2005; Churchman et al., Reference Churchman, Pasbakhsh, Lowe and Theng2016). As such, until now the answer to the question as to why and which crystallographic direction is preferential for scrolling of halloysite tubes remained unclear. The results of the present work demonstrate unambiguously that the long axis of tubular halloysite, as a rule, coincides with the b 0 axis of the orthogonal cell. Rolling around this axis preserves the mirror plane within the tube and therefore is accompanied by minimal possible distortion of the halloysite layer structure. The direct evidence of the coincidence of the long axis of halloysite with the b 0 axis follows from the interpretation of the SAED patterns presented by Zvyagin (Reference Zvyagin1964, Reference Zvyagin1967) and Kogure et al. (Reference Kogure, Mori, Drits and Takai2013) and simulation of the experimental XRD patterns of the studied samples presented in this work (Fig. 13).
Possible correlation between the evolution of the cylindrical to prismatic morphologies and phase composition and structural features
The phases modelled in the halloysite samples of various known morphologies implies a certain sequence of phase formation from the centre of the halloysite tube to its surface that is from the HCS to HLS through the KLS phases, and we speculate that this sequence correlates to the model of Hillier et al. (Reference Hillier, Brydson, Delbos, Fraser, Gray, Pendlowski, Phillips, Robertson and Wilson2016). According to this model, “as the (cylindrical) tubes grow larger it is no longer energetically favourable to compensate misfit between tetrahedral and octahedral sheets by curvature and so at some critical radius other mechanisms common in phyllosilicates generally, such as tetrahedral rotation, presumably come into play. Consequently, the layers switch from a curved to a planar arrangement such that prismatic tubular forms may be seen as the result of a natural structural progression of tube growth to sizes beyond which the lateral misfit is not comfortably accommodated by curvature.” Omitting details, the model of Hillier et al. (Reference Hillier, Brydson, Delbos, Fraser, Gray, Pendlowski, Phillips, Robertson and Wilson2016), in general, agrees with variations of the phase composition and structural features of the coexisting phases documented in the present set of samples. First, the good agreement between the experimental and calculated XRD patterns obtained in terms of diffraction effects from planar phyllosilicates is consistent with the formation of planar radial sectors in prismatic halloysite particles. Second, based on the evolution of tubular halloysite particles with their growth, as suggested by Hillier et al. (Reference Hillier, Brydson, Delbos, Fraser, Gray, Pendlowski, Phillips, Robertson and Wilson2016), one can reconstruct a sequence of phase formation considering the structural features of the coexisting phases. The first step includes formation of the HCS phase consisting of particles having only cylindrical form. Sample 5-Ch (and similar samples in Hillier et al., Reference Hillier, Brydson, Delbos, Fraser, Gray, Pendlowski, Phillips, Robertson and Wilson2016) perfectly represents this stage of halloysite formation. During the second step, initial polygonization of the cylindrical tubes takes place and many rather narrow sectors start to form on the tube surface. At this stage, the KLS phase grows on the surfaces of these sectors in proximity to boundaries with the prior formed surfaces of the cylindrical tubes. It is plausible that such layers growing at this stage deviate from the platy (flat) shape and, as a result, the mutual arrangements of the adjacent layers and the corresponding hydrogen bonds are disturbed, leading to the formation of significant amounts of arbitrary stacking faults. These features may be responsible for the fact that the KLS phases are not fully dehydrated and consist of hydrated 10 and 7.25–7.26 Å layers, with the thickness of the latter being greater than that of the completely dehydrated layers of the KLS and HLS phases (7.145–7.154 Å; Tables 5, 7).
In the following stages, with further growth of the larger particles, the content of the KLS phase increases with a consequent relative decrease of the HCS phase content. As a result, a cylindrical form of halloysite is transformed into a prismatic one. It is plausible that, at these stages of morphological transformation, the KLS phases are characterized by a wide spectrum of structural variability. An example of such variability may be illustrated by the tubular halloysite (7 Å) studied by Hillier et al. (Reference Hillier, Brydson, Delbos, Fraser, Gray, Pendlowski, Phillips, Robertson and Wilson2016). The 21 samples taken from various countries, formed in various environments and heated at 60°C during spray-drying are characterized by a quite variable range of observed basal spacings of the low-angle basal reflections between 7.325 and 7.607 Å, with an approximately homogeneous distribution of these values within this interval. It is plausible that the KLS phases of these samples represent a spectrum of mixed-layer structures containing various proportions of 10 and 7.15–7.25 Å layers.
At the final stage of the morphological evolution of halloysite particles, the large prismatic forms were formed with well-developed flat faces. The most distinct structural feature of this stage is formation of the HLS phase with a consistent decrease of the relative content of the HCS phase. It is significant that, in contrast to the KLS phase, the structure of the HLS phase does not contain arbitrary stacking faults, and its layer stacking is controlled mostly by layer-displacement vectors t1, t2 and t0 (Table 7). This may be related to the environment of the layer growth of the HLS taking place on the flat faces of the prismatic crystals. It is plausible that nucleation and layer growth on the flat face occurred in such a way that the adjacent layers in the layer subsequence have an opportunity to be shifted regularly with respect to each other along the b 0 axis by + 0.1722b 0 and –0.1722b 0 to enable the formation of the energetically favourable two-layer structural configuration similar to that shown in Fig. 4. Because the formation of the HLS phase takes place in thermodynamic non-equilibrium conditions, its structure, along with the rather thick structural fragments of the ordered alternation of the t + and t– layer displacements, contains some fragments with a disordered distribution of these displacements. Alternatively, it is perhaps even more plausible that the ordered two-layer periodicity of halloysite is formed in its hydrate state, and this periodicity is inherited though partially disturbed during dehydration. For example, it is pertinent to note that Kohyama et al. (Reference Kohyama, Fukushima and Fukami1978) observed the two-layer periodic structure in both hydrated and dehydrated halloysite particles.
Correlation between XRD, SAED and TEM data
Among the samples studied in this work, Ru-1 and Eureka, having contrasting morphologies of their particles, were investigated by Kogure et al. (Reference Kogure, Mori, Drits and Takai2013) and Kogure et al. (Reference Kogure, Mori, Kimura and Takai2011), respectively. The most distinct morphological feature of the particles comprising sample Ru-1 is that their cross-sections displayed prismatic morphology with a small number of faces and acute angles between the adjacent faces. These observations agree with the methodological approach of this work that considers the HLS and KLS phases in terms of planar structural models. The analysis of SAED patterns and HRTEM images has shown that projections of crystallites along the b 0 axis correspond to the one-layer periodic structure of kaolinite. In contrast, when the incident electron beam was parallel to the a 0 axis, the HRTEM images show, along with almost random interstratification of the t1 and t2 layer displacements, the presence of structural fragments with a regular alternation of these displacements corresponding to the two-layer periodic structure. These results agree with the structural models of the HLS and KLS phases determined by modelling of the experimental XRD patterns. According to Kogure et al. (Reference Kogure, Mori, Kimura and Takai2011), the high-resolution scanning electron microscopy images of tubular particles of Eureka samples showed that they have a cylindrical morphology without noticeable polygonization. In agreement with the modelling results, the HRTEM images taken with the incident electron beam perpendicular to the tube or b 0 axis showed that the stacking structure of the sample is generally disordered, but ordered packets with one-layer periodicity, as is found in kaolinite, were observed.
CONCLUSIONS
Modelling of experimental XRD patterns – a method widely applied for the comprehensive structural study of finely dispersed platy phyllosilicates – was used for the first time for the determination of the phase composition and structural features of dehydrated or partially dehydrated halloysite (7 Å) samples with a tubular morphology of their particles. Samples formed of prismatic particles consist of three phases termed HLS, KLS and HCS, the first two of which are planar and the other cylindrical; populations of proper cylindrical tubes form a single HCS phase, whereas the samples formed by particles having morphologies intermediate between cylindrical and well-developed prismatic forms consist of the KLS and HCS phases. The diagnostic structural features of each phase in each morphological group were determined. Good agreement between experimental and calculated XRD patterns with low profile fitting factors (Rp = 8.7–10.3%) is considered strong evidence for the validity of the defined models. Remarkably, structural models of the coexisting HLS and KLS phases were both obtained using the structural and probability parameters describing defect-free planar kaolinite enantiomorphs. Indeed, the studied samples consist of the same (C-vacant) type of layers with the same set of atoms, atomic positions and layer stacking composed of the same layer-displacement vectors t1, t2 and t0 as are found in kaolinite. New insights into the phase composition and structural features of the coexisting phases obtained by simulation of the experimental XRD patterns provide a significant contribution to one of the fundamental problems related to the actual crystal structure of tubular halloysite varieties. In particular, analysis of the structural features of defective kaolinite and the KLS phase should settle disagreements about the relationship between kaolinite and halloysite. The occurrence of various phases with particular structural features suggests a model for the evolution of the phase formation as a function of the degree of transformation or growth of cylindrical tubes to well-developed prismatic particles. This model correlates with that of the evolution of halloysite particles from cylindrical to prismatic morphologies developed by Hillier et al. (Reference Hillier, Brydson, Delbos, Fraser, Gray, Pendlowski, Phillips, Robertson and Wilson2016). The choice of the layer unit cell shows that the long axis of tubular halloysite particles coincides not with the b axis of the oblique cell, as was generally accepted, but with the b 0 axis of the orthogonal cell of the defect-free kaolinite; these axes have different orientations and lengths.
ACKNOWLEDGEMENTS
Thanks are due to E. Pokrovskaya for her help with the manuscript preparation. V.A. Drits and B.A. Sakharov acknowledge the support of the budget project 0135-2016-0010. S. Hillier acknowledges the support of the Scottish Government's Rural and Environment Science and Analytical Services Division (RESAS).
