


1. Introduction
The ongoing digital servitization transformation is pushing manufacturing companies to embrace innovative development approaches at the intersection between servitization and digitization to effectively provide value-adding solutions to customers (Struwe & Slepniov Reference Struwe and Slepniov2023). These demands require integrating knowledge, experience and decision-making capabilities from stakeholders with diverse backgrounds from the earliest stages of the innovation process, raising the demand for innovative development approaches (Toller & Bertoni Reference Toller, Bertoni, Camarinha-Matos, Ortiz, Boucher and Osório2022). The academic discourse surrounding smart Product-Service System (sPSS) has recently explored the influence of advanced simulation technologies on the design of innovative business propositions, hardware and associated services (e.g., Chuang & Chen Reference Chuang and Chen2022. Boucher, Coba & Lamy Reference Boucher, Coba and Lamy2024). Digital Twins (DTs), explained as a cutting-edge simulation paradigm, are increasingly gaining traction in the realm of PSS (Bertoni & Bertoni Reference Bertoni and Bertoni2022), being acknowledged as a pivotal technology for gaining deeper insights into product and service enhancements, strategic intervention planning and the implementation of responsive quality improvement processes. Pirola et al. (Reference Pirola, Boucher, Wiesner and Pezzotta2020) illustrate their utility in enhancing decision makers’ understanding of the interaction between hardware and services during operations, gaining insights into customer behaviour and latent needs, mapping failures and planning interventions accordingly. These simulations are often coupled with immersive ‘experience environments’ facilitated by Augmented Reality (AR) (Aquino et al. Reference Aquino, Rapaccini, Adrodegari and Pezzotta2023) and Virtual Reality (VR) applications (Scurati, Bertoni & Bertoni Reference Scurati, Bertoni, Bertoni, Camarinha-Matos, Ortiz, Boucher and Osório2022; Machchhar, Scurati & Bertoni Reference Machchhar, Scurati, Bertoni, Camarinha-Matos, Boucher and Ortiz2023), aiding companies in advancing their servitization journey.
DTs are primarily introduced in the sPSS academic discussion mainly as a means to create product-describing models (Fett et al. Reference Fett, Wilking, Goetz, Kirchner and Wartzack2023), capture their functional dimensions (Lv, Wu & Vinicius Pereira Pessôa Reference Lv, Wu and Vinicius Pereira Pessôa2024) and their environmental impact (Maliqi, Boucher & Villot Reference Maliqi, Boucher and Villot2024) or to forecast the operational performance of new configurations (Durão, Zancul & Schützer Reference Durão, Zancul and Schützer2024). However, while the integration of synchronized digital replicas across various stages of the PSS lifecycle is deemed crucial to ‘intentionally design’ PSS (Bertoni Reference Bertoni, Camarinha-Matos, Ortiz, Boucher and Osório2022), findings from a recent global survey depict a different State-of-Practice. The analysis conducted by Pezzotta et al. (Reference Pezzotta, Arioli, Adrodegari, Rapaccini, Saccani, Rakic, Marjanovic, Stoll, Wiesner, Bertoni, Pirola, Sala, Gaiardelli, Alfnes, Romsdal, Strandhagen, von Cieminski and Romero2023) shows that significant gaps persist in the development of DT environments capable of supporting early-stage collaborative innovation/co-creation processes. Simulation tools are not yet utilized by practitioners to the extent literature claims, despite DTs being pointed out as one of the technologies with the greatest potential for adoption in the development of new servitized business offers. Overall, few studies have explored how virtual simulations can enhance a value co-creation process (e.g., Bertoni Reference Bertoni, Camarinha-Matos, Boucher and Ortiz2023) when aiming at optimizing these systems at a strategic level rather than just operationally.
Despite the growing interest in digitalization and simulation, there is a lack of practical cases (e.g., as shown in a recent review by Paliyenko, Roth & Kreimeyer Reference Paliyenko, Roth and Kreimeyer2024) illustrating how DT support can be implemented to gather stakeholder preferences and elicit value-creation strategies associated with alternative sPSS concepts, while also raising awareness about environmental factors. The aim of this research is to propose a systematic approach to exploit advanced virtual simulations/visualization capabilities and DTs to support design decision makers in making value-adding decisions during the earliest stages in sPSS design. Two research questions relate to such aim and can be described as:
-
• How can Digital Twins support a Value-Driven Design (VDD) process during the earliest stages of sPSS design?
-
• How can the value of sPSS sub-systems and components be assessed, documented and communicated to stakeholders and decision makers at the scenario level through DTs, ensuring traceability?
The results from the work have contributed to the definition of the Super-System Digital Twin (SSDT) framework and methodology presented in the following sections. The SSDT application is exemplified in a case study related to the development of Smart Electric Vehicles (SEVs), which was conducted in collaboration with Volkswagen (VW), a global automotive Original Equipment Manufacturer (OEM) of passenger cars. The paper initially describes how the research was conducted in co-production mode with the company partner and then presents the main body of knowledge at the intersection between sPSS, DTs and VDD further. These findings, which are related to the expectations and needs for simulation support in sPSS design, are followed up by the results of the prescriptive study in the form of a framework that illustrates in detail the SSDT approach for sPSS design. This is further exemplified from the perspective of developing an optimized SEV offer. The discussion section presents the results from the verification activities conducted within the OEM, while the last section summarizes the main content, contribution, limitations and future perspectives for the work.
2. Theoretical framework
2.1. From PSS to smart PSS and beyond
PSS are often described as a response to the growing trend of servitization in manufacturing, aimed at addressing complex customer needs and enhancing company value (Baines et al. Reference Baines, Lightfoot, Evans, Neely, Greenough, Peppard, Roy, Shehab, Braganza, Tiwari, Alcock, Angus, Basti, Cousens, Irving, Johnson, Kingston, Lockett, Martinez, Michele, Tranfield, I.M. and Wilson2007). Tukker, Tischner & Verkuijl (Reference Tukker, Tischner and Verkuijl2006) categorize PSS into three types: product-oriented, use-oriented and result-oriented. These categories reflect a shift from a sole focus on the product to an emphasis on desired outcomes, such as improved efficiency or reduced energy consumption.
As technology advances, PSS are increasingly integrating Smart Connected Products (SCP) and digital technologies, including cloud computing, the industrial internet and big data analytics (Rapaccini & Adrodegari Reference Rapaccini and Adrodegari2022). These advanced solutions are known by various names, but they are most commonly referred to as smart PSS, or sPSS for short (Pirola et al. Reference Pirola, Boucher, Wiesner and Pezzotta2020). First conceptualized by Valencia et al. (Reference Valencia, Mugge, Schoormans and Schifferstein2013), sPSS offer dynamic adaptability to user needs and environmental changes, leading to more personalized and efficient experiences (Chowdhury, Haftor & Pashkevich Reference Chowdhury, Haftor and Pashkevich2018). Examples include a Taiwanese taxi service that uses deep learning for personalized travel recommendations (Chiu et al. Reference Chiu, Huang, Gupta and Akman2021) and a Heat-as-a-Service (HaaS) model for consumer markets (Boucher et al. Reference Boucher, Coba and Lamy2024).
The concept of Smart PSS 2.0 (e.g., in Ren & Zheng Reference Ren and Zheng2024) introduces three novel design features: a symbiotic environment between humans and SCPs, a proactive interaction design process and Artificial Intelligence Generated Content (AIGC) for collaborative intelligence. This evolution emphasizes the mutual benefits of human–SCP interactions, fostering value co-creation in both virtual and augmented environments. Additionally, it encourages collaboration between users and systems in design innovation, combining AI with human creativity to generate content and make decisions more effectively.
2.2. Designing sPSS from a value perspective
From a design perspective, the various sPSS development processes can be classified into two main categories (Coba et al. Reference Coba, Boucher, Lamy, Vuillaume and Gay2024). The first category stems from traditional product development and systems engineering approaches, focusing on the design of product–service combinations that primarily address technical aspects. This process is informed by data collected from connected products.
The second category encompasses development processes that emphasize a co-creation approach in defining the PSS value architecture. This shift occurs because ‘the focus of the design activity shifts from the definition of new products to the re-organization of existing elements based on new needs and values’ (Morelli Reference Morelli2003, p. 75). These processes typically involve four stages (Liu et al. Reference Liu, Ming, Song, Qiu and Qu2018): connecting stakeholders, co-designing service functions, co-implementing service systems and co-evaluating service systems. Within this category, two streams of research are observed.
The first stream focuses on stimulating organizational ambidexterity by exploring new market opportunities while leveraging existing customer offerings (Elfsberg Reference Elfsberg2023). Key research questions include how to support cross-disciplinary integration (Morelli Reference Morelli2006) and facilitate value co-creation (West et al. Reference West, Gaiardelli, Resta and Kujawski2018) in PSS design. The goal is to enhance interactions and negotiations among the various actors involved in the process, thereby increasing the success of PSS offerings (Sarancic et al. Reference Sarancic, Pigosso, Pezzotta, Pirola and McAloone2023; Fang et al. Reference Fang, Liu, Lin, Qi, Tian, Huang and Wang2024). This is achieved through methods such as the player-interface method (Barravecchia, Mastrogiacomo & Franceschini Reference Barravecchia, Mastrogiacomo and Franceschini2020) and the development of ad-hoc design support tools. Notably, existing design support for value co-creation remains predominantly analogue, with some digitalized versions, including canvases and card-based tools (Tung & Lai Reference Tung, Lai, Marcus, Rosenzweig and Soares2023), sketches (Fang et al. Reference Fang, Liu, Lin, Qi, Tian, Huang and Wang2024), blueprints (Hong, Shin & Koo Reference Hong, Shin and Koo2022), flowcharts (Wang et al. Reference Wang, Chen, Li, Zheng and Khoo2021) and matrices (Barravecchia et al. Reference Barravecchia, Mastrogiacomo and Franceschini2020).
Simulations of PSS in operation (Pezzotta, Cavalieri & Romero Reference Pezzotta, Cavalieri, Romero, Rozenes and Cohen2017) are often discussed as one of the most effective ‘boundary objects’ (Panarotto, Bertoni & Bertoni Reference Panarotto, Bertoni and Bertoni2016) for engaging diverse stakeholders in evaluating and assessing the performance of PSS concepts (Bertoni et al. Reference Bertoni, Bertoni, Panarotto, Johansson and Larsson2016). Research increasingly focuses on how simulation results are visualized (Stoll et al. Reference Stoll, Zou, Rodel, West, Camarinha-Matos, Boucher and Afsarmanesh2021), emphasizing the importance of giving meaning to the generated data so that knowledge can be constructed through multiple interactions (Frické Reference Frické2019).
The second stream aims to develop a systematic value creation methodology for PSS, guiding innovation teams composed of individuals with different roles, backgrounds and expertise (Boukhris et al., Reference Boukhris, Fritzsche and Möslein2017; Liu et al. Reference Liu, Ming, Song, Qiu and Qu2018). Approaches adapted from Systems Engineering, such as VDD (Collopy & Hollingsworth Reference Collopy and Hollingsworth2011; Bertoni, Bertoni & Eres Reference Bertoni, Bertoni and Eres2019), have been discussed as a means to provide methodological guidance to the PSS design process, systematizing value exploration and assessment activities (Bertoni et al. Reference Bertoni, Bertoni, Panarotto, Johansson and Larsson2016). By implementing a value function that iteratively evaluates the ‘goodness’ of system concepts (Cheung et al., Reference Cheung, Scanlan, Wong, Forrester, Eres, Collopy, Hollingsworth, Wiseall and Briceno2012), designers can utilize field data to find the ‘best’ solution rather than one that merely meets pre-determined requirements (Machchhar et al. Reference Machchhar, Toller, Bertoni and Bertoni2022).
Several mathematical approaches have been proposed to measure the importance of innovation requirements and their contribution to value co-creation (Wang et al. Reference Wang, Sun, Liu, Zhang, Feng, Wu and Zhang2024), such as by assessing the preferences of different stakeholders (Xiang et al. Reference Xiang, Li, Hong and Li2024). However, only a few studies (e.g., Coba et al. Reference Coba, Boucher, Lamy, Vuillaume and Gay2024) demonstrate how to leverage virtual models to simulate lifecycle dynamics within a virtual population of users/customers, enabling a quantitative evaluation of uncertainty impacts on a set of Key Performance Indicators (KPIs) for the sPSS delivery process.
2.3. Digital-Twin-supported PSS design processes
The necessity of a pre-existing physical entity is considered a significant limitation in applying DT technologies for design purposes (Wright & Davidson Reference Wright and Davidson2020). A common perspective (Lo, Chen & Zhong Reference Lo, Chen and Zhong2021) is that DTs are not effectively used for generating new design ideas, but rather, they are more valuable for supporting redesign activities and making incremental improvements to existing products. Traditional design tools such as CAD and PSS-specific simulation methods have long been employed to facilitate PSS development (Mendes et al. Reference Mendes, Oliveira, Rozenfeld, Marques and Costa2015). CAD tools primarily focus on the geometric and structural aspects of product design, enabling engineers to create detailed 3D representations of physical components. PSS design tools, on the other hand, emphasize service integration, business modelling and customer value assessment (Pirola et al. Reference Pirola, Boucher, Wiesner and Pezzotta2020). While these conventional tools provide essential support for design activities, they often lack real-time connectivity, dynamic feedback loops and scenario-driven value exploration – elements crucial for the early stages of smart PSS (sPSS) design (Pirola et al. Reference Pirola, Boucher, Wiesner and Pezzotta2020). DTs offer a fundamental shift in early-stage design by integrating real-time data, multidimensional simulations and predictive analytics. Unlike traditional CAD models, which are static and require manual updates, DTs create dynamic, continuously evolving digital counterparts of physical systems, incorporating real-time user behaviour data, operational conditions and environmental variables (Liu et al. Reference Liu2023). This ability allows design teams to explore a broader range of product-service configurations, test alternative scenarios and evaluate trade-offs before committing to costly prototyping phases (Lo et al. Reference Lo, Chen and Zhong2021).
While DTs are increasingly recognized for their role in multidimensional simulation and decision-making in complex scenarios, their application in sPSS design remains limited, predominantly focusing on manufacturing and production, such as real-time warehouse optimization and rapid reconfiguration of manufacturing systems (Leng et al. Reference Leng, Yan, Liu, Zhang, Zhao, Wei, Zhang, Yu and Chen2021).
Nevertheless, DTs are not entirely irrelevant or out of scope when it comes to creative processes and idea generation. In this regard, Haynes & Yang (Reference Haynes and Yang2023) have recently identified three major ways to leverage DTs during the earliest stages of sPSS design:
-
• DTs are commonly used to define the requirements of new solutions when a similar product is already in the usage stage. Data from these products can be used to generate and collect virtual concepts, which can then be implemented in similar products to measure performance. For example, designers can utilize data from the previous generation of a bicycle to redesign the next generation (Tao et al. Reference Tao2019). This data may include user feedback and data logs, which help identify design flaws, specific user needs and visions for future development. Through the translation process based on the DT for the bicycle, user demands are interpreted into functional requirements.
-
• Even if no similar product exists, DTs can be beneficial if the new product design is heavily constrained by a super-system. Designers can create a SSDT that collects environmental data, which can then be used to establish product requirements. For instance, designers can gain a deeper understanding of the product context by integrating user interaction data with environmental data, thereby enhancing logical reasoning about customer behaviours and decision-making processes (Wang et al. Reference Wang, Chen, Li, Zheng and Khoo2021). Another example is provided by Lim et al. (Reference Lim, Zheng, Chen and Huang2020) in the context of product family design.
-
• When neither of the above cases applies, a mock-up prototype DT can still be useful for establishing product requirements or testing physical prototypes. For instance, DTs can support learning and training activities, enhancing safety performance and operational efficiency, as discussed by Arrichiello & Gualeni (Reference Arrichiello and Gualeni2020).
Despite existing limitations, the application of DTs to support value co-creation and decision-making processes is currently a topic of intense debate (Lin et al. Reference Lin2021; West et al. Reference West, Stoll, Meierhofer and Züst2021; Machchhar et al. Reference Machchhar, Bertoni, Wall and Larsson2024). Most studies today focus on methodological aspects (Stark, Fresemann & Lindow Reference Stark, Fresemann and Lindow2019) or explore the development of DT-related design frameworks (Erkoyuncu et al. Reference Erkoyuncu, del Amo, Ariansyah, Bulka and Roy2020) without providing concrete cases and applications. Only a few authors, such as Meierhofer et al. (Reference Meierhofer, West, Rapaccini, Barbieri, Nóvoa, Drăgoicea and Kühl2020), offer practical examples of how DTs and simulations can drive innovation in the service sector when addressing PSS design. They emphasize modelling PSS stakeholders, describing their challenges using service design tools and identifying critical decision points through simulation-based models.
Overall, there is a lack of systematic approaches that outline how DTs can be applied during the early stages of sPSS design. Additionally, the potential benefits of real-time connectivity for PSS designers have been largely overlooked (Bertoni Reference Bertoni, Camarinha-Matos, Ortiz, Boucher and Osório2022). In practice, many design decisions continue to depend heavily on the experience, intuition and judgement of engineers, managers and other decision makers (West et al. Reference West, Meierhofer, Stoll and Schweiger2020). As such, the existing knowledge at the intersection of DT and sPSS remains limited from a design standpoint, highlighting the need for further investigation into supporting design methods and tools.
3. Methods
The Design Research Methodology (DRM) framework (Blessing & Chakrabarti Reference Blessing and Chakrabarti2009) was adopted to structure the study, ensuring methodological rigour while balancing industrial relevance with scientific robustness. DRM comprises four phases: Research Clarification (RC), Descriptive Study I (DS-I), Prescriptive Study (PS) and Descriptive Study II (DS-II). This research includes a review-based RC, an in-depth DS-I and PS and an initial DS-II.
This study is further grounded in a single-case design (Yin Reference Yin2014), focusing on a compact crossover SEV developed by VW – a major global OEM with manufacturing across three continents. The vehicle balances interior space and urban manoeuvrability and is equipped with advanced digital features. The single-case approach allowed for an in-depth exploration of how DTs can support value-driven design decisions within sPSS, enabling detailed analysis of cause–effect relationships in early-stage design processes.
Through workshops and interviews with VW’s cross-functional teams (e.g., R&D, product planning), existing practices in SEV development were analysed in the DS-I step. Key challenges identified included overlapping features and delayed cascading of requirements, which hindered value-driven innovation. Participants emphasized the need for immersive tools to simulate usage scenarios and quantify value trade-offs. These insights directly informed the design of the SSDT framework, particularly its goals of hierarchical value linking and real-time scenario manipulation (Section 4.1). Building on DS-I findings, the SSDT framework was developed in the PS stage to integrate 3D visualization, behavioural modelling and AI-assisted value assessment. The high-level description shown in Section 4.1 emerged in response to the need for contextual scenario modelling, while iterative value-analysis loops (Section 4.2) were designed to improve stakeholder alignment – an issue raised during DS-I. The SSDT framework was tested with VW teams in the DS-II step, with a focus on two use-case scenarios: urban mobility and off-road SEV usage. Both quantitative metrics (e.g., decision-making speed and accuracy of value assessments) and qualitative feedback (e.g., intuitiveness of 3D interfaces) were gathered to validate and refine the framework.
3.1. Data collection method
Data collection followed a Participatory Action Research (PAR) approach (McIntyre Reference McIntyre2007), selected to ensure that stakeholder insights were central to the study and that the outcomes would be both academically rigorous and practically relevant. PAR enabled a collaborative, iterative process involving those directly impacted by the research topic.
The PAR process unfolded in four iterative stages – problem definition, planning, action and reflection – each involving continuous dialogue between researchers and participants (see Figure 1). Twelve experts from diverse domains – engineering design, vehicle development, product planning, algorithm development and virtual prototyping – participated either on-site or remotely.
-
• Problem Definition: Initial consultations with senior decision makers (e.g., product owners and project managers) helped align the research with strategic goals. These discussions identified key challenges in SEV development and the potential of DTs to support value-driven design.
-
• Planning: Scenario-based workshops with engineers and designers defined functional requirements for DT applications in early-stage smart PSS development. These sessions informed priorities for data collection, system integration and visualization.
-
• Action: Multidisciplinary teams, including algorithm and virtual prototyping specialists, iteratively tested DT prototypes, provided feedback on usability and refined simulation models. Additional insights were drawn from industry reports, internal documents and structured interviews.
-
• Reflection: After each cycle, feedback sessions gathered input from all stakeholders. Business leaders assessed alignment with strategic objectives, while technical teams evaluated usability and implementation feasibility.
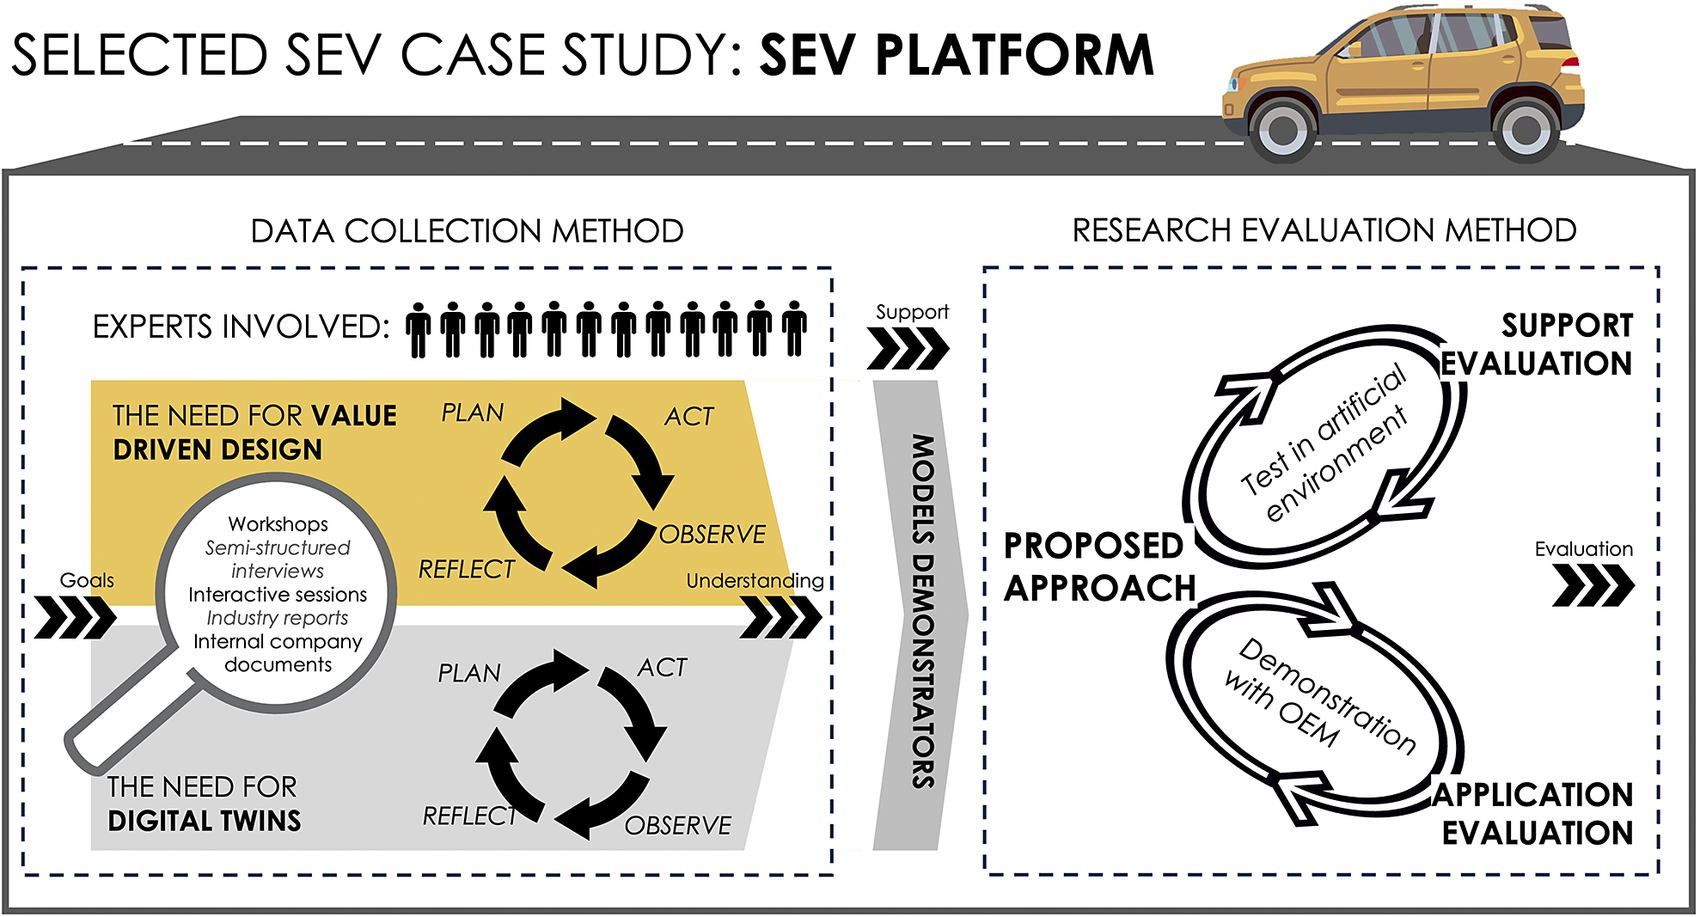
Figure 1. Data collection and research evaluation method in the case study.
Two core themes guided the data collection: (1) the need for a VDD approach in SEV development and (2) the role of DT in operationalizing VDD principles in design workflows. Empirical data were gathered from multiple sources: (1) industry research reports, (2) internal company documents (e.g., product and feature specifications) and (3) regular workshops and interactive sessions at company sites.
Preliminary DT demonstrators – featuring 3D visualization, virtual prototypes and simulation tools – were developed using commercially available software. The participatory approach empowered stakeholders to contribute their expertise throughout the process, fostering co-ownership of both the research and its outcomes.
3.2. Research evaluation method
The research methodology encompassed two critical phases of evaluation – Support Evaluation and Application Evaluation – to ensure that the developed design support was both technically sound and practically viable in real-world scenarios.
3.2.1. The support evaluation phase
To assess the effectiveness of the proposed SSDT framework, a phased adoption strategy was applied – beginning with pilot projects and gradually scaling through training modules and simplified SSDT templates. This phase involved testing core modelling concepts and software support in a controlled environment, allowing for repeatable, standardized conditions and controlled variable management. As part of this process, the prescriptive study outcomes were tested across multiple scenarios. Initial performance benchmarks were conducted to evaluate alignment with predefined criteria, followed by stress tests to assess robustness under more demanding conditions.
Building on Lawson’s (Reference Lawson, Caringi, Pyles, Jurkowski and Bozlak2015) participatory design approach, three design experiments were carried out with cross-functional teams from the case company. These experiments aimed to analyse designer behaviour during active design episodes and validate the SSDT’s practical utility in response to Research Question 2. To ensure relevance, three real-world-inspired SEV development scenarios were selected, each representing different operational settings and service configurations. The goal was to evaluate the SSDT’s adaptability across diverse design contexts. Each experiment followed a structured 30-minute protocol to ensure consistency and enable comparative analysis:
-
• Step 1: Design Task Execution (5 minutes) – Participants interacted with the DT framework to complete specific design tasks using predefined workflows.
-
• Step 3: Design a scenario concept of SEV product (10 minutes) – Participants build scenarios using DTs using predefined workflows.
-
• Step 2: Scenario Simulation and Feedback Capture (15 minutes) – Participants observed the impact of their design choices through immersive DT simulations, with performance indicators tracked in real-time.
To maintain consistency across sessions, standardized guidelines were followed, using the same tools, test equipment and task descriptions throughout. Participants were briefed in advance on the evaluation criteria to ensure alignment in their assessments. The procedure involved designers carrying out the design tasks step-by-step, with each session documented for later analysis. Data collection methods included photographs and audio recordings, which were analysed after the sessions concluded. In the experiment, participants were divided into three groups: Group 1 with two people (two product designers), Group 2 with two people (product manager and marketing manager) and Group 3 with one person (director of product design). Each group was given the same design tasks, test equipment, DT system and test process. The verification session lasted three hours and consisted of two experimental sessions. The first session focused on verifying the DT approach for designing smart PSS, while the second session involved validating the approach through a questionnaire interview. Each group participated in a 30-minute design verification session and a separate 30-minute survey questionnaire session. Participants were briefed on the DT approach testing process and evaluation criteria before the experiment began.
3.2.2. The application evaluation phase
This phase involved demonstrating and testing the solutions in collaboration with the OEM. The aim of this phase was to bridge the gap between theoretical validation and practical application, ensuring that what is proposed is viable and effective in real-world settings. This evaluation was conducted by multiple means, yet primarily consisted of interviews with product owners and decision makers within the case company. These activities focused on assessing the DT’s ability to facilitate collaboration among cross-functional teams in designing new digital service solutions for SEVs. To further assess the efficacy of the proposed methodology, an innovation team-focused evaluation was conducted in collaboration with the case company. This evaluation included the administration of a usage evaluation form, followed by a statistical analysis of the scored results to gauge the impact of the approach. The findings underwent further scrutiny through qualitative user feedback, incorporating suggestions to refine the approach.
Semi-structured interviews played a central role in validating the research findings. These interviews were scheduled in advance and guided by a protocol of 14 semi-open questions, with further questions emerging organically during the conversation (DiCicco-Bloom & Crabtree Reference DiCicco-Bloom and Crabtree2006; see Table 3). This format enabled a focused exploration of key issues while also capturing behaviours and practices that might not emerge in informal discussions (Yin Reference Yin2014). Each interview lasted between 30 minutes and one hour and was conducted in either Chinese or English, depending on participant preference. The interviews were audio-recorded when possible and later transcribed and translated into English by the author. In cases where recording was not feasible, detailed notes were taken and summarized shortly thereafter. Transcriptions were reviewed and validated by the participants to ensure accuracy. To complement the interviews, participants also completed an evaluation questionnaire designed to assess the SSDT approach across 12 value dimensions. Each multiple-choice question included a follow-up prompt encouraging participants to elaborate on their scores with reasoning, feedback or suggestions. This mixed-method approach helped identify the strengths and limitations of the SSDT framework under various evaluation criteria.
The integration of qualitative and quantitative data supported the development of a dimensional value assessment framework. Value scores were assigned across 12 criteria, organized into four categories: Design Space Exploration (E), Functionality (F), Plug-in Ability (P) and Practice of Design (D). Each criterion was rated on a 1–9 scale, where 5 represented a baseline value, and 7 indicated the target for the SSDT solution. To facilitate interpretation, a colour-coded scoring system – adapted from Bertoni, Bertoni & Isaksson (Reference Bertoni, Bertoni and Isaksson2013, Reference Bertoni, Bertoni and Isaksson2018) – was employed, using green, yellow and red to reflect the perceived effectiveness and feasibility of the approach.
Interview transcripts were manually coded using a two-level process adapted from Wholey, Hatry & Newcomer (Reference Wholey, Hatry and Newcomer2010). First, each sentence was linked to one of the evaluation dimensions and annotated to identify confirming or contradicting indicators. Second, inductive analysis was used to derive thematic categories and aggregate insights for each dimension. The data were independently coded and cross-checked to ensure inter-coder reliability (Duriau, Reger & Pfarrer Reference Duriau, Reger and Pfarrer2007), with divergent interpretations resolved through iterative comparison and convergence.
4. Results: a super-system DT framework for value-driven sPSS design
The empirical data gathered during the descriptive study emphasize the changing dynamics in the SEV development process, underlying a paradigmatic shift in the way smart features are added to initial product platform descriptions. Paraphrasing one of the respondents interviewed during the work:
The landscape of smart car competition has shifted progressively from stapling features for enhanced performance to improving the overall customer experience within specific usage scenarios to generate new value. This is because the excessive layering of features substantially escalates costs without necessarily improving customer satisfaction. This ‘features overlap’ phenomenon leads to a lack of differentiation, and we found ourselves compelled to engage in a ‘configuration competition’, ultimately diminishing both product innovation and competitiveness.
For the automotive OEM, the integration of DTs in the SEV design process represents a strategic and efficient approach to avoid the pitfalls mentioned above. DTs are envisioned as a promising technology that will raise understanding of the impact of different feature combinations on the overall customer experience, tailoring product configurations to create genuine value. Not only can they help escape the ‘feature layering’ vicious loop, but they can promote more radical innovative thinking, too.
One aspect of interest is how to exploit DT technologies to initiate design activities at the sub-system and component level well before the final requirements for the SEV vehicle platform are finalized and production preparations are made. The traditional requirements cascading process, which is typically triggered several months or even a year after the project is launched, slows and constrains the innovation capability of supply chain partners. This often results in design decisions – at sub-systems and component level – aimed at developing solutions that meet available requirements while minimizing costs rather than exploring solutions that could enhance value for end users and stakeholders.
One of the limitations shown in the study is linked to the requirement description from the OEM, which lacks contextual information, raising the risk that the original design intent becomes diluted when cascading down requirements. This working mode was acknowledged to introduce delays in delivering the final solution, owing to the intricate and lengthy development process encompassing both hardware, service and software. One of the advantages discussed in relation to the application of DT technologies in an early design phase is that of making it possible to share more of the ‘design rationale’ for a new car with supply chain partners, typically earlier than what happens today, to guide the development of subsystems and components towards value maximization. By accessing and exploring the initial DT, it is possible for collaborating parties to ‘experience’ new SEV vehicle platforms well before full requirements are ready to be shared by the OEM. Design exploration activities can be initiated well before what is possible today by letting suppliers, and subcontractors ‘immerse’ themselves in a new system concept, simulating envisioned usage scenarios and tasks, and experiencing them through eXtended Reality technologies (XR). The latter can potentially clarify aspects related to functionality and performances early on, clarifying intangible and non-functional requirements through a realistic virtual experience.
The discussion further zoomed into how to leverage DTs to enhance the exploration of the sPSS design space, enabling preliminary analysis from the subsystem level (e.g., vehicle components like the battery and the electric motor) to the system level (the electric vehicle), Systems of Systems (SoS) level (fleet of vehicles), service level (comprising SoS, associated services and mining infrastructure) and operational scenario level (including simulation of various operational contexts). From this, four key capabilities emerged, which led to the development of the DT solution presented in the following sections. They are:
-
• Case related: The DT shall create generic replicable approaches to simulate the transition towards electromobility and autonomy for subsequent customer usage scenarios.
-
• Case related: The DT shall increase awareness of uncertainties and secondary effects related to the transition to electromobility and autonomy, considering economic and environmental aspects.
-
• Generic: The DT shall establish hierarchical links between features, components, sub-systems, systems and system-of-systems to enable decision makers to forecast the consequences of design decisions at different levels.
-
• Generic: The DT shall enable the design team to manipulate scenarios, functionalities, value criteria and costs, simulating the performance of the system and visualizing the outcomes of these simulations to support collaborative decision-making.
4.1. The super-system digital twin
The research work led to the development of the so-called SSDT. This can be described as a generic simulation environment tuned for automotive applications, which integrates various components to assess, document and communicate the value of sPSS through data-driven immersive experiences. The main building blocks of the SSDT are the Virtual Model and the Behavioural Model, which are shown in Figure 2.
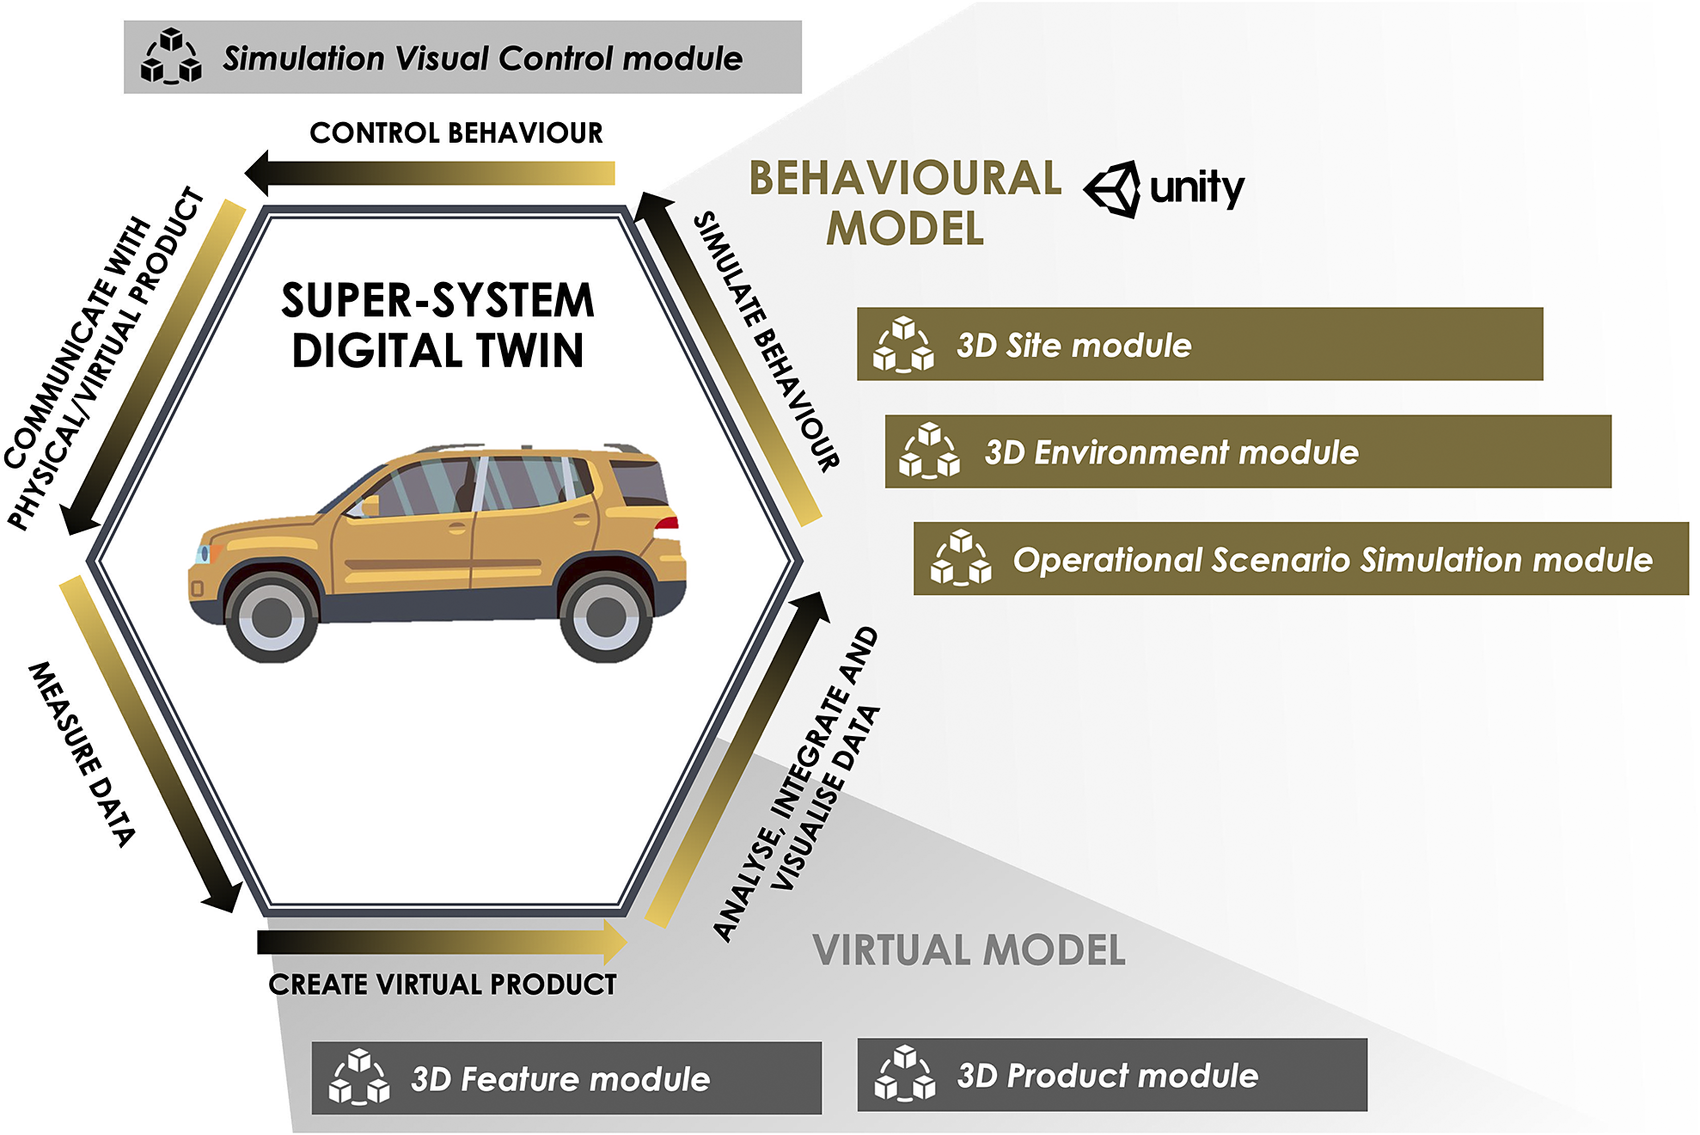
Figure 2. A high-level description of the SSDT framework and its main modules.
The SSDT Virtual Model comprises a 3D Product module, which provides a comprehensive representation of the product platform (i.e., of the vehicle type) under investigation. It includes functional components for a seamless simulation of various product functions, such as wheel steering, physical effects, cockpit adjustments and changes in colour and material. In the case study, this module was developed to include as many details as possible, such as cockpit design, interior materials, chassis, motor and battery systems and perception systems. It is also possible, depending on data availability, to include detailed component models, functional actions and interactive effects, which can be organized either collectively or as independent entities. This module is coupled with a 3D Feature module that introduces, in the described case, visual elements, digital interfaces and feature effects like sound volume, colour brightness, temperature changes and movement speed.
The Usage Scenario Simulation module lies at the core of the Behavioural Model (Abdoune et al. Reference Abdoune, Cardin, Nouiri and Castagna2021) and drives the value analysis for the different design concepts. This module is informed by a 3D Site module that, in the described case study, offers two contrasting settings – a modern city or a wilderness environment – together with the required supporting infrastructure for electric vehicles. The main objective of the 3D Site is to accurately replicate real-world complexities, for instance, by incorporating in the value simulation diverse types of roads, traffic conditions, environmental aspects and other contextual factors that can influence the perception of the decision makers and the outcomes of the value study. The 3D Environment module is added on top of the 3D Site to further enhance the experience of the proposed design concepts with maximum realism and immersion. It makes it possible to simulate the behaviour of products by switching between different weather conditions during the simulation, hence testing product adaptability under diverse circumstances, from sunny days to rain, fog and ice dust.
The SSDT is implemented using Unity 3D, which manages the 3D geometries of various virtual models for the SEVs platform and its components, including vehicle exteriors, interiors and cockpit elements. Behind the scenes, the Simulation Visual Control module regulates the balance between visual fidelity and scenario coverage during interactions with the SSDT. Three fidelity settings – Low, Medium and High – allow for the optimization of computational resources while maintaining realistic simulation quality.
4.2. The SSDT-supported sPSS design process
Figure 3 provides a high-level description of the proposed framework for value-driven sPSS design. It shows how the SSDT is designed to support the development of sPSS concepts, indicating the required user input and the expected outputs at each step of the process. The framework is composed of five main stages composed of different steps, all enabled and/or supervised by the SSDT, namely: ‘Frame the design problem’, ‘Setup the value study’, ‘Populate the value study’, ‘Analyse value’ and ‘Visualize value.’
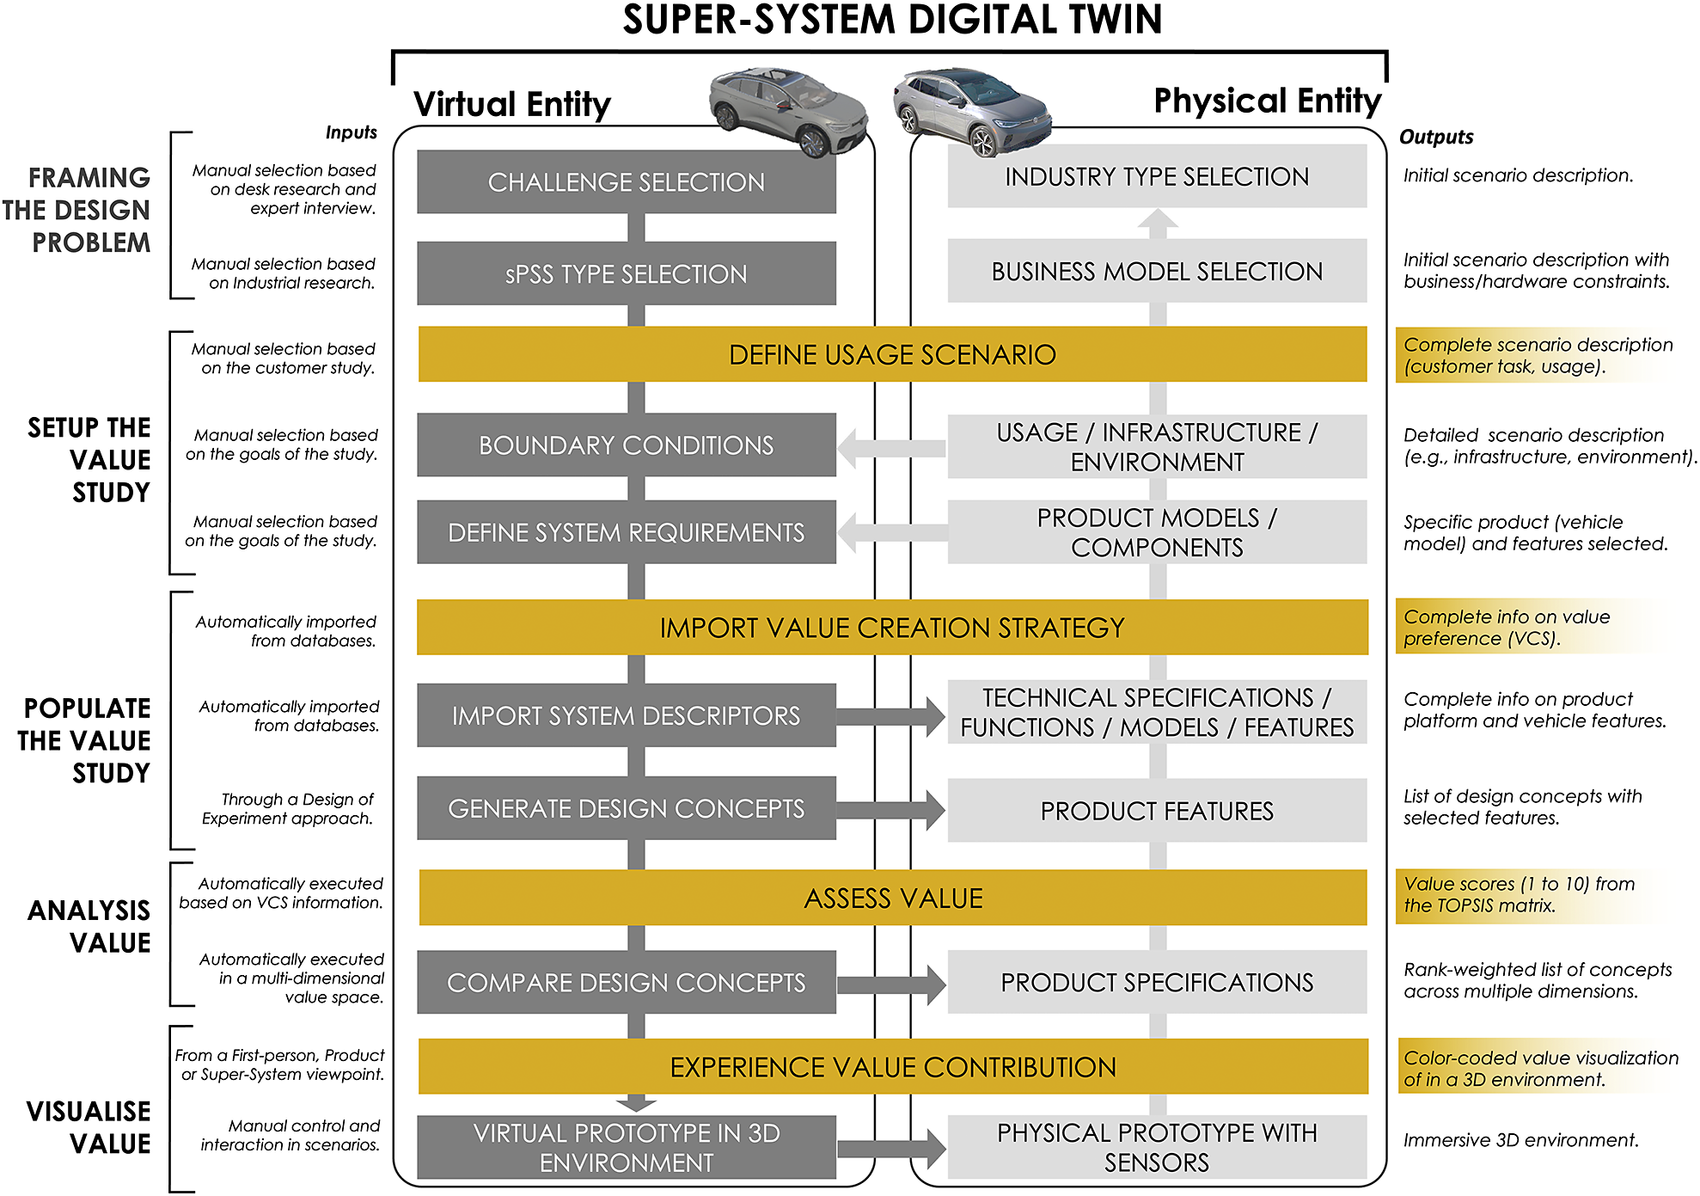
Figure 3. Super-System Digital Twin framework for value-driven sPSS design.
The initial stage of the methodology focuses on framing the design problem, which is about selecting a design challenge and then specifying the type of PSS to be used as the foundation for the value study. The study is triggered by users selecting a foundational challenge, such as ‘urban mobility’ as opposed to ‘off-road racing’. The designers are then prompted to decide upon an sPSS type to explore and address this. The sPSS-type descriptions align with those proposed by Tukker et al. (Reference Tukker, Tischner and Verkuijl2006), as discussed in Section 3.
During the ‘Setup the value study’ stage, the users are requested to manually specify the usage scenarios and the system requirements of interest. Scenario-wise, they are required to set the boundary conditions of the ‘mission’ linked to the initial challenge, describing the supporting infrastructure and all relevant environmental constraints. The users are further requested to select the product platform (Isaksson et al. Reference Isaksson, Kossmann, Bertoni, Eres, Monceaux, Bertoni, Wiseall and Zhang2013) under consideration (e.g., a vehicle in the compact SUV category) and the list of components/features of the system that are deemed relevant for the value exploration step.
When populating the value study, information about the product platform is automatically collected from various sources (typically from databases hosted by various solution providers). The data imported at this stage take the form of technical specifications, 3D models, functional models, design structure matrices and more. This information is compiled and amalgamated to generate alternative concepts, which are documented in the form of ‘system descriptors’. Simultaneously, a mathematical description of the preferences of different customers and stakeholders is generated in the form of a so-called Value Creation Strategy (VCS), again following Isaksson et al. (Reference Isaksson, Kossmann, Bertoni, Eres, Monceaux, Bertoni, Wiseall and Zhang2013). The VCS includes two main macro-categories of value criteria: functional and non-functional. These are adapted from the framework for sPSS value evaluation proposed by Liu et al. (Reference Liu, Ming, Song, Qiu and Qu2018), which is composed of context-related indexes, human-related indexes and the emotional status of the customer. The VCS is mathematically represented by a weighted set of value criteria, which is obtained through the application of the Analytical Hierarchy Process (AHP) methodology (Saaty Reference Saaty2008). The AHP is informed by data captured in the SSDT and builds upon user tasks, user contexts, gain and pain points, trends, environmental and infrastructural constraints and more. These data points are obtained mainly through qualitative means from different groups of industry experts and are captured in the form of verbal descriptions and assessments.
The ‘Analyse value’ stage runs in loops, drawing parallels to the VDD framework proposed by Collopy & Hollingsworth (Reference Collopy and Hollingsworth2011). The process of generating design concepts follows the logic of inserting or removing features from the proposed product platform, e.g., applying a Design of Experiment (DoE) approach. Different concepts vary based on which component or feature is incorporated or excluded from the platform, resulting in diverse combinations of features being added. Subsequently, each combination undergoes assessment using the Technique of Order Preference Similarity to the Ideal Solution (TOPSIS) approach, akin to the methodology proposed by Rondini, Bertoni & Pezzotta (Reference Rondini, Bertoni and Pezzotta2020) for evaluating PSS embryos. After completing the scenario selection and inputting the value weight of the scenario, the system uses AI-driven data calculations to generate the correlation score between the feature and the scenario in order to avoid subjectivity in the process of value assessment. The value-driven design of this framework is proposed, integrating IoT data of product features from real automotive industry collection (e.g., real-time user behaviour logs) to inform AHP weightings. The linkage between features and the VCS in the TOPSIS matrix is facilitated by Natural Language Processing (NLP) techniques Bidirectional Encoder Representations from Transformers (BERT) model by Adhikari et al. (Reference Adhikari, Ram, Tang and Lin2019). NLP, as a subset of AI, enables the value assessment model to interpret scenario, product and feature data in a meaningful and contextually relevant manner. This enables the model to assign a score between 1 and 10, representing the ability of a given concept to meet various criteria in the VCS.
The outcomes of the value analysis are showcased both in an aggregate form, presenting a total value score for a given design concept and individually for each value criterion and feature. Concepts are then ranked based on simulation results to emphasize solutions with the highest overall value and the highest value for specific criteria. The value assessment scores are communicated through various means, primarily utilizing spider plots (as demonstrated by Bertoni et al. Reference Bertoni, Bertoni and Isaksson2018) and 2D diagrams (as illustrated by Rondini, Bertoni & Pezzotta Reference Rondini, Bertoni and Pezzotta2017).
The goal of the ‘Visualize value’ stage is to provide a direct, immersive experience of the value contribution linked to a specific concept. Such experience is built on the colour-coding approach initially proposed by Bertoni et al. (Reference Bertoni, Bertoni and Isaksson2013). In this colour-coded display, the value associated with different features and concepts is mapped against a colour scale, with green indicating the highest value for the given scenario and red indicating the lowest. Three perspectives – user, product and super-system – are utilized to convey the value analysis results in an immersive 3D environment. A first-person view is used to communicate the added value of a solution from a customer’s perspective, while the ‘product’ perspective highlights the placement of specific features/concepts and their interactions with other subsystems. The super-system display mode offers a ‘helicopter perspective’, emphasizing features/concepts in the context of the mission, infrastructure and environment. This information can be presented either using XR tools or using a video wall connected to a computation server hosting the DT, enabling stakeholders to comprehensively assess the visual results generated by the simulator in an immersive way.
5. Empirical study: Smart Electric Vehicle design
SEVs have gradually become an innovation hotspot in the automotive industry, and new product development methods are continuously proposed to support their design through the application of emerging tools, digital support and intelligence. Noticeably, automotive OEMs are discovering the SEV market to be characterized by a much more uniform competition than they expected (InBusiness 2023), a phenomenon mostly driven by standardization and convergence of feature configurations across various car brands. To address this, the case study reveals that it is imperative to establish a value-centric approach early in the smart EV development process to ensure the competitiveness of new products and services over the next 3–5 years. The following sections exemplify the use of the proposed framework (Figure 4) in the development of a Connect Service Platform (CSP) for the electric compact SUV market.
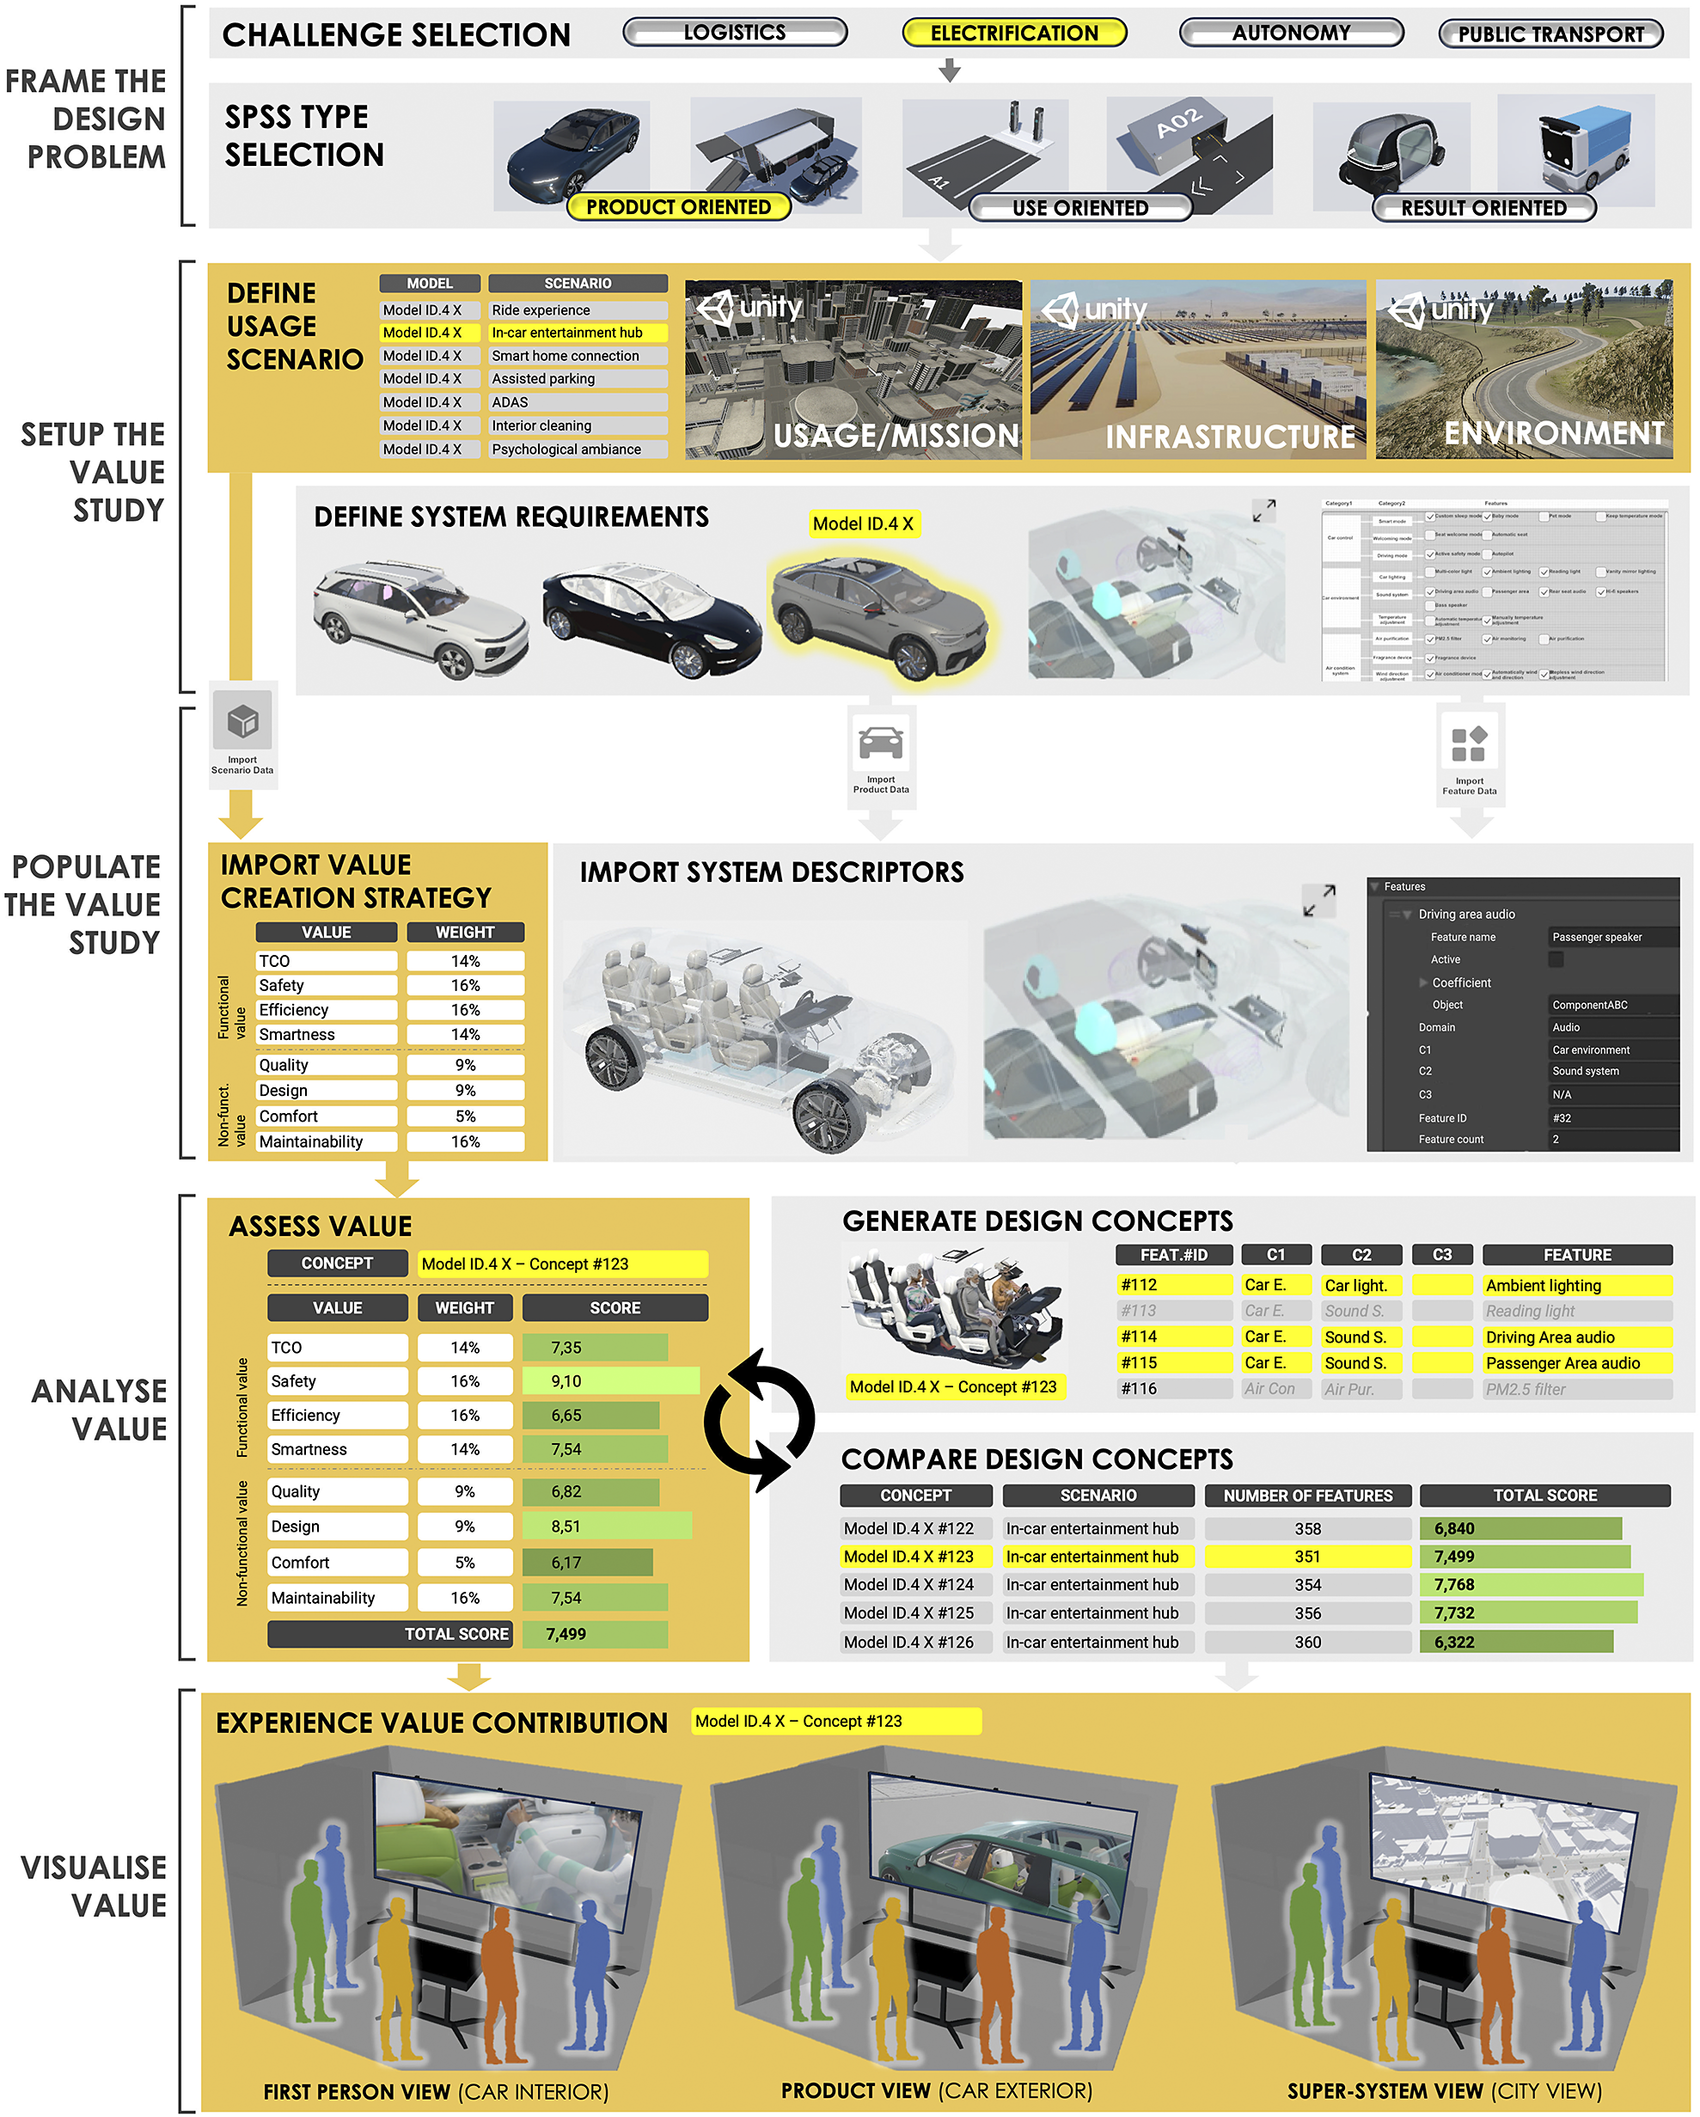
Figure 4. Overview of the case study application of the SSDT framework. The SSDT-supported VDD process is highlighted in orange.
5.1. Frame the design problem
In the first stage of the framework, the overall goal is to define the problem being analysed. In VDD jargon, the designers must determine the boundaries of the system being explored from a value viewpoint. As explained by Soban, Price & Hollingsworth (Reference Soban, Price and Hollingsworth2012), it is highly critical for the successful implementation of VDD studies to define the system in which value shall be maximized. The first activity in the framework concerns the definition of a specific ‘grand challenge’ being explored with regard to the development of SEV. This can refer to aspects such as electrification, autonomy, racing, logistics and more, and can be limited to optimization rather than include organizational and/or political considerations. This challenge is later addressed by different sPSS types, using descriptions adapted from Tukker et al. (Reference Tukker, Tischner and Verkuijl2006) described in the previous section. The sPSS selection step requires the decision makers to clarify the type of PSS being under scrutiny. This information is passed on to the activity dedicated to the generation of specific usage scenarios used along the VDD stream.
5.2. Setup and populate the value study
When applying the methodology for evaluating alternative solution concepts, product managers and design engineers need to first select a specific scenario. This is related to the description of the ‘mission’ for the system, which can vary from shipping goods efficiently and securely to transporting people comfortably, to providing entertainment on board the vehicle, and more. The definition of the usage scenario serves the purpose of defining the system boundaries with more precision, providing a ‘context’ to the value study and defining a subset of value criteria (with weights) upon which the value analysis will be performed and solutions benchmarked. Taking the entertainment scenario as an example, the description of user needs and user tasks is derived from market research data, allowing design engineers to reach a common understanding and consensus. The type of data that is imported into the SSDT to support the value analysis process is described in Table 1..
Table 1. Data inputs for the value analysis in the SSDT
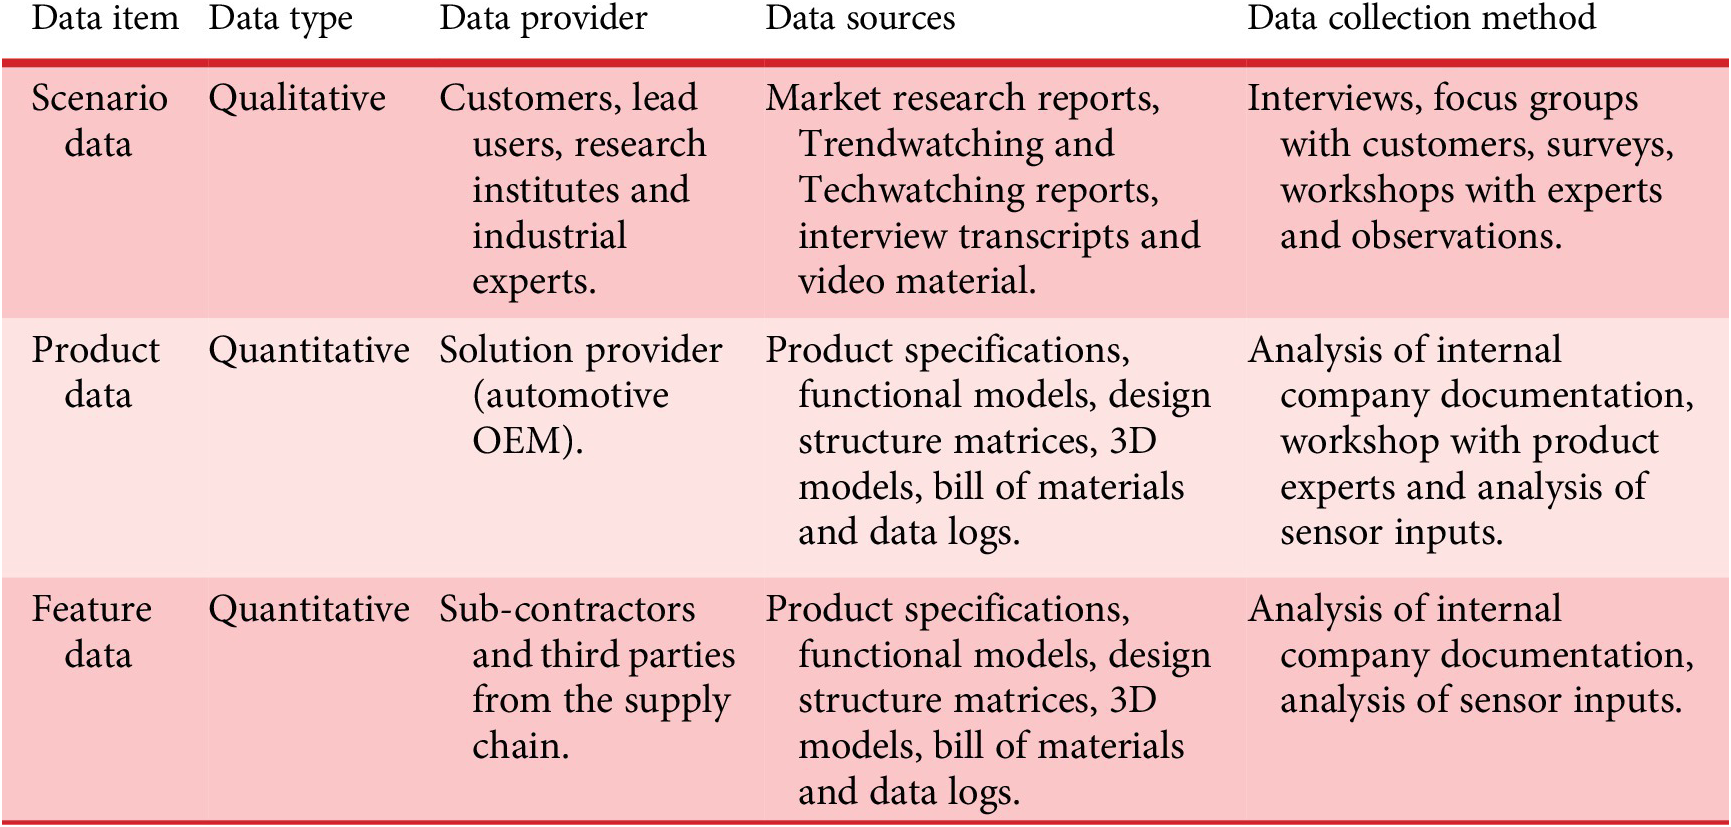
Scenario data are mostly qualitative and collected from customers, lead users, experts and more through different methods. They provide an indication of what the benchmarks are with regards to a given mission (in terms of preferences, expectations, targets, existing solutions and means), together with additional information that is needed to orient decision-making when targeting radical innovations, including future trends, travel model, usage, user task, user context, user needs, pain-points and more.
Product data are owned by the automotive OEM and are typically provided by the marketing department and product planning department. They are documented in product specifications, functional models, 3D models and more. They provide specific information about how the product platform is constructed and how its different sub-systems interface with each other. In practice, these make it possible to describe the functional characteristics and performance of the platform and its constituent parts, including the car body, cockpit, vehicle control methods, motor, batteries and more.
Feature data are collected from the supply chain, which is from sub-contractors and other third parties, and consists of thousands of different data points. Not only do they describe how hardware and software components are designed, but they also provide information about how they are used through the analysis of data logs from sensors. The latter are collected by exploiting ‘Over-the-Air’ (OTA) software and firmware update capabilities.
One of the most critical tasks related to populating the value study is defining the VCS for the Scenario. This document contains a list of criteria for the value study, which are derived and shortlisted from the need description found in the scenario data imported. Table 2. describes in detail the criteria shortlisted in the SEV study, with a description.
Table 2. Value Creation Strategy for the selected scenarios in the SEV case study
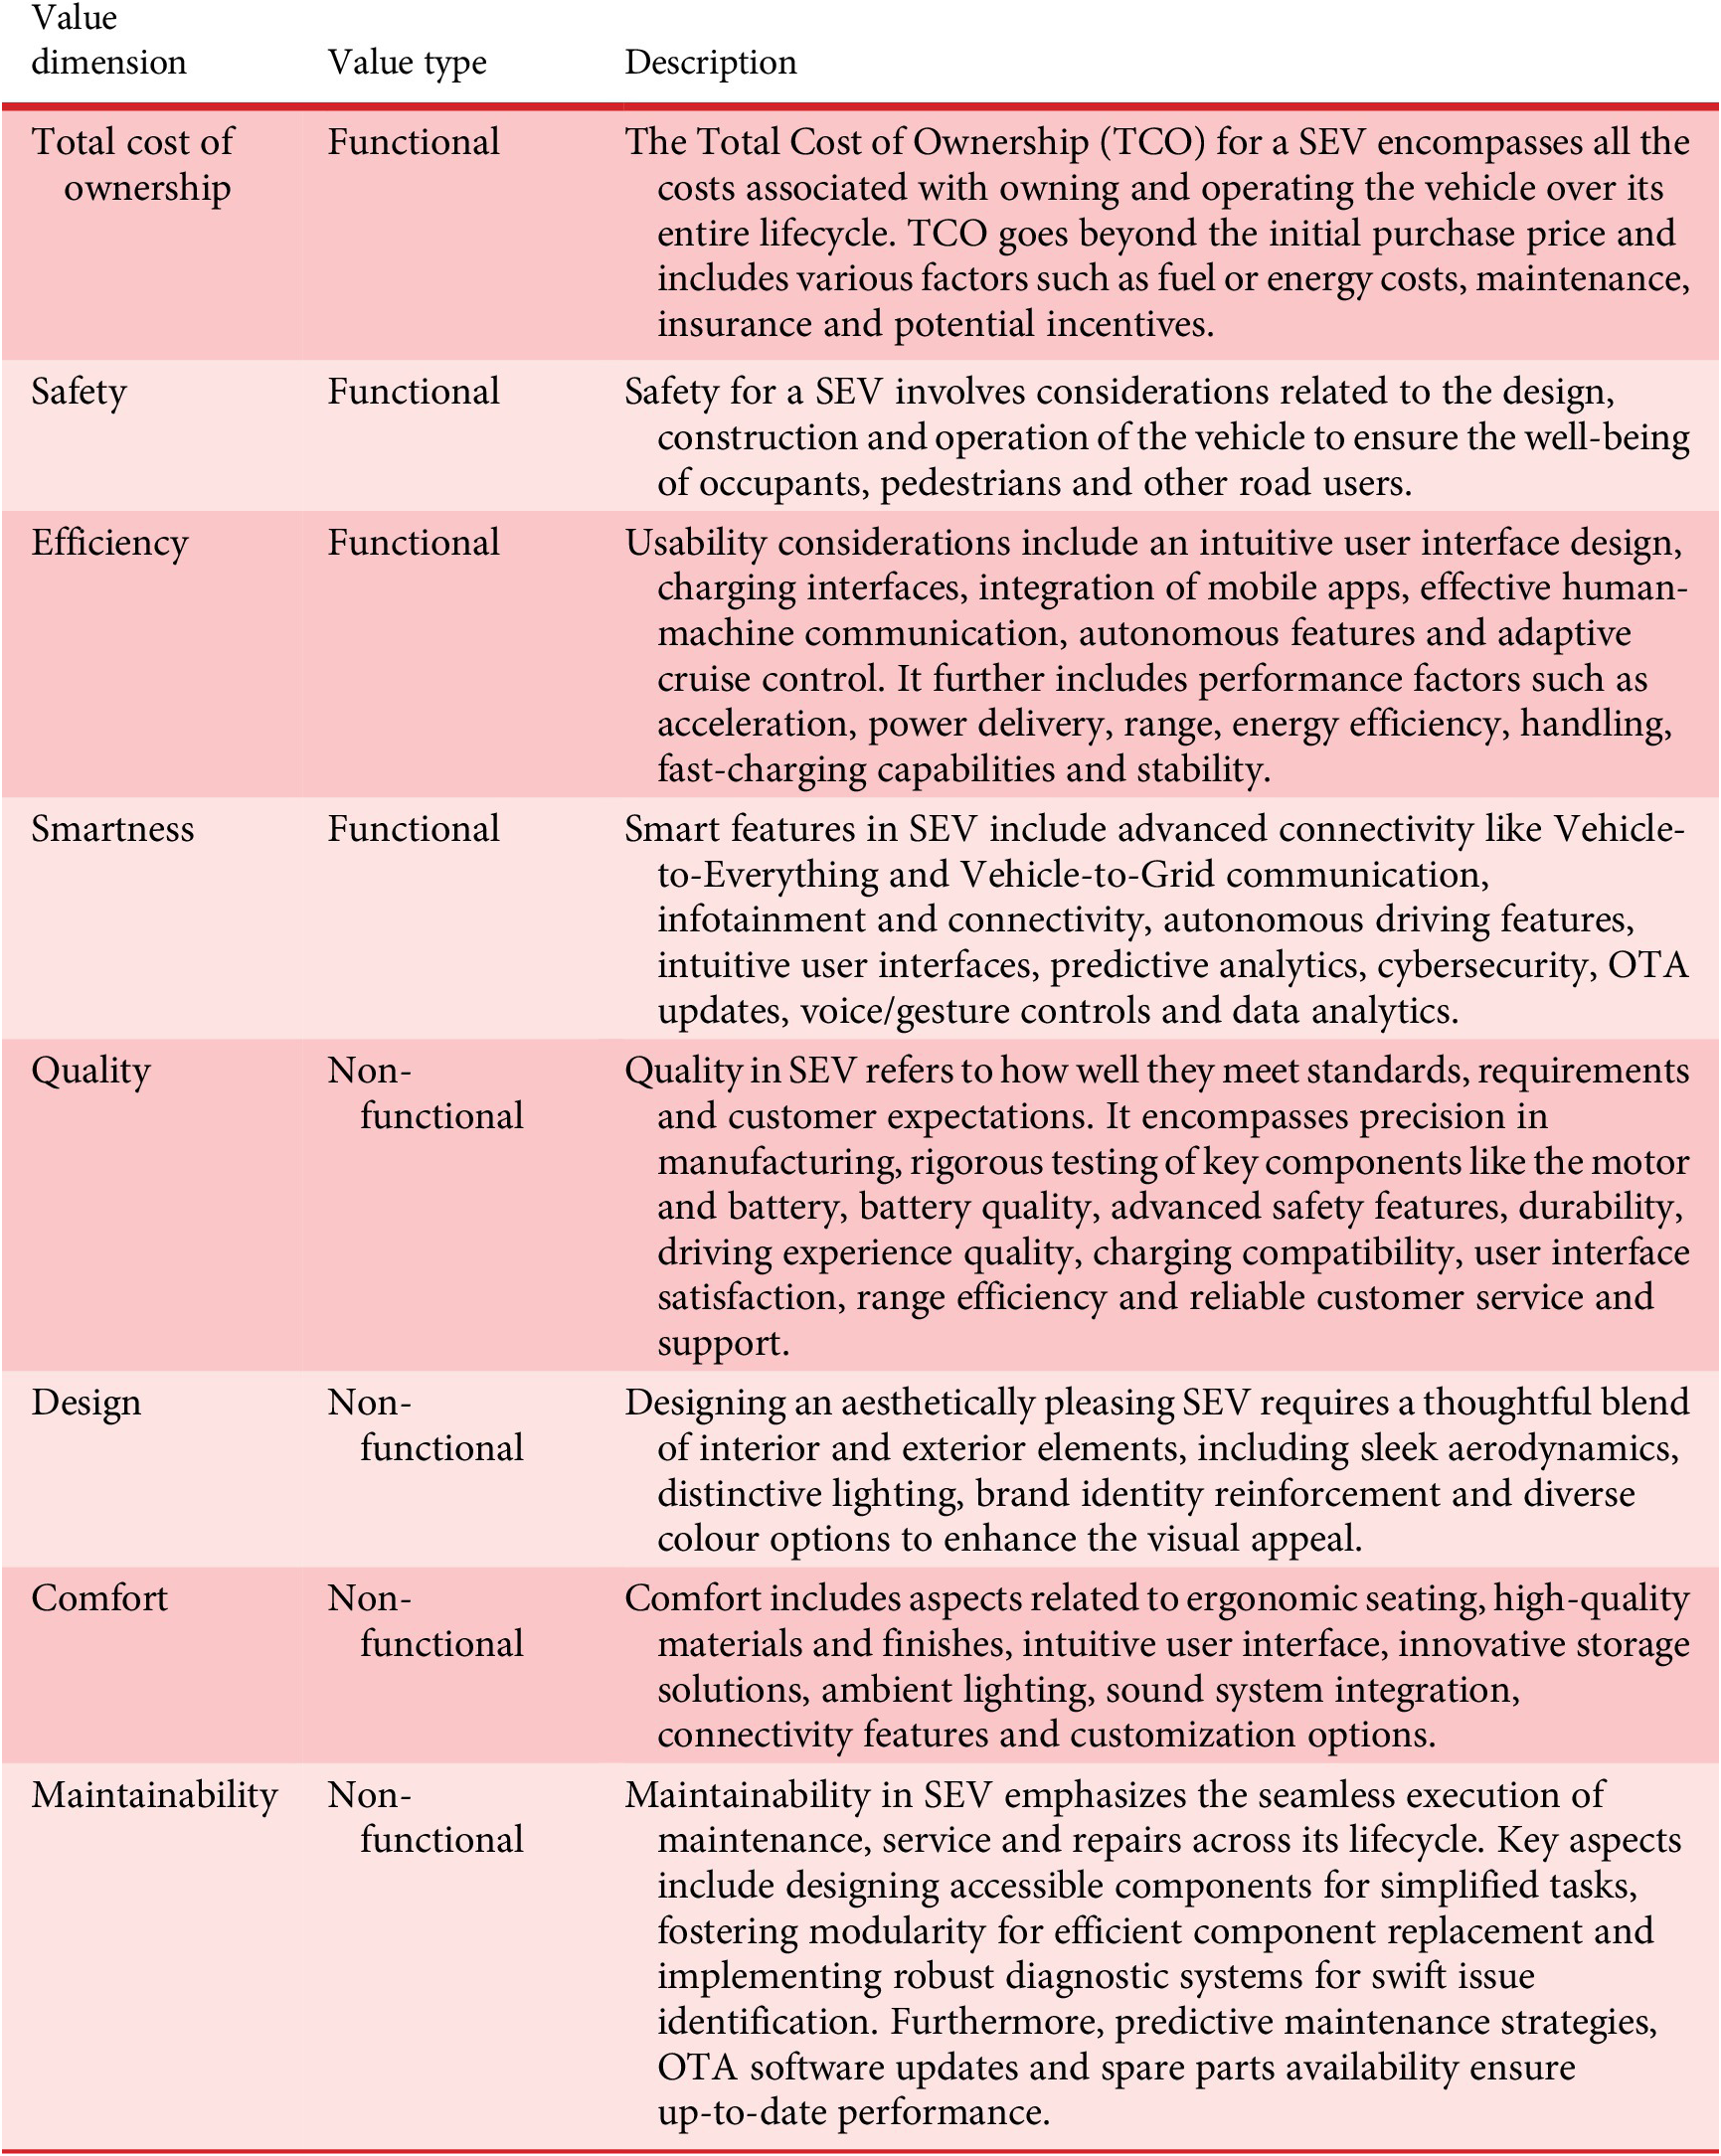
The weight of each criterion is determined by gathering the assessment and preferences from industry experts, typically through dedicated focus groups. The determination of the specific rank weights is supported by the AHP methodology, to obtain a mathematical description of the strategy for value creation in a Scenario. AHP is built on the concept of ‘pairwise comparisons’. The importance of one criterion is compared against another in a pairwise fashion. The experts are requested to assign a numerical value representing their relative importance, using a value of 1 if both criteria are equal, a value of 9 if the first criterion is extremely more important than the second, and a value of 1/9 for the opposite situation. A comparison matrix provides a systematic way to represent and organize the relative importance of the elements and allows for the calculation of the weighted scores for each criterion by taking the average of the values in its row.
5.3. Analyse and visualize value
The process of generating alternative design concepts involves selecting different features to enhance the existing product platform. Each design concept is a unique combination of these features, and the descriptions are input into a value model to generate scores between 1 and 10 along each value criterion. To conduct the value analysis, a Multi-Criteria Decision-Making Method, implemented in Python, incorporates features from the TOPSIS methodology and the Early Value Oriented design exploration with KnowledgE maturity (EVOKE) approach by Bertoni et al. (Reference Bertoni, Bertoni and Isaksson2018). The value model calculates the correlation between features and scenarios, prioritizing relevant features and reflecting the correlation through scores.
AI-assisted NLP is employed to define these correlations. Utilizing the deep learning model’s language analysis capabilities, the textual content from the data imported during the previous step is transformed into quantitative indicators to aid in computing the value scores for the SEV in the given scenario. This module is constructed using Sentence Transformers and Pytorch, employing pretrained BERT-type models such as bert-base-chinese, all-MiniLM-L6-v2, ms-marco-MiniLM-L-6-v2, multi-qa-MiniLM-L6-cos-v1, paraphrase-MiniLM-L6-v2. The model with the best performance on the case vocabulary database is selected as the pretraining model. All models are retained in the calculation process for subsequent debugging. The calculation procedure involves fine-tuning the pretrained model using specific case data. The fine-tuned model is then employed to compute semantic quantification features and perform similarity (contribution) calculations. The primary functions encompass text word embedding vector calculation, word embedding vector similarity (contribution) analysis, contribution matrix calculation between two sets of texts based on similarity, language model fine-tuning and language model pretraining. Each component is designed and implemented through corresponding Python method interfaces.
Figure 5 illustrates the final outcome of the value analysis step. The design concept under consideration features a total score for the selected scenario equal to 6.8 out of 10 as an aggregated result. The lowest value score is featured for the TCO criterion (5,65), while the highest score is featured for Quality (6,78), which also features the highest weight (9) among the different criteria.
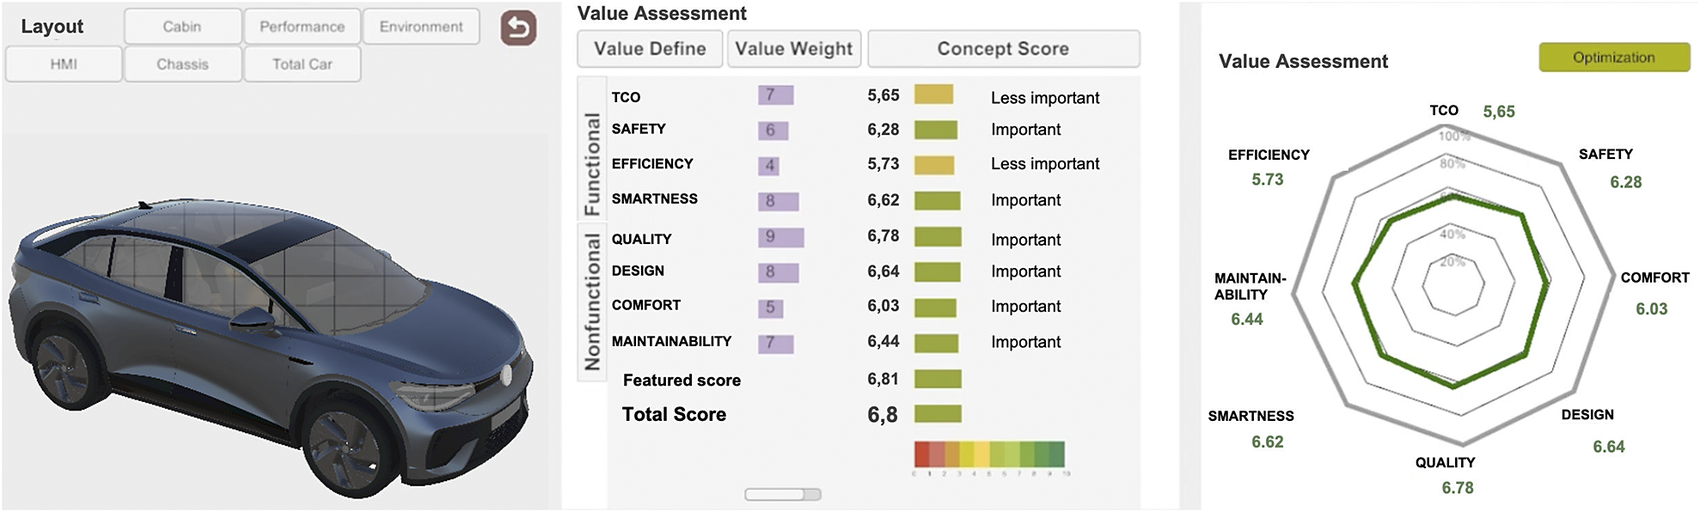
Figure 5. Results from the value analysis model for the SEV.
The visualization of these results occurs in a Decision Arena environment, akin to the one detailed by Wall & Bertoni (Reference Wall, Bertoni, Mortensen, Hansen and Deininger2020), using different techniques. Spider plots and parallel coordinates are complemented by colour-coded features linked to the results of the simulation (where green is used as a metaphor for ‘high value’, and red for ‘low value’, as seen in Figure 6). In a game interface, this study attempts to enhance the immersive experience for decision-making through interactive designs such as colour change, universal black and white icon, hover status indication, trigger preview function and world space UI panel in the major modules. Therefore, this immersive layer can assist different participants in achieving more intuitive and real-time participation in an interactive environment, enhancing the depth and realism of each interaction, thereby creating a fully integrated experience and enhancing their insight and decision-making capabilities.
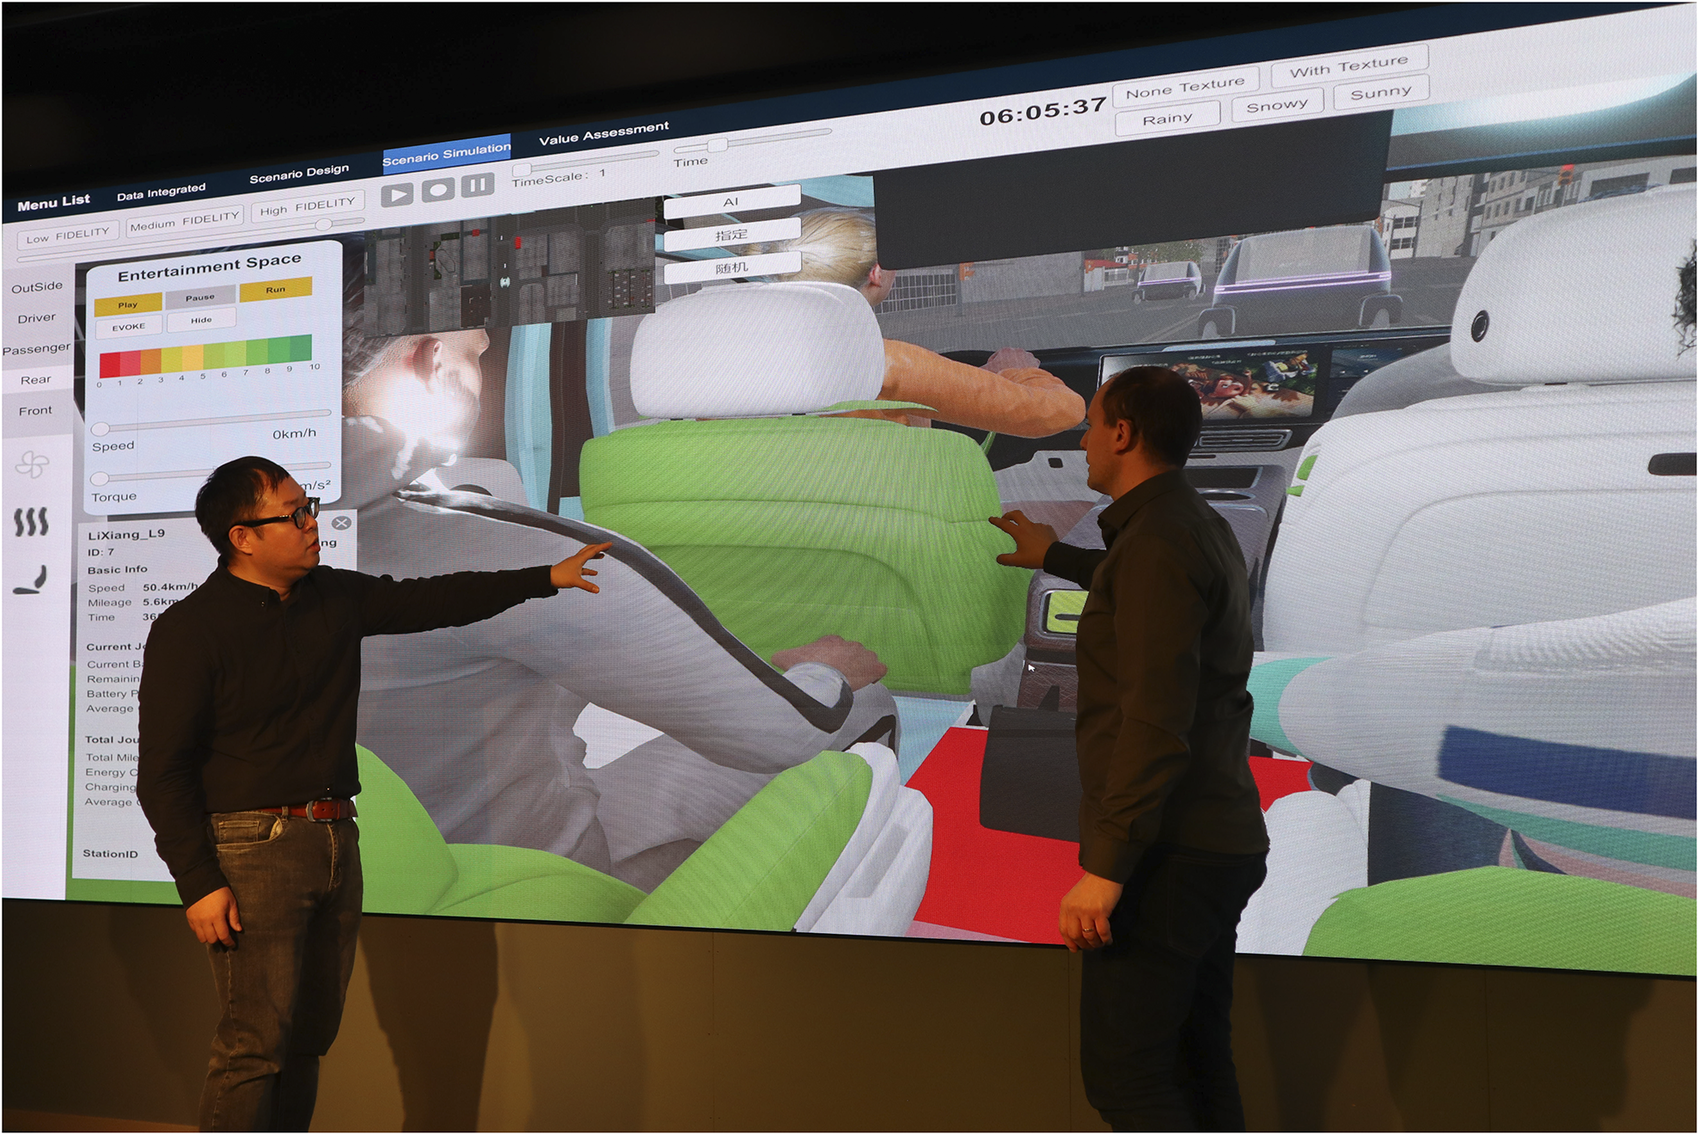
Figure 6. Colour-coded visualization of the value analysis results for Model ID.4 concept #123.
The visualization exploits three different fidelity modes – first-person view, product view, and super-system view – allowing adjustments to meet diverse needs. The super-system view is often described as the top-down mode and consists of a drone-like visualization of the ‘system’ being designed, including contextual factors like time, weather and road conditions. On the opposite, the bottom-up ‘first-person view’ mode showcases high-resolution details of interior materials, driver and passenger behaviours and the perceived effects of entertainment scenario features. At the same time, the study will delve into the behavioural activity control model and establish environmental interaction, scenario interaction, product interaction and digital human interaction so that participants can immerse themselves more deeply in the scenario (seen in Figure 6). In addition, the system can integrate participants’ feedback into the original design in real-time, which greatly facilitates continuous optimization and iteration. Through data-driven analysis, the design team can keep abreast of user needs and behavioural changes so as to quickly adjust and improve in the design process, forming a self-reinforcing cycle and promoting continuous innovation of products and services.
5.4. Validation of SSDT to support sPSS design
To assess the impact of the SSDT approach on early-stage automotive design, a verification session was conducted at Volkswagen with five participants from marketing, design and R&D, all experienced in applying DT in SUV development. A selected design episode was observed under real working conditions to evaluate SSDT integration. Participants then completed a questionnaire based on Bertoni et al.’s (Reference Bertoni, Bertoni and Isaksson2018) value assessment method, rating 12 criteria on a 1–9 scale (5 as baseline, 7 as target). Scores ranged from unusable (1–3) to excellent (9), with results summarized in Table 3. across the three groups.
Table 3. Score results from the verification session at VW
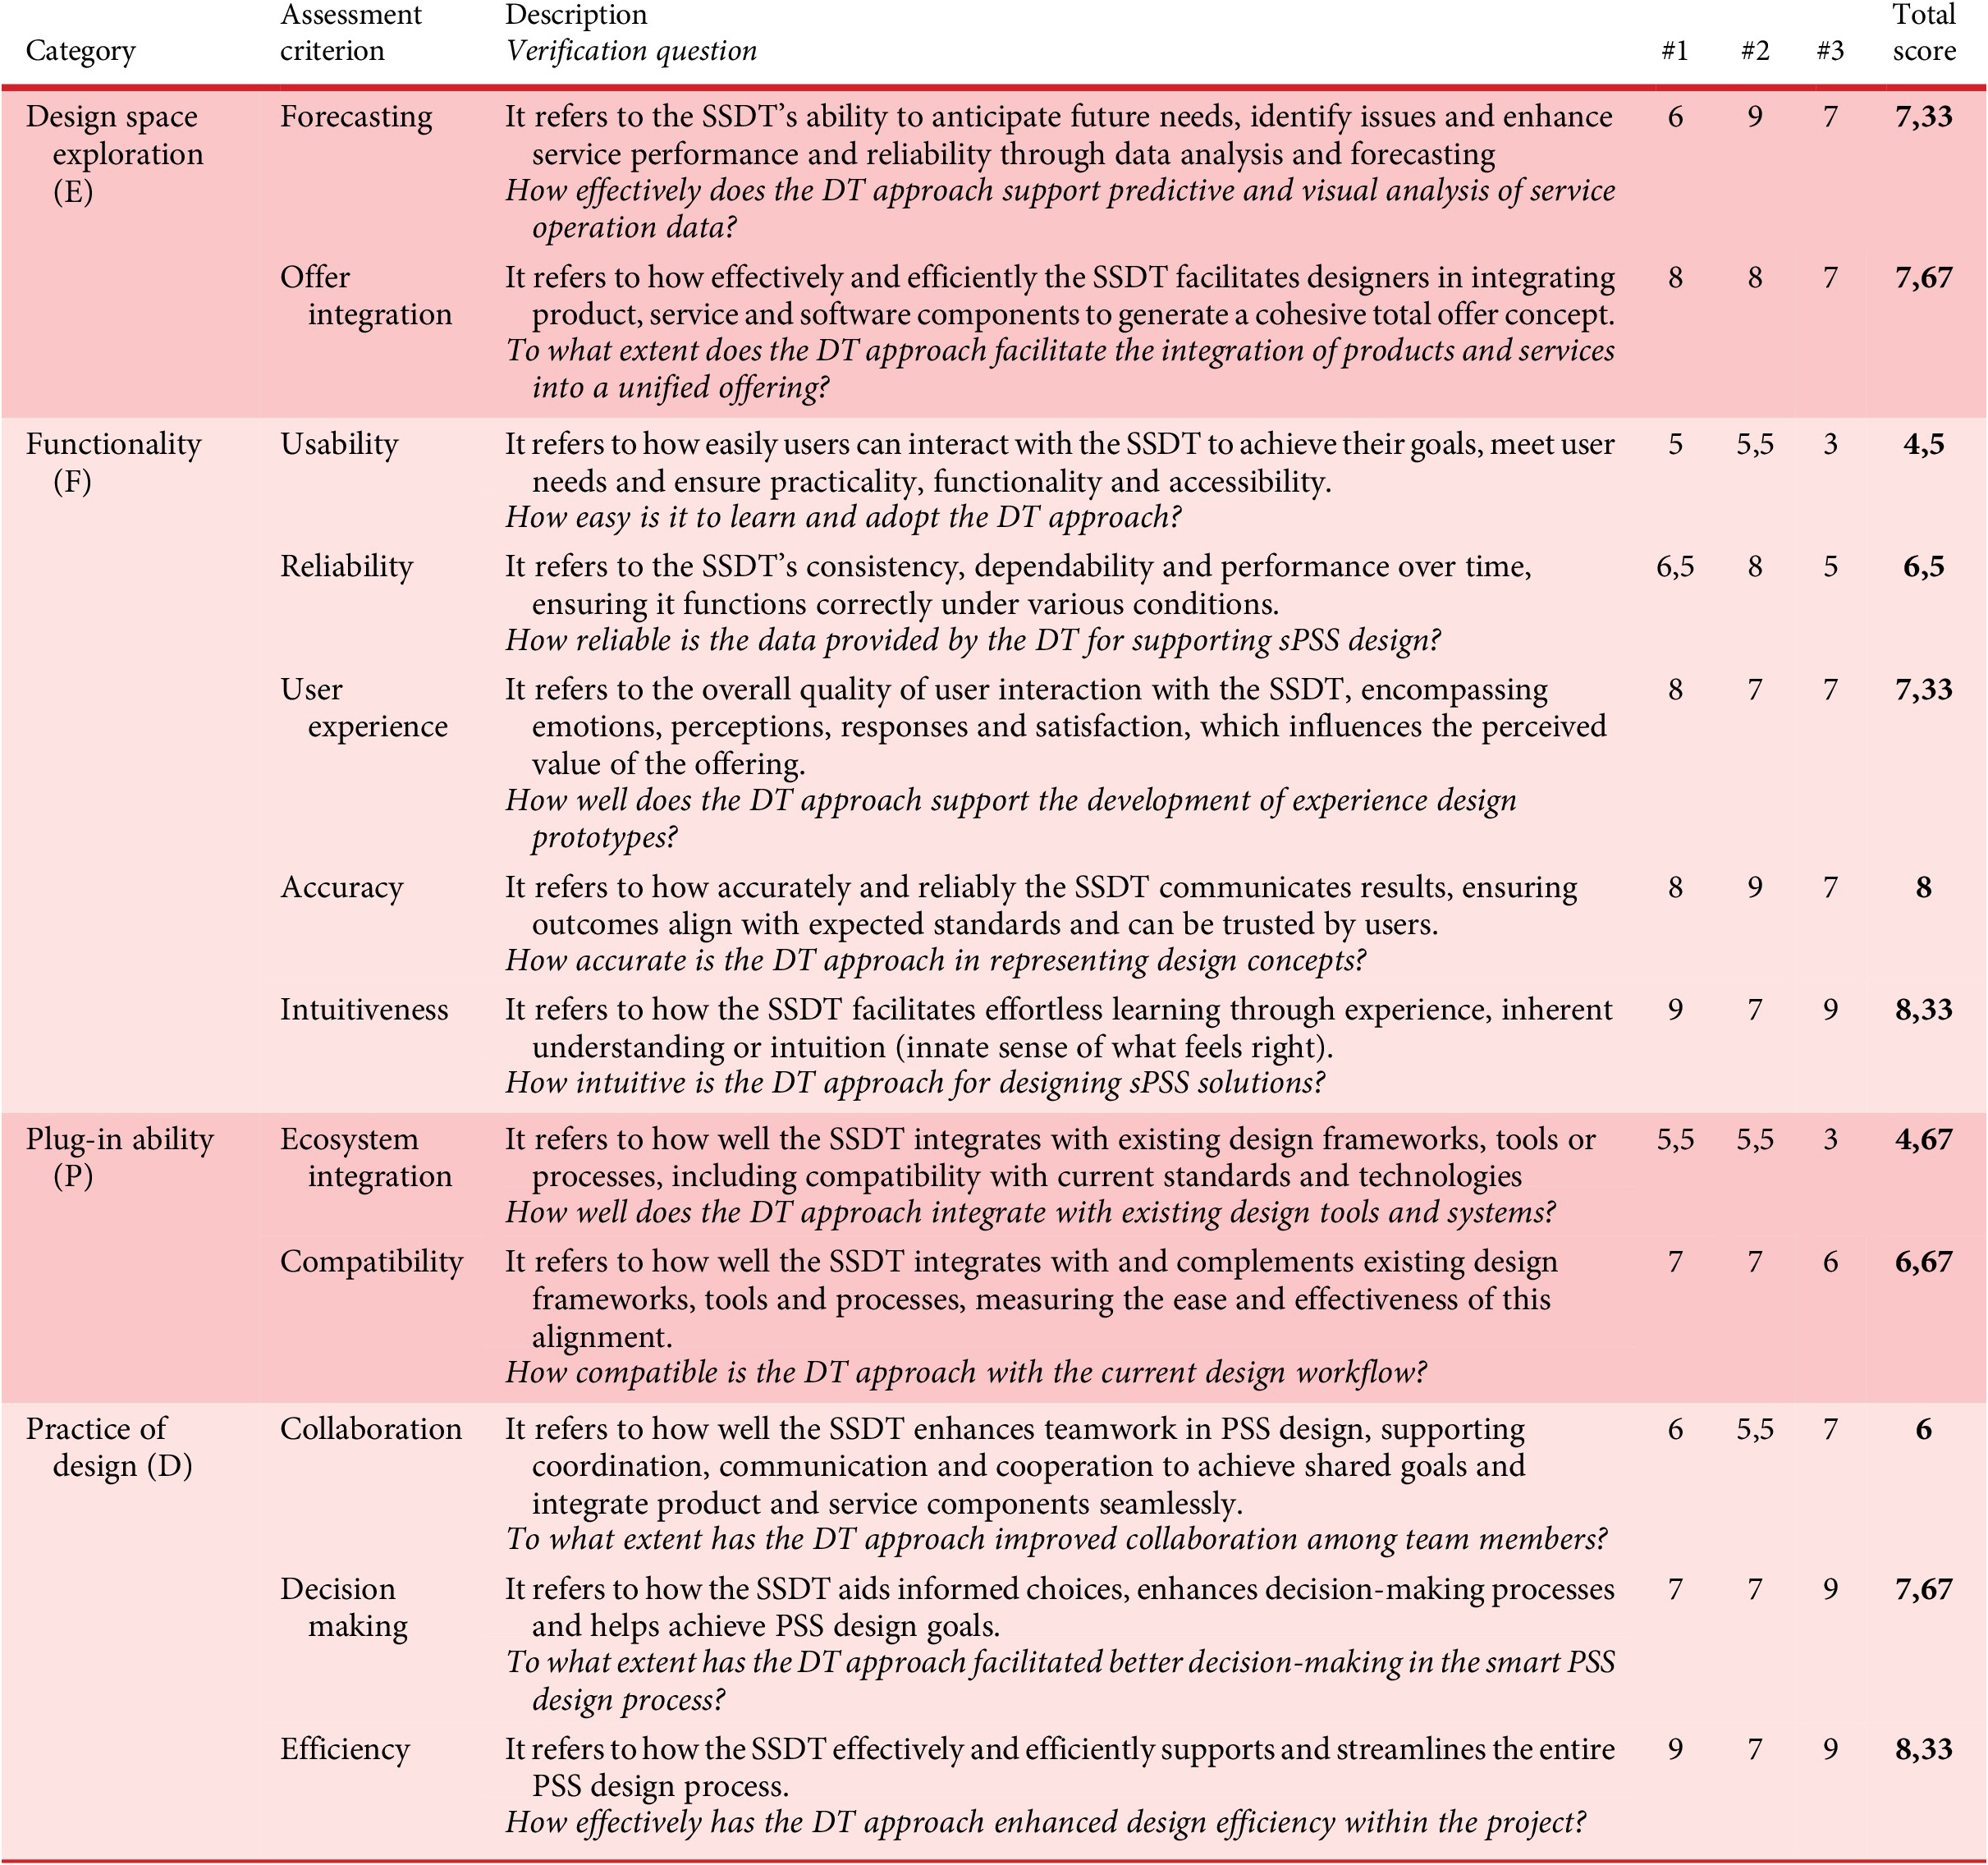
Figure 7 illustrates the average scores across the 12 evaluation criteria, using a colour-coded scoring scheme adapted from Bertoni et al. (Reference Bertoni, Bertoni and Isaksson2013) to visually represent performance levels – where red, yellow, and green indicate low, moderate, and high perceived value, respectively, in relation to the SSDT’s role in supporting smart PSS design. High scores were consistently observed in the dimensions of Intuitiveness, Accuracy and Efficiency, suggesting that the SSDT approach was perceived as highly supportive in these areas across all participant groups. In contrast, Usability and Ecosystem Integration received more critical evaluations, pointing to areas where further development is needed. Figure 7 also highlights variation in group responses, with black lines overlaid on the bars indicating the range of scores. Group 1 tended to assign higher ratings than Groups 2 and 3, particularly in criteria related to design support and integration with existing systems.
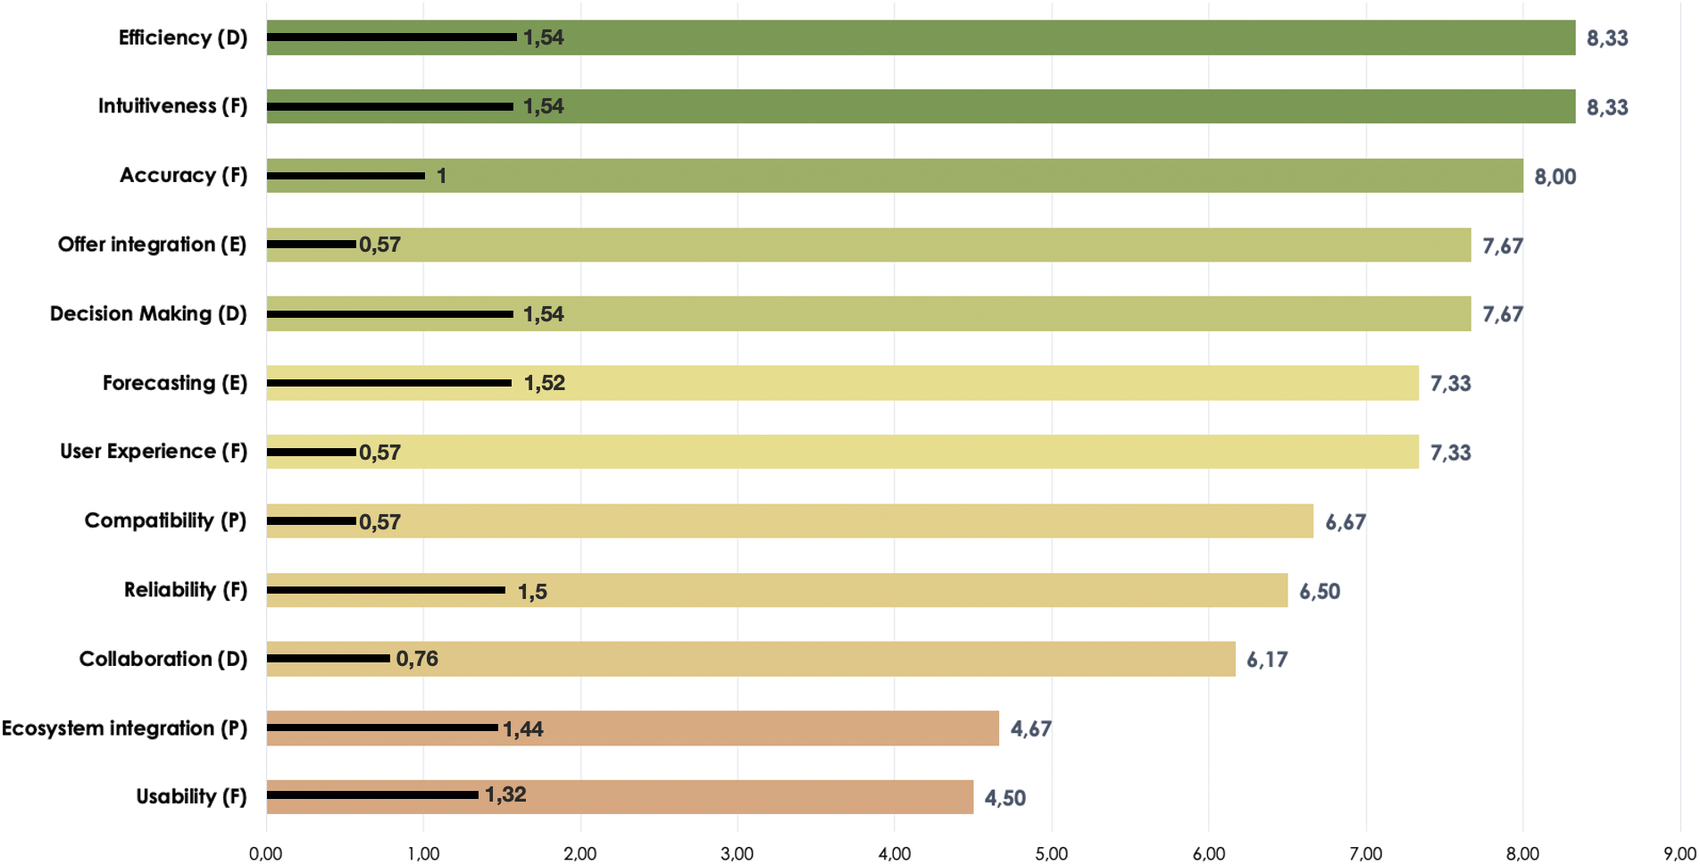
Figure 7. Aggregated scores for the 12 assessment criteria.
The findings were further examined through qualitative participant quotations, incorporating both corroborating and contradictory statements regarding the approach (Table 4).
Table 4. Corroborating and contradictory statements from the verification session
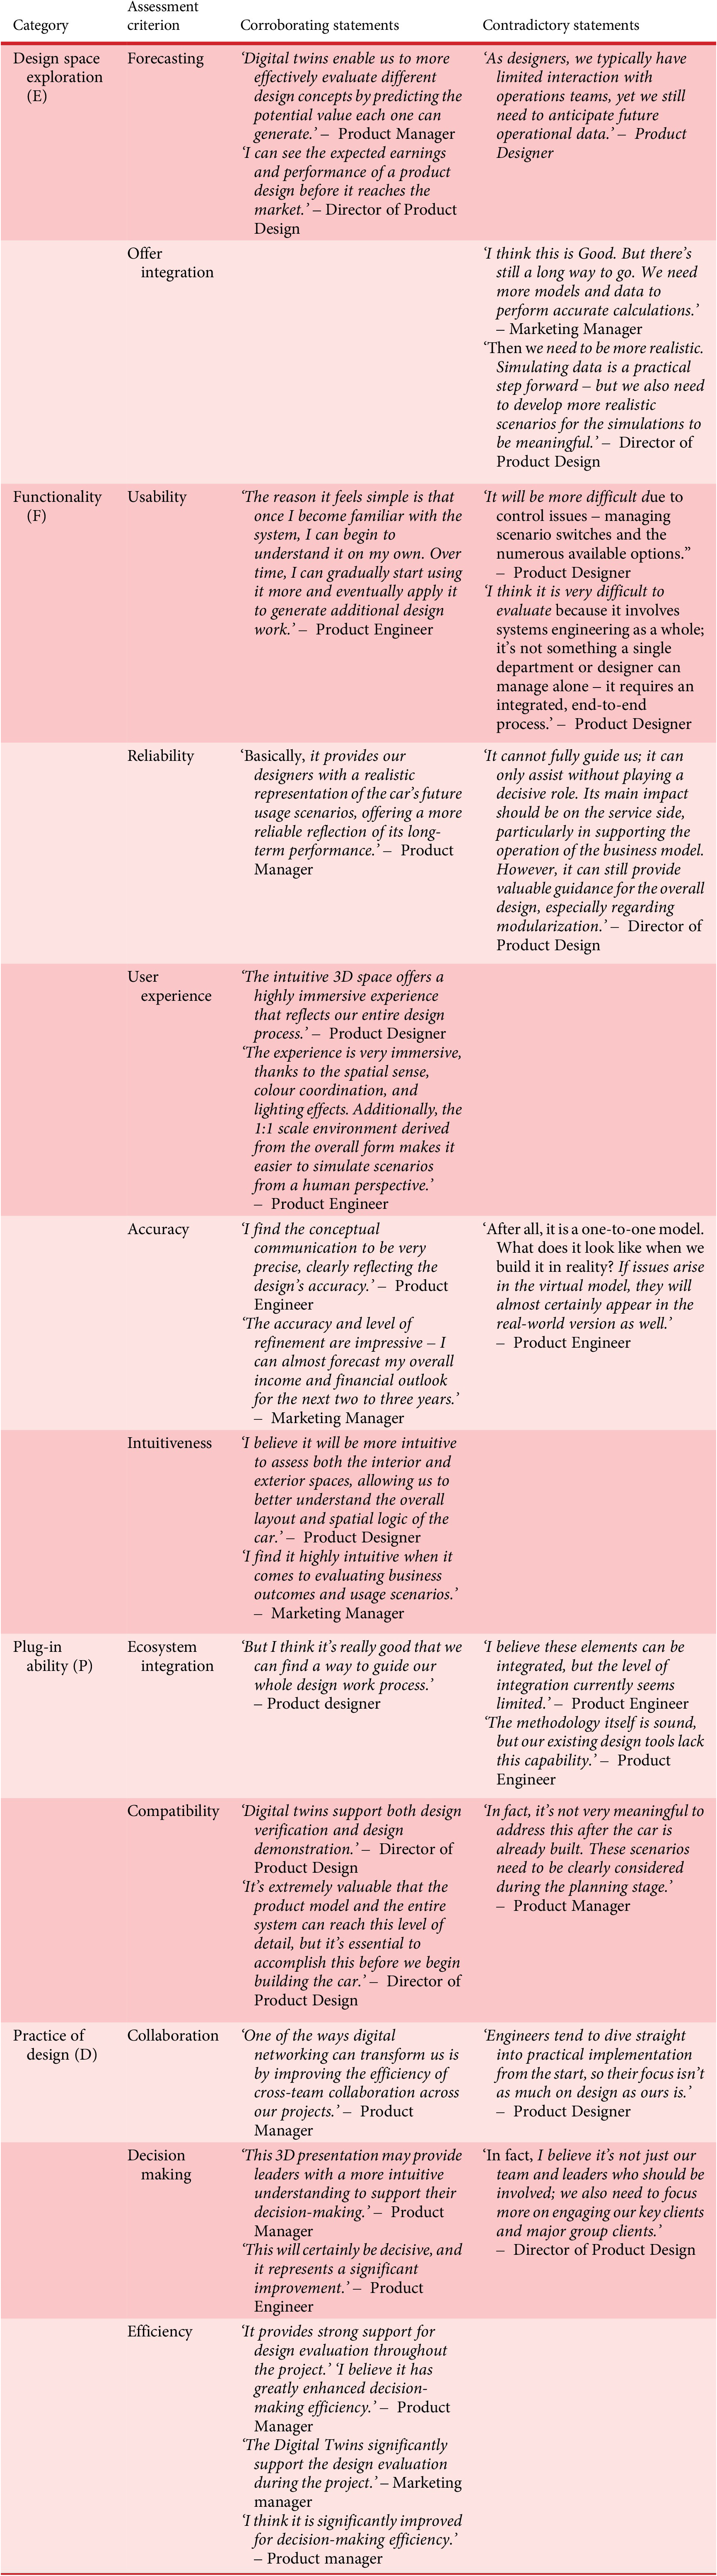
The analysis of the corroborating statements reveals that participants consistently rated intuitiveness as the most positive and highly valued feature of the proposed SSDT framework. Before implementing SSDT, design teams heavily relied on extensive textual reports and technical drawings to communicate system designs across decision makers and cross-functional departments. This often involved abstract or complex information that was difficult to interpret, creating barriers to efficient decision-making. The introduction of 3D twins, especially immersive scenarios simulating realistic environments, enabled a more intuitive and holistic understanding of system design. Accuracy was another dimension that received strong positive feedback. By integrating SSDT with VDD methods, design concepts could be evaluated with greater precision, closely aligning with the company’s strategic objectives and scenario requirements. This integration allowed for the comprehensive computation and clear visualization of design plans, encompassing hundreds of product features supported by quantitative data analysis and colour-coded representations. The SSDT framework notably enhanced design accuracy by presenting detailed, data-driven insights that facilitated precise communication. Efficiency also emerged as a significant benefit. Participants observed a faster generation of design concepts and a reduction in the overall design cycle time. The immersive DT scenarios stimulated designers’ creativity, enabling seamless and efficient exchanges between design proposals and designers. Moreover, the decision-making process became more streamlined and engaging; what was once seen as a challenging evaluation stage transformed into a dynamic, value-driven process where decision makers could confidently explore and select optimal solutions based on real-time information.
In contrast, the analysis of contradictory statements highlighted key challenges within the SSDT framework. Usability surfaced as a primary concern, as SSDT had not yet been fully integrated into existing product development workflows. The complexity involved in operating and understanding the system demands advanced evaluation expertise and sophisticated simulation control skills. This raises important questions regarding the responsibility for SSDT adoption – whether it should be centralized within specialized teams or distributed across cross-functional groups, both of which require substantial cross-disciplinary knowledge and system management capabilities. Integration of SSDT with existing ecosystems also poses significant difficulties. The need to navigate between multiple software environments and internal platforms complicates efforts to incorporate SSDT seamlessly into the design process. Achieving end-to-end product development within a single DT platform remains elusive due to compatibility and interoperability issues among various digital tools, impeding smooth collaboration and workflow cohesion. This fragmentation of software systems continues to be a major obstacle to broader adoption.
6. Discussion
While existing studies have explored the role of DTs in PSS, most have focused on operational optimization (e.g., real-time monitoring predictive maintenance) rather than early-stage decision-making (Pezzotta et al. Reference Pezzotta, Cavalieri, Romero, Rozenes and Cohen2017; Stark et al. Reference Stark, Fresemann and Lindow2019). Frameworks such as VDD (Collopy & Hollingsworth Reference Collopy and Hollingsworth2011) and simulation-based design methods (Meierhofer et al. Reference Meierhofer, West, Rapaccini, Barbieri, Nóvoa, Drăgoicea and Kühl2020) provide valuable insights into value-driven design but often lack the immersive and scenario-based approach enabled by SSDT. Unlike traditional DT-supported methods that primarily optimize existing configurations, the SSDT approach extends the design space by enabling early-stage exploration of alternative smart PSS concepts. By incorporating real-time scenario simulations, hierarchical decision structures and AI-supported value assessments, the SSDT framework enables a more dynamic and intuitive decision-making process. This comparative advantage positions SSDT as a means to bridge existing gaps in current methodologies by providing a more holistic and interactive approach to early-stage smart PSS design. The approach was further refined based on qualitative user feedback, which offered valuable insights for improvement. Evaluation results highlight strong interest from the automotive OEM in adopting the DT approach within its product development processes, signalling an openness to integrating DT-based methods into future design workflows.
The evaluation results highlight the SSDT framework’s effectiveness in supporting early-stage decision-making for SEV development. Participants emphasized its strength in enabling value-driven configurations, particularly praising its intuitiveness, accuracy and efficiency. The immersive visualization of value scores emerged as a key factor in fostering cross-functional collaboration, enhancing shared understanding and alignment among design, engineering and product planning teams. Intuitiveness stood out as a major benefit, with users noting that the 3D digital representations significantly reduced dependence on abstract textual reports, allowing for a more direct and experiential grasp of design trade-offs. Additionally, SSDT’s accuracy in aligning design intent with strategic goals was positively received, as it enabled precise value assessments grounded in data-driven insights. Additionally, the study outlined efficiency gains in terms of accelerating design iterations and streamlining decision-making, with the team being able to explore diverse design configurations dynamically and in real-time.
Usability challenges were noted, particularly regarding the need for advanced expertise to operate SSDT effectively. Participants expressed concerns about whether its adoption should be centralized within a specific department or distributed across teams, emphasizing the necessity for more intuitive user interfaces and training mechanisms. Ecosystem integration was another key challenge, as SSDT’s compatibility with existing enterprise software remains a hurdle for seamless workflow adoption.
Verification activities to date have highlighted two main areas for improvement. First, there is a need for greater flexibility in customizing value criteria to better align the value assessment process with specific contextual needs. An opportunity lies in leveraging AI-driven approaches to automate the definition of the VCS criteria and dynamically optimize value scores, enhancing both efficiency and adaptability. Additionally, there is a clear desire for non-experts to be able to use SSDT more independently, with minimal facilitation and training. Looking ahead, the rising demand for 3D modelling in automotive design presents a significant cost challenge for manufacturers. To address this, future research should focus on developing cost-effective alternatives for 3D model creation and immersive environment generation. Identifying innovative techniques to streamline these processes is seen as a key priority for advancing the SSDT framework.
A limitation of the study is its reliance on a single-case design, which restricts the generalizability of the findings. Although this approach offers in-depth insights, validating the SSDT’s wider applicability requires multi-case studies across diverse sectors such as aerospace (e.g., fleet maintenance optimization), healthcare (e.g., simulation of medical device-service ecosystems) and consumer goods (e.g., smart home ecosystems). Work is ongoing to enhance the generalizability and validity of the proposed approach and showcase its benefits across various industrial contexts.
7. Conclusions
Recent research and scientific literature underscore the transformative potential of DTs, simulations and data-driven decisions in reshaping the approach to value co-creation within the manufacturing industry. However, the literature also points out a scarcity of successful cases effectively demonstrating the transformative impact of these concepts in a design setting.
The proposed SSDT approach addresses a critical gap by offering a comprehensive framework and practical demonstration of integrating value-driven decision support into the early conceptual design of sPSS. Extending DT capabilities beyond traditional operational monitoring leverages IoT-enabled components, natural language processing algorithms and XR environments to facilitate creative, value-focused design exploration. This integration provides quantifiable insights into system performance, user interactions and the potential for value co-creation, thereby advancing the applicability of DTs within early-stage design processes.
A key takeaway is that DTs effectively serve as catalysts for VDD during the early stages of development. The SSDT setup was successful in enabling the exploration of diverse sPSS configurations and evaluating the value of various design concepts in relation to specific product platforms and usage scenarios. Another important insight is that the colour-coded immersive environment for value visualization outperformed conventional methods such as spider plots and tables. Consistent with previous research (Bertoni et al. Reference Bertoni, Bertoni, Broeze, Dubourg and Sandhurst2014), the superiority of the immersive environment lies in its ability to clearly highlight areas of success (or areas needing improvement) in terms of the value generated by proposed design concepts. The 3D colour-coded visualization equips decision makers with the contextual insight necessary to understand why a design concept scores high or low in value, thereby enhancing the overall decision-making process.
Future research will expand the SSDT framework and methodology to include a wider range of industrial domains and PSS types, with particular emphasis on result-oriented PSS. These efforts will aim to identify critical success factors – such as operational challenges – and define metrics specific to Result-oriented PSS. The SSDT approach will be tested in contexts such as ‘Mobility-as-a-Service’ and cross-sector collaborations, where comprehensive service solutions, dynamic customer engagement and value creation for manufacturing firms are key characteristics. Additionally, the integration of AI will be explored across various phases of the SSDT-supported design process, including the development of geometric models, the definition of value criteria within the Value Contribution Score (VCS) and the computation of value scores during the value analysis phase.
Acknowledgements
The work has been supported by the Swedish Knowledge and Competence Development Foundation (Stiftelsen för kunskaps- och kompetensutveckling, through the Model Driven Development and Decision Support, the Swedish Governmental Agency for Innovation Systems (VINNOVA) and by BIGMind innovation.


 Open access