


1. Introduction
In Austria, as in many other countries, there exists a well-developed public pension system that is the main source of old-age income for a majority of the population. These pension promises can have considerable economic effects, for example, by altering incentives for life-cycle savings. For a number of countries, there exist attempts to quantify the aggregate value of these public pension promises and to contrast them to the existing estimates of net wealth (i.e., the sum of financial and real assets minus total debts).Footnote 1 This has been done, for example, for Germany (Rasner et al., Reference Rasner, Frick and Grabka2013; Bönke et al., Reference Bönke, Grabka, Schröder, Wolff and Zyska2019, Reference Bönke, Grabka, Schröder and Wolff2020), Switzerland (Kuhn, Reference Kuhn2020), the US (Bönke et al., Reference Bönke, Grabka, Schröder and Wolff2020; Catherine et al., Reference Catherine, Miller and Sarin2020; Sabelhaus and Volz, Reference Sabelhaus and Volz2020) and Australia (Longmuir, Reference Longmuir2023).
The present paper contributes to the existing literature from three angles. First, we amend the rather short list of countries for which public pension entitlements have been estimated by providing data for Austria. To this end, we combine data from the third wave of the Household Finance and Consumption Survey (the HFCS, which contains information about private wealth for Austrian households from the year 2016/2017) with data from the social security register (which provides information about public pension entitlements for the same period). Since it was not possible to directly link the survey and administrative data (e.g., via a unique identifier), we had to use statistical matching to address this challenge.
Second, the paper provides an overview of the related literature (both in verbal and in tabular form), and we compare our results to those for other countries. To the best of our knowledge, this international comparison includes the full set of papers that have provided comprehensive estimates of augmented wealth to date. We observe a broad similarity of the results for the majority of countries and also offer some tentative explanations for the smaller group of countries that do not follow the general pattern.
Third, we document a further result that might be of general interest for this line of research and which goes beyond the documentation of estimations for a single country. In particular, we show that our basic results are quite robust to the use of different data sources and methods to calculate the pension entitlements. The use of statistically matched data (our benchmark approach) leads to almost identical results as the use of direct survey responses or an estimation of expected pension benefits based on survey respondents’ recollected work history. These novel robustness results are interesting for two reasons. On the one hand, they offer researchers who want to estimate public pension entitlements and do not have access to administrative data a number of viable avenues to proceed. The question on work history is particularly simple to implement (at least for Bismarckian pension systems with a strong proportional relation between pension benefits and contributions). On the other hand, this robustness to the calculation method is also comforting news for cross-country comparisons since the papers of the related literature are often based on different methods and approaches to calculate pension entitlements.
Turning to the new results for Austria, we find that in our benchmark estimation, the average household has public pension entitlements that are of almost the same size as its private net wealth (both amounting to around € 250,000). This underlines the size and importance of the public pension system for old-age security in Austria. Our results are completely in line with the ones for Germany and Switzerland, which have found a similar quantitative importance of pension entitlements relative to private net wealth. One difference across countries is, however, whether the value of pension entitlements is concentrated in the first (the public) pillar (as in Austria) or in the second and third (the occupational and private) pillars as, for example, in Switzerland. The presence of pension entitlements also affects the estimation of the distribution of resources across households. If one adds the value of household pension entitlements to the value of household net wealth then the resulting measure of ‘augmented wealth’Footnote 2 is more equally distributed than private wealth. In our analysis, for example, the Gini coefficient for augmented wealth comes out as 0.53 while the Gini coefficient for net wealth is 0.73. These results are again comparable with the ones for Germany (where the Gini is reduced from 0.76 to 0.51) and Switzerland (where it drops from 0.75 to 0.55).
The inclusion of pension entitlements offers a more encompassing picture of households’ economic possibilities across the life cycle. Households that expect sizable future public pension benefits are likely to hold less assets than households that have to provide by themselves for old-age security. The exclusion of public pensions might thus distort the assessment of the distribution of economic resources between households within a country and also the comparison between countries that are characterized by differently organized welfare states. At the same time, it should be noted from the outset that combining private net wealth with public pension entitlements is not without problems, and the resulting figures must be interpreted with caution. The concerns are related to practical issues (e.g., coming up with reliable cross-country estimates of future pension entitlements) as well as to more fundamental issues. The latter have to do with the fact that future pension entitlements are not ‘marketable wealth’ and that they furthermore do not fulfill a number of crucial functions which are characteristic for financial and real wealth (inheritability, fungibility, provision of social status and power, etc.) implying that they should not be given the same weight in a compilation of household wealth (Alvaredo et al., Reference Alvaredo, Atkinson and Morelli2018, p.28). Ultimately, it depends on the focus of the investigation whether and to which extent pension entitlements should be included in the analysis.
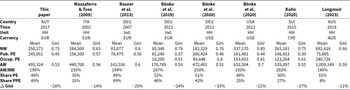
The literature on the calculation of public pension entitlements is not excessively large, and there exist only a small number of papers for a handful of countries. Moreover, we are aware of only one paper (Bönke et al., Reference Bönke, Grabka, Schröder and Wolff2020) that attempts to calculate comprehensive and comparable measures of public pension entitlements for more than one country (Germany and the US). This has to do with the fact that both – wealth surveys and even more so pension systems – are highly country-specific and it is often quite difficult to make them comparable. Table 1 provides a brief summary of the main papers of the related literature (including – for the sake of comparison – in the last line the present paper).Footnote 3 The table reports the country, the time period, the unit of observation (individual or household), the sample size, the data source, and the method used to combine information on net wealth (defined as the sum of financial and real assets minus eventual debts) and on public pension entitlements. We will discuss the different methods listed in the last column of Table 1 later (see Section 3) when we describe the data approach used in this paper.
Table 1. Main features of the related literature
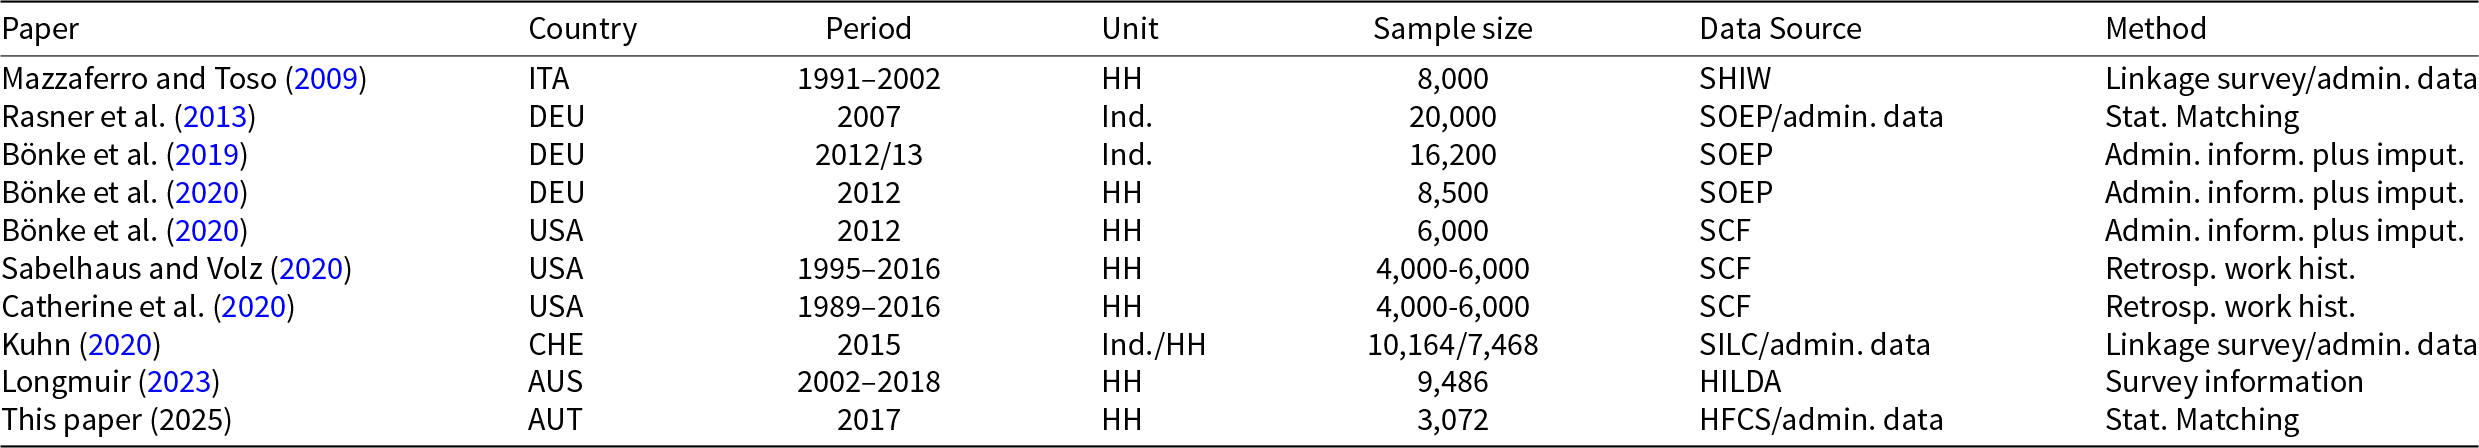
Note: The abbreviations for the data sources are as follows: SHIW=Survey of Household Income and Wealth, SOEP=Socio-Economic Panel, SCF=Survey of Consumer Finances, SILC=Statistics on Income and Living Conditions, HILDA=Household, Income and Labor Dynamics in Australia, HFCS=Household Finance and Consumption Survey. Other abbreviations are: HH=households, ind=individuals, admin=administrative, stat=statistical, inform=information, imput=imputation, retrosp=retrospective, hist=history.
The paper is structured as follows. In Section 2, we describe the basic elements of the Austrian pension system, while in Section 3, we discuss available methods that can be used to incorporate information on households’ pension entitlements, and we sketch the method used in this paper and the main data sources (the HFCS and data from the social security registry). Section 4 discusses the basic formula that is used to calculate the present value of public pension entitlements and we specify the assumptions underlying our benchmark estimation. Section 5 contains the results both for the aggregate values and for the distributional measures. We also document the robustness of the estimation for the use of different data sources and methods to calculate the pension entitlements. Section 6 contains the international comparison, while Section 7 concludes.
2. The Austrian pension system
The majority of the working population in Austria participates in a mandatory public pension scheme that is specified in the General Pension Act (Allgemeines Pensionsgesetz, APG).Footnote 4 The APG system operates on a pay-as-you-go basis and is built around ‘individual defined benefit pension accounts’. The contribution rate is 22.8%, with 10.25% paid by employees and 12.55% by employers (with some exceptions for farmers and the self-employed). The main element of the benefit side of the system is the formula: ‘45/65/80’: After 45 years of insurance and retirement at the age of 65, the system provides an initial pension benefit that corresponds to 80% of average lifetime income. This target is implemented by means of an accrual rate (‘Kontoprozentsatz’). Each year, 1.78% of total earnings (up to a ceiling, the ‘Höchstbeitragsgrundlage’)Footnote 5 is credited to the account (‘Teilgutschrift’ or annual credit, AC), while past credits are revalued according to the growth rate of the average contribution base. The revalued past credits and the annual new credit add up to the total pension value (‘Gesamtgutschrift’ or total credit, TC). The credits are recorded in pension accounts, which can be accessed online or requested by mail from the insurance agency. The information given in the pension account statement can be easily transformed into pension benefit levels. By design, the total credits correspond to the annual initial pension benefit an insured person can expect upon retiring at the statutory retirement age (65 years for males and increasing until 2033 from 60 to 65 for women) and if there would not be any additional credits to the account and no further revaluation. Although these total credits do not offer precise forecasts of individual expected pension benefits, they are highly useful for our purposes since they correspond exactly to the pension rights that have been accrued up to a certain point in time (i.e., they are the ‘accrued-to-date’ value; see Section 4.1). Appendix A.2 contains an example that illustrates the structure of a typical pension account statement.
For early retirement between the ages of 62 and 65, benefits are reduced by 5.1% for each year of early retirement and increased by 4.2% for each year of delayed retirement beyond 65, up to age 68. However, only persons with a record of at least 40 years of insurance can use this pension corridor.Footnote 6 Once the initial pension benefits are calculated according to the rules specified above, the ongoing pensions are (typically) adjusted with the rate of inflation. For non-contributory qualifying periods (due to childcare, unemployment, sickness, etc.), the pension accounts are credited with specified amounts that are financed from the general government budget.
As stated above, the public pensions system as specified in the APG is the main source of income for the majority of the Austrian population There exist, however, some exceptions and additional elements. First, the APG applies only to individuals born after 1955, while the pensions of older cohorts continue to be calculated according to the previous rules. Second, certain (liberal) professions, such as doctors and lawyers, are covered by separate pension schemes that follow their own regulations and are excluded from our calculations. Third, civil servants have had – and in some cases still have – separate pension systems. In Appendix A.1, we provide further details on these specific cases and describe how we address them in our estimations. We also explain how the pension system introduced ‘initial pension credits’ to account for individuals with insurance years under both the old and the new system.
Finally, occupational pensions only play a minor role in the current Austrian pension landscape. In 2018, assets in funded and private pension plans amounted to only 5.5% of GDP – considerably below the OECD average of 82.3% (OECD, 2019) and only 10% of pensioners received any occupational pension benefits. In the following, we abstract from these occupational pension benefits but come back to the issue in Appendix C.
3. Data and methodology
Our main data source for net wealth is the HFCS, which is discussed in Section 3.1. In Section 3.2, we discuss the most common methods that have been used in the related literature to come up with estimates for public pension entitlements. We then explain why we chose statistical matching as our baseline method and describe the details of the procedure (Section 3.3).
3.1. HFCS
The HFCS is a comprehensive survey of household balance sheets, covering income, expenditures, real and financial assets, and debt, thereby allowing for the calculation of net wealth. We use the third wave of the HFCS for Austria that has been carried out between late November 2016 and July 2017. A total of 3,072 households have been interviewed which contain 6,414 persons, 5,476 of which were 16 years old or older and are used for our analysis. In order to deal with the issue of non-responses, the HFCS uses multiple imputations.Footnote 7 The HFCS contains somewhat less detailed information at the individual level compared to the household level. Nevertheless, it contains a number of questions about occupation, work history, income sources, and various pension rights that are valuable for the calculation of pension entitlements. In particular, we have also made use of a set of special variables (e.g., about the pension account statement) that are not part of the harmonized set of core variables present in all participating countries.
The Austrian HFCS does not oversample wealthy households, which is known to result in an underestimation of wealth inequality. This may also lead to an upward bias in the estimated distributional impact of public pension entitlements – an issue to which we return in more detail later.
3.2. Different methods to estimate public pension entitlements
As mentioned in the introduction, there exist different methods to calculate estimates for public pension entitlements. In the related literature (see Table 1) all papers use comprehensive national surveys to come up with estimates of net wealth while the methods employed to append public pension entitlements differ along two dimensions: the source of data (the survey itself, linked register data or statistically matched administrative data) and the construction of the pension entitlements (direct information on the present value or simulations based on individual work histories and prevailing regulations). In principle, this results in six possible combinations of data source and pension calculation, although not all are found in the literature. The choice for one or another method depends mainly on data availability, institutional details, and legal restrictions. In the following, we provide a brief overview of the most popular methods ordered by the underlying data source.
3.2.1. Information on pension entitlements in wealth surveys
A natural starting point for amending traditional wealth data arises when the survey includes reliable information that enables the estimation of pension entitlements.
• Survey questions on present values. If the survey contains a specific question on the present value of future pension entitlements then this approach is straightforward. The available responses can be treated like the other wealth components and simply added to the calculations. The problem with this approach is that the information provided is often not very accurate (especially for younger respondents). It would thus be beneficial in this situation if the interviewer could resort to official information (e.g., pension account statements) either via inspection of documents provided by the respondents or via their agreement to access register information. The former approach has been applied by Bönke et al. (Reference Bönke, Grabka, Schröder, Wolff and Zyska2019).Footnote 8
• Survey questions on retrospective work history: Sometimes surveys include information about respondents’ past labor market experiences (like the start of their working career, their spell of unemployment or non-work periods, and their received wages). This allows researchers to simulate expected pension benefits based on current pension legislation. This approach, however, can be quite tedious and furthermore, not many surveys include sufficiently detailed information to use it. One exception is the US Survey of Consumer Finances (SCF) that includes a module that contains the retrospective work history and prospective work expectations of respondents in the SCF. This method has been chosen, for example, by Catherine et al. (Reference Catherine, Miller and Sarin2020); Sabelhaus and Volz (Reference Sabelhaus and Volz2020), and Jacobs et al. (Reference Jacobs, Llanes, Moore, Thompson and Volz2021).Footnote 9
3.2.2. Exact link to register data
The quality of the results can typically be improved if it is possible to use precise register data to get the necessary information about pension entitlements. This could, for example, be done by using a unique identifier (like the social security number) that is present both for the survey respondents and also in the official register data. In processing the data, one can again use the two possible ways to extract pension entitlements.
• Register data on present values: This approach is possible if the linked administrative data already contain present values of pensions entitlements or information that is closely related to these values, like – for example – the total pension points in a point system (cf. Germany), the pension account value in a notional defined contribution system (cf. Sweden) or the total credits in a notional defined benefit system (cf. Austria). In Germany, there exists an ongoing project that follows this route by linking data from participants in the SOEP survey to their individual record in the pension insurance (Lüthen et al., Reference Lüthen, Schröder, Grabka, Goebel, Mika, Brüggmann, Ellert and Penz2022).
• Register data on work history: Even if the register data might not provide direct present values of entitlements, they can sometimes still be used to provide more accurate estimates based on work history. This method (that again involves many assumptions and the coding of pension regulations) has, for example, been followed by Kuhn (Reference Kuhn2020) for Swiss register data.Footnote 10
3.2.3. Statistical matching
The final method for incorporating pension entitlements into wealth data involves the use of statistical matching techniques. This is the method at hand if the survey neither contains reliable pension data nor sufficient work history information, and if the exact linkage of survey and administrative data is impossible for technical or legal reasons. Again, the statistically matched data can involve present values of pension entitlements or data on work history that have to be transformed into entitlement estimations. This method is followed, for example, by Rasner et al. (Reference Rasner, Frick and Grabka2013) who statistically match administrative data from the Gesetzliche Rentenversicherung to the German SOEP.Footnote 11
3.3. Statistical matching for the Austrian data
For the Austrian data, we use the third approach – statistical matching – as our main method. The second method, which relies on a direct link between survey respondents and administrative data, was not feasible due to legal restrictions. The first method – using survey information – would have been feasible, as the Austrian version of the HFCS includes a block of questions related to acquired public pension claims. However, we decided not to adopt this as our primary method, as the responses raised some concerns upon initial inspection. In particular, many respondents did not answer these questions, and those who did provided responses that appear to be of questionable reliability (see Section 5.4 for details). The construction of pension entitlements based on retrospective work history, on the other hand, did not look promising since the HFCS contains only very sparse information about past labor market variables. In Section 5.4, we analyze, however, how the benchmark results based on statistical matching change if we use the alternative methods based on (incomplete) direct survey information or (very rough) measures of the work history. Anticipating the results, we find that the different methods lead to surprisingly similar estimates. This is an interesting finding that not only increases the confidence in the benchmark results of this paper but also supports the significance of cross-country comparisons that are based on papers that use different methods.
The data source of the statistical matching stem from the social security register (SSR). In particular, we managed to obtain a complete snapshot of social security data for the year 2016. These data contain (i) information about the pension account statements of all active individuals born between 1955 and 2001, (ii) information about the pension payments for all retired individuals (except retired civil servants). The data do not include information on active individuals born before 1955 since for them the pension account system does not apply (see Section 2 and Appendix A.1). The information for the active population (more than 4 million individuals) includes: gender, the age group (in 5-year intervals), the social security institution, the postal code, the initial pension credit, the annual pension credits for the year 2016, and the total pension credits at the end of the year 2016. The information for the retired population (about 650,000 individuals) is similar, only that now the information about the pension account is substituted by data on the monthly gross pension (for December 2016), the pension type (old age, survivor, disability, etc.), and the point in time when the pension payments started.
In order to amend the information from the wealth survey with information about public pension entitlements, the SSR data (the donor) have been matched to the HFCS data (the recipient). In particular, two versions of a random hot deck method were implemented, both relying on a one-to-one match at the individual level. Matching was performed using common variables present in both datasets, including age, gender, income, social security institution, and region. In the first version, income was used in discrete form (income deciles), while the second version treated income as a continuous variable and employed the Manhattan distance to find the seven closest matches, selecting one donor at random. The process accounts for imputed values in the HFCS by treating each imputation as a separate observation, thereby ensuring robustness across the matched dataset. For details on the matching procedure and the results, see Lindner and Schürz (Reference Lindner and Schürz2021).
The first matching procedure (based on income categories), which we also use as our benchmark specification below, resulted in an average total pension credit (for individuals) of € 11,340 (which is above the unweighted average of the SSR data amounting to € 9,800).Footnote 12 The median is € 9,150 while the highest value is close to € 50,000. We can aggregate the individual total credits to the household level and arrive at a (weighted) household mean of € 18,500 with a median of € 15,500 and a largest value of € 91,500.
4. Calculation of pension entitlements
In the next step, we take the values for the individual total pension credits and transform them into a unique number that can be regarded as a suitable estimation of the present value of public pension entitlements. This process involves several important assumptions, as will be discussed in the following.
4.1. ‘Accrual method’ vs. ‘ongoing concern method’
The first issue in this endeavor is related to the range of expected pension payments that should be included in the present value term of the active population. We follow the majority of papers in the related literature and base our calculations on the ‘accrual method’, which only considers entitlements that have been acquired up to the valuation date and neglects future pension rights. This method is in line with the general logic of household surveys (as it excludes future revenues) and as a by-product it also involves less assumptions about the expected working career, which necessarily introduces a considerable degree of uncertainty.Footnote 13
4.2. The present value formula
In this section, we describe how one can use the information on total credits (for active workers) and pension payments (for pensioners) to calculate the present value of public pension entitlements. This present value can be calculated on the basis of the following formula:
 \begin{equation}
\mathit{PE}_i=\sum_{x=max(a_i,R_i)}^{\omega}\frac{s_i(x)}{s_i(a_i)} \frac{P_i(x)}{(1+\delta)^{x-a_i}},
\end{equation}
\begin{equation}
\mathit{PE}_i=\sum_{x=max(a_i,R_i)}^{\omega}\frac{s_i(x)}{s_i(a_i)} \frac{P_i(x)}{(1+\delta)^{x-a_i}},
\end{equation} where we use the following notation:  $\mathit{PE}_i$ stands for the pension entitlements (the present value of expected public pension entitlements) of person $i$,
$i$,  $a_i$ for his or her age in the year 2016 and $R_i$ for his or her retirement age. For an active (not-retired) person, the retirement age lies in the future, while for an already retired individual, the retirement was an event of the past. The maximum function implements this distinction between active workers ( $a_i \lt R_i$) and retirees ( $a_i \gt R_i$) and equation (1) thus applies to both groups. $s_i(x)$ denotes the survival rates, that is, the probability that person $i$ is still alive at age $x\geq a_i$.Footnote 14 The use of an index $i$ in this expression captures the fact that there exists a strong correlation between specific individual characteristics (like education or income) and mortality. The parameter $\omega$ stands for the maximum age (say 110) that is assumed to be the same for all cohorts. $\delta$ denotes the discount rate that is used today (i.e., in 2016) to discount a pension payment that is delivered in the year $2016+x-a_i$. $P_i(x)$ finally stand for the pension income that person $i$ expects to receive at age $x\geq max(a_i,R_i)$, and it contains the entire effective legislation concerning the pension system. In equation (4) of Appendix A.3, we provide the formal expressions of $P_i(x)$ for the Austrian system. On the whole, there exists a large number of possible specifications for the various parameters and variables that are necessary to calculate the pension entitlement $\mathit{PE}_i$.
4.3. Benchmark specification
In the following, we list the assumptions that we chose for our benchmark specification, and we briefly explain the underlying rationale behind the choices. Details can be found in Appendix B.
• Statutory retirement age. For $R_i$, we assume that all individuals retire at the current statutory retirement age (see Appendix B.1). For men, this amounts to the age of 65 while for women, it will gradually be raised from 60 to 65 years in the period from 2024 to 2033 (by steps of sixth months). In this case we do not have to take deduction (supplements) for early (late) retirement into account. In Appendix C, we also look at the case where the retirement age
$R_i$ is set equal to individuals’ expected retirement ages.
$R_i$, we assume that all individuals retire at the current statutory retirement age (see Appendix B.1). For men, this amounts to the age of 65 while for women, it will gradually be raised from 60 to 65 years in the period from 2024 to 2033 (by steps of sixth months). In this case we do not have to take deduction (supplements) for early (late) retirement into account. In Appendix C, we also look at the case where the retirement age
$R_i$ is set equal to individuals’ expected retirement ages.• Life expectancy related to household income. Numerous studies covering various countries and time periods have documented that life expectancy of low-income individuals is considerably below the one of high-income individuals. For example, Chetty et al. (Reference Chetty, Stepner, Abraham, Lin, Scuderi, Turner, Bergeron and Cutler2016) report a life expectancy gap of 14.6 years for men and 10.1 years for women between the richest and poorest percent of the American population. In order to come up with income-specific mortality rates for Austria, we followed a procedure that has also been used by Sabelhaus and Volz (Reference Sabelhaus and Volz2020) (see their Appendix B). This method starts with the mortality rates for the year 2017 provided by Statistics Austria that are differentiated by gender and age. In the next step, we make an adjustment for differential mortality based on the pattern reported in Chetty et al. (Reference Chetty, Stepner, Abraham, Lin, Scuderi, Turner, Bergeron and Cutler2016) for the US. This adjustment is specified in such a way that the average mortality rate corresponds to the officially documented mortality rate for each gender/age group, while within each group, the mortality rates are allowed to differ with respect to the household income decile with relative mortality rates corresponding to the ones in Chetty et al. (Reference Chetty, Stepner, Abraham, Lin, Scuderi, Turner, Bergeron and Cutler2016). Details of the method are described in Appendix B.2.Footnote 15
• Discount rate. For the discount rate, we assume a rate that of
$\delta=3\%$. This follows the assumptions of and facilitates the comparison with the related literature (Bönke et al., Reference Bönke, Grabka, Schröder, Wolff and Zyska2019; Sabelhaus and Volz, Reference Sabelhaus and Volz2020). In Appendix C, we report the consequences of different assumptions about the discount rate.• Net pension benefits: The final element in equation (1) that is necessary to calculate total public pension entitlements
$\mathit{PE}_i$ is the stream of future disposable pension incomes
$P_i(x)$ (see equation (4)). These entitlements are determined by the specific regulations of the pension system, and it is here that one can observe a huge amount of cross-country diversity. For the calculations of the initial pension benefit, we need an assumption on the real growth rate (chosen as
$g=1.3\%$, a value that is in line with the assumptions made in European Commission (2021)) and an assumption on tax treatment. We use a net concept since in Austria contributions to the public pension system are exempt from taxation while the pensions payments are treated like earned income and are subject to income tax (for details see Appendix B.3). In the benchmark specification, we do not take survivor and minimum pensions into account. Also, we assume that all individuals will meet the conditions concerning the minimum insurance years that are necessary to be eligible for a pension.


5. Results
We begin by presenting estimates for the main aggregates (net wealth, pension entitlements, and augmented wealth) in Section 5.1 followed by socioeconomic breakdowns of the aggregate measures (Section 5.2) and the implications for distribution and wealth inequality (Section 5.3). In Section 5.4, we show how the benchmark results change under alternative specifications, particularly when different methods are used to calculate augmented wealth.
5.1. Aggregates and wealth composition
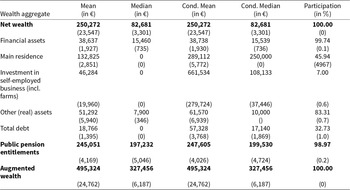
In this section, we present estimates for households’ net wealth (defined as the sum of real assets and financial assets minus total debt), total pension entitlements, and augmented wealth. The results for net wealth correspond to the figures reported in Fessler et al. (Reference Fessler, Lindner and Schürz2019) and are discussed there in detail. In Table 2, we only repeat some important measures for the sake of comparison with the novel results.Footnote 16 In particular, we show the unconditional means and medians, the fraction of households that holds a specific wealth component (last column), and finally the mean and median for this subsample of households (i.e., the conditional values). For net wealth, the conditional and unconditional measures coincide since every household holds some form of wealth (or liability).
Table 2. Aggregates and wealth composition

Note: This table shows statistics for various aggregates of households’ wealth and pension entitlements. The last column shows the percentage of households that have non-empty (but not necessarily positive) entries in the respective category. The conditional means and medians are the aggregate values for all households with non-empty observations. All statistics are based on imputed values. Bootstrapped standard errors using 1000 replica weights are shown in brackets.
The mean of household net wealth is approximately € 250,000, which is significantly higher than the median of around € 83,000. This is an indication of the unequal distribution of net wealth across households. Table 2 also shows that the main residence represents for many households the most important category of wealth (with a conditional mean value of € 289,000 which corresponds to 60% of the average net wealth of owners). Investment in unincorporated enterprises, by contrast, is held by only 7% of households, but the conditional mean among these is fairly high (€ 662,000). Financial assets and other (real) assets are less important for household net wealth and also average debt is rather low.
We turn now to the estimates for household (public) pension entitlements. For this, we added up the measures of the individual present values of pension entitlements that have been calculated from equation (1) under the assumptions specified above. We find that almost all household (around  $99\%$) either receive or can expect to receive a pensionFootnote 17 and that these (intangible) pension entitlements are substantial compared to the tangible measure of net wealth. In particular, the median is around € 200,000, which is more than twice the median of net wealth, while the mean is about € 245,000, which is only slightly below the mean value for net wealth.
Net wealth and pension entitlements can be combined to derive a measure of ‘augmented wealth’.Footnote 18 As discussed above, this is not innocuous since it adds two different (strictly spoken incommensurable) categories of wealth but it is a common practice in the related literature. The median comes out as around € 330,000, which is four times larger than the median of net wealth. The mean, on the other hand, is calculated as € 495,000, which is thus about twice as large as the mean for net wealth.
5.2. The influence of socio-economic characteristics on wealth and pension entitlements
In this section, we report the influence of various socio-economic characteristics on households’ pension entitlements. The breakdowns refer to the characteristics of the reference person according to the Canberra Group standard (seeOECD, 2013). The results are summarized in Table 3.Footnote 19
Table 3. Wealth and pension entitlements for socio-economic subgroups
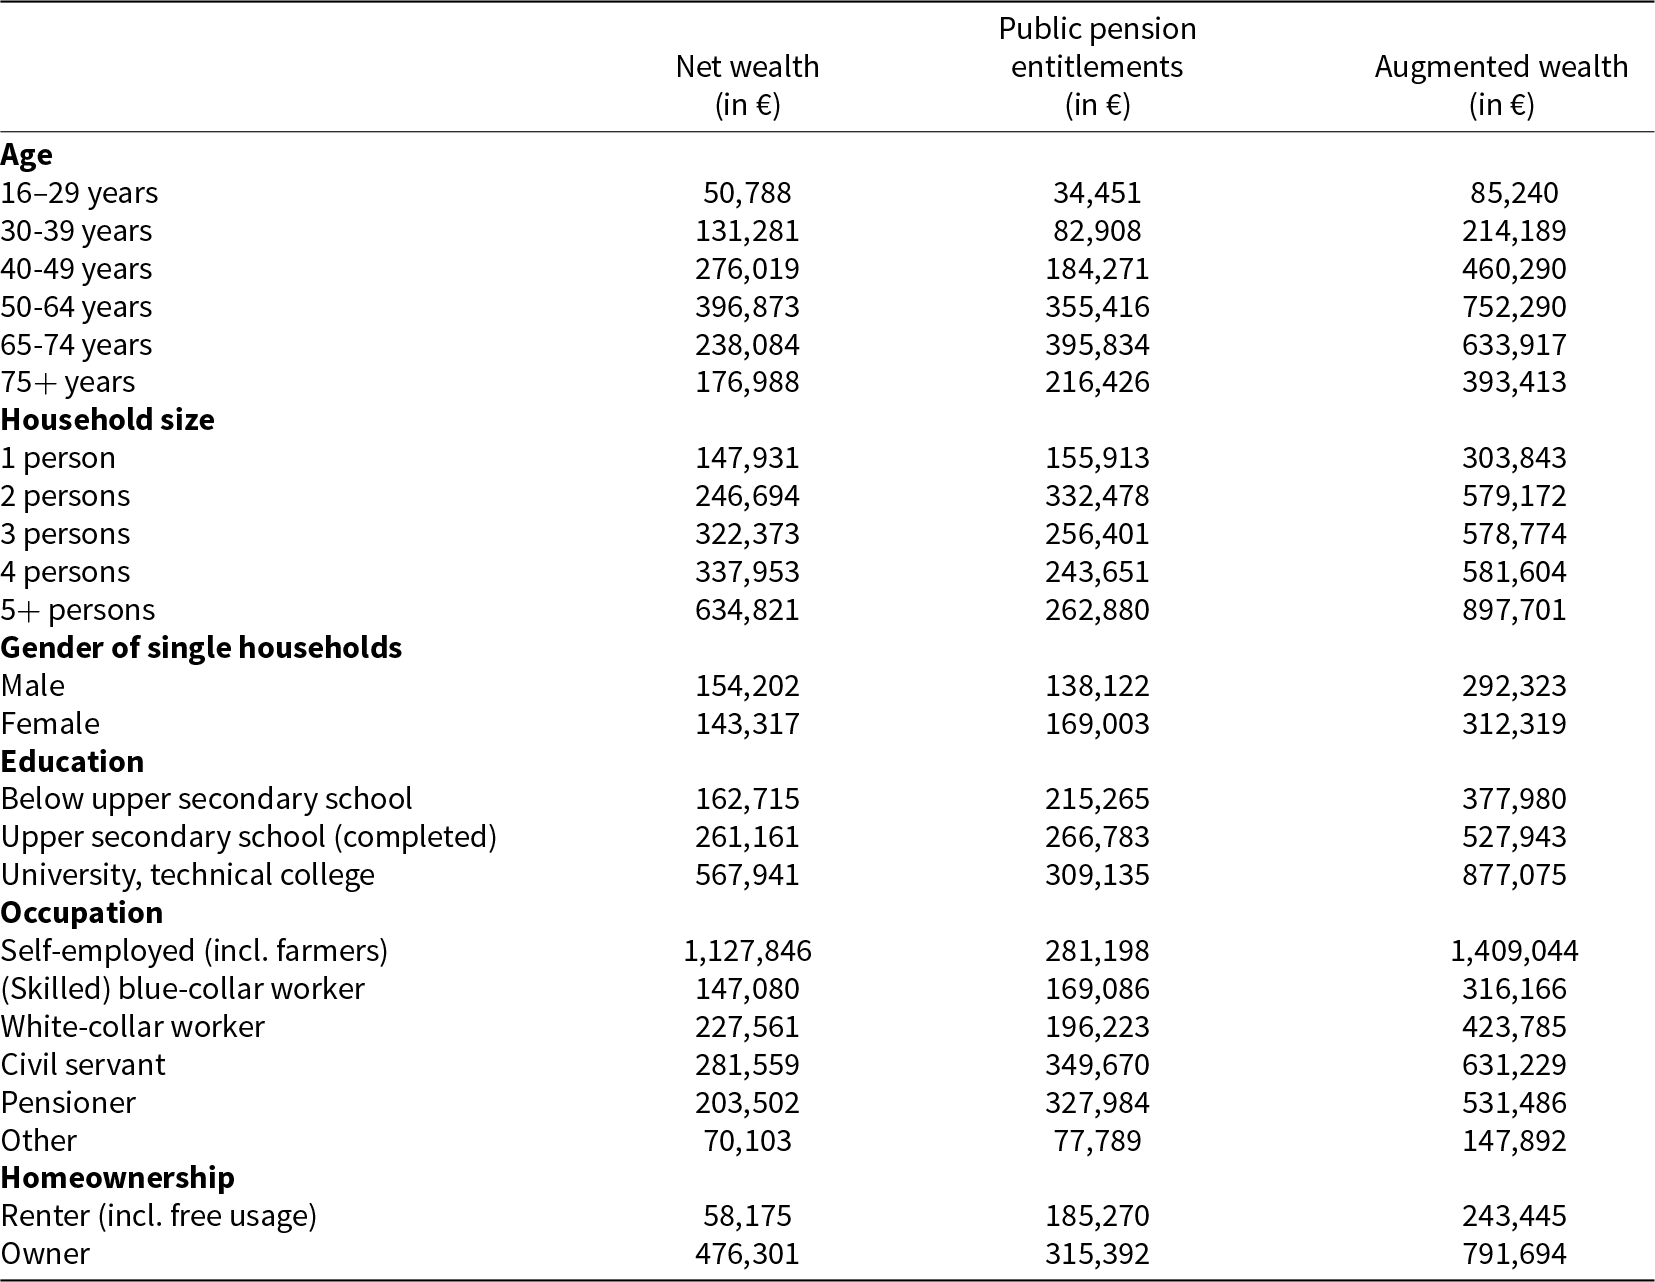
Note: This table shows the means of net wealth, public pension entitlements, and augmented wealth for various socio-economic subgroups. The subgroup always corresponds to the reference person (according to the Canberra Group standard). The category ‘Other’ for occupation includes a mixed group of subcategories ranging from unemployed and disabled to students and homemakers.
5.2.1. Age
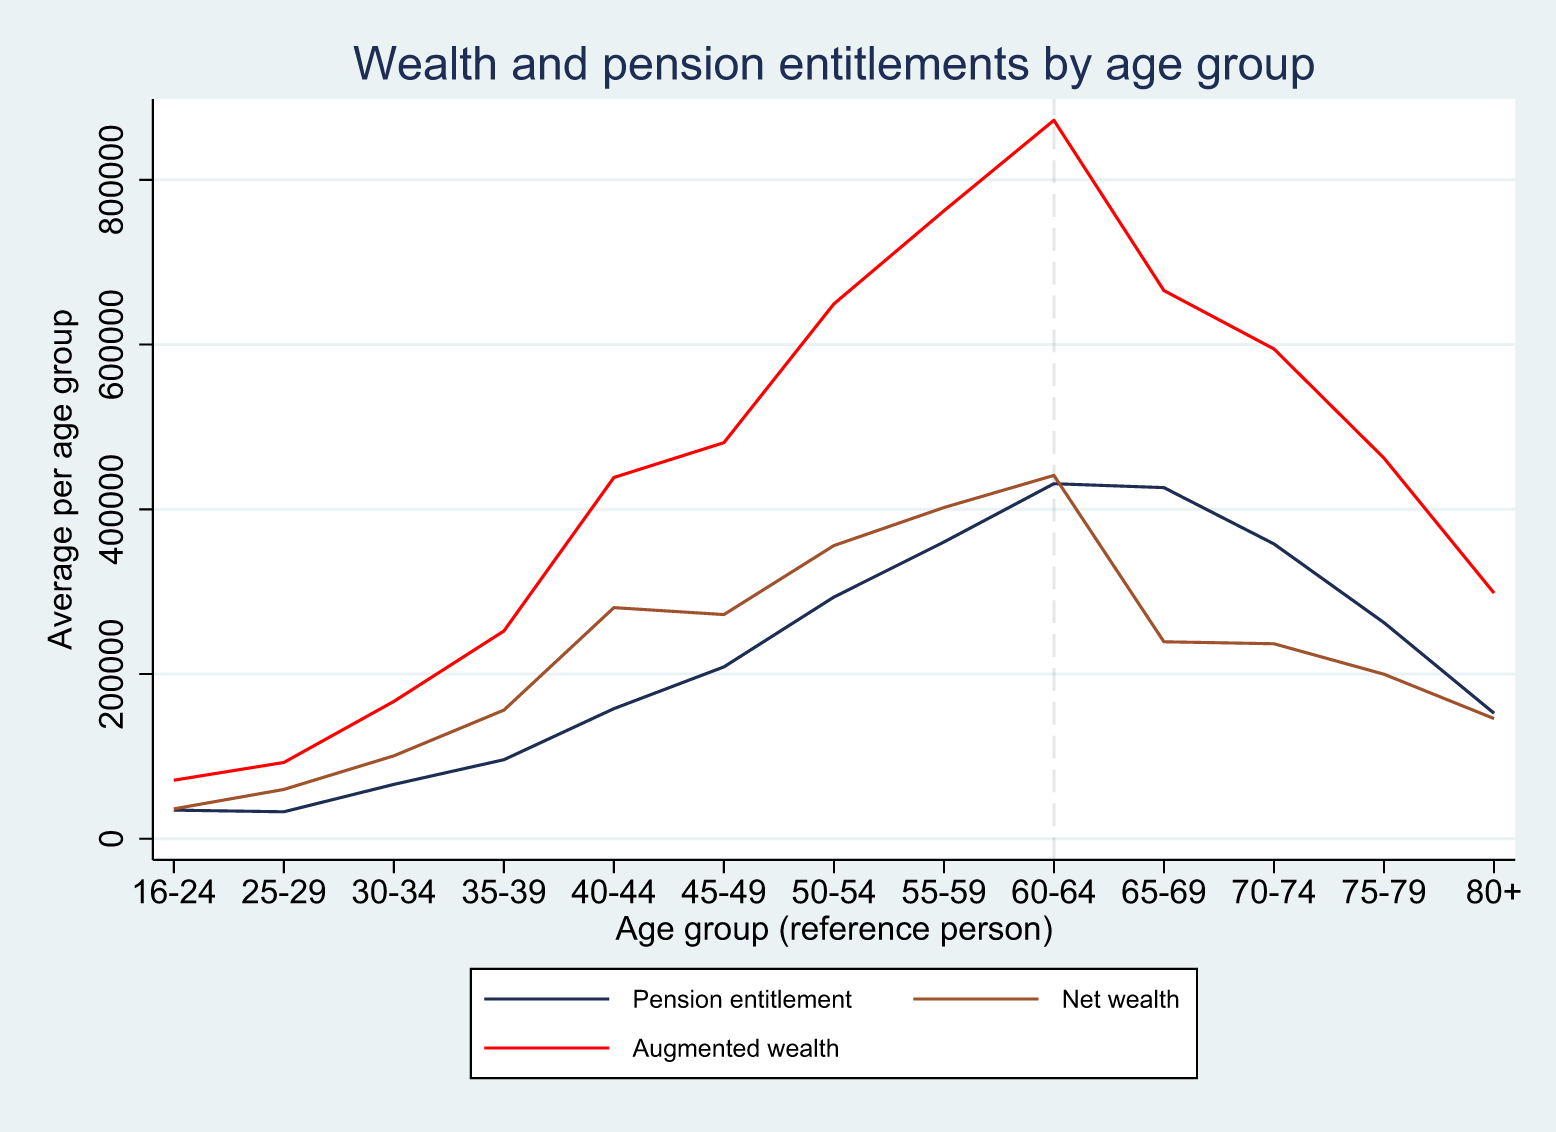
A first approach to look at pension entitlements in a disaggregated manner is by age group. Due to the basic principles of the Austrian pension system, one would expect to see a clear hump-shape pattern, that is, a steady increase of the value of pension entitlements up to the retirement age, followed by a constant decrease. As shown in the first subtable of Table 3 this conjecture is in fact (and not surprisingly) confirmed by the data. Pension entitlements increase up to the 65-74 age group and then decline. The age pattern is even better visible if we define smaller age groups as illustrated in Figure 1. Pension entitlements peak for the age group 60-64 with a value of around € 435,000 from which point on they decrease up to the age group  $80+$. Net wealth shows a similar pattern, though the hump shape is less pronounced and less smooth. It is also noticeable that net wealth stays positive even for old age groups. For augmented wealth, however, the hump is again better visible, and the peak is also for the age group 60-64.

Figure 1. The figure shows the average values for various age groups.
5.2.2. Household size
The variable household size measures the total number of people living in the household (including adults and children). Pension entitlements are largest for households of size two and smaller for larger household sizes as reported in the second subpanel of Table 3.
The reason for this is arguably that larger household sizes are associated with less full-time work of the (adult) household members. The lowest entitlements can be observed for single-person households. The pattern is somewhat different for net wealth, which seems to increase monotonically with household size. Interestingly, when adding pension entitlements and net wealth together, the resulting augmented wealth is almost identical for households of size 2, 3 or 4.
5.2.3. Gender
A breakdown by gender (for single households) reveals that females have higher pension entitlements than males, while for net wealth, the relation is reversed. One factor that contributes to this outcome is the fact that females have a longer life expectancy (which enters the calculation of pension entitlements).
5.2.4 Education
Table 3 also includes a breakdown by education. As is apparent from the second column, pension entitlements do not seem to differ strongly across educational categories. They amount to around € 215,000 for households for which the highest educational level of the reference person is below upper secondary school (‘Matura’). This value, however, is only about  $50\%$ higher for households with university degrees (€ 309,000). For net wealth, the educational divide is much higher and amounts to more than $300\%$. This finding is not surprising, given that in the pension formula, the longer contribution periods for working individuals without a tertiary (or secondary) education counterbalance their lower incomes.Footnote 20
5.2.5. Occupation
A similar pattern to the education breakdown emerges when examining occupational categories. The variation of pension entitlements across occupational categories is much smaller than with respect to net wealth. The entitlements are highest for pensioners and for civil servants, which does not come as a surprise. Pensioners have higher entitlements due to their older age, which is likely the strongest positive correlate of entitlements (see the first subpanel of Table 3 and Figure 1). The higher entitlements for civil servants are due to their higher average age and due to the fact that the legacy pension system promised higher pensions to civil servants. The difference between blue- and white-collar workers is again modest, mirroring the pattern observed in the education breakdown. The group of self-employed (which includes here the rather small group of farmers) stands out if one looks at net wealth (over one million euros), while their pension entitlements are less exceptional (around € 280,000).
5.2.6. Homeownership
Finally, we can also look at the difference between households that rent or that own their main residence. The difference in pension entitlements between owners and renters is pronounced, which is mainly due to the fact that the probability of homeownership is itself positively correlated with socio-economic characteristics that tend to go hand in hand with higher pension entitlements (like age, income, education, and household size). For renters, the value of pension entitlements amounts to € 185,000, which is about three times the value of net wealth (€ 58,000). For owners, the corresponding figures are € 315,000 (pension entitlements) and € 476,000 (net wealth).
5.3. Distribution
In the previous section, we have already discussed how pension entitlements differ across specific subgroups of the population. Now we turn to a discussion of the entire distribution.
5.3.1. Means by percentile
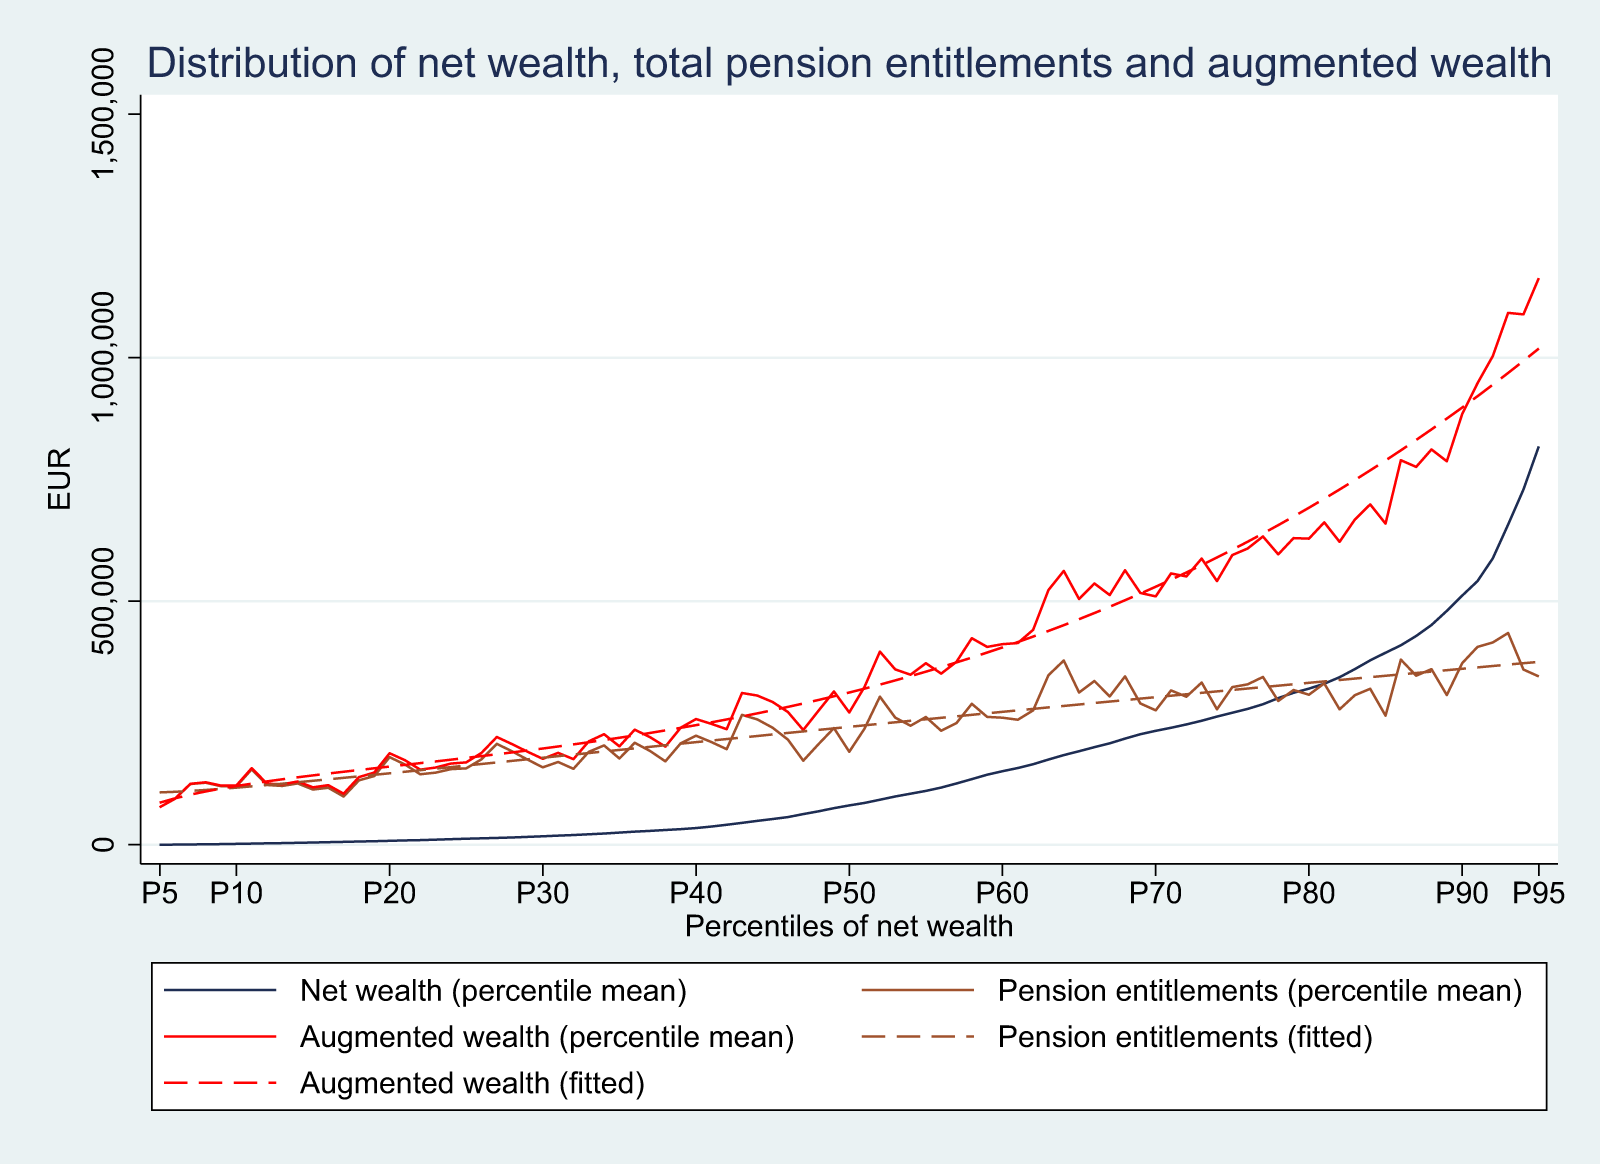
To gain a first impression of wealth inequalities, Figure 2 plots mean net wealth for each percentile (leaving out the bottom and top 5% of the wealth distribution due to measurement error, imputation uncertainty, and sampling limitations, as discussed in Fessler et al. (Reference Fessler, Lindner and Schürz2019)), that is, households are sorted in increasing order of their net wealth. The picture shows that more than 70% of households have less net wealth than the average of around € 250,000 and only 10% exceed a level of € 500,000. All households with a net wealth above one million are in the top 5% of the distribution (and thus not shown in Figure 2).

Figure 2. The figure shows the average values of pensions entitlements, net wealth, and augmented wealth for each percentile of net wealth, together with polynomial fitted curves for pensions entitlements and augmented wealth.
Figure 2 also shows the average value of pension entitlements for each percentile of net wealth. As one can see, the relation between pension entitlements and net wealth is somewhat rugged, and there does not appear to be a monotonic pattern. This might be a property of the underlying relation but – more likely – it is due to the fact that we only have around 3,000 households and that – in addition to this – we had to use statistical matching to assign each household a pension value. Nevertheless, as shown by the fitted curve in Figure 2 there exists a positive relation between net wealth and pension entitlements. While the household at the first decile has average pension entitlements of about € 120,000, the corresponding value for the ninth decile is around € 370,000. The reason for this positive relation is threefold: first, pension entitlements and net wealth both increase in age; second, both net wealth and pension entitlements are larger for households with a larger number of (adult) members; third, pension entitlements and net wealth are higher for people with larger (lifetime) incomes.Footnote 21 The same relation is also reflected in the pattern for augmented wealth that is shown in Figure 2 as well (together with the fitted curve). The value increases from about € 120,000 to about € 880,000 from the first to the ninth decile. At the lower end of the distribution, pension entitlements dominate, while they play a much smaller role at the upper end. This can also be illustrated by looking at the share of pension entitlements in augmented wealth for different subgroups. It comes out as an average share of 91% for the first decile and shrinks to 29% for the top decile. Also, there are only a small number of households (less than 1%) with negative augmented wealth, all in the first percentile (while the corresponding number of net wealth is 4.3%).
5.3.2. Inequality measures
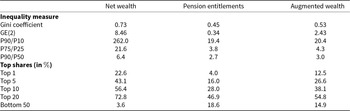
In Appendix B.4, we use the wealth percentiles to illustrate the extent of inequality in the form of Lorenz curves. In Table 4, we report a number of frequently used summary measures of wealth inequality that should be considered simultaneously in order to get an encompassing picture of the distribution.Footnote 22 Net wealth in Austria is distributed highly unequally with a Gini coefficient of 0.73, percentile ratios ranging from 262 (for 90/10) to 6.4 (for 90/50) and a share of 43% (23%) that is concentrated among the top 5% (1%) of households. For public pension entitlements, the inequality measures are lower across the board. Here, the Gini coefficient is only 0.45, the percentile ratios are reduced to 19.4 (for 90/10) and 2.7 (for 90/50) and the top 5% (1%) of households has 16% (4%) of pension entitlements. For the bottom 50%, however, the difference is less pronounced as it amounts to 3.6% for net wealth, 18.6% for pension entitlements and 14.9% of augmented wealth.Footnote 23 It should be noted, however, that the absence of oversampling of wealthy households in the survey is likely to lead to an overestimation of the impact of pension entitlements on inequality. Because high-wealth individuals are underrepresented, the role of private wealth in driving overall inequality may be underestimated, while the relative importance of public pension wealth appears inflated.
Table 4. Summary measures of wealth inequality

The distribution of (household) pension entitlements is to a certain degree a reflection of the distribution of (household) income. This is due to the fact that the Austrian pension system is ‘Bismarckian’ in the sense that pension entitlements closely follow the development of lifetime income. The Gini coefficient for household income amounts to 0.37, which is lower than the one for pension entitlements. This is because pension entitlements increase more sharply with age. If we only look at constant age groups, the Gini coefficient for the two magnitudes becomes more similar. For the households where the reference person is between 40 and 59 years of age, for example, the Gini coefficient for household income comes out as 0.34, which is only slightly below the one for the present value of pension entitlements, which amounts to 0.36. One has to bear in mind, however, that there exists a ceiling (an upper limit) for pension contributions and pari passu for pension entitlements.
5.4. Comparison to alternative methods for calculating augmented wealth
So far, we have looked at pension entitlements for the benchmark specification as described in Section 4.3. We have conducted a wide variety of robustness tests, part of which are contained in Appendix C. We show there, for example, that the main results concerning the size and the distribution of augmented wealth are not much affected if one uses homogeneous instead of heterogeneous life expectancy, the individually expected instead of the statutory retirement age, or if one also includes occupational pension benefits (on which, however, our information is sketchy). We also document there that the assumption of a higher discount rate ( $\delta=5\%$ instead of $\delta=3\%$) decreases the present value of pension entitlements by almost 25% (from € 245,000 to € 186,000). For a lower discount rate ( $\delta=1.3\%$), on the other hand, the estimate increases by almost 33%. For augmented wealth, these percentage changes are of course less pronounced, but still sizable (with $-12\%$ and $+16\%$, respectively). Also, the inequality measures are affected by the choice of the discount rate and the Gini coefficient, for example, increases by 5% (from 0.53 to 0.56) for the higher discount rate while it drops by 5% for the lower value of $\delta$ (from 0.53 to 0.50).
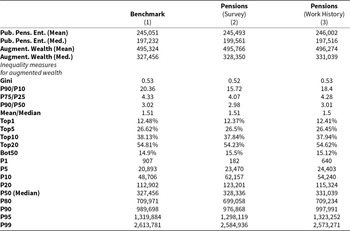
In this section, we want to focus, however, on a group of robustness exercises that might be of relevance and importance for future research in this field, especially in light of scarce or missing data. In particular, in Table 5, we analyze the impact of using different methods to estimate the expected pension benefits for the non-retired population. For the benchmark specification (underlying the results in column (1) of Table 5), we have used statistical matching to assign each person who is still participating in the labor market a ‘total pension credit’ (see Section 3.3).
Table 5. Alternative specifications (different pension calculation)
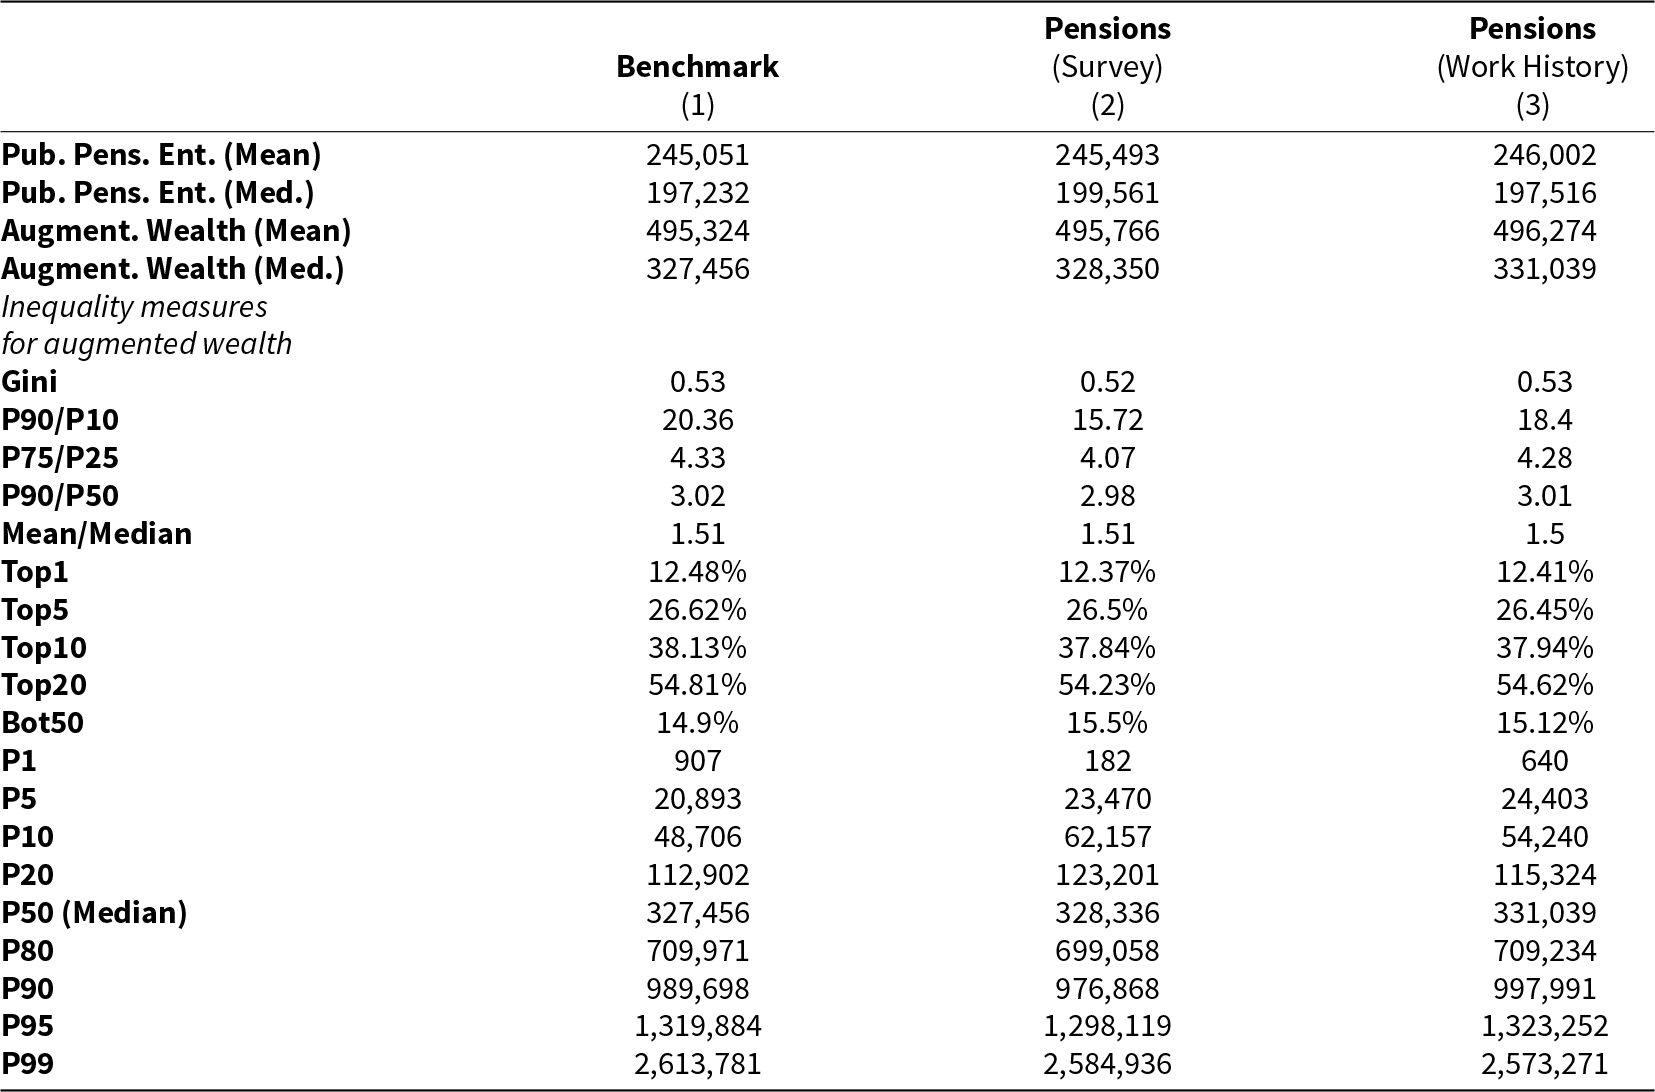
Note: The table shows aggregate and distributional results for different specifications of the pension parameters. The benchmark specification (cf. Tables 2 and 4) is in column (1). For columns (2) and (3), we use different measures for total pension credits (based on survey information and work history, respectively).
As a first alternative, shown in column (2) of Table 5, one could use a series of questions in the HFCS survey to come up with an estimation of future pension benefits. In particular, respondents have been asked first about whether they have received a pension account statement and second about the expected monthly pension that has been stipulated in this account statement. This is a more direct way to gain information about ‘total pension credits’ that have been accumulated in the pension account until 2016. In fact, at first sight, this seems to be the superior method to estimate expected pension payments since it is based on direct answers provided by the survey respondents and one does not need to resort to the less precise techniques of statistical matching. However, two issues limit the usefulness of this direct question as the main method. First, many respondents have not heard about the pension account model, did not or do not remember having received a pension account statement (which, e.g., is true for 30% of respondents), and/or cannot remember the exact amount specified there. Second, in case they do not provide information about the expected monthly pension stipulated in the account statement, the questionnaire asked the interviewers to encourage the respondents to come up with an estimation of ‘the expected monthly pension under the assumption that the occupational circumstances remain unchanged until retirement’.Footnote 24 This wording is problematic, as it prompts respondents to include future entitlements in their estimation (in line with the ‘ongoing concern’ approach) whereas ‘total pension credits’ only include entitlements accrued up to the present (‘accrual method’). Following the ongoing concern approach tends to increase expected pension payments. This seems to be confirmed in the data. The average annual pension payment amounts to € 11,300 when using our benchmark method (based on statistical matching), while it is higher at € 13,800 when using the survey answers. On the other hand, however, the difference is not so large as one would expect if all respondents who were ignorant about the account statement really used an estimation based on the ongoing concern method. In fact, if we distinguish between the respondents who gave direct answers about the account statement and the ones who provided their own estimates about future pension payments, the difference is also surprisingly low: € 13,400 for the first group and € 14,400 for the latter. All in all, there seems to be a good amount of confusion (both from the side of respondents and also in the questionnaire itself), which induced us to refrain from using this method as our main source of information about future pension entitlements.
As a second alternative method, one can use the very rudimentary information about ‘work history’ available in the HFCS survey to construct a measure for future pension entitlements. This is shown in column (3) of Table 5. We include this measure since the related literature (especially for the US, see Sabelhaus and Volz (Reference Sabelhaus and Volz2020) and Catherine et al. (Reference Catherine, Miller and Sarin2020)) often relies on a work-history approach to come up with estimations for pension entitlements. Due to lack of more extensive data our own measure is crude and only uses two variables: current income (from which we take 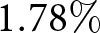 $1.78\%$ to calculate the annual pension credits) and the years of work.Footnote 25 Multiplying these two magnitudes gives us another rough estimate for total pension credits. The estimate is rough since it implicitly assumes that (real) income in previous years has been identical to the present income. This will most likely lead to an overestimation of total pension credits (since wage profiles typically increase with age). On the other hand, however, this calculation neglects all potentially higher, pre-reform pension entitlements which are captured in the real pension accounts via the ‘initial pension credits’. This neglect will tend to underestimate the true pension entitlements. If we look at the average value of our work-history calculations it comes out as € 12,500 which is surprisingly close to the benchmark value of € 11,300. The potential sources of over- and underestimation therefore appear to roughly offset each other. The correlation between the two measures is also rather high (0.8).Footnote 26
Comparing the results in columns (2) and (3) of Table 5 with the results of the benchmark specification in column (1) reveal that the impact of the alternative specifications are tiny. Differences in the aggregate measures for pension entitlements and augmented wealth are below 1% and also the Gini coefficients remain basically the same across all specifications. The lower part of the table shows that the use of survey measures (and to some extent also of work history) leads to higher estimated pension entitlements for the lower percentiles of the distribution, which is also reflected in somewhat lower values for the percentile ratios P90/10 and P75/25.
Overall, the benchmark estimation of public pension entitlements and augmented wealth holds up surprisingly well under alternative methods to calculate expected future pension benefits. The reason for this result lies in the strong income dependency of the Austrian pension system. Since pension entitlements are closely linked to lifetime earnings, income accrued up to a certain point serves as a reliable proxy for accrued pension claims – regardless of whether it is derived from explicit pension account statements, statistical matching, or approximated via work history. This result is reassuring for cross-country comparisons since these are often based on a wide variety of methodological approaches – at least in countries that follow the Bismarckian logic of earnings-related public pensions.
6. International comparison
In this section, we compare our results with existing international findings. As said before, the existing literature is not very large, and only one paper (Bönke et al., Reference Bönke, Grabka, Schröder and Wolff2020) provides a direct comparison of two countries – Germany and the US – based on comprehensive measures of public pension entitlements. Table 6 summarizes the key findings of the main studies in the relevant literature. In fact, to the best of our knowledge, this is an exhaustive list of all papers that have provided comprehensive estimations of augmented wealth (i.e., based on a representative sample of the entire – retired and active – population). There are three differences across the studies that have to be mentioned right at the beginning. First, two papers in the table (Rasner et al., Reference Rasner, Frick and Grabka2013; Bönke et al., Reference Bönke, Grabka, Schröder, Wolff and Zyska2019) refer to individual entitlements, and these results are thus not directly comparable to the household results. Second, the studies use data from different time periods (ranging from 2002 to 2018), and they are also stated in different currencies. It is therefore not reasonable to compare the absolute values of the estimates listed in Table 6. Third, the pension systems in different countries are highly specific, not only in terms of the size of the systems but also in the composition of (i) unfunded vs. funded, (ii) public, occupational, and private, (iii) income-related and unconditional (or means-tested) elements and (iv) the possibilities of withdrawal (lump-sum pay-out) of pensions funds before or at retirement. While in Germany and Austria, for example, the PAYG pension pillar is by far the most important source of old-age income, the systems in the US, Switzerland, and Australia are of a more mixed nature. We will therefore focus our comparison primarily on percentages (the share of public pension entitlements or total pension entitlements in augmented wealth) and on changes (in the Gini coefficient between net wealth and augmented wealth).
Table 6. Main results of the related literature
Note: The table contains results from the related literature involving other countries. The upper part of the table shows the main characteristics of the studies (country, time, unit, and currency). The second part reports crucial results of the papers. In particular, the mean and the Gini coefficient of net wealth (NW), of public pension entitlements (Pub. PE), of occupational pension entitlements (Occup. PE), and of augmented wealth (AW). The third part of the table contains shares and changes that allow for an easier comparison across studies. In particular, we show the relation of augmented wealth to net wealth (AW/NW), the share of pension entitlements in augmented wealth (Share PE), the share of public pension entitlements in augmented wealth (Share PPE) and the change in the Gini coefficient when moving from net wealth to augmented wealth ( $\Delta$ Gini).
The share of pension entitlements in augmented wealth lies around 50% for a majority of studies. It is exactly 50% for Switzerland, 48% for the US, and 49% for Austria. The values for Germany in Rasner et al. (Reference Rasner, Frick and Grabka2013) and Bönke et al. (Reference Bönke, Grabka, Schröder, Wolff and Zyska2019) are also close to 50% though these are based on individual-level data. The household value in Bönke et al. (Reference Bönke, Grabka, Schröder and Wolff2020) comes out as 61% and is thus the highest in our cross-country sample. Two studies stand out with significantly lower shares of pension entitlements in augmented wealth – 31% and 35% using Australian and Italian data, respectively. Both of these studies are, however, not directly comparable since they show methodological differences and do not include crucial parts of pension entitlements.Footnote 27 The varying importance of public and occupational pension schemes is also evident in the data for other countries. Occupational pensions are more important for Switzerland and the US (about half of the value of total pension entitlements) than for the other countries.
A similar pattern emerges across countries when examining the change in the Gini coefficient. The reduction is quite similar for Austria, Germany, and Switzerland (between 27% and 31%), slightly less for the US (21%) and considerably smaller for Italy and Australia. However, for the latter two countries, the previously mentioned caveats apply, and the underestimation of public pension entitlements likely also distorts the results for the change in the Gini coefficient.
In closing this section, we want to mention the studies by Cowell et al. (Reference Cowell, Nolan, Olivera, Van Kerm, Hamilton and Hepburn2017) and Wroński (Reference Wroński2023). These papers seem closely related since they also use data from the HFCS and include results for Austria. The key difference, however, is that both focus exclusively on elderly households – Cowell et al. (Reference Cowell, Nolan, Olivera, Van Kerm, Hamilton and Hepburn2017) on households whose reference person is aged 65-84 and Wroński (Reference Wroński2023) on households in which all members already receive public pensions. The data are thus not directly comparable to our results. Cowell et al. (Reference Cowell, Nolan, Olivera, Van Kerm, Hamilton and Hepburn2017) report for Austria a Gini coefficient of 0.7 for net wealth and one of 0.45 if one includes public pension entitlements – a change of 36%, which is somewhat larger than our reduction of 28%. The findings in Wroński (Reference Wroński2023) are similar with a Gini coefficient of 0.67 for net wealth and one of 0.39 for augmented wealth – a drop of 42% (actually the largest drop of all countries considered).
7. Conclusions
In this study, we used data from the HFCS and the social security registry to estimate the present value of public pension entitlements in Austria for the year 2017. We found that the value of these entitlements is about the same size as the private net wealth (both amounting to a household average of around € 250,000), which is in line with the results for other countries like Switzerland, Germany, and the US. Because most households receive pensions or hold pension claims – and because these entitlements are more evenly distributed than other assets – most inequality measures for augmented wealth are lower than for net wealth. The Gini coefficient for Austria, for example, decreases from 0.73 (for net wealth) to 0.53 (for augmented wealth) which is again fairly similar to the results for other countries. The calculation of the benchmark results has been based on various assumptions and we have also studied alternative specifications in order to assess the robustness of these results. We found, for example, that different methods for calculating pension entitlements – whether through statistical matching or survey-based information on present values or work histories – yield almost identical results. This is good news for cross-country comparisons since these are often based on different methodological approaches.
The international comparisons have shown that the results for Austria conform nicely to the existing evidence, in particular to the comparable data for Germany, Switzerland, and the US. Observed differences across countries can largely be attributed to structural differences in their pension systems.
Supplementary material
The supplementary material for this article can be found at https://doi.org/10.1017/S1474747225100115.
Acknowledgements
We are grateful to Robert Holzmann, Ursina Kuhn, and two anonymous referees for a number of detailed and highly useful remarks. The views expressed in the study do not necessarily reflect those of the Oesterreichische Nationalbank or the Eurosystem.


 Open access